
Related Manuals for Renesas SH-4A


Summary of Contents for Renesas SH-4A
- Page 1 REJ10B0137-0600 SH-4A, SH4AL-DSP E200F Emulator User’s Manual Renesas Microcomputer Development Environment System SH-4A, SH4AL-DSP E200F R0E0200F0EMU00E Rev.6.00 Revision Date: Jul. 25, 2007...
- Page 3 Please be sure to implement safety measures to guard against the possibility of physical injury, and injury or damage caused by fire in the event of the failure of a Renesas product, such as safety design for hardware and software including but not limited to redundancy, fire control and malfunction prevention, appropriate treatment for aging degradation or any other applicable measures.
- Page 5 Improvement Policy: Renesas Technology Corp. (including its subsidiaries, hereafter collectively referred to as Renesas) pursues a policy of continuing improvement in design, performance, and safety of the emulator product. Renesas reserves the right to change, wholly or partially, the specifications,...
- Page 6 2. In no event shall Renesas Solutions Corporation be liable for any consequence arising from the use of this emulator.
- Page 7 Renesas, upon inspection, shall determine to be defective in material and/or workmanship. The foregoing shall constitute the sole remedy for any breach of Renesas’ warranty. See the Renesas warranty booklet for details on the warranty period. This warranty extends only to you, the original Purchaser.
- Page 8 3. This user's manual and emulator product are copyrighted and all rights are reserved by Renesas. No part of this user's manual, all or part, may be reproduced or duplicated in any form, in hard-copy or machine-readable form, by any means available without Renesas’ prior written consent.
- Page 9 SAFETY PAGE READ FIRST • READ this user's manual before using this emulator product. • KEEP the user's manual handy for future reference. Do not attempt to use the emulator product until you fully understand its mechanism. DEFINITION OF SIGNAL WORDS Either in the user's manual or on the product, several icons are used to insure proper handling of this product and also to prevent injuries to you or other persons, or damage to your properties.
- Page 10 means WARNING or CAUTION. Example: CAUTION AGAINST AN ELECTRIC SHOCK means PROHIBITION. Example: DISASSEMBLY PROHIBITED means A FORCIBLE ACTION. Example: UNPLUG THE POWER CABLE FROM THE RECEPTACLE.
- Page 11 WARNING Warnings for AC Power Supply: • If the attached AC power cable does not fit the receptacle, do not alter the AC power cable and do not plug it forcibly. Failure to comply may cause electric shock and/or fire. •...
- Page 12 WARNING • If you smell a strange odor, hear an unusual sound, or see smoke coming from this product, then disconnect power immediately by unplugging the AC power cable from the outlet. Do not use this as it is because of the danger of electric shock and/or fire.
- Page 13 CAUTION Cautions for AC Adapter: • Use only the AC adapter included in this product package. • The included AC adapter is for this emulator. Do not use it for other product. • The DC plug on the included AC adapter has the below polarity.
- Page 15 Introduction The High-performance Embedded Workshop is a powerful development environment for embedded applications targeted at Renesas microcontrollers. The main features are: • A configurable build engine that allows you to set-up compiler, assembler and linker options via an easy to use interface.
- Page 16 About This Manual This manual describes preparation before using the emulator, emulator functions, debugging functions specific to the emulator, tutorial, and emulator’s hardware and software specifications. Refer to the High-performance Embedded Workshop User’s Manual for details on the information on the basic usage of the High-performance Embedded Workshop, customization of the environment, build functions, and debugging functions common to each High-performance Embedded Workshop product.
- Page 17 Without user registration, you will not be able to receive maintenance services such as a notification of field changes or trouble information. So be sure to carry out the user registration. For more information about user registration, send an email to the following address. regist_tool@renesas.com...
-
Page 19: Table Of Contents
Contents Section 1 Product Overview ................1 1.1 Components ......................... 5 1.2 Emulator Hardware Configuration ..................6 1.3 Emulator Functions......................20 1.3.1 Overview........................ 20 1.3.2 Event Detection Functions ..................24 1.3.3 Trace Functions...................... 27 1.3.4 Break Function....................... 35 1.3.5 Probe Function ....................... 36 1.3.6 Peripheral I/O Analyzer Functions................. - Page 20 Section 3 Hardware Specifications..............83 3.1 List of Specifications ......................83 3.2 Interface Circuits in the Emulator..................83 3.3 Reducing EMI Noise ......................88 3.4 Diagnostic Procedure......................89 3.4.1 Installing the Diagnostic Program................89 3.4.2 Executing the Diagnostic Program................. 89 3.4.3 Creating a Log File ....................93 Section 4 Preparations for Debugging...............95 4.1 System Check ........................
- Page 21 5.2.5 Viewing a Specific Address................. 156 5.2.6 Viewing the Current Program Counter Address ..........156 Displaying Memory Contents in Realtime................ 157 5.3.1 Opening the [Monitor] Window................158 5.3.2 Changing the Monitor Settings ................160 5.3.3 Temporarily Stopping Update of the Monitor............161 5.3.4 Deleting the Monitor Settings ................
- Page 22 5.7.11 Analyzing Statistical Information ................ 242 5.7.12 Extracting Function Calls from the Acquired Trace Information ......244 Analyzing Performance ....................245 5.8.1 Opening the [Onchip Performance Analysis] Window ........245 5.8.2 Opening the [AUD Performance Analysis] Window........... 247 5.8.3 Opening the [BUS Performance Analysis] Window ........... 250 5.8.4 Hiding the Column ....................
- Page 23 5.11.10 [Confirmation Request] Dialog Box ..............288 5.11.11 Displaying Code Coverage Information in the [Editor] Window ......290 5.12 Synchronizing Multiple Debugging Platforms ..............291 5.12.1 Distinguishing Two Emulators ................292 Section 6 Tutorial....................295 6.1 Introduction ......................... 295 6.2 Running the High-performance Embedded Workshop............296 6.3 Setting up the Emulator .......................
- Page 24 Section 7 Troubleshooting.................369 Section 8 Maintenance and Guarantee ..............371 User Registration ......................371 Maintenance........................371 Guarantee.......................... 371 Repair Provisions......................372 8.4.1 Repair with Extra-Charge ..................372 8.4.2 Replacement with Extra-Charge ................372 8.4.3 Expiration of the Repair Period ................372 8.4.4 Transportation Fees at Sending Your Product for Repair ........
-
Page 25: Section 1 Product Overview
C/C++ programming languages or assembly language for Renesas microcomputers. Its aim is to provide a powerful yet intuitive way of accessing, observing and modifying the debugging platform on which the application is running. - Page 26 Figures 1.1 and 1.2 show the system configuration using two types of emulators, R0E0200F0EMU00 and R0E0200F2EMU00, respectively. Figure 1.1 System Configuration with the Emulator (R0E0200F0EMU00) Note: The H-UDI is an interface compatible with the Joint Test Action Group (JTAG) specifications.
- Page 27 Figure 1.2 System Configuration with the Emulator (R0E0200F2EMU00)
- Page 28 The emulator provides the following features: • Various debugging functions ⎯ Various break and trace functions enable efficient debugging. Breakpoints and break conditions can be set by the specific window, and trace information can be displayed on a window. In addition, various emulation functions, such as performance and profiling functions, are provided.
-
Page 29: Components
Check that all of the components are present when unpacking the product. For details on the emulator components, refer to section 1.1 in the additional document, Supplementary Information on Using the SHxxxx. If all of the components are not present, contact your nearest Renesas sales office. -
Page 30: Emulator Hardware Configuration
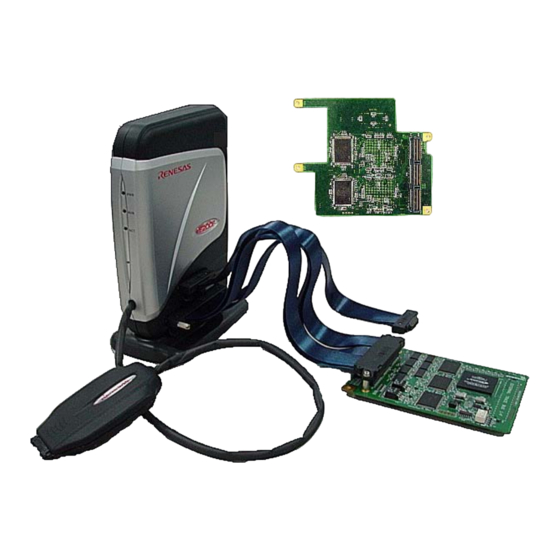
1.2 Emulator Hardware Configuration As shown in figure 1.3, the emulator (R0E0200F0EMU00) consists of a main unit case, a trace unit (optional), an expansion profiling unit, a USB cable, an AC adapter, an external probe, and an peripheral I/O analyzer unit (optional). The emulator is connected to the host machine via USB 2.0. - Page 31 Figure 1.4 Emulator Hardware Configuration (R0E0200F2EMU00)
- Page 32 The names of each section of the emulator are explained next. Emulator Front View: Figure 1.5 Emulator Front View (a) POWER LED: Marked ‘PWR’. When this LED is lit, the emulator is supplied with power. (b) RUN LED: Marked ‘RUN’. When this LED is lit, the user program is in operation. (c) ACTION LED: Marked ‘ACT’.
- Page 33 Emulator Rear-side View: Figure 1.6 Emulator Rear-side View (a) Power switch: Marked ‘POWER’. Turning this switch to I (input) turns the emulator on and O (output) turns the emulator off. (b) DC plug: Marked ‘DC IN’. This is a connector to input DC (+12 V) of the AC adapter.
- Page 34 Emulator Right-side View: Figure 1.7 Emulator Right-side View (a) E200F logo plate: A navy-blue plate (R0E0200F0EMU00) or a silver-and-red plate (R0E0200F2EMU00) dedicated for the emulator is provided to be easily distinguished from other E200F main unit case. (b) Peripheral I/O analyzer Marked ‘ANALYZER I/F’.
- Page 35 Emulator Left-side View: Figure 1.8 Emulator Left-side View (a) Label for product The serial number, revision, and safety standard, etc. of the management: emulator are written to. The contents differ depending on the time when you purchased the product.
- Page 36 36-pin Probe Head Upper View (R0E0200F0EMU00): Figure 1.9 36-pin Probe Head Upper View (R0E0200F0EMU00) (a) Screws for fastening the These screws fasten the user system and the probe head. probe head:...
- Page 37 36-pin Probe Head Front View (R0E0200F0EMU00): Figure 1.10 36-pin Probe Head Front View (R0E0200F0EMU00) (a) H-UDI port connector This connector is used when the emulator is used as the on-chip (36 pins) for user system: debugger (the same as that of the 36-pin E10A-USB).
- Page 38 38-pin Probe Head Upper View (R0E0200F2EMU00): Figure 1.11 38-pin Probe Head Upper View (R0E0200F2EMU00)
- Page 39 38-pin Probe Head Front View (R0E0200F2EMU00): Figure 1.12 38-pin Probe Head Front View (R0E0200F2EMU00) (a) H-UDI port connector This connector is used when the emulator is used as the on-chip (38 pins) for user system: debugger (the same as that of the 38-pin E10A-USB).
- Page 40 Storing the Probe Head: Figure 1.13 Storing the Probe Head (R0E0200F0EMU00) (a) Base unit for placing the A base unit when the emulator is placed vertically. The probe head emulator vertically: can be stored when the emulator is not in use.
- Page 41 Trace Unit (Optional) Upper View: Figure 1.14 Trace Unit (Optional) Upper View (a) Trace cable connectors: Connectors for connecting the trace cable in the trace board. Be sure to use the provided trace cable.
- Page 42 Trace Unit (Optional) Rear View: Figure 1.15 Trace Unit (Optional) Rear View (a) User interface connectors Connectors for the user interface of the external bus trace. They for the external bus trace: are connected to the dedicated connector on the user system.
- Page 43 Expansion Profiling Unit (Optional) Rear View: Figure 1.16 Expansion Profiling Unit (Optional) Rear View (a) Optional connectors in the Connectors for the interface to connect the expansion profiling expansion profiling unit: unit and the main unit case. They are connected to the optional connector on the main unit case.
-
Page 44: Emulator Functions
1.3 Emulator Functions This section describes the emulator functions. They differ according to the device supported by the emulator. For the usage of each function, refer to section 5, Debugging, and section 6, Tutorial. 1.3.1 Overview Table 1.1 gives a functional overview of the emulator. For details on the functions of each product, refer to the online help. - Page 45 Table 1.1 Emulator Functions Item Function • User program execution Executes a program with the operating frequency within a function range guaranteed by devices. • Reset emulation • Step functions: Single step (one step: one instruction) Source-level step (one step: one-line source) Step over (a break did not occur in a subroutine) Step out (when the PC points to a location within a subroutine, execution continues until it returns to the calling...
- Page 46 Table 1.1 Emulator Functions (cont) Item Function • Break functions Breaks at satisfaction of a PC breakpoint condition (1000 points) • Breaks at on-chip event detection • Breaks at AUD event detection • Breaks at external-bus event detection • Breaks at other types of event detection •...
- Page 47 5, I/O File Format, in the High-performance Embedded Workshop V.4.00 User’s Manual. The following directory contains [SHxxxx.io] (xxxx means the core name.): <High-performance Embedded Workshop folder>: \Tools\Renesas\DebugComp\Platform\E200F\xxxx\IOFiles The specific functions of the emulator are described in the next section.
-
Page 48: Event Detection Functions
1.3.2 Event Detection Functions The emulator has complex event detection functions in addition to the standard PC breakpoints of the High-performance Embedded Workshop. (1) Events In most practical debugging applications, the program or hardware errors that you are trying to debug occur under a certain restricted set of circumstances. - Page 49 For an operation when an event is detected, break, internal trace acquisition/acquisition start/acquisition stop, or internal performance measurement start/end can be specified. This function can be set in the [Onchip Event] sheet of the [Event] window. (b) AUD event function (AUD Event) This is a function that sets eventpoints according to the information output from the AUD interface.
- Page 50 For an operation when an event has been detected, a break or external bus trace acquisition/acquisition start/acquisition stop can be specified. This function can be set in the [BUS Event] sheet of the [Event] window. Notes: 1. When a break is generated by detecting the external bus event, there is a delay of several cycles from the time of detection to the break.
-
Page 51: Trace Functions
1.3.3 Trace Functions (1) Trace Functions The emulator has mainly two trace functions: • A function that acquires information within the MPU such as the CPU or system bus by a trace • A function that acquires information outside the MPU such as the external bus by a trace (a) Function to acquire information within the MPU by a trace The acquired trace information is displayed in the [Internal/AUD/Usermemory trace] window. - Page 52 Expanded function 2: The AUD trace acquisition, acquisition start, and acquisition end can be controlled depending on the specified AUD eventpoint condition and external-probe eventpoint condition. For setting eventpoints, refer to section 5.6, Using the Eventpoints. Note: The contents that can be acquired by a trace differ according to the product. For details on the specifications of each product, refer to the online help.
- Page 53 Branch Trace Functions: The branch source and destination addresses, their source lines, branch types, and types of accessed bus masters are displayed. [Setting Method] Select the check box in the [Branch] group box in the [Branch trace] page of the [Branch trace] dialog box that opens by double-clicking on the Ch12 (Branch) column of the [Event] window.
- Page 54 Range Memory Access Trace Functions: The memory access within the specified range is acquired by a trace. The read cycle, write cycle, or read/write cycle can be selected as the bus type, ASID value, or bus cycle for trace acquisition. [Setting Method] To open the [Event condition 5] or [Event condition 6] dialog box, double-click on the Ch5 (OA) or Ch6 (OA) column of the [Event] window.
- Page 55 (i) Open the [ASID] page, remove the check mark of the [Don’t care] check box, and enter the ASID value to be set. When the ASID value is not set as a condition, do not remove the check mark of the [Don’t care] check box.
- Page 56 Note: This function can be supported with SHC/C++ compiler (manufactured by Renesas Technology Corp.; including OEM and bundle products) V6.0 or later. However, SHC/C++ compiler (including OEM and bundle products) V8.0 or later is needed when instructions other than those compatible with SH4 are output.
- Page 57 • PPC: Output from a performance counter • Instruction, Source, Label: Displays the mnemonic of the instruction at the trace acquisition address, along with the corresponding source code and label information. Double-clicking on the [Source] column moves the cursor to the corresponding position in the [Editor] window.
- Page 58 The external bus trace acquisition, acquisition start, and acquisition end can be controlled depending on the specified external-bus eventpoint condition. For setting eventpoints, refer to section 5.6, Using the Eventpoints. With this function, information of a maximum of 262,144 cycles can be acquired in each bus cycle.
-
Page 59: Break Function
1.3.4 Break Function The emulator has the following seven break functions. (1) PC break function (BREAKPOINT) Breaks the program at the specified address by replacing the dedicated instruction onto the original instruction. This function cannot be set at a place other than RAM since a memory write occurs. -
Page 60: Probe Function
Breaks when the specified event has been detected by other event detection functions. This function is available when the operation after detecting an event is set as ‘break’ in the [Other Event] sheet of the [Event] window. (6) Trace break function Breaks when the AUD trace buffer and external bus trace buffer in the emulator become full. -
Page 61: Performance Measurement Function
1.3.7 Performance Measurement Function The emulator has five types of performance measurement functions. (1) On-chip Performance Analysis Function (Onchip Performance Analysis) This function applies a counter in the device to measure the number of cycles from one specified condition being satisfied until a next specified condition is satisfied. Not only the number of cycles but also various items such as the number of cache misses or of TLB misses can be measured according to the supported devices. - Page 62 Figure 1.20 [Performance Analysis] Dialog Box Note: For the command line syntax, refer to the online help.
- Page 63 • Specifying the measurement start/end conditions Set the performance measurement conditions in the [Action] page after conditions have been set in the [Event Condition] dialog box that is opened by double-clicking Ch1 to Ch6 and Ch8 to Ch12 on the [Onchip Event] sheet of the [Event] window. Notes: 1.
- Page 64 Figure 1.21 [Action] Page Note: PA1 or PA2 cannot be set for Ch8 and Ch9. • Measurement tolerance ⎯ The measured value includes tolerance. ⎯ Tolerance will be generated before or after a break. For details, see table 1.6.
- Page 65 • Measurement items Items are measured in the [Performance Analysis] dialog box for each channel from Ch1 to Ch4. A maximum of four conditions can be specified at the same time. Table 1.4 shows the measurement items. (Options in table 1.4 are parameters for <mode> of the PERFORMANCE_SET command.
- Page 66 Table 1.4 Measurement Items Classification Type Measurement Item Option Note Disabled None Not measured. Cycle Elapsed cycles Except for power-on period; performance counted by the CPU clock. Cycles executed in The number of privileged- privileged mode mode cycles among the number of elapsed cycles.
- Page 67 Table 1.4 Measurement Items (cont) Classification Type Measurement Item Option Note Stalled Cycles stalled in full- All items are counted performance cycle trace mode (with independently. (cont) multi-counts) Cycles stalled in full- This item is not counted if the trace mode (without stall cycle is generated multi-counts) simultaneously with a stall...
- Page 68 Table 1.4 Measurement Items (cont) Classification Type Measurement Item Option Note Instruction bus Instruction Number of The number of cache misses performance (cont) instruction cache by an instruction cache access (cont) miss (the number of accesses to the outside of the CPU core due to a cache miss).
- Page 69 Table 1.4 Measurement Items (cont) Classification Type Measurement Item Option Note Operand bus Access Number of internal- The number of accesses to XY performance count (cont) RAM access for memory in the MPU during (cont) operand fetch memory access (read) of an (READ) (XY-RAM or operand.
- Page 70 Table 1.4 Measurement Items (cont) Classification Type Measurement Item Option Note Operand bus Access Number of operand The number of cache misses by performance miss count cache miss (WRITE) an operand cache access (write) (cont) (cont) (number of accesses to the outside of the CPU core due to a cache miss).
- Page 71 Table 1.4 Measurement Items (cont) Classification Type Measurement Item Option Note System bus System bus Number of requests The number of valid bus cycles performance (cells) is counted by the system (only available bus clock. for Ch3 and Ch4) Number of The number of valid bus cycles responses (cells) is counted by the system...
- Page 72 Table 1.5 shows the measurement items and methods that are mainly used. Table 1.5 Main Measurement Items Main Measurement Item Measurement Method Elapsed time Number of elapsed cycles x CPU clock cycles Number of execution instructions Number of valid instructions issued + number of cases of simultaneous execution of two instructions Number of interrupts accepted Number of exceptions accepted...
- Page 73 Each measurement condition is also counted when conditions in table 1.6 are generated. Table 1.6 Performance Measurement Conditions to be Counted Measurement Condition Notes No caching due to the Counted for accessing the cacheable area. settings of TLB cacheable Cache-on counting Accessing the non-cacheable area is counted less than the actual number of cycles and counts.
- Page 74 (2) AUD Performance Analysis Function (AUD Performance Analysis) The emulator allows you to measure the time or count of execution between specified events in the AUD event detection system. It is possible to set the resolution of the timer to any of the following values: 20 ns, 40 ns, 100 ns, or 400 ns.
-
Page 75: Coverage Function
(5) Realtime Profiling Function (Realtime Profile) The performance of each function can be measured within the specified address range. A function having low performance can be easily found if the statistics of the time for each function are monitored. In this function, performance information is collected without break. Therefore, realtime emulation of the user program will be performed. -
Page 76: Memory Access Functions
1.3.9 Memory Access Functions The emulator has the following memory access functions. (1) Memory read/write function [Memory] window: The memory contents are displayed in the window. Only the amount specified when the [Memory] window is opened can be read. Since there is no cache in the emulator, read cycles are always generated. - Page 77 (6) Monitoring function The emulator monitors a value in the area that has been accessed without suspending the execution of program and displays it on the window. The virtual address that has been accessed by the CPU can be only monitored. (7) Emulation memory function The emulator allocates the memory for emulation in the CS0 area.
-
Page 78: Stack Trace Function
area. When the memory area can be read by the MMU, do not perform memory write, BREAKPOINT setting, or downloading. Cache operation during user program break: When cache is enabled in the device incorporating a cache, the emulator accesses the memory by the following methods: •... -
Page 79: Environmental Conditions
Environmental Conditions CAUTION Observe the conditions listed in tables 1.7 and 1.8 when using the emulator. Failure to do so will cause illegal operation in the user system, the emulator product, and the user program. Table 1.7 Environmental Conditions Item Specifications Temperature Operating: +10°C to +35°C... - Page 80 Table 1.8 lists the acceptable operating environments. Table 1.8 Operating Environments Item Description ® Host machine Built-in Pentium III or higher-performance CPU (1 GHz or higher recommended); IBM PC or compatible machine with USB 1.1/2.0 (Full- Speed). ® ® Operating system Windows 2000 or Windows Minimum memory...
-
Page 81: Section 2 Setting Up The Emulator
Section 2 Setting Up the Emulator 2.1 Flow Chart before Using the Emulator Unpack the emulator and prepare it for use as follows: WARNING READ the reference sections shaded in figure 2.1 before using the emulator product. Incorrect operation will damage the user system and the emulator product. -
Page 82: Installing Debugger
2.2 Installing Debugger 2.2.1 CD-R The root directory of the CD-R contains a setup program for installing the emulator’s software. The folders contain the files and programs listed below. Table 2.1 Contents of the CD-R Directories Directory Name Contents Description ®... -
Page 83: Connecting The Optional Units To The Emulator Main Unit Case
2.3 Connecting the Optional Units to the Emulator Main Unit Case Optional units are included in the emulator. This section describes how to connect them to the E200F main unit case. 2.3.1 Connecting the E200F Trace Unit to the User System •... - Page 84 • Connect the trace unit to the trace cable (CN1 side). Figure 2.3 Connecting the Trace Cable to the Trace Unit...
- Page 85 • After checking the location of pin 1, connect the user system to the trace unit. Figure 2.4 Connecting the User System to the Trace Unit CAUTION Check the location of pin 1 before connecting. Notes: Connection of the signals differs depending on the MPU used. To connect the signals to the user system, refer to the additional document, Supplementary Information on Using the SHxxxx.
-
Page 86: Connecting The E200F Peripheral I/O Analyzer Unit To The User System
2.3.2 Connecting the E200F Peripheral I/O Analyzer Unit to the User System Figure 2.5 Connecting the Analyzer Cable to E200F when Using the Peripheral I/O Analyzer Unit CAUTION Check the location of pin 1 before connecting. Notes: Connection of the signals differs depending on the peripheral I/O analyzer unit. To connect the signals to the user system, refer to the additional document, Supplementary Information on Using the SHxxxx. -
Page 87: Connecting The E200F Expansion Profiling Unit To The Main Unit Case
2.3.3 Connecting the E200F Expansion Profiling Unit to the Main Unit Case • Remove the screw for fastening the base unit. Figure 2.6 Screw for the Base Unit for Placing the Emulator Vertically... - Page 88 Figure 2.7 Removing the Base Unit for Placing the Emulator Vertically...
- Page 89 • Remove two screws on the rear side of the main unit case. Figure 2.8 Screws for the Main Unit Case...
- Page 90 • Remove the main unit case as shown in figure 2.9. Figure 2.9 Removing the Main Unit Case...
- Page 91 • After checking the location of pin 1, connect the expansion profiling unit to the main unit case. Figure 2.10 Connecting the Expansion Profiling Unit to the Main Unit Case...
- Page 92 • Fasten the expansion profiling unit with screws provided. Figure 2.11 Fastening the Expansion Profiling Unit to the Main Unit Case • Close the cover of the main unit case to be fastened with two screws. • Fasten the screw of the base unit.
-
Page 93: Connecting The Ac Adapter To The Emulator Main Unit Case
2.4 Connecting the AC Adapter to the Emulator Main Unit Case Connect the provided AC adapter to the main unit case. Figure 2.12 Connecting the AC Adapter to the Main Unit Case Connect the provided AC adapter to the connector to input DC (+12 V) of the AC adapter marked ‘DC IN’. -
Page 94: Connecting The Emulator To The Host Machine
WARNING Be sure to use the AC adapter dedicated for E200F. Failure to do so will result in a FIRE HAZARD and will damage the user system or the emulator product. 2.5 Connecting the Emulator to the Host Machine This section describes how to connect the emulator to the host machine. For the position of each connector of the emulator, refer to section 1.2, Emulator Hardware Configuration. - Page 95 The emulator is connected to the host machine via the USB 1.1/2.0. Figure 2.13 shows the system configuration. Figure 2.13 System Configuration when Connecting the Emulator to the Host Machine...
-
Page 96: Connecting The Emulator To The User System
2.6 Connecting the Emulator to the User System Use the procedure below to connect the emulator to the user system with the user system interface cable, or to disconnect them when moving the emulator or the user system. 1. Check that the emulator is turned off. 2. -
Page 97: Connecting The E200F H-Udi/Aud Probe To The User System
2.6.1 Connecting the E200F H-UDI/AUD Probe to the User System Connect the H-UDI/AUD probe to the user system as shown in figure 2.14. Figure 2.14 Connecting the H-UDI/AUD Probe to the User System... - Page 98 Fasten the user system and the H-UDI/AUD probe with screws as shown in figure 2.15. Figure 2.15 Fastening the User System and the H-UDI/AUD Probe CAUTION Note that the pin number assignments of the connector differ from those of the connector manufacturer. Notes: Connection of the signals differs depending on the package.
- Page 99 When developing user systems, do not connect the TDI and TDO signals of the device to the boundary scan loop, or separate them by using a switch (figure 2.16). H-UDI SHxxxx port H-UDI JTAG port Boundary scan loop User system TDI: Test data input TDO: Test data output TAP: Test access port...
-
Page 100: Connecting System Ground
2.6.2 Connecting System Ground WARNING Separate the frame ground from the signal ground at the user system. Failure to do so will result in a FIRE HAZARD and will damage the user system and the emulator product or will result in PERSONAL INJURY. The emulator's signal ground is connected to the user system's signal ground. -
Page 101: Changing The Settings
2.7 Changing the Settings In the emulator, it is possible to change the emulator function flexibly depending on the user’s request for debugging. When the High-performance Embedded Workshop is activated and connected to the emulator, the required functions can be selected. At this time, the following dialog box will be displayed. Figure 2.18 [Function select] Dialog Box The following sections describe the contents that can be selected in this dialog box. -
Page 102: Changing The Functions When Using The E200F Main Unit
2.7.1 Changing the Functions when Using the E200F Main Unit Select the item in the [Main board mode setting] combo box of the [Function select] dialog box. Figure 2.19 [Function select] Dialog Box • [RealProfile Area1 (function mode)]: Measures accumulation of execution time of each function;... -
Page 103: Changing The Functions When Using The External Bus Trace Unit
2.7.2 Changing the Functions when Using the External Bus Trace Unit Select the item in the [Bus board mode setting] combo box of the [Function select] dialog box. Figure 2.20 [Function select] Dialog Box • [Trace/break 6ch (Trace 262144 cycles)]: Uses the channel for detecting the external bus event as a break. -
Page 104: Changing The Functions When Using The Expansion Profiling Unit
2.7.3 Changing the Functions when Using the Expansion Profiling Unit Select the item in the [Option board mode setting] combo box of the [Function select] dialog box. Figure 2.21 [Function select] Dialog Box • [RealProfile Area2 (function mode)]: Measures accumulation of execution time of each function;... -
Page 105: Changing The Monitoring Function
2.7.4 Changing the Monitoring Function There are two radio buttons in the [Monitor Setting] group box of the [Function select] dialog box. Figure 2.22 [Function select] Dialog Box • [Virtual space] radio button: Displays the monitoring function as a virtual address. If the value is changed without accessing the CPU, that value cannot be displayed. -
Page 107: Section 3 Hardware Specifications
Section 3 Hardware Specifications 3.1 List of Specifications Table 3.1 lists the external dimensions and mass of the emulator. Table 3.1 External Dimensions and Mass Item Specification External dimensions of E200F main unit case 185 x 130 x 45 (mm) Mass of E200F main unit case 321 (g) External dimensions of E200F trace unit... - Page 108 User connector (36 pins) Emulator control circuit 3.3 V UVCC 10 k Ω 74AVCA16245 22 Ω 74LVC2G125 10 k Ω 74AVCA16245 22 Ω 74LVC2G125 TRST ASEBRKAK 10 k Ω 74AVCA16245 22 Ω 74LVC2G125 74LVC2G125 10 k Ω 22 Ω 74LVC2G125 74AVCA16245 10 k Ω...
- Page 109 User connector 3.3 V Emulator control circuit (36 pins) UVCC 74AVCA16245 10 k Ω 22 Ω AUDCK 74LVC2G125 10 k Ω 74AVCA16245 22 Ω AUDATA[3:0] 74LVC2G125 10 k Ω 74AVCA16245 22 Ω AUDSYNC 74LVC2G125 10 k Ω 74AVCA16245 22 Ω AUDMD 74LVC2G125 10 k Ω...
- Page 110 User connector (38 pins) Emulator control circuit UVCC AVCA164245 10 kΩ 22 Ω TRST AVCA164245 10 kΩ 22 Ω 74LVC2G125 10 kΩ 22 Ω RESET ASEBRKAK AVCA164245 Figure 3.3 Interface Circuits in the Emulator (38-pin Interface for H-UDI)
- Page 111 User connector (38 pins) Emulator control circuit LP2996 0.9 V 1.8 V UVCC_AUD FIN1104 RIN+ AUDCK DOUT 51 Ω RIN- FIN1104 RIN+ AUDSYNC DOUT 51 Ω RIN- FIN1104 RIN+ AUDATA[3:0] DOUT 51 Ω RIN- Figure 3.4 Interface Circuits in the Emulator (38-pin Interface for AUD)
-
Page 112: Reducing Emi Noise
3.3 Reducing EMI Noise To prevent EMI noise, enclose the trace unit in a case at usage, as shown in figure 3.5. The recommended material of the case is iron plated with nickel or resin internally plated with nickel. The case must be large enough to include the trace unit, the probe head, and the user system. Figure 3.5 Countermeasure for EMI Noise Note: EMI stands for Electrical Magnetic Interference. -
Page 113: Diagnostic Procedure
3.4 Diagnostic Procedure This section describes how to set up and execute the diagnostic program and output the result. 3.4.1 Installing the Diagnostic Program (1) Opening \SOT\R0E0200FxEMU00\Setup.exe • Execute Setup.exe from the \SOT\R0E0200FxEMU00 directory of the CD-R. Open \SOT\R0E0200F0EMU00\Setup.exe and \SOT\R0E0200F2EMU00\Setup.exe for R0E0200F0EMU00 and R0E0200F2EMU00, respectively. - Page 114 Select the component that has been connected. Figure 3.6 Initial Screen of the E200F System Operation Test 7. When the emulator enters USER TEST MODE, the screen shown in figure 3.7 is displayed. 8. When clicking [UNIT ONLY], items that can be tested are selected. 9.
- Page 115 Select [UNIT ONLY]. Figure 3.7 Screen for Selecting Test Note: Do not disconnect the USB cable during the test.
- Page 116 11. When the test is executed, ‘Testing’ is shown at the left of [STATUS]. 12. When the test is successfully completed, ‘Test OK’ is displayed. Indicating that the test is being executed. Figure 3.8 Screen Showing ‘Testing’...
-
Page 117: Creating A Log File
3.4.3 Creating a Log File Figure 3.9 Screen Showing ‘Test NG’ If the test is failed, ‘Test NG!’ is shown (figure 3.9). In this case, the emulator may be malfunctioned. Create a log file according to the following procedures and send it to the sales office. - Page 118 Example of the E200F TM error log *** E200F Emulator T/M ERROR LOG *** TM Version x.x.xx Serial Number 000x Date 200x/xx/xx STATUS NG Address NG Data 1301 A0000000 7EC0A5F 0304 A8000108 FFFFFFFF...
-
Page 119: Section 4 Preparations For Debugging
3. Connect the user system interface cable to the connector in the user system. 4. Turn on the user system. 5. Turn on the emulator. 6. Select [Renesas] -> [High-performance Embedded Workshop] -> [High-performance Embedded Workshop] from [Programs] in the [Start] menu. Figure 4.1 [Start] Menu Note: The [High-performance Embedded Workshop] ->... - Page 120 7. The [Welcome!] dialog box is displayed. Figure 4.2 [Welcome!] Dialog Box [Create a new project workspace] radio button: Creates a new workspace. [Open a recent project workspace] radio button: Uses an existing workspace and displays the history of the opened workspace. [Browse to another project workspace] radio button: Uses an existing workspace;...
- Page 121 After the directory has been specified, select the following file and click the [Open] button. Figure 4.3 [Open Workspace] Dialog Box 8. The [CPU Select] dialog box is displayed. Figure 4.4 [CPU Select] Dialog Box Select the CPU from the drop-down list and click the [OK] button.
- Page 122 If the following dialog box is displayed, the emulator will not support the CPU in use. Check the type number of the main unit referring to section 1.1, Components of the Emulator, in the additional document, Supplementary Information on Using the SHxxxx. Figure 4.5 [This CPU is not supported] Dialog Box 9.
- Page 123 10. The [Connecting] dialog box is displayed and the emulator connection is started. Figure 4.7 [Connecting] Dialog Box 11. The dialog box is displayed as shown in figure 4.8. Figure 4.8 Dialog Box of the RESET Signal Input Request Message 12.
- Page 124 13. If no reset signal is detected, the following dialog box is displayed. Figure 4.9 [Can not find /RESET signal] Dialog Box When the [Ignore] button is clicked, the emulator issues a reset in the CPU for initiation. However, this method is unavailable for some products. For details, refer to section 2.2, Specific Functions for the Emulator when Using the SHxxxx, in the additional document, Supplementary Information on Using the SHxxxx.
- Page 125 Notes: 1. If the emulator is not initiated, the following dialog boxes shown in figures 4.11 through 4.15 will be displayed. (a) If the following dialog box is displayed and the method 12 above is unavailable, the power of the user system may not be input or the RESET signal may not be input to the device.
- Page 126 (c) If the following dialog box is displayed, the device may not correctly operate. Check if there are reasons for illegal device operation. Figure 4.13 [COMMUNICATION TIMEOUT ERROR] Dialog Box Figure 4.14 [INVALID ASERAM FIRMWARE!] Dialog Box Figure 4.15 [Error JTAG boot] Dialog Box 2.
-
Page 127: Method For Activating High-Performance Embedded Workshop
To activate the High-performance Embedded Workshop, follow the procedure listed below. 1. Connect the emulator to the host machine and the user system, then turn on the user system. 2. Select [High-performance Embedded Workshop] from [Renesas High-performance Embedded Workshop] of [Programs] in the [Start] menu. -
Page 128: Creating The New Workspace (Toolchain Not Used)
The following describes how to activate the High-performance Embedded Workshop when selecting [Create a new project workspace] without any toolchain, [Create a new project workspace] with a toolchain, and [Browse to another project workspace]. The [Open a recent project workspace] radio button is used to omit the operation for specifying the workspace file when [Browse to another project workspace] is selected. - Page 129 2. The Project Generator is started. In this section, we omit description of the settings for the toolchain. If you have not purchased the toolchain, the following dialog box is displayed. Figure 4.18 [New Project Workspace] Dialog Box [Workspace Name] edit box: Enter the new workspace name. Here, for example, enter ‘test’. [Project Name] edit box: Enter the project name.
- Page 130 3. The following dialog box is displayed. Figure 4.19 [Setting the Target System for Debugging] Dialog Box Check the target emulator and click the [Next] button.
- Page 131 4. Set the configuration file name. The configuration file saves the state of High-performance Embedded Workshop except for the emulator. Figure 4.20 [Setting the Debugger Options] Dialog Box This is the end of the emulator setting. Click the [Finish] button to exit the Project Generator. The High-performance Embedded Workshop is activated.
-
Page 132: Creating The New Workspace (Toolchain Used)
4.2.2 Creating the New Workspace (Toolchain Used) 1. In the [Welcome!] dialog box that is displayed when the High-performance Embedded Workshop is activated, select [Create a new project workspace] radio button and click the [OK] button. Figure 4.21 [Welcome!] Dialog Box... - Page 133 2. The Project Generator is started. If you have purchased the toolchain, the following dialog box is displayed. Figure 4.22 [New Project Workspace] Dialog Box [Workspace Name] edit box: Enter the new workspace name. Here, for example, enter ‘test’. [Project Name] edit box: Enter the project name.
- Page 134 3. Make the required setting for the toolchain. When the setting has been completed, the following dialog box is displayed. Figure 4.23 [New Project – Step 7] Dialog Box Check the target emulator and click the [Next] button. Mark other products as required.
- Page 135 4. Set the configuration file name. The configuration file saves the state of High-performance Embedded Workshop except for the emulator. Figure 4.24 [New Project – Step 8] Dialog Box This is the end of the emulator setting. Exit the Project Generator according to the instructions on the screen. The High-performance Embedded Workshop is activated.
- Page 136 (a) Connecting the emulator after the setting at emulator activation Select [Debug settings] from the [Options] menu to open the [Debug Settings] dialog box. It is possible to register the download module or the command chain that is automatically executed at activation.
-
Page 137: Selecting An Existing Workspace
4.2.3 Selecting an Existing Workspace 1. In the [Welcome!] dialog box that is displayed when the High-performance Embedded Workshop is activated, select [Browse to another project workspace] radio button and click the [OK] button. Figure 4.26 [Welcome!] Dialog Box... - Page 138 2. The [Open Workspace] dialog box is displayed. Select a directory in which you have created a workspace. After that, select the workspace file (.hws) and press the [Open] button. Figure 4.27 [Open Workspace] Dialog Box 3. This activates the High-performance Embedded Workshop and recovers the state of the selected workspace at the time it was saved.
-
Page 139: Setting At Emulator Activation
4.3 Setting at Emulator Activation When the emulator is activated, the command chain can be automatically executed. It is also possible to register multiple load modules to be downloaded. The registered load modules are displayed on the workspace window. 1. Select [Debug settings] from the [Options] menu to open the [Debug Settings] dialog box. Figure 4.28 [Debug Settings] Dialog Box ([Target] Page) 2. - Page 140 Figure 4.29 [Debug Settings] Dialog Box ([Options] Page) The command chain that is automatically executed at the specified timing is registered. The following three timings can be specified: • At connecting the emulator • Immediately before downloading • Immediately after downloading Specify the timing for executing the command chain in the [Command batch file load timing] drop-down list box.
-
Page 141: Debug Sessions
4.4 Debug Sessions The High-performance Embedded Workshop stores all of your builder options into a configuration. In a similar way, the High-performance Embedded Workshop stores your debugger options in a session. The debugging platforms, the programs to be downloaded, and each debugging platform’s options can be stored in a session. -
Page 142: Adding And Removing Sessions
• From the dialog box 1. Select [Options -> Debug Sessions…]. This will open the [Debug Sessions] dialog box (figure 4.31). Figure 4.31 [Debug Sessions] Dialog Box 2. Select the session you want to use from the [Current session] drop-down list. 3. - Page 143 5. Click the [OK] button to close the [Debug Sessions] dialog box. 6. This creates a file with the name entered in step 4. If a file with this name already exists, an error is displayed. Figure 4.32 [Add new session] Dialog Box •...
- Page 144 2. Select the session you would like to remove. 3. Click the [Remove] button. Note that the current session cannot be removed. 4. Click the [OK] button to close the [Debug Sessions] dialog box. • To view the session properties 1.
-
Page 145: Saving Session Information
5. If you want to export the session file to another location, leave the [Maintain link] check box unchecked. If you would like the High-performance Embedded Workshop to use this location instead of the current session location, check the [Maintain link] check box. 6. -
Page 146: Connecting The Emulator
4.5 Connecting the Emulator Select either of the following two ways to connect the emulator: (a) Connecting the emulator after the setting at emulator activation Select [Debug settings] from the [Options] menu to open the [Debug Settings] dialog box. It is possible to register the download module or the command chain that is automatically executed at activation. -
Page 147: Reconnecting The Emulator
In the list box that is circled in figure 4.35, select the session file name including the character string that has been set in the [Target name] text box in figure 4.24, [New Project –8/9– Debugger Option] dialog box. The setting for using the emulator has been registered in this session file. After the session file name is selected, the emulator will automatically be connected. -
Page 148: Ending The Emulator
4.7 Ending the Emulator When using the toolchain, the emulator can be exited by using the following two methods: • Canceling the connection of the emulator being activated • Exiting the High-performance Embedded Workshop (1) Canceling the connection of the emulator being activated Select [Disconnect] from the [Debug] menu or click the [Disconnect] toolbar button ( (2) Exiting the High-performance Embedded Workshop Select [Exit] from the [File] menu. -
Page 149: Uninstalling The Emulator's Software
4.8 Uninstalling the Emulator’s Software Follow this procedure to remove the installed emulator’s software from the user’s host machine. As the installed product is registered with the High-performance Embedded Workshop, uninstall the product on the High-performance Embedded Workshop screen. It is also possible to uninstall the emulator’s software by using [Add/Remove Programs] in the control panel. - Page 150 The [Tools Administration] dialog box is opened. Figure 4.38 [Tools Administration] Dialog Box...
- Page 151 Click the [+] mark at the left of [Debugger Components] in the [Registered components] list box to list the installed components. Then, highlight the product name to be uninstalled. Figure 4.39 Highlighting the Product to be Uninstalled Click the [Unregister] button. After the following message box is displayed, click the [Yes] button.
- Page 152 This is the end of canceling the High-performance Embedded Workshop registration. Then, remove the file for the emulator from the host machine. Click the [Uninstaller…] button in the [Tools Administration] dialog box to open the [Uninstall HEW Tool] dialog box. Figure 4.41 [Uninstall HEW Tool] Dialog Box...
- Page 153 Click the [Start] button to list the installed components. Figure 4.42 Highlighting the Product to be Uninstalled Highlight the product name to be uninstalled and click the [Uninstall] button. This is the end of uninstallation. CAUTION A shared file may be detected while the program is being removed.
-
Page 155: Section 5 Debugging
Section 5 Debugging This section explains the functions specific to this product that have not been described in section 15, Using the Debugger, of the High-performance Embedded Workshop User’s Manual. Setting the Environment for Emulation 5.1.1 Opening the [Configuration] Dialog Box Selecting [Setup ->... -
Page 156: General] Page
5.1.2 [General] Page Sets the emulator operation conditions. Figure 5.1 [Configuration] Dialog Box ([General] Page) Items that can be displayed in this page are listed below. - Page 157 [Mode] Displays the MPU name. [Emulation mode] Selects the emulation mode at user program execution. [Hardware break disable]: Disables hardware breaks generated in the emulator main unit case. Functions to be disabled are AUD Event break, BUS Event break, Other Event break, and trace overflow break.
- Page 158 [AUD clock] A clock used in acquiring AUD traces. If its frequency is set too low, complete data may not be acquired during realtime tracing. Set the frequency not to exceed the upper limit for the MPU's AUD clock. The AUD clock is only needed for using emulators that have an AUD trace function.
-
Page 159: Main Board] Page
5.1.3 [Main Board] Page Sets the main unit case operation conditions. Figure 5.2 [Configuration] Dialog Box ([Main Board] Page) - Page 160 Items that can be displayed in this page are listed below. [Multi analysis mode setting] Displays the functions of the E200F main unit. Here, this item displays which function of realtime profiling, coverage, or I/O analyzer has been selected. [RealProfile Area 1 (function mode)]: The realtime profiling function (measurement mode: function mode) is selected.
-
Page 161: Bus Board] Page
5.1.4 [Bus Board] Page Sets the trace unit operation conditions. Note: When the trace unit is not connected to the emulator, this page is not displayed. Figure 5.3 [Configuration] Dialog Box ([Bus Board] Page) - Page 162 Items that can be displayed in this page are listed below. [Bus board mode setting] Displays the function of the trace unit. [Trace/break 6ch (Trace 262144 cycles)]: The external bus trace or break function has been selected (event detection channels: six). The 262144 bys cycles can be acquired by a trace.
- Page 163 Clicking the [Multiplexed pins setting...] button opens the [Multiplexed pins setting] dialog box. Select the pin name according to the state of the multiplexed pin. Figure 5.4 [Multiplexed pins setting] Dialog Box Note: This dialog box differs depending on the product.
- Page 164 Clicking the [Memory type setting...] button opens the [Memory type setting] dialog box. Set the memory type on the board. When SDRAM is to be acquired by trace, the number of bits of the row and column addresses and the CAS latency must be set in this dialog box. Note that the data bus width will also need to be set.
-
Page 165: Option Board] Page
5.1.5 [Option Board] Page Sets the expansion profiling unit operation conditions. Note: When the expansion profiling unit is not connected to the emulator, this page is not displayed. Figure 5.6 [Configuration] Dialog Box ([Option Board] Page) - Page 166 Item that can be displayed in this page is listed below. [Option board mode setting] Displays the functions of the expansion profiling unit. [RealProfile Area 2 (function mode)]: The realtime profiling function (measurement mode: function mode) has been selected. [RealProfile Area 2 (nest mode)]: The realtime profiling function (measurement mode: nest mode) has been selected.
-
Page 167: Downloading To The Flash Memory
5.1.6 Downloading to the Flash Memory Sets the emulator operation conditions for downloading the external flash memory. For details, refer to section 6.22, Download Function to the Flash Memory Area. Figure 5.7 [Configuration] Dialog Box ([Loading flash memory] Page) Items that can be displayed in this page are listed below. - Page 168 [Loading flash memory] Sets Enable for flash memory downloading. At Enable, when the flash memory is downloaded on the High-performance Embedded Workshop, the write module is always called. [Disable]: Not download to the flash memory [Enable]: Download to the flash memory [Erasing flash memory] Sets Enable for erasing before the flash memory is written.
-
Page 169: Opening The [Memory Mapping] Dialog Box
5.1.7 Opening the [Memory Mapping] Dialog Box Selecting [Setup -> Emulator -> Memory Resource…] or clicking the [Emulator Memory Resource] toolbar button ( ) opens the [Memory Mapping] dialog box. Figure 5.8 [Memory Mapping] Dialog Box... - Page 170 This dialog box displays the current memory map and the state of the emulation memory. [Edit...]: Displays the [Edit Memory Mapping] dialog box, allowing the user to modify the address range and attributes of a memory map. [Add...]: Allocates the new emulation memory. [Reset]: Resets the map memory to its default settings.
-
Page 171: Changing The Memory Map Setting
5.1.8 Changing the Memory Map Setting Clicking the [Edit…] button on the [Memory Mapping] dialog box after selecting the information on the memory map setting you want to change opens the [Edit Memory Mapping] dialog box. This dialog box also opens when the [Add…] button is clicked on the [Memory Mapping] dialog box. -
Page 172: Downloading A Program
Downloading a Program This section describes how to download a program and view it as source code or assembly- language mnemonics. Note: After a break has occurred, the High-performance Embedded Workshop displays the location of the program counter (PC). In most cases, for example if an Elf/Dwarf2-based project is moved from its original path, the source file may not be automatically found. -
Page 173: Viewing The Source Code
5.2.2 Viewing the Source Code Select your source file and click the [Open] button to make the High-performance Embedded Workshop open the file in the integrated editor. It is also possible to display your source files by double-clicking on them in the [Workspace] window. Figure 5.10 [Source] Window... - Page 174 In this window, the following items are shown on the left as line information. The first column (Source address column): Address information The second column (Onchip event column): On-chip event information The third column (AUD event column): AUD event information The fourth column (BUS event column): External bus event information The fifth column (CodeCoverage column): Coverage information The sixth column (S/W breakpoint column): PC, bookmark, and breakpoint information...
- Page 175 Note: The contents of the Onchip event column are erased when conditions other than the address condition are added to each channel by using the [Edit] menu or in the [Event] window. AUD event column The AUD event column displays the following item: : An AUD break is set.
- Page 176 BUS event column The BUS event column displays the following item: : An external bus break is set. : An external bus sequential break is set. : An external bus trace acquisition is set. : An external bus trace start is set. : An external bus trace stop is set.
- Page 177 To switch off a column in all source files 1. Click the right-hand mouse button on the [Source] window. 2. Click the [Define Column Format…] menu item. 3. The [Global Editor Column States] dialog box is displayed. 4. A check box indicates whether the column is enabled or not. If it is checked, the column is enabled.
-
Page 178: Viewing The Assembly-Language Code
5.2.3 Viewing the Assembly-Language Code Click the right-hand mouse button on the [Source] window to open the popup menu and select [Go to Disassembly] to open the [Disassembly] window at the address that corresponds to the current source file. If you do not have a source file, but want to view code in the assembly-language level, either choose [View ->... -
Page 179: Modifying The Assembly-Language Code
5.2.4 Modifying the Assembly-Language Code You can modify the assembly-language code by double-clicking on the instruction that you want to change. The [Assembler] dialog box will be opened. Figure 5.16 [Assembler] Dialog Box The address, machine code, and disassembled instruction are displayed. Enter the new instruction or edit the current instruction in the [Mnemonic] field. -
Page 180: Viewing A Specific Address
5.2.5 Viewing a Specific Address When you are viewing your program in the [Disassembly] window, you may want to look at another area of your program's code. Rather than scrolling through a lot of code in the program, you can go directly to a specific address. Select [Set Address…] from the popup menu, and the dialog box shown in figure 5.17 is displayed. -
Page 181: Displaying Memory Contents In Realtime
Displaying Memory Contents in Realtime Use the [Monitor] window to monitor the memory contents during user program execution. When the emulator is activated, it is possible to select whether the address to be monitored is the physical address or the virtual address. For the physical address, monitoring is disabled if [Hardware break enable] is selected from the [Emulation mode] combo box in the [General] sheet of the [Configuration] dialog box. -
Page 182: Opening The [Monitor] Window
5.3.1 Opening the [Monitor] Window To open the [Monitor] window, select [View -> CPU -> Monitor -> Monitor Setting...] or click the [Monitor] toolbar button ( ) to display the [Monitor Setting] dialog box. Figure 5.18 [Monitor Setting] Dialog Box... - Page 183 [Name]: Decides the name of the monitor window. [Options]: Sets monitor conditions. [Address]: Sets the start address for monitoring. [Size]: Sets the range for monitoring. [Access]: Sets the access size to be displayed in the monitor window. [Auto-Refresh at rate]: Sets the interval for acquisition by monitoring.
-
Page 184: Changing The Monitor Settings
[History]: Displays the previous settings. Note: Selection of the foreground or background color may not be available depending on the operating system in use. After setting, clicking the [OK] button displays the [Monitor] window. Figure 5.19 [Monitor] Window During user program execution, the display is updated according to the setting value of the auto- update interval. -
Page 185: Temporarily Stopping Update Of The Monitor
5.3.3 Temporarily Stopping Update of the Monitor During user program execution, the display of the [Monitor] window is automatically updated according to the auto-update interval. Select [Lock Refresh] from the popup menu of the [Monitor] window to stop the update of display. The characters in the address section are displayed in black, and the update of display is stopped. - Page 186 Figure 5.20 [Watch] Window...
-
Page 187: Hiding The [Monitor] Window
The [R] mark shows that the value of the variable can be updated during user program execution. For reading of memory and updating of the content of the variable that has been registered in the [Watch] window during execution of the user program, there are following two methods: 1. -
Page 188: Managing The [Monitor] Window
To display the [Monitor] window again, select the hidden the [Monitor] window. Figure 5.21 Monitor Setting List 5.3.7 Managing the [Monitor] Window Selecting [Display -> CPU -> Monitor -> Windows Select…] displays the [Windows Select] dialog box. In this window, the current monitoring condition is checked and the new monitoring condition is added, edited, and deleted in succession. -
Page 189: Viewing The Current Status
Viewing the Current Status Choose [View -> CPU -> Status] or click the [View Status] toolbar button ( ) to open the [Status] window and see the current status of the debugging platform. Figure 5.23 [Status] Window The [Status] window has three sheets: •... -
Page 190: Reading And Displaying The Emulator Information Regularly
Reading and Displaying the Emulator Information Regularly Use the [Extended Monitor] window to know the changing information on the emulator no matter the user program is running or halted. Note: The Extended Monitor function does not affect the execution of the user program since it monitors the signal output from the user system or the MPU. -
Page 191: Selecting Items To Be Displayed
5.5.2 Selecting Items to be Displayed Selecting [Properties…] from the popup menu displays the [Extended Monitor Configuration] dialog box. Figure 5.25 [Extended Monitor Configuration] Dialog Box This dialog box allows the user to set the items to be displayed in the [Extended Monitor] window. -
Page 192: Using The Eventpoints
Using the Eventpoints The emulator has the eventpoint function that performs breaking, tracing, and execution time measurement by specifying more complex conditions along with the PC breakpoints standard for the High-performance Embedded Workshop. 5.6.1 PC Breakpoints When the instruction of the specified address is fetched, the user program is stopped. Up to 1000 points can be set. - Page 193 This function can be set in the [AUD Event] sheet of the [Event] window. (3) BUS Eventpoint This is a function that sets eventpoints according to the external bus of the MPU or information on the pin such as an interrupt pin. There are six event detection channels. For an operation when an event is detected, break or external bus trace acquisition/acquisition start/acquisition stop can be specified.
-
Page 194: Opening The [Event] Window
5.6.3 Opening the [Event] Window Select [View -> Code -> Eventpoints] or click the [Eventpoints] toolbar button ( ) to open the [Event] window. The [Event] window has the following five sheets: [Breakpoint] sheet: Displays the settings made for PC breakpoints. It is also possible to set, modify, and cancel PC breakpoints. -
Page 195: Setting Pc Breakpoints
5.6.4 Setting PC Breakpoints It is possible to display, modify, and add PC breakpoints on the [Breakpoint] sheet. Figure 5.26 [Event] Window ([Breakpoint] Sheet) Items that can be displayed in the sheet are listed below. [Type] Breakpoint [State] Whether the breakpoint is enabled or disabled [Condition] An address that the breakpoint is set Address = Program counter (Corresponding file name, line, and symbol name) [Action]... - Page 196 Select [Add...] or the PC breakpoint displayed in this window and then select [Edit...] from the popup menu to display the [Breakpoint] dialog box. Figure 5.27 [Breakpoint] Dialog Box This dialog box specifies address conditions of PC breakpoints. A breakpoint address to be set is specified in the [Value] edit box. The PC register can also be specified such as #PC.
-
Page 197: Setting Onchip Eventpoints
5.6.5 Setting Onchip Eventpoints On the [Onchip Event] sheet, the settings for Onchip Eventpoints are displayed and modified. Figure 5.28 [Event] Window ([Onchip Event] Sheet) Since the number of event detection channels and the contents to be set differ depending on the product, refer to the online help for each product. - Page 198 When an event channel is double-clicked or selected and [Edit...] is selected from the popup menu in this window, the [Event condition x] dialog box is opened and eventpoint conditions can be modified. Figure 5.29 [Event condition x] Dialog Box ([Address] Page) Note: For details on the [Event condition x] dialog box, refer to the online help for each product.
- Page 199 Table 5.1 lists the conditions of Event Condition. Table 5.1 Types of Event Conditions Event Condition Type Description Address bus condition (Address) Breaks when the MPU address bus value or the program counter value matches the specified value. Data bus condition (Data) Breaks when the MPU data bus value matches the specified value.
- Page 200 Table 5.2 Channels for Setting Event Conditions Function Window Address Data State Address Branch ASID Condition Condition LDTLB Count Condition Condition Condition Condition (Bus (Window System Instruction Condition (Branch Software Channel (Address) (Data) (ASID) Status) address) Break (Count) Trace) Trace Action (IA_OA) (B and...
- Page 201 Table 5.2 Channels for Setting Event Conditions (cont) Function Window Address Data State Address Branch ASID Condition Condition LDTLB Count Condition Condition Condition Condition (Bus (Window System Instruction Condition (Branch Software Channel (Address) (Data) (ASID) Status) address) Break (Count) Trace) Trace Action Ch12...
- Page 202 Sequential Setting: In the emulator, sequential setting of an Event Condition is enabled. Table 5.3 Sequential Event Conditions Type Event Condition Description [CPU 2 Channel Ch2 -> 1 Halts a program when after conditions have been Sequential Sequential matched in the order of Event Condition 2, 1. Event] Page An event condition must be set for Ch2 and Ch1.
- Page 203 Table 5.3 Sequential Event Conditions (cont) Type Event Condition Description [CPU CPU Extend Expands the [CPU Sequential Extend] page. Sequential The sequential setting is enabled with any Event] Page combination. (cont) For details, refer to ‘Sequential Break Extension Setting’ in this section. [SystemBus SystemBus Ch9 ->...
- Page 204 Sequential Break Extension Setting: Figure 5.30 [CPU Sequential Extend] Page (a) Indicates the channel name for setting conditions. (b) Selects a condition that is satisfied before the channel which sets up conditions. When a channel name is selected, it is required that the condition of the channel selected here must have already been satisfied.
- Page 205 Usage Example of Sequential Break Extension Setting: A tutorial program provided for the product is used as an example. For the tutorial program, refer to section 6, Tutorial, in the SuperH Family E200F Emulator User’s Manual. The conditions of Event Condition are set as follows: 1.
-
Page 206: Setting Aud Eventpoints
Figure 5.31 [Source] Window at Execution Halted (Sequential Break) 5.6.6 Setting AUD Eventpoints On the [AUD Event] sheet, the settings for AUD Eventpoints are displayed and modified. Figure 5.32 [Event] Window ([AUD Event] Sheet) Using eight event detection channels sets eight eventpoints. Note: Since the AUD eventpoint condition is set according to the information in the MPU output from the AUD pin, the trace acquisition condition for the Onchip Eventpoint must be set. - Page 207 Set trace acquisition conditions for on-chip event channels Ch5 (OA), Ch6 (OA), Ch7 (SystemBus), Ch8 (SystemBus), and Ch12 (Branch) or software trace. Items that can be displayed in the sheet are listed below. [Type] AUD event channel number and type Normal: Standard event channel Delay: Event channel that delay conditions can be set Reset: Event channel that can be set as the reset point of the AUD sequential...
- Page 208 (1) [General] page Specifies AUD trace information used to set the AUD Eventpoint condition. Figure 5.33 [Chx (Delay)] Dialog Box ([General] Page) [Branch trace data]: Sets the eventpoint condition according to the branch trace information. [Window trace data]: Sets the eventpoint condition according to the window trace information.
- Page 209 (2) [Branch] page Specifies the type and address conditions of the branch trace. Figure 5.34 [Chx (Delay)] Dialog Box ([Branch] Page) [Branch type]: Sets branch types. [Source/Destination]: Sets no branch type. [Source]: Sets the branch-source address condition. [Destination]: Sets the branch-destination address condition. [Address]: Sets address conditions.
- Page 210 [Start]: Sets the single address or the start address of the address range. [End]: Sets the end address of the address range. [Outside]: Sets other value than that has been set for the single address or address range as the condition. Notes: 1.
- Page 211 (3) [Window] page Specifies the address and data conditions of the window trace. Figure 5.35 [Chx (Delay)] Dialog Box ([Window] Page) [Address]: Sets the address condition. [Don’t care]: Sets no address condition. [Address]: Sets the single address. [Range]: Sets the address range. [Start]: Sets the single address or the start address of the address range.
- Page 212 [Data]: Sets the data condition. [Don’t care]: Sets no data condition. [Read/Write]: Sets the read or write cycle as the condition. [Read]: Sets the read cycle as the condition. [Write]: Sets the write cycle as the condition. [Value]: Sets the data bus value (mask data can be input). [Byte]: Sets the byte access as the condition.
- Page 213 (4) [Software] page Specifies the address and data conditions of the software trace. Figure 5.36 [Chx (Delay)] Dialog Box ([Software] Page) [Address]: Sets the address condition. [Don’t care]: Sets no address condition. [Address]: Sets the single address. [Range]: Sets the address range. [Start]: Sets the single address or the start address of the address range.
- Page 214 [Data]: Sets the data condition. [Don’t care]: Sets no data condition. [Value]: Sets the data bus value (mask data can be input). [Outside]: Sets other value than that has been set for [Value] as the condition. Notes: 1. This page is only displayed when [Software trace data] is specified on the [General] page.
- Page 215 (5) [SystemBus] page Specifies the address and data conditions of the system bus trace. Figure 5.37 [Chx (Delay)] Dialog Box ([SystemBus] Page) [Address]: Sets the address condition. [Don’t care]: Sets no address condition. [Address]: Sets the single address. [Range]: Sets the address range. [Start]: Sets the single address or the start address of the address range.
- Page 216 [Data]: Sets the data condition. [Don’t care]: Sets no data condition. [Load/Store]: Sets the load or store cycle as the condition (not supported). [Load]: Sets the load cycle as the condition (not supported). [Store]: Sets the store cycle as the condition. [Value]: Sets the data bus value (mask data can be input).
- Page 217 (6) [Count] page Specifies the satisfaction count conditions. Figure 5.38 [Chx (Delay)] Dialog Box ([Count] Page) [Don’t care]: Sets no satisfaction count. [numbers]: Sets a value as the satisfaction count condition; D’1 to D’65535 is available. Note: If [Trace get] is selected on the [Action] page, this page will not be displayed.
- Page 218 (7) [Delay] page Sets the delay cycle from the event detection to the AUD trace stop. Figure 5.39 [Chx (Delay)] Dialog Box ([Delay] Page) [Don’t care]: Sets no delay condition. [Delay]: Sets the delay cycle counts; D’0 to D’262143 is available. [Clock]: Sets a cycle for delay measurement.
- Page 219 (8) [Action] page Sets the operation after the condition has been satisfied. Figure 5.40 [Chx (Reset)] Dialog Box ([Action] Page) [Break]: Breaks after conditions have been matched. [Trace]: Enables [Trace option] and sets the AUD trace operation. [Trace start]: Starts AUD trace after conditions have been matched. [Trace stop]: Stops AUD trace after conditions have been matched.
- Page 220 performance measurement as any of the following values: 20 ns, 40 ns, 100 ns, or 400 ns [Enable output trigger]: Specifies whether or not the trigger is output after conditions have been matched. Notes: 1. For AUD performance measurement, two AUD event channels are used to start and stop measurement.
- Page 221 (9) [Sequential AUD Event] dialog box The sequential AUD event occurs when all the AUD Eventpoint conditions are satisfied in the specified order. AUD event channel Ch1 can be specified as the reset point. When the reset point is passed, the satisfied eventpoint condition is disabled and checking the first eventpoint condition is started.
- Page 222 [Channel 5 -> 4 -> 3 -> 2]: After conditions have been matched in the order of AUD event channel 5 -> 4 -> 3 -> 2, a sequential AUD event occurs. [Channel 6 -> 5 -> 4 -> 3 -> 2]: After conditions have been matched in the order of AUD event channel 6 ->...
-
Page 223: Setting Bus Eventpoints
5.6.7 Setting BUS Eventpoints On the [BUS Event] sheet, the settings for BUS Eventpoints are displayed and modified. Figure 5.42 [Event] Window ([BUS Event] Sheet) Using six event detection channels sets six eventpoints. Notes: 1. When the trace unit is not connected to the emulator, this function is not supported. 2. - Page 224 When an event channel is double-clicked or selected and [Edit...] is selected from the popup menu in this window, the [Chx] dialog box is displayed. The [Chx] dialog box consists of the [Address], [Data], [Interrupt], [Count], [Delay], and [Action] pages. The combination of the conditions set in each page is set as the detection condition of eventpoints.
- Page 225 [Range]: Sets the address range. [Start]: Sets the single address or the start address of the address range (mask address can be input). [End]: Sets the end address of the address range (mask address can be input). [Outside]: Sets other value than that has been set for the single address or address range as the condition.
- Page 226 (2) [Data] page Specifies the data bus condition. Figure 5.44 [Chx (Delay)] Dialog Box ([Data] Page) [Data]: Sets the data condition. [Don’t care]: Sets no data condition. [Read/Write]: Sets the read or write cycle as the condition. [Read]: Sets the read cycle as the condition. [Write]: Sets the write cycle as the condition.
- Page 227 (3) [Interrupt] page Specifies the signal conditions of NMI and external interrupts. Figure 5.45 [Chx (Delay)] Dialog Box ([Interrupt] Page) [Don’t care]: Sets no signal condition. [High]: Satisfies a condition when the signal is high. [Low]: Satisfies a condition when the signal is low. Note: The external interrupt signal differs depending on the supported MPU.
- Page 228 (4) [Count] page Specifies the satisfaction count condition. Figure 5.46 [Chx (Delay)] Dialog Box ([Count] Page) [Don’t care]: Sets no satisfaction count. [numbers]: Sets a value as the satisfaction count condition; D’1 to D’65535 is available. Note: If [Trace get] is selected on the [Action] page, this page will not be displayed.
- Page 229 (5) [Delay] page Sets the delay cycle from the event detection to the external bus trace stop. Figure 5.47 [Chx (Delay)] Dialog Box ([Delay] Page) [Don’t care]: Sets no delay condition. [Delay]: Sets the delay cycle counts; D’0 to D’262143 is available. Note: This page is only displayed when external bus event channel Ch2 is selected and [Trace stop] is specified on the [Action] page.
- Page 230 (6) [Action] page Sets the operation after the condition has been satisfied. Figure 5.48 [Chx (Delay)] Dialog Box ([Action] Page) [Break]: Breaks after conditions have been matched. [Trace]: Enables [Trace option] and sets the external bus trace operation. [Trace start]: Starts external bus trace after conditions have been matched. [Trace stop]: Stops external bus trace after conditions have been matched.
- Page 231 (7) [Sequential BUS Event] dialog box The sequential bus event occurs when all the BUS Eventpoint conditions are satisfied in the specified order. Bus event channel Ch1 can be specified as the reset point. When the reset point is passed, the satisfied eventpoint condition is disabled and checking the first eventpoint condition is started.
- Page 232 [Channel 6 -> 5 -> 4 -> 3 -> 2]: After conditions have been matched in the order of bus event channel 6 -> 5 -> 4 -> 3 -> 2, a Sequential BUS Event occurs. [Sequential reset]: Selects whether or not bus event channel Ch1 is used as the reset point. [Disable]: Not used as the reset point.
-
Page 233: Setting Other Eventpoints
5.6.8 Setting Other Eventpoints On the [Other Event] sheet, the settings for Other Eventpoints are displayed and modified. Figure 5.50 [Event] Window ([Other Event] Sheet) Items that can be displayed in the sheet are listed below. The display content will be added depending on the status of the optional units in use. - Page 234 (1) [Probe] dialog box Double-clicking the [Probe] event channel displays this dialog box. Conditions of the eventpoint can be set on the [Condition] and [Action] pages. (a) [Condition] page: Specifies four external probe signal conditions via the external probe cable. Figure 5.51 [Probe] Dialog Box ([Condition] Page) [Operation]: Specifies how to combine the probe signal conditions.
- Page 235 (b) [Action] page: Sets the operation after the condition has been satisfied. Figure 5.52 [Probe] Dialog Box ([Action] Page) [Break]: Breaks after conditions have been matched. [Trace]: Enables [AUD trace option] and sets the AUD trace operation. [Trace start]: Starts AUD trace after conditions have been matched. [Trace stop]: Stops AUD trace after conditions have been matched.
- Page 236 (2) [Runtime Count] dialog box Double-clicking the [Runtime Count] event channel displays this dialog box. Conditions of the eventpoint can be set on the [Condition] and [Action] pages. (a) [Condition] page: Specifies the execution time of the user program. Figure 5.53 [Runtime Count] Dialog Box ([Condition] Page) [The minimum time to be measured]: Specifies the resolution of the timer for execution time measurement as any of the following values:...
- Page 237 (b) [Action] page: Sets the operation after the condition has been satisfied. Figure 5.54 [Runtime Count] Dialog Box ([Action] Page) [Break]: Breaks after conditions have been matched.
-
Page 238: Editing Breakpoint Or Eventpoint
5.6.9 Editing Breakpoint or Eventpoint Select a break condition to be modified, and choose [Edit...] from the popup menu to open the dialog box for the point, which allows the user to modify the breakpoints or eventpoints. The [Edit...] menu is only available when one breakpoint or eventpoint is selected. 5.6.10 Enabling Breakpoint or Eventpoint Select a breakpoint or an eventpoint and choose [Enable] from the popup menu to enable the... -
Page 239: Viewing The Trace Information
Viewing the Trace Information In the emulator, there are functions to acquire information within and outside the MPU by a trace. The emulator acquires four types of trace information: internal trace (Internal trace), AUD trace (AUD trace), trace that is output to the user memory (Usermemory trace), and external bus trace (BUS trace). - Page 240 (1) Acquiring Internal Trace Information (Internal trace) Selecting the [Set…] menu in the popup menu of the [Internal/AUD/Usermemory acquisition] window displays the [Internal/AUD/Usermemory acquisition] dialog box. When [Internal trace] is selected in [Trace Type] within the dialog box, the trace information is acquired by using the internal trace function.
- Page 241 [Branch Type] Type of branch (only when the branch trace is acquired): GENERAL: General branch SUBROUTINE: Subroutine branch EXCEPTION: Exception branch [Bus] The bus which was being accessed [R/W] Whether the generated data is associated with read or write access [Address] Address [Data]...
- Page 242 (2) Acquiring AUD Trace Information (AUD trace) Selecting the [Set…] menu in the popup menu of the [Internal/AUD/Usermemory acquisition] window displays the [Internal/AUD/Usermemory acquisition] dialog box. When [AUD trace] is selected in [Trace Type] within the dialog box, the trace information is acquired by using the AUD trace function.
- Page 243 [R/W] Whether the generated data is associated with read or write access [Address] Address [Data] The data of the generated data access. When [Type] is S_TRACE, value x, a variable of function Trace(x), is displayed. [PPC3] Internal performance counter (Ch3) output [PPC4] Internal performance counter (Ch4) output [Instruction]...
- Page 244 (4) Specifying Conditions or Modes for Acquiring Trace Information The capacity of the trace buffer is limited. When the buffer becomes full, the oldest trace information is overwritten. Setting the trace acquisition condition allows acquisition of useful trace information and effective use of the trace buffer. The trace information acquisition conditions are implemented by eventpoints and acquisition start, acquisition end, and acquisition can be controlled.
- Page 245 Figure 5.58 [Internal/AUD/Usermemory acquisition] Dialog Box [Trace type]: Selects the type of trace function. [AUD trace] Selects the AUD trace function. [Internal trace] Selects the internal trace function. [User Memory trace] Selects the user-memory output trace function. [Trace Mode 1]: Selects the operation mode when the trace information has been sequentially generated.
- Page 246 [Non realtime trace] The CPU stops operations until the trace information is output. [Trace mode 2]: Specifies the operation when the AUD trace buffer of the emulator becomes full. [Trace continue] The oldest trace information is overwritten to acquire the latest trace information.
-
Page 247: Opening The [Bus/Mfi Trace] Window
Clicking the [OK] button stores the settings. Clicking the [Cancel] button closes this dialog box without modifying the settings. 5.7.2 Opening the [BUS/MFI trace] Window To display the [Trace Window Type] dialog box, choose [View -> Code -> Trace] or click the [Trace] toolbar button ( Figure 5.59 [Trace Window Type] Dialog Box Selecting [BUS/MFI trace] and clicking the [OK] button displays the [BUS/MFI trace] window. - Page 248 Figure 5.60 [BUS/MFI trace] Window (BUS Trace) Items that can be displayed in this window are listed below. For details on the specifications of each product, refer to the online help. [PTR] The bus trace buffer pointer (+0 for the last executed instruction) [IP] The amount of acquired trace information [R/W]...
- Page 249 (2) Specifying Conditions or Modes for Acquiring Trace Information The capacity of the trace buffer is limited. When the buffer becomes full, the oldest trace information is overwritten. Setting the trace acquisition condition allows acquisition of useful trace information and effective use of the trace buffer. The trace information acquisition conditions are implemented by eventpoints and acquisition start, acquisition end, and acquisition can be controlled.
-
Page 250: Hiding The [Trace] Column
[BUS buffer over flow]: Specifies the operation when the external bus trace buffer of the emulator becomes full. [Trace continue] The oldest trace information is overwritten by the latest information. [Trace stop] When the trace buffer becomes full, the trace information is no longer acquired. -
Page 251: Searching For A Trace Record
5.7.4 Searching for a Trace Record Use the [Trace Find] dialog box to search for a trace record. To open this dialog box, choose [Find...] from the popup menu. The [Trace Find] dialog box has the following options: Table 5.4 [Trace Find] Dialog Box Pages Page Description... - Page 252 (1) [General] page Set the range for searching. Figure 5.62 [Trace Find] Dialog Box ([General] Page) [Trace search range]: Sets the range for searching. [Not designation]: Searches for information that does not match the conditions set in other pages when this box is checked. [Upward search]: Searches upwards when this box is checked.
- Page 253 (2) [Address] page Set an address condition. Figure 5.63 [Trace Find] Dialog Box ([Address] Page) [Don't care]: Detects no address when this box is checked. [Setting]: Detects the specified address. [Value]: Enter the address value (not available when [Don’t care] has been checked).
- Page 254 (3) [Data] page Set a data condition. Figure 5.64 [Trace Find] Dialog Box ([data] Page) [Don't care]: Detects no data when this box is checked. [Setting]: Detects the specified data. [Value]: Enter the data value (not available when [Don’t care] has been checked).
- Page 255 (4) [R/W] page Select the type of access cycles. Figure 5.65 [Trace Find] Dialog Box ([R/W] Page) [Don't care]: Detects no read/write condition when this box is checked. [Setting]: Detects the specified read/write condition. [String]: Select a read/write condition (not available when [Don’t care] has been checked).
- Page 256 (5) [Type] page Select the type being accessed. The selection is not available when a time stamp is acquired. Figure 5.66 [Trace Find] Dialog Box ([Type] Page) [Don't care]: Detects no type condition when this box is checked. [Setting]: Detects the specified type condition. [String]: Select a type condition (not available when [Don’t care] has been checked).
- Page 257 (6) [Bus] page Select the status of a bus. Figure 5.67 [Trace Find] Dialog Box ([Bus] Page) [Don't care]: Detects no bus condition when this box is checked. [Setting]: Detects the specified bus condition. [String]: Select a bus condition (not available when [Don’t care] has been checked).
-
Page 258: Clearing The Trace Information
5.7.5 Clearing the Trace Information When [Clear] is selected from the popup menu, the trace buffer that stores the trace information becomes empty. 5.7.6 Saving the Trace Information in a File Select [Save...] from the popup menu to open the [Save As] file dialog box, which allows the user to save the information displayed in the [Trace] window as a text file. -
Page 259: Temporarily Stopping Trace Acquisition
5.7.9 Temporarily Stopping Trace Acquisition To temporarily stop trace acquisition during execution of the user program, select [Halt] from the popup menu. This stops trace acquisition and updates the trace display. Use this method to check the trace information without stopping execution of the user program. 5.7.10 Extracting Records from the Acquired Information Use the filtering function to extract the records you need from the acquired trace information. - Page 260 Filtering conditions can be changed several times to analyze data because the content of the trace buffer is not changed by filtering. (1) [General] page Set the range for filtering. Figure 5.68 [Trace Filter] Dialog Box ([General] Page) [Don't care other pages]: Only selects the cycle number when this box is checked. Other options become invalid.
- Page 261 (2) [Address] page Set address conditions. Figure 5.69 [Trace Filter] Dialog Box ([Address] Page) [Don't care]: Detects no address when this box is checked. [Setting]: Detects the specified address. [Point]: Specifies a single address (not available when [Don’t care] has been checked). [Range]: Specifies an address range (not available when [Don’t care] has been checked).
- Page 262 (3) [Data] page Set a data condition. Figure 5.70 [Trace Filter] Dialog Box ([data] Page) [Don't care]: Detects no data when this box is checked. [Setting]: Detects the specified data. [Point]: Specifies single data (not available when [Don’t care] has been checked). [Range]: Specifies a data range (not available when [Don’t care] has been checked).
- Page 263 (4) [R/W] page Select the type of access cycles. Figure 5.71 [Trace Filter] Dialog Box ([R/W] Page) [Don't care]: Detects no read/write condition when this box is checked. [Setting]: Detects the specified read/write condition. READ: Detects read cycles when this box is checked (not available when [Don’t care] has been checked).
- Page 264 (5) [Type] page Select the type being accessed. The selection is not available when a time stamp is acquired. Figure 5.72 [Trace Filter] Dialog Box ([Type] Page) [Don't care]: Detects no type condition when this box is checked. [Setting]: Detects the specified type condition (not available when [Don’t care] has been checked).
- Page 265 (6) [Bus] page Select the status of a bus. The selection is not available when a time stamp is acquired. Figure 5.73 [Trace Filter] Dialog Box ([Bus] Page) [Don't care]: Detects no bus condition when this box is checked. [Setting]: Detects the specified bus condition (not available when [Don’t care] has been checked).
-
Page 266: Analyzing Statistical Information
5.7.11 Analyzing Statistical Information Choose [Statistic…] from the popup menu to open the [Statistic] dialog box and analyze statistical information under the specified conditions. Figure 5.74 [Statistic] Dialog Box [Statistic Analysis]: Setting required for analysis of statistical information. [Default]: Sets a single input value or character string. [Range]: Sets the input value or character string as a range. - Page 267 [End]: Specify the end value if a range has been set (only available when [Range] has been selected). [Set]: Adds a new condition to the current one. [New]: Creates a new condition. [Result] button: Obtains the result of statistical information analysis. [Clear]: Initializes the settings.
-
Page 268: Extracting Function Calls From The Acquired Trace Information
5.7.12 Extracting Function Calls from the Acquired Trace Information To extract function calls from the acquired trace information, select [Function Call…] from the popup menu. The [Function Call Display] dialog box will be displayed. Figure 5.75 [Function Call Display] Dialog Box [Setting]: Selects whether or not to extract function calls. -
Page 269: Analyzing Performance
Analyzing Performance Use the performance analysis function to measure execution performance. The emulator has three types of performance analysis functions: on-chip performance analysis (Onchip Performance Analysis), AUD performance analysis (AUD Performance Analysis), and external bus performance analysis (BUS Performance Analysis). For details on the performance analysis functions, refer to section 1.3.7, Performance Measurement Function. - Page 270 Note: The measurement conditions and the number of channels for the on-chip performance analysis function differ depending on the product. The time measurement continues even if a break occurs before execution reaches the measurement stop address (after passing the measurement start address) of the AUD performance function. When a measurement channel is double-clicked or selected and [Set...] is selected from the popup menu in this window, the [Performance Analysis] dialog box is opened and measurement conditions can be modified.
-
Page 271: Opening The [Aud Performance Analysis] Window
5.8.2 Opening the [AUD Performance Analysis] Window To open the [AUD Performance Analysis] window, choose [View -> Performance -> Performance Analysis] or click the [PA] toolbar button ( ) to open the [Select Performance Analysis Type] dialog box. Figure 5.79 [Select Performance Analysis Type] Dialog Box Select [AUD Performance] and click the [OK] button to open the [Performance Analysis] window. - Page 272 When a measurement channel is double-clicked or selected and [Set...] is selected from the popup menu in this window, the [Performance Analysis AUD Channel x] dialog box is opened and measurement conditions can be modified. Figure 5.81 [Performance Analysis AUD Channel x] Dialog Box [Start Point [aud event chx]]: Displays the start pointer condition of the measurement channel.
- Page 273 Figure 5.82 Editing the AUD Performance Analysis Measurement Condition (Dialog Box for Setting the AUD Event) Notes: 1. When the AUD performance analysis function is used, set [Performance start/stop] on the [Action] page of each channel. 2. When the measurement condition is modified, the contents are reflected on the [AUD Event] sheet in the [Event] window.
-
Page 274: Opening The [Bus Performance Analysis] Window
5.8.3 Opening the [BUS Performance Analysis] Window To open the [BUS Performance Analysis] window, choose [View -> Performance -> Performance Analysis] or click the [PA] toolbar button ( ) to open the [Select Performance Analysis Type] dialog box. Figure 5.83 [Select Performance Analysis Type] Dialog Box Select [BUS Performance] and click the [OK] button to open the [Performance Analysis] window. - Page 275 Select either of the following three modes according to the purpose of measurement. Available Measurement Modes Mode Description Purpose Time Of Specified Range Measures the execution time and Measurement of time taken for Measurement execution count in the specified processing of functions except for range.
- Page 276 Figure 5.85 [Performance Analysis BUS Channel x] Dialog Box [Measurement Method]: Specifies the measurement mode. [Specified Range measurement]: Measurement within the specified range. [Start Point to End Point measurement]: Measurement between specified addresses. [Start Range to End Range measurement]: Measurement between specified ranges. [Count Up Mode]: Specifies the counting-up method of execution counts.
- Page 277 [End Address]: Enters the end address. [Extend Condition]: Sets the extension condition. [End Range]: Sets the measurement end condition for Start Range to End Range measurement. [Start Address]: Enters the start address. [End Address]: Enters the end address. [Extend Condition]: Sets the extension condition. [Enable Count Overflow Break]: A break occurs if the execution count exceeds the specified count.
-
Page 278: Hiding The Column
Clicking the [Extend Condition...] button opens the dialog box to set the extension condition. The bus state condition can be set. When the range is selected as the measurement condition, the read cycle is selected. Figure 5.86 Dialog Box for Setting the Bus Performance Analysis Extension Condition 5.8.4 Hiding the Column It is possible to hide any column not necessary in the [Performance Analysis] window. -
Page 279: Deleting All Measurement Conditions
5.8.7 Deleting All Measurement Conditions Select [Reset All] from the popup menu to delete all the conditions that have been set. Viewing the Profile Information The profile function enables function-by-function measurement of the performance of the application program in execution. This makes it possible to identify parts of an application program that degrade its performance and the reasons for such degradation. - Page 280 Figure 5.87 [Standard Toolchain] Dialog Box (1)
-
Page 281: Profile Information Files
5.9.2 Profile Information Files To create a profile information file, choose the [Output Profile Information Files…] menu option from the pop-up menu of the [Profile] window and specify the file name, after measuring a profile data of the application program. This file contains information on the number of times functions are called and global variables are accessed. -
Page 282: Loading Stack Information Files
5.9.3 Loading Stack Information Files You can select whether or not to read the stack information file in a message box for confirmation that is displayed when a load module is loaded. Clicking the [OK] button of the message box loads the stack information file. -
Page 283: Enabling The Profile
5.9.4 Enabling the Profile Choose [View->Performance->Profile] to open the [Profile] window. Choose [Enable Profiler] from the pop-up menu of the [Profile] window. The item on the menu will be checked. 5.9.5 Specifying Measuring Mode You can specify whether to trace functions calls while profile data is acquired. When function calls are traced, the relations of function calls during user program execution are displayed as a tree diagram. -
Page 284: List] Sheet
5.9.7 [List] Sheet This sheet lists functions and global variables and displays the profile data for each function and variable. Figure 5.90 [List] Sheet Clicking the column header sorts the items in an alphabetical or ascending order. Double-clicking the [Function/Variable] or [Address] column displays the source program corresponding to the address in the line. -
Page 285: Tree] Sheet
5.9.8 [Tree] Sheet This sheet displays the relation of function calls along with the profile data that are values when the function is called. This sheet is available when [Disable Tree (Not traces function call)] is not selected from the pop-up menu in the [Profile] window. Figure 5.91 [Tree] Sheet Double-clicking a function in the [Function] column expands or reduces the tree structure display. - Page 286 To display the relation of function calls in the [Tree] sheet of the [Profile] window, acquire profile data without selecting this menu. In addition, do not select this menu when optimizing the program by the optimizing linkage editor using the acquired profile information file. •...
- Page 287 • Output Text File… Displays the [Save Text of Profile Data] dialog box. Displayed contents are saved in a text file. • Setting This menu has the following submenus (the menus available only in the [List] sheet are also included). ⎯...
-
Page 288: Profile-Chart] Window
5.9.9 [Profile-Chart] Window The [Profile-Chart] window displays the relation of calls for a specific function. This window displays the specified function in the middle, with the callers of the function on the left and the callees of the function on the right. The numbers of times the function calls the called functions or is called by the calling functions are also displayed in this window. -
Page 289: Creating Profile Information Files
Profile Data Measurement of a variety of CPU-specific data is also available as well as items that can be measured with the performance measurement function. For details, refer to the online help. 5.9.11 Creating Profile Information Files To create a profile information file, choose the [Output Profile Information Files…] menu option from the pop-up menu. -
Page 290: Notes
5.9.12 Notes 1. Tolerances The profiling function internally breaks user program execution, collects the measured data, and re-executes the user program. Since the function also counts when the measured item is generated at break or re-execution, tolerances will be included in the measured profile value. The measured value of this function should be the reference. - Page 291 3. Others (a) When the profiling function is used, an internal break occurs in the execution of the user program. Therefore, the measurement results of AUD performance analysis, bus performance analysis, and realtime profile will contain errors. (b) When the profiling function is used, the contents that have been set in the on-chip performance measurement function or data that has been measured will be deleted.
-
Page 292: Viewing Realtime Profile Information
5.10 Viewing Realtime Profile Information The realtime profiling function is used to measure the execution performance in the specified range of the application program in a function unit. This function is effective to investigate the position and the cause of the lowered performance in the application program. The realtime profiling function does not affect the realtime operation because it measures the performance by using the profiler measurement circuit on the main unit case and expansion profiling unit of the emulator. - Page 293 (iii) Recursive function The execution time of the recursive function can be correctly measured, however, the execution count will be once. (iv) AUD trace The realtime profiling function uses the data that is output in AUD trace. Therefore, when the function is used in the realtime trace mode, the trace data may be lost and correct measurement will not be performed.
- Page 294 (ii) Relationships between the Go-start address, break address, and measurable ranges f( ){ Starts execution from function g g( ){ h( ){ g( ); k( ){ h( ); k( ); Figure 5.96 Measurable Ranges (Function Mode) Measurable ranges when a break occurs at the position of black circle: •...
- Page 295 (3) Restrictions on using the nest mode (i) Tail call ⎯ When a tail call is used for a function as shown below, the return value of the callee function becomes the return address of the caller function. The execution time of the callee function cannot be measured correctly but the execution counts can be masured.
- Page 296 ⎯ There is a restriction when the tail call is used to call another function from the function that has been called by the tail call. If the tail call occurs continuously, three-step measurement will be correctly performed. f( ){ g( ){ h( ){ g( );...
- Page 297 (iv) Relationships between the Go-start address, break address, and measurable ranges f( ){ Starts execution from function g g( ){ h( ){ g( ); k( ){ h( ); k( ); Figure 5.99 Measurable Ranges (Nest Mode) Measurable ranges when a break occurs at the position of black circle: •...
-
Page 298: Opening The [Realtime Profile] Window
5.10.1 Opening the [Realtime Profile] Window Select [View -> Performance -> Realtime Profile] to open the [Realtime Profile] window. Clicking the column header changes the ascending or descending order of items in displayed contents. Figure 5.100 [Realtime Profile] Window The following information can be acquired: Address You can see the locations in memory to which the functions are allocated. -
Page 299: Specifying The Measurement Range
5.10.2 Specifying the Measurement Range Clicking the right-hand mouse button on the window displays the popup menu. When [Add Range] is selected from the popup menu, the [EDIT] dialog box opens to specify the measurement range of realtime profile. Figure 5.101 [EDIT] Dialog Box When the expansion profiling unit is connected to the emulator, it is possible to measure the profile information within the 6-Mbyte ranges in total. -
Page 300: Starting Measurement
Figure 5.102 [Select Page] Dialog Box 5.10.3 Starting Measurement When the user program is executed, measurement is started. When the user program is halted, the measurement result is displayed in the [Realtime Profile] window. 5.10.4 Clearing Measurement Result Selecting [Clear Data] from the popup menu clears the measurement result of the [Column] and [Time] columns. - Page 301 At 400 ns, the maximum time that can be measured is about 61 hours. To change the minimum unit, select [Set] from the popup menu of the [Realtime Profile] window and open the [Properties] dialog box. Figure 5.103 [Properties] Dialog Box Note: Be sure to set the following when using the realtime profiling function: •...
-
Page 302: Acquiring Code Coverage
5.11 Acquiring Code Coverage The emulator acquires code coverage information (C0 coverage) from the address range specified by the user and displays the results. Notes: 1. The information on the executed delay slot cannot be acquired. 2. Be sure to set the following when using the code coverage function: •... - Page 303 [Enable]: Checking this box allows acquisition of code coverage information. [Coverage acquisition start address (Mainboard, 4M)]: The emulator specifies the measurement start address in the range of 4 Mbytes. [Coverage acquisition start address (Optionboard, 8M)]: The emulator specifies the measurement start address in the range of 8 Mbytes.
- Page 304 In this dialog box, specify a range to be shown in the [Code Coverage] window. [New Window]: Specifies a new coverage range. [Start address]: Enter the start address of coverage information to be displayed (in hexadecimal when the prefix is omitted).
- Page 305 [Code Coverage] Window (Specifying an Address) Figure 5.106 [Code Coverage] Window (Specifying an Address) The [Code Coverage] window is divided into two by the splitter. • Left-hand window Displays the coverage range and statistical information of the coverage. The items are displayed as follows: [Range]: Address range...
- Page 306 • Right-hand window Displays coverage information at the C/C++ or assembly-language level. The items are displayed as follows: [Executed]: 1 (the instruction was executed) or 0 (the instruction was not executed) [Address]: Instruction address [Assembler]: Disassembled program [Source]: C/C++ or assembly source program [Code Coverage] Window (Specifying a Source File) Figure 5.108 [Code Coverage] Window (Specifying a Source File) This window is divided into two by the splitter.
-
Page 307: Displaying A Source File
• Right-hand window Displays coverage information of the function selected by double-clicking on the left-hand window at the C/C++ or assembly-language level. The items are displayed as follows: [Executed]: 1 (the instruction was executed) or 0 (the instruction was not executed) [Address]: Instruction address [Assembler]:... -
Page 308: Changing The Coverage Range To Be Displayed
5.11.4 Changing the Coverage Range to be Displayed • When the coverage range for display has been specified by address Selecting [Set Range…] from the popup menu opens the [Coverage Display Range] dialog box, which allows the user to change the condition for acquisition of information on executed instructions. - Page 309 • When the coverage range for display has been specified by a source file Selecting [Set Range…] from the popup menu opens the [Coverage Display Range] dialog box, which allows the user to change the condition for acquisition of information on executed instructions.
-
Page 310: Clearing The Coverage Information
5.11.5 Clearing the Coverage Information • Clearing the coverage information of the specified range Selecting [Clear Coverage Range…] from the popup menu opens the [Clear Coverage Range] dialog box. Figure 5.112 [Clear Coverage Range] Dialog Box Enter the start and end addresses of the range to be cleared. Clicking the [OK] button clears the coverage information of the selected range. -
Page 311: Loading Coverage Information From A File
5.11.7 Loading Coverage Information from a File Selecting [Load Data…] from the popup menu opens the [Load Data] dialog box. Figure 5.114 [Load Data] Dialog Box Specify the location of the coverage information file to be loaded. A placeholder or the [Browse…] button can be used. -
Page 312: Confirmation Request] Dialog Box
5.11.10 [Confirmation Request] Dialog Box • Clearing code coverage information or closing the [Code Coverage] window A confirmation dialog box appears before clearing code coverage information or closing the [Code Coverage] window. Figure 5.115 [Confirmation Request] Dialog Box When [Save Coverage Data] is checked, the coverage data can be saved into a file before clearing. Clicking the [OK] button clears the coverage information. - Page 313 • When [File -> Save Session] has been selected When one or more [Code Coverage] windows are open, the number of [Save Code Coverage] dialog boxes to be opened is the same as that of the [Code Coverage] window(s). The data of the windows can be saved separately or together.
-
Page 314: Displaying Code Coverage Information In The [Editor] Window
5.11.11 Displaying Code Coverage Information in the [Editor] Window Highlighting the Code Coverage column that corresponds to a source line where an instruction has been executed allows the coverage information to also be displayed in the [Editor] window. If the user changes any setting regarding the coverage information in the [Code Coverage] window, the content of the corresponding Code Coverage column will also be updated. -
Page 315: Synchronizing Multiple Debugging Platforms
Workshop applications cannot be nested (no slave High-performance Embedded Workshop can initiate another slave High-performance Embedded Workshop). When selecting [Renesas High-performance Embedded Workshop] -> [High-performance Embedded Workshop] from [Programs] in the [Start] menu to initiate another High-performance Embedded Workshop, two emulators can be used separately for debugging. -
Page 316: Distinguishing Two Emulators
5.12.1 Distinguishing Two Emulators Connect two emulators to the USB connector. Then, initiate the High-performance Embedded Workshop using the tutorial workspace. The following message is displayed. Figure 5.118 Message for Driver Selection Click the [OK] button. The following dialog box will appear. Figure 5.119 [Driver Details] Dialog Box (1) - Page 317 Select [Renesas E-Series USB Driver] from the [Driver] drop-down list box and open the [Channel] drop-down list box. Channel information for two emulators is displayed in the [Channel] drop-down list box as shown in figure 5.120. Figure 5.120 [Driver Details] Dialog Box (2) Information displayed in figure 5.120 is that of the serial number of the emulator.
-
Page 319: Section 6 Tutorial
Section 6 Tutorial 6.1 Introduction This section describes the main functions of the emulator by using a tutorial program. The tutorial program is based on the C++ program that sorts ten random data items in ascending or descending order. The tutorial program performs the following actions: •... -
Page 320: Running The High-Performance Embedded Workshop
6.2 Running the High-performance Embedded Workshop To run the High-performance Embedded Workshop, refer to section 4.1, System Check. 6.3 Setting up the Emulator The clocks which are used for data communications must be set up on the emulator before the program is downloaded. -
Page 321: Setting The [Configuration] Dialog Box
6.4 Setting the [Configuration] Dialog Box • Select [Emulator] then [Systems…] from the [Options] menu to set a communication clock. The [Configuration] dialog box is displayed. Figure 6.1 [Configuration] Dialog Box • Set appropriate values in the [AUD clock] and [JTAG clock] combo boxes. The clock also operates with the default value. -
Page 322: Checking The Operation Of The Target Memory For Downloading
6.5 Checking the Operation of the Target Memory for Downloading Check that the destination memory area for downloading is operating correctly. When the destination memory is SDRAM or DRAM, a register in the bus controller of the MPU must be set before downloading. Set the bus controller correctly in the [IO] window according to the memory type to be used. - Page 323 • Click the [OK] button. The [Memory] window is displayed and shows the specified memory area. Figure 6.3 [Memory] Window • Placing the mouse cursor on a point in the display of data in the [Memory] window and double-clicking allows the values at that point to be changed. Data can also be directly edited around the current position of the text cursor.
-
Page 324: Downloading The Tutorial Program
6.6 Downloading the Tutorial Program 6.6.1 Downloading the Tutorial Program Download the object program to be debugged. • Select [Download module] from [Tutorial.abs] under [Download modules]. Figure 6.4 Downloading the Tutorial Program... -
Page 325: Displaying The Source Program
6.6.2 Displaying the Source Program The High-performance Embedded Workshop allows the user to debug a user program at the source level. • Double-click [tutorial.cpp] under [C++ source file]. Figure 6.5 [Source] Window (Displaying the Source Program) • Select a font and size that are legible from the [Format Views…] option in the [Setup] menu if necessary. -
Page 326: Setting A Pc Breakpoint
6.7 Setting a PC Breakpoint A PC breakpoint is a simple debugging function. The [Source] window provides a very simple way of setting a PC breakpoint at any point in a program. For example, to set a PC breakpoint at the sort function call: •... -
Page 327: Setting Registers
6.8 Setting Registers Set values of the program counter and the stack pointer before executing the program. • Select [Registers] from the [CPU] submenu of the [View] menu. The [Register] window is displayed. Figure 6.7 [Register] Window... - Page 328 • To change the value of the program counter (PC), double-click the value area in the [Register] window with the mouse. The following dialog box is then displayed, and the value can be changed. Set the program counter to H’00000800 in this tutorial program, and click the [OK] button.
-
Page 329: Executing The Program
6.9 Executing the Program Execute the program as described in the following: • To execute the program, select [Go] from the [Debug] menu, or click the [Go] button on the toolbar. Figure 6.10 [Go] Button When the program execution is started, ‘**RUNNING’ is displayed on the status bar, and then the executed PC address is displayed. - Page 330 Figure 6.11 [Source] Window (Break State)
- Page 331 The user can see the cause of the break that occurred last time in the [Status] window. • Select [Status] from the [CPU] submenu of the [View] menu. After the [Status] window is displayed, open the [Platform] sheet, and check the Status of Cause of last break. Figure 6.12 [Status] Window Note: The items that can be displayed in this window differ according to the product.
-
Page 332: Reviewing Breakpoints
6.10 Reviewing Breakpoints The user can see all the breakpoints set in the program in the [Event] window. • Select [Eventpoints] from the [Code] submenu of the [View] menu. The [Event] window is displayed. Select the [Breakpoint] sheet. Figure 6.13 [Event] Window The popup menu, opened by clicking the [Event] window with the right-hand mouse button, allows the user to set or change breakpoints, define new breakpoints, and delete, enable, or disable breakpoints. -
Page 333: Referring To Symbols
6.11 Referring to Symbols The [Label] window can be used to display the information on symbols in modules. Select [Label] from the [Symbol] submenu of the [View] menu. The [Label] window is displayed so that the user can refer to the addresses of symbols in modules. Figure 6.14 [Label] Window... -
Page 334: Viewing Memory
6.12 Viewing Memory When the label name is specified, the user can view the memory contents that the label has been registered in the [Memory] window. For example, to view the memory contents corresponding to _main in word size: • Select [Memory …] from the [CPU] submenu of the [View] menu, enter _main in the [Display Address] edit box. - Page 335 • Click the [OK] button. The [Memory] window showing the specified area of memory is displayed. Figure 6.16 [Memory] Window...
-
Page 336: Watching Variables
6.13 Watching Variables As the user steps through a program, it is possible to watch that the values of variables used in the user program are changed. For example, set a watch on the long-type array a declared at the beginning of the program, by using the following procedure: •... - Page 337 The user can also add a variable to the [Watch] window by specifying its name. • Click the [Watch] window with the right-hand mouse button and select [Add Watch…] from the popup menu. The following dialog box will be displayed. Enter variable i. Figure 6.19 [Add Watch] Dialog Box •...
- Page 338 The user can click mark ‘+’ at the left side of array a in the [Watch] window to watch all the elements. Figure 6.21 [Watch] Window (Displaying Array Elements)
-
Page 339: Displaying Local Variables
6.14 Displaying Local Variables The user can display local variables in a function using the [Locals] window. For example, we will examine the local variables in the main function, which declares four local variables: a, j, i, and p_sam. • Select [Locals] from the [Symbol] submenu of the [View] menu. The [Locals] window is displayed. -
Page 340: Stepping Through A Program
6.15 Stepping Through a Program The High-performance Embedded Workshop provides a range of step menu commands that allow efficient program debugging. Table 6.1 Step Option Menu Description Command Step In Executes each statement, including statements within functions. Step Over Executes a function call in a single step. Step Out Steps out of a function, and stops at the statement following the statement in the program that called the function. - Page 341 Figure 6.24 [Source] Window (Step In) • The highlighted line moves to the first statement of the sort function in the [Source] window.
-
Page 342: Executing [Step Out] Command
6.15.2 Executing [Step Out] Command The [Step Out] command steps out of the called function and stops at the next statement of the calling statement in the main function. • To step out of the sort function, select [Step Out] from the [Debug] menu, or click the [Step Out] button on the toolbar. -
Page 343: Executing [Step Over] Command
6.15.3 Executing [Step Over] Command The [Step Over] command executes a function call as a single step and stops at the next statement of the main program. • Move to the change function following the procedures described in section 6.15.1, Executing [Step In] Command. -
Page 344: Forced Breaking Of Program Executions
6.16 Forced Breaking of Program Executions The High-performance Embedded Workshop can force a break in the execution of a program. • Cancel all breaks. • To execute the remaining sections of the main function, select [Go] from the [Debug] menu or the [Go] button on the toolbar. -
Page 345: Break Function
6.17 Break Function The emulator has PC break functions and break functions by eventpoints. With the High- performance Embedded Workshop, a PC breakpoint can be set using the [Breakpoint] sheet of the [Event] window. The eventpoint condition setting can be set by the event type using the [Onchip Event], [AUD Event], [Other Event], and [BUS Event] sheets. - Page 346 • Click the [Event] window with the right-hand mouse button and select [Add…] from the popup menu. • Enter H'00001098 in the [Address] edit box. Figure 6.32 [Breakpoint] Dialog Box Note: This dialog box differs according to the product. For the items of each product, refer to the online help.
- Page 347 The PC breakpoint that has been set is displayed in the [Event] window. Figure 6.33 [Event] Window (PC Breakpoint Setting) Note: The items that can be displayed in this window differ according to the product. For the items that can be displayed, refer to the online help. To stop the tutorial program at the PC breakpoint, the following procedure must be executed: •...
- Page 348 The program runs, and stops at the set PC breakpoint. Figure 6.34 [Source] Window at Execution Stop (PC Break)
- Page 349 The [Status] window displays the following contents. Figure 6.35 Displayed Contents of the [Status] Window (PC Break) Note: The items that can be displayed in this window differ according to the product. For the items that can be displayed, refer to the online help.
-
Page 350: Break Function By An Eventpoint
6.18 Break Function by an Eventpoint With this emulator, an Onchip Eventpoint, AUD Eventpoint, Other Eventpoint, and BUS Eventpoint can be set. An example of how to set a break using an Onchip Eventpoint is shown below. For other eventpoint setting methods, refer to section 5.6, Using the Eventpoints. 6.18.1 Setting the Break by an Onchip Eventpoint A method is given below in which the address bus condition is set under event channel 1 (Ch1 (IA_OA)) of the Onchip Eventpoint. - Page 351 • Select a line of Ch1(IA_OA) in the [Event] window. When highlighted, double-click this line. Figure 6.36 [Event] Window ([Onchip Event] Sheet) • The [Event condition 1] dialog box is displayed. • Clear the [Don't care] check box in the [Address] page. •...
- Page 352 Figure 6.37 [Address] Page ([Event condition 1] Dialog Box) Note: The items that can be set in this dialog box differ according to the product. For details on the settings for each product, refer to the online help.
- Page 353 • Click the [OK] button. • The first point display in the State line changes from Disable to Enable. • The first point display in the Condition line changes from None to Address = H’00001084 pc. • Set the program counter and stack pointer values (PC = H’00000800 and R15 = H’00010000) that were set in section 6.8, Setting Registers, in the [Register] window.
- Page 354 The [Status] window displays the following contents. Figure 6.39 Displayed Contents of the [Status] Window (Onchip Event Ch1(IA_OA)) Note: The items that can be displayed in this window differ according to the product. For the items that can be displayed, refer to the online help.
-
Page 355: Setting The Sequential Onchip Eventpoint
6.18.2 Setting the Sequential Onchip Eventpoint The sequential break is enabled by the combination of Onchip Eventpoints. Set the satisfaction conditions of Onchip Eventpoint as follows: Ch1(IA_OA): A break condition is satisfied immediately before when an instruction of address H'00001084 is executed. Ch2(IA_OA_DT_CT): A break condition is satisfied immediately before when an instruction of address H'0000106C is executed. - Page 356 • Select the [2 Channel Sequential] radio button and [Channel 2 -> 1], and click the [OK] button. When the setting is completed, the [Event] window will be as shown in figure 6.41. Figure 6.41 [Onchip Event] Sheet Note: The items that can be displayed in this dialog box differ according to the product. For the items that can be displayed, refer to the online help.
- Page 357 The program runs and then stops at the condition specified under event channel 1. Figure 6.42 [Source] Window at Execution Stop (Sequential Break)
- Page 358 The [Status] window displays the following contents. Figure 6.43 Displayed Contents of the [Status] Window (Sequential Break) Note: The items that can be displayed in this window differ according to the product. For the items that can be displayed, refer to the online help. •...
-
Page 359: Trace Functions
6.19 Trace Functions The emulator has the five trace functions listed below. • Internal Trace Function Since this function uses the trace buffer built into the MPU, a realtime trace can be acquired. The following information can be acquired: • Types of trace information: Branch information, memory access information from the CPU, and PC or Rn value during the Trace Rn instruction execution •... - Page 360 • Operands • Source lines Notes: 1. The AUD trace function is not supported for all products. For details on the specifications of each product, refer to the online help. 2. The types of trace information that can be acquired by an AUD trace function differ according to the product.
-
Page 361: Displaying The [Internal/Aud/Usermemory Trace] Window
• Trace Function as the I/O Analyzer Function The emulator can acquire a trace as part of the I/O analyzer function. 6.19.1 Displaying the [Internal/AUD/Usermemory trace] Window Select [Trace] from the [Code] submenu of the [View] menu. The [Trace Window Type] dialog box is displayed. - Page 362 Figure 6.45 [Internal/AUD/Usermemory acquisition] Dialog Box Select [Internal trace] for [Trace Type] and click the [OK] button.
- Page 363 (b) Setting the trace acquisition condition The following is an example of acquiring branch source and branch destination information. For acquiring other trace information, refer to section 5.6, Using the Eventpoints. Select and double-click [Ch12 (Branch)] on the [Onchip Event] sheet of the [Event] window. The [Event condition 12] dialog box will appear.
- Page 364 (c) Displaying the trace result Run the program as shown in the example of section 6.17.1, PC Break Function. The internal trace results are displayed in the [Internal/AUD/Usermemory trace] window after the program execution is completed. Figure 6.47 [Internal/AUD/Usermemory trace] Window •...
- Page 365 (2) AUD trace function This function is available when the AUD pin of the MPU is connected to the emulator. An Onchip Eventpoint must be set in order to output MPU information from the AUD pin. The following is an example of acquiring memory access information between addresses H’FFC0 to H’FFE4 (array a).
- Page 366 Figure 6.48 Setting the Onchip Eventpoint (Ch5(OA) Channel) • Input H’0 into the [Start address] and H’10000 into the [End address]. • In the [Action] page, select [acquire trace] and double-click the [OK] button. (b) Setting the trace acquisition mode Display the [Internal/AUD/Usermemory trace] window.
- Page 367 Figure 6.49 [Internal/AUD/Usermemory acquisition] Dialog Box...
- Page 368 [Trace type]: Selects the type of trace function. [AUD trace] Selects the AUD trace function. [Internal trace] Selects the internal trace function. [User Memory trace] Selects the user-memory output trace function. [Trace Mode 1]: Selects the operation mode when the trace information has been sequentially generated.
- Page 369 (c) Setting the trace acquisition condition The following is an example of acquiring memory access information. For acquiring other trace information, refer to section 5.6, Using the Eventpoints. Select and double-click [Ch2 (Delay)] on the [AUD Event] sheet of the [Event] window. The [Ch2 (Delay)] dialog box will appear.
- Page 370 Figure 6.51 [Ch2 (Delay)] Dialog Box ([Windows] Page) • Select [Range] to acquire trace in the address range. • Input H’FFC0 and H’FFE4 into [Start] and [End], respectively. • Memory access information between addresses H’FFC0 to H’FFE4 (array a) is acquired. •...
- Page 371 (d) Displaying the trace result Run the program as shown in the example of section 6.17.1, PC Break Function. The trace results are displayed in the [Internal/AUD/Usermemory trace] window after the program execution is completed. Figure 6.52 [Internal/AUD/Usermemory trace] Window (Example) •...
- Page 372 (3) Memory Output Trace Function This function is used to write the trace result to the specified memory range. The following shows the procedure for acquiring the memory output trace function. (a) Setting the trace acquisition mode Display the [Internal/AUD/Usermemory trace] window. Click this window with the right-hand mouse button and select [Acquisition…] from the popup menu to display the [Internal/AUD/Usermemory acquisition] dialog box.
- Page 373 Figure 6.53 [Internal/AUD/Usermemory acquisition] Dialog Box...
- Page 374 [Trace type]: Selects the type of trace function. [AUD trace] Selects the AUD trace function. [Internal trace] Selects the internal trace function. [User Memory trace] Selects the user-memory output trace function. [Trace Mode 1]: Selects the operation mode when the trace information has been sequentially generated.
- Page 375 (b) Setting the trace acquisition condition The setting for the acquisition condition of the memory output trace function is the same as that of the internal trace function. Refer to section 6.19.1 (1), Internal trace function. (c) Displaying the trace result Run the program as shown in the example of section 6.17.1, PC Break Function.
-
Page 376: Displaying The [Bus/Mfi Trace] Window
6.19.2 Displaying the [BUS/MFI trace] Window Select [Trace] from the [Code] submenu of the [View] menu. The [Trace Window Type] dialog box is displayed. Figure 6.55 [Trace Window Type] Dialog Box Select [BUS/MFI trace] and click the [OK] button. The [BUS/MFI trace] window will appear. - Page 377 External bus trace function This function is enabled when the external bus pins of the MPU are connected to the emulator. The methods to acquire the external bus trace are described below. (a) Setting the bus trace Set the multiplexed state of the bus pins or the connected memory, referring to section 2.7.2, External Bus Trace/Break Function and External Bus Performance Function.
- Page 378 (c) Setting the trace acquisition condition The following is an example of setting the address condition. For setting other trace conditions, refer to section 5.6, Using the Eventpoints. Select and double-click [Ch3 (Normal)] on the [BUS Event] sheet of the [Event] window. The [Ch3 (Normal)] dialog box will appear.
- Page 379 (d) Displaying the trace result Run the program as shown in the example of section 6.17.1, PC Break Function. The internal trace results are displayed in the [BUS/MFI trace] window after the program execution is completed. Figure 6.58 [BUS/MFI trace] Window •...
-
Page 380: Mmu Support
6.20 MMU Support This function can be used when the supported MPU has an MMU. • TLB window In the emulator, the contents of the TLB table can be easily displayed and edited by selecting [CPU -> TLB] from the [View] menu. For details, refer to the online help. •... - Page 381 Then, enable the VP_MAP tables. (When the tables are disabled, addresses are not translated.) >ve enable (RET) >vd (RET) <VADDR_TOP> <VADDR_END> <PADDR_TOP> 00010000 00010fff 04000000 00011000 00011fff 00000000 ENABLE Here, virtual addresses correspond to physical addresses as shown in figure 6.59. H'FFF H'10000 H'10FFF...
- Page 382 • When the Virtual radio button is selected: The address is translated according to the TLB. If the specified address is outside the TLB table settings, a TLB error will occur. Table 6.2 Address Translation Tables VP_MAP Within/ Radio Enabled/ Outside Enabled/ Within/Outside...
-
Page 383: Stack Trace Function
6.21 Stack Trace Function The emulator uses the information on the stack to display the names of functions in the sequence of calls that led to the function to which the program counter is currently pointing. Note: This function can be used only when the load module that has the Dwarf2-type debugging information is loaded. - Page 384 • Set the same program counter and stack pointer values (PC = H’00000800 and R15 = H’00010000) as were set in section 6.8, Setting Registers (again, use the [Register] window). Click the [Go] button. • If program execution is failed, reset the device and execute again the procedures above. •...
-
Page 385: Download Function To The Flash Memory Area
6.22 Download Function to the Flash Memory Area The emulator enables downloading to the external flash memory area. This function requires a program for writing the flash memory (hereinafter referred to as a write module), a program for erasing the flash memory (hereinafter referred to as an erase module), and the RAM area for downloading and executing these modules. - Page 386 Note: Write module: The write data for the access size is set to the R6 register. When the access size is word or byte, 0 is set to the upper bits of the R6 register. • Flash memory download method For downloading to the flash memory, set the items on the [Loading flash memory] page in the [Configuration] dialog box, which is opened from [System…], then [Emulator] from the [Options] menu.
- Page 387 Table 6.4 shows the options for the [Loading flash memory] page. Table 6.4 [Loading flash memory] Page Options Option Description [Loading flash memory] Sets Enable for flash memory downloading. radio button When Enable is selected, and [File load] is selected from the [File] menu for downloading, the write module is always called.
- Page 388 ⎯ The area for the write and erase modules must be set in an MMU-disabled space. • An example of downloading to the flash memory The following is an example of downloading to the flash memory manufactured by Intel Corporation (type number: G28F640J5-150) that has been connected as shown in figure 6.63. A sample is provided in the \Fmtool folder in the installation destination folder.
- Page 389 Table 6.6 Sample Program Specifications Item Contents RAM area to be used H'0C001000 to H'0C0015BF Write module start address H'0C001100 Erase module start address H'0C001000 • Since the SDRAM is used, the bus controller must be set. • Set the options on the [Loading flash memory] page in the [Configuration] dialog box as follows:...
- Page 390 Figure 6.64 [Loading flash memory] Page Notes: 1. When the data has already been written in the flash memory, be sure to select [Enable] for [Erasing flash memory]. If [Disable] is selected, a verify error occurs. 2. When [Erasing flash memory] is selected, it takes about one minute to erase the flash memory (in this example).
-
Page 391: What Next
6.23 What Next? This tutorial has described the major features of the emulator and the use of the High-performance Embedded Workshop. Sophisticated debugging can be carried out by using the emulation functions that the emulator offers. This provides for effective investigation of hardware and software problems by accurately isolating and identifying the conditions under which such problems arise. -
Page 393: Section 7 Troubleshooting
Embedded Workshop, updating of the workspace is within the memory. The settings are not saved in a file unless the user intentionally saves the workspace. In addition to above, refer to FAQs on the emulator and High-performance Embedded Workshop on the Renesas web site (www.renesas.com). -
Page 395: Section 8 Maintenance And Guarantee
Section 8 Maintenance and Guarantee This section describes maintenance, guarantee, repair provisions, and how to request for repair of the emulator. User Registration When you purchase our product, be sure to register as a user. For user registration, refer to the section of ‘User Registration’... -
Page 396: Repair Provisions
Repair Provisions 8.4.1 Repair with Extra-Charge The products elapsed more than one year after purchase can be repaired with extra-charge. 8.4.2 Replacement with Extra-Charge If your product's fault falls in any of the following categories, the fault will be corrected by replacing the entire product instead of repair, or you will be advised to purchase new one, depending on the severity of the fault. -
Page 397: How To Make A Request For Repair
How to Make a Request for Repair If your product is found faulty, follow the procedure below to send your product for repair. Fill in the Repair Request Sheet included with this product, then send it along with this product for repair to your local distributor. -
Page 399: Appendix A Menus
Appendix A Menus Table A.1 shows GUI menus. Table A.1 GUI Menus Toolbar Menu Option Shortcut Button Remarks View Disassembly Ctrl + D Opens the [Disassembly] window. Command Line Ctrl + L Opens the [Command Line] window. Workspace Alt + K Opens the [Workspace] window. - Page 400 Table A.1 GUI Menus (cont) Toolbar Menu Option Shortcut Button Remarks View Sym- Labels Shift + Opens the [Labels] window. (cont) Ctrl + A Watch Ctrl + W Opens the [Watch] window. Locals Shift + Opens the [Locals] window. Ctrl + W Code Eventpoints Ctrl + E...
- Page 401 Table A.1 GUI Menus (cont) Toolbar Menu Option Shortcut Button Remarks Setup Radix Binary Uses a binary for displaying a (cont) (cont) radix in which the numerical values will be displayed and entered by default. Emu- System… Opens the [Configuration] dialog lator box allowing the user to modify the debugging platform settings.
- Page 402 Table A.1 GUI Menus (cont) Toolbar Menu Option Shortcut Button Remarks Debug Step Over Executes a block of user program (cont) before breaking. If a subroutine call is reached, then the subroutine will not be entered. Step Out Shift + Executes the user program to reach the end of the current function.
-
Page 403: Appendix B Command-Line Functions
Appendix B Command-Line Functions The emulator supports the commands that can be used in the command-line window. For details, refer to the online help. -
Page 405: Appendix C Notes On High-Performance Embedded Workshop
Appendix C Notes on High-performance Embedded Workshop Note on Moving Source File Position after Creating Load Module When the source file is moved after creating the load module, the [Open] dialog box may be displayed to specify the source file during the debugging of the created load module. Select the corresponding source file and click the [Open] button. - Page 406 The current directory may be altered by file specifications in commands. It is recommended to use absolute paths are recommended to be used to specify the files in a command file so that the current directory alteration is not affected. Example: FILE_LOAD C:\HEW3\Tools\Renesas\DebugComp\Platform \E200F\Tutorial\Tutorial\Debug_SHxxxx_E200F_SYSTEM \tutorial.abs 7. Memory Save During User Program Execution Do not execute memory save or verifying during user program execution.
- Page 407 9. Note on [Register] Window Operation During Program Execution The register value cannot be changed in the [Register] window during program execution. Even if the changed value is displayed, the register contents are not changed actually. 10. Break Function ⎯ BREAKPOINT cancellation When the contents of the BREAKPOINT address is modified during user program execution, the following message is displayed when the user program stops.
- Page 408 16. Scrolling Window During User Program Execution Do not scroll the [Memory] and [Disassembly] windows by dragging the scroll box during user program execution. This generates many memory reads causing the user program to stop execution until the memory reads have been completed. 17.
-
Page 409: Appendix D Repair Request Sheet
Appendix D Repair Request Sheet Thank you for purchasing the E200F emulator (R0E0200F0EMU00 or R0E0200F2EMU00). In the event of a malfunction, fill in the repair request sheet on the following pages and send it to your distributor. - Page 410 Repair Request Sheet To Distributor Your company name: Person in charge: Tel.: Item Symptom 1. Date and time when the Month/Day/Year {at system initiation, in system operation} malfunction occurred *Circle either of items in the braces { }. 2. Frequency of generation of the ( ) times in ( ) {day(s), week(s), or month(s)} malfunction *Enter the appropriate numbers in the parentheses ( ) and circle...
- Page 411 Item Symptom 4. Settings when the malfunction (1) Operating mode: Mode occurred (2) Voltage of the target system: (3) Clock in use: (input from Xtal oscillation or external clock) -circle one item. (4) Operating frequency: 5. Failure phenomenon 6. Error in debugging 7.
- Page 413 Publication Date: Rev.1.00, June 2, 2004 Rev.6.00, July 25, 2007 Published by: Sales Strategic Planning Div. Renesas Technology Corp. Edited by: Customer Support Department Global Strategic Communication Div. Renesas Solutions Corp. ©2007. Renesas Technology Corp., All rights reserved. Printed in Japan.
- Page 414 Nippon Bldg., 2-6-2, Ohte-machi, Chiyoda-ku, Tokyo 100-0004, Japan http://www.renesas.com RENESAS SALES OFFICES Refer to "http://www.renesas.com/en/network" for the latest and detailed information. Renesas Technology America, Inc. 450 Holger Way, San Jose, CA 95134-1368, U.S.A Tel: <1> (408) 382-7500, Fax: <1> (408) 382-7501 Renesas Technology Europe Limited Dukes Meadow, Millboard Road, Bourne End, Buckinghamshire, SL8 5FH, U.K.
- Page 416 SH-4A, SH4AL-DSP E200F Emulator User’s Manual...
Need help?
Do you have a question about the SH-4A and is the answer not in the manual?
Questions and answers