Sign In
Upload
Manuals
Brands
Renesas Manuals
Computer Hardware
SH4AL-DSP
Renesas SH4AL-DSP Manuals
Manuals and User Guides for Renesas SH4AL-DSP. We have
1
Renesas SH4AL-DSP manual available for free PDF download: User Manual
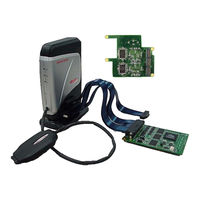
Renesas SH4AL-DSP User Manual (416 pages)
Microcomputer Development Environment System
Brand:
Renesas
| Category:
Computer Hardware
| Size: 4.39 MB
Table of Contents
Table of Contents
19
Section 1 Product Overview
25
Components
29
Emulator Hardware Configuration
30
Emulator Functions
44
Overview
44
Event Detection Functions
48
Trace Functions
51
Break Function
59
Probe Function
60
Peripheral I/O Analyzer Functions
60
Performance Measurement Function
61
Coverage Function
75
Memory Access Functions
76
Stack Trace Function
78
User-Interrupt Open Function During User Program Break
78
Online Help
78
Environmental Conditions
79
Section 2 Setting up the Emulator
81
Flow Chart before Using the Emulator
81
Installing Debugger
82
CD-R
82
Connecting the Optional Units to the Emulator Main Unit Case
83
Connecting the E200F Trace Unit to the User System
83
Connecting the E200F Peripheral I/O Analyzer Unit to the User System
86
Connecting the E200F Expansion Profiling Unit to the Main Unit Case
87
Connecting the AC Adapter to the Emulator Main Unit Case
93
Connecting the Emulator to the Host Machine
94
Connecting the Emulator to the User System
96
Connecting the E200F H-UDI/AUD Probe to the User System
97
Connecting System Ground
100
Changing the Settings
101
Changing the Functions When Using the E200F Main Unit
102
Changing the Functions When Using the External Bus Trace Unit
103
Changing the Functions When Using the Expansion Profiling Unit
104
Changing the Monitoring Function
105
Section 3 Hardware Specifications
107
List of Specifications
107
Interface Circuits in the Emulator
107
Reducing EMI Noise
112
Diagnostic Procedure
113
Installing the Diagnostic Program
113
Executing the Diagnostic Program
113
Creating a Log File
117
Section 4 Preparations for Debugging
119
System Check
119
Method for Activating High-Performance Embedded Workshop
127
Creating the New Workspace (Toolchain Not Used)
128
Creating the New Workspace (Toolchain Used)
132
Selecting an Existing Workspace
137
Setting at Emulator Activation
139
Debug Sessions
141
Selecting a Session
141
Adding and Removing Sessions
142
Saving Session Information
145
Connecting the Emulator
146
Reconnecting the Emulator
147
Ending the Emulator
148
Uninstalling the Emulator's Software
149
Section 5 Debugging
155
Setting the Environment for Emulation
155
Opening the [Configuration] Dialog Box
155
General] Page
156
Main Board] Page
159
Bus Board] Page
161
Option Board] Page
165
Downloading to the Flash Memory
167
Opening the [Memory Mapping] Dialog Box
169
Changing the Memory Map Setting
171
Downloading a Program
172
Viewing the Source Code
173
Viewing the Assembly-Language Code
178
Modifying the Assembly-Language Code
179
Viewing a Specific Address
180
Viewing the Current Program Counter Address
180
Displaying Memory Contents in Realtime
181
Opening the [Monitor] Window
182
Changing the Monitor Settings
184
Temporarily Stopping Update of the Monitor
185
Deleting the Monitor Settings
185
Monitoring Variables
185
Hiding the [Monitor] Window
187
Managing the [Monitor] Window
188
Viewing the Current Status
189
Reading and Displaying the Emulator Information Regularly
190
Opening the [Extended Monitor] Window
190
Selecting Items to be Displayed
191
Using the Eventpoints
192
PC Breakpoints
192
Eventpoints
192
Opening the [Event] Window
194
Setting PC Breakpoints
195
Setting Onchip Eventpoints
197
Setting AUD Eventpoints
206
Setting BUS Eventpoints
223
Setting Other Eventpoints
233
Editing Breakpoint or Eventpoint
238
Enabling Breakpoint or Eventpoint
238
Disabling Breakpoint or Eventpoint
238
Deleting Breakpoint or Eventpoint
238
Deleting All Breakpoints or Eventpoints
238
Viewing the Source Line for Breakpoints or Eventpoints
238
Viewing the Trace Information
239
Opening the [Internal/Aud/Usermemory Trace] Window
239
Opening the [BUS/MFI Trace] Window
247
Hiding the [Trace] Column
250
Searching for a Trace Record
251
Clearing the Trace Information
258
Saving the Trace Information in a File
258
Viewing the [Source] Window
258
Trimming the Source
258
Temporarily Stopping Trace Acquisition
259
Extracting Records from the Acquired Information
259
Analyzing Statistical Information
266
Extracting Function Calls from the Acquired Trace Information
268
Analyzing Performance
269
Opening the [Onchip Performance Analysis] Window
269
Opening the [AUD Performance Analysis] Window
271
Opening the [BUS Performance Analysis] Window
274
Hiding the Column
278
Starting Performance Data Acquisition
278
Deleting a Measurement Condition
278
Deleting All Measurement Conditions
279
Viewing the Profile Information
279
Stack Information Files
279
Profile Information Files
281
Loading Stack Information Files
282
Enabling the Profile
283
Specifying Measuring Mode
283
Executing the Program and Checking the Results
283
List] Sheet
284
Tree] Sheet
285
Profile-Chart] Window
288
Types and Purposes of Displayed Data
288
Creating Profile Information Files
289
Notes
290
Viewing Realtime Profile Information
292
Opening the [Realtime Profile] Window
298
Specifying the Measurement Range
299
Starting Measurement
300
Clearing Measurement Result
300
Deleting Measurement Range
300
Setting the Minimum Unit of the Measurement Time
300
Acquiring Code Coverage
302
Opening the [Code Coverage] Window
302
Displaying a Source File
307
Changing the Address to be Displayed
307
Changing the Coverage Range to be Displayed
308
Clearing the Coverage Information
310
Saving the Coverage Information to a File
310
Loading Coverage Information from a File
311
Updating Coverage Information
311
Preventing Update of Coverage Information
311
Confirmation Request] Dialog Box
312
Displaying Code Coverage Information in the [Editor] Window
314
Synchronizing Multiple Debugging Platforms
315
Distinguishing Two Emulators
316
Section 6 Tutorial
319
Introduction
319
Running the High-Performance Embedded Workshop
320
Setting up the Emulator
320
Setting the [Configuration] Dialog Box
321
Checking the Operation of the Target Memory for Downloading
322
Downloading the Tutorial Program
324
Displaying the Source Program
325
Setting a PC Breakpoint
326
Setting Registers
327
Executing the Program
329
Reviewing Breakpoints
332
Referring to Symbols
333
Viewing Memory
334
Watching Variables
336
Displaying Local Variables
339
Stepping through a Program
340
Executing [Step In] Command
340
Executing [Step Out] Command
342
Executing [Step Over] Command
343
Forced Breaking of Program Executions
344
Break Function
345
PC Break Function
345
Break Function by an Eventpoint
350
Setting the Break by an Onchip Eventpoint
350
Setting the Sequential Onchip Eventpoint
355
Trace Functions
359
Displaying the [Internal/Aud/Usermemory Trace] Window
361
Displaying the [BUS/MFI Trace] Window
376
MMU Support
380
Stack Trace Function
383
Download Function to the Flash Memory Area
385
What Next
391
Section 7 Troubleshooting
393
Section 8 Maintenance and Guarantee
395
User Registration
395
Maintenance
395
Guarantee
395
Repair Provisions
396
Repair with Extra-Charge
396
Replacement with Extra-Charge
396
Expiration of the Repair Period
396
Transportation Fees at Sending Your Product for Repair
396
How to Make a Request for Repair
397
Appendix A Menus
399
Appendix B Command-Line Functions
403
Appendix C Notes on High-Performance Embedded Workshop
405
Appendix D Repair Request Sheet
409
Advertisement
Advertisement
Related Products
Renesas SuperH SH-4A
Renesas SH7124
Renesas SH7670
Renesas SH7206
Renesas SH7147
Renesas SuperHTM Family SH7083
Renesas SH7050 Series
Renesas SH7144 Series
Renesas SH7046 Series
Renesas SuperHTM Family SH72546RFCC
Renesas Categories
Computer Hardware
Motherboard
Microcontrollers
Adapter
Switch
More Renesas Manuals
Login
Sign In
OR
Sign in with Facebook
Sign in with Google
Upload manual
Upload from disk
Upload from URL