Table of Contents
Advertisement
Quick Links
Advertisement
Table of Contents

Related Manuals for BIO RAD ZE5


Summary of Contents for BIO RAD ZE5
- Page 1 Cell Analyzer and ™ Everest Software ™ User Guide Version 2.0...
- Page 3 ZE5 Cell Analyzer and Everest Software User Guide Software Version 2.0...
- Page 4 Bio-Rad. Bio-Rad reserves the right to modify its products and services at any time. This guide is subject to change without notice. Although prepared to ensure accuracy, Bio-Rad assumes no liability for errors or omissions, or for any damage resulting from the application or use of this information.
-
Page 5: Table Of Contents
Transport Operating Conditions Disposal Warranty Chapter 1 Introduction System Components Installation Requirements Upgrading Everest Software and ZE5 Firmware Upgrading Everest Software Updating ZE5 Instrument Firmware Administrator and User Rights Other Documentation and Training Materials Chapter 2 Hardware Description System Overview... - Page 6 Chapter 3 ZE5 Loader Loader Components Media Types Probe Cleaning Loader Movement Chapter 4 Everest Software Login Window Home Window Experiment Buttons Help and Information Menu Home Window Tools Resetting Your Password Recent Experiment Sessions iv | ZE5 Cell Analyzer and Everest Software...
- Page 7 Table of Contents Quick Actions Experiment Builder Name Screen Fluorophores Screen Samples Screen Settings Screen Acquisition Workspace Instrument Control Panel The Toolbar Details Tools Batch Tools Quick Action and System Action Tools System Tools Other Toolbar Buttons Status Bar Notifications and System Logs Chapter 5 Configuring the System Managing Users Creating a New User...
- Page 8 Selecting the Media Type Creating a Custom Media Type Plate Settings Controls Setting the Run List Order Activating Temperature Control Specifying Shutdown Upon Completion Setting Up Compensation Controls Labeling Positions Manually Labeling Positions Automatically vi | ZE5 Cell Analyzer and Everest Software...
- Page 9 Table of Contents Importing Names from a Spreadsheet Setting Up Keywords Position Settings Controls Assigning Position Types Selecting Standard or High-Throughput Acquisition Pausing after a Tube or Well Setting Volumetric Counting on Samples Returning Sample to a Tube or Well Setting Stop Conditions Configuring Wash Settings Activating Agitation...
- Page 10 Exporting the FCS Data File for a Single Position Exporting FCS and RLST Data Files Chapter 9 Applying Fluorescence Compensation Setting Up the Experiment Adjusting Compensation Automatically Adjusting Compensation Manually Dragging Populations Editing the Compensation Matrix viii | ZE5 Cell Analyzer and Everest Software...
- Page 11 Publish Toolbar Preparing Reports Printing a Report for the Selected Position Printing a Report for All Positions Chapter 11 Reports Quality Control and ZE5-EYE Reports Reports Tools Generating Daily QC Reports Generating QC Trending Reports Generating ZE5-EYE Trending Reports Generating User Reports...
- Page 12 Performing Initial Data Analysis Performing Automatic Compensation Resuming Acquisition Analyzing or Exporting Final Data Appendix C Optional External DI Water and Waste Ports Connecting External DI Water Connecting External Waste Specifying External Port Use x | ZE5 Cell Analyzer and Everest Software...
- Page 13 Table of Contents Appendix D ZE5 Cell Analyzer Specifications Appendix E Ordering Information Appendix F References Glossary User Guide | xi...
- Page 14 Table of Contents xii | ZE5 Cell Analyzer and Everest Software...
-
Page 15: Safety And Regulatory Compliance
Safety and Regulatory Compliance For safe operation of the ZE5™ Cell Analyzer, Bio-Rad strongly recommends that you follow the safety specifications listed in this section and throughout this guide. Safety Warning Labels Warning labels posted on the instrument and WARNING and Caution notes listed in this guide warn you about sources of injury or harm. - Page 16 Biosafety is of utmost importance while operating this instrument. This symbol identifies components that may become contaminated with biohazardous material. When handling biohazardous samples or the ZE5 Cell Analyzer’s waste container, adhere to the recommended precautions and guidelines in this guide, and comply with any local guidelines specific to your laboratory and location.
-
Page 17: Safe Use Specifications And Compliance
The intent of the laser hazard classification is to identify hazards to users posed by the laser and to provide appropriate protective measures. The ZE5 Cell Analyzer is a Class 1 laser product that complies with 21 CFR 1040.10 and 1040.11, except for deviations pursuant to Laser Notice No. 50, dated June 24, 2007 stating that operators are not exposed to harmful levels of laser radiation during normal operation, maintenance, and/or service. -
Page 18: Regulatory Compliance
Hazards The ZE5 Cell Analyzer is designed to operate safely when used in the manner prescribed by the manufacturer. If the ZE5 Cell Analyzer or any associated component is used in a manner other than... -
Page 19: Biohazards
Hazards Biohazards The ZE5 Cell Analyzer is a laboratory product. However, if biohazardous samples are present, adhere to the following guidelines and comply with any local guidelines specific to your laboratory and location. General Precautions Always wear laboratory gloves, coats, and safety glasses with side shields or goggles. -
Page 20: Explosive Or Flammability Hazards
Transport Moving the ZE5 Cell Analyzer is not recommended after installation. If the system must be moved, follow the decontamination procedure in this guide and remove all bulk fluidics. After a move, you must run the QC process to ensure that the instrument is functioning properly. -
Page 21: Chapter 1 Introduction
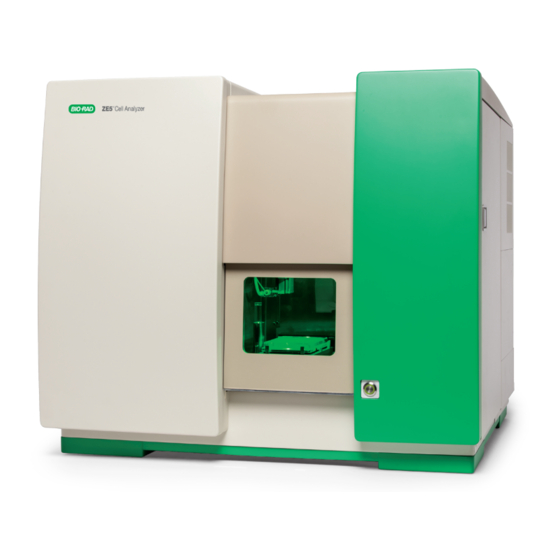
Chapter 1 Introduction The ZE5™ Cell Analyzer is a compact benchtop flow cytometer that can characterize and measure cells and their properties by streaming a single-cell suspension through up to five spatially separated laser beams at varying wavelengths. It can be configured to use up to 30 detectors (photomultiplier tubes), including forward and side scatter detectors and an optional second forward scatter detector. -
Page 22: System Components
Information. Installation Requirements The ZE5 Cell Analyzer should be installed by a Bio-Rad service engineer to ensure proper instrument operation and calibration. If any items are missing or damaged, contact your local Bio-Rad office. Choose an appropriate site for ZE5 Cell Analyzer installation, such as a sturdy bench or tabletop, away from any other instruments that might interfere electrically, or mechanically by causing vibration. -
Page 23: Upgrading Everest Software And Ze5 Firmware
153 x 74 x 121 cm 60 x 29 x 48 in * Maintain a 15 cm (2 in) space between the back of the ZE5 Cell Analyzer and any vertical surface to allow for cable connections. ** An additional 55 cm (22 in) of height clearance is needed for service. -
Page 24: Updating Ze5 Instrument Firmware
The firmware update process can take up to 5 minutes. The Everest Firmware Update Utility window and then the ZE5 Service Tool dialog box appear on the screen. Do not close the dialog box or shut down the instrument during the update. - Page 25 Feature Administrator User ü ü Start up ü ü Shut down ü ü Run QC and ZE5-EYE processes ü ü Generate daily QC reports ü Generate QC trending and EYE trending reports ü ü Acquire samples ü ü Generate analysis reports ü...
-
Page 26: Other Documentation And Training Materials
Chapter 1 Introduction Other Documentation and Training Materials More information about the ZE5 Cell Analyzer and Everest Software is available from the following sources: ZE5 Cell Analyzer and Everest Software Release Notes ZE5 Cell Analyzer and Everest Software Quick Start Guide Training modules are also available in Everest Software to help you become familiar with basic system functionality. -
Page 27: Chapter 2 Hardware Description
Chapter 2 Hardware Description Read this section to understand the ZE5™ Cell Analyzer system hardware before operating the instrument. System Overview The ZE5 Cell Analyzer system consists of fluidics, optics, electronics, and software. User Guide | 25... -
Page 28: Power And Communication Connections
Chapter 2 Hardware Description Power and Communication Connections Power and communication connections are located on the back of the ZE5 Cell Analyzer. The following features are located in this entry panel: Power cord (black) — IEC-compliant AC power cord. Ethernet cable (green) — connects the instrument to Ethernet port of the computer workstation. -
Page 29: Fluidics System
Fluidics System Fluidics System The ZE5 fluidics system consists of the bulk fluidics, sample loader, and flow cell. The system supplies sheath fluid and sample to the flow cell and collects the waste for proper disposal. Sheath fluid typically consists of DI (deionized) water to which sheath additive is added; however, a saline solution can be used instead. -
Page 30: Sheath Bottles
The sheath additive bottle, which has a white cap, contains 250 ml of concentrated balanced salts, antimicrobial/antifungal agent, and surfactant. This fluid is drip-fed into the internal sheath reservoir on a continuous basis while the system is running and helps prevent microbial buildup in the system. 28 | ZE5 Cell Analyzer and Everest Software... -
Page 31: System Cleaner Bottle
Important: Replace filter cartridges on a regular basis. Filter replacement is part of the annual Bio-Rad Service preventive maintenance visit. For additional information, see Chapter 12, Maintenance. -
Page 32: Waste Bottles
Fluidics Connections The ZE5 Cell Analyzer bulk fluidics chamber is located on the front of the instrument to the left of the loader. The fluidics chamber holds four large and two small bulk fluidics bottles. Connections to these bottles are depicted in the next figure. -
Page 33: Sample Loader
Ports. Sample Loader The ZE5 Cell Analyzer features a sophisticated autoloader that can sample from a wide variety of media types, including racks of forty 5 ml tubes (12 x 75 mm), twenty-four 1.5 ml tubes, 96-well plates (deep-well or standard depth), and 384-well plates. A single sample position for a 5 ml tube is also provided for stat tube samples. - Page 34 4–37ºC in 1ºC intervals to suit a variety of assay needs, for example, preserving cell viability. Another feature of the ZE5 Cell Analyzer is the patented, custom-designed, dual-cam peristaltic sample pump that delivers sample to the interrogation points in the flow cell. Using Everest Software, you can adjust sample target flow rates within the range of 0.1–3.5 µl/sec (6–210 µl/min).
-
Page 35: Flow Cell
Chamber Light button in the Instrument Tools dropdown located in the System section of the Everest toolbar. For more information about loading samples, see Chapter 3, ZE5 Loader. Caution: In addition to the loader door, there are two doors (filter access and bulk fluidics access) that require access on a regular basis. - Page 36 The fluidics system allows sheath fluid flow within the flow cell to be reversed to help remove blockages. Cleaning fluid is introduced into the flow cell as part of the system shutdown process. 34 | ZE5 Cell Analyzer and Everest Software...
-
Page 37: Optics
The PMTs detect scattered and fluorescent light signal. Lasers The ZE5 Cell Analyzer can be configured with a selection of up to five lasers from the Coherent OBIS line of lasers. A typical configuration contains lasers of wavelengths and powers as follows: 355 nm (UV) at 50 mW... -
Page 38: Beam-Shaping Optics
Interrogation An interrogation point occurs where each laser beam intercepts the sample in the flow cell. The ZE5 Cell Analyzer system supports up to five spatially separated interrogation points along the core stream. Upon interrogation, the particles scatter the laser light and generate fluorescent signals. -
Page 39: Forward Scatter
The ZE5 Cell Analyzer can include up to two FSC detectors. Both are highly sensitive PMTs with adjustable voltage. -
Page 40: Optical Filters And Mirrors
Chapter 2 Hardware Description which results in higher side scatter (SSC). The ZE5 Cell Analyzer is configured to collect SSC from the 488 nm laser. Optical Filters and Mirrors The ZE5 Cell Analyzer’s optical filters separate and direct fluorescent light to the PMTs for detection. - Page 41 Optics For more information about accessing filters, see Optical Filter Access Door on page Optical Mirror and Filter Types Optical mirrors and filters are coated pieces of glass that are designed and configured in specific patterns to efficiently steer light to the correct detector. Mirrors direct all the light down the detection path and are not user changeable.
- Page 42 For experimental applications where events appear off scale when the detector is set at minimum gain, a neutral density filter can attenuate the signal and keep the events on scale. In the ZE5 Cell Analyzer, neutral density filters are used in front of the FSC detector. You also have the option to install neutral density filters in front of other detectors.
- Page 43 — each optical fiber directs light to a particular bank, as shown in the next figure. The ZE5 Cell Analyzer can be configured with up to five banks, one for each laser. The five banks are grouped into three regions: A, B, and C. Region A, located on the bottom, consists as a single bank, while regions B and C, located on the top left and top right, respectively, each contain two banks of PMTs.
- Page 44 Chapter 2 Hardware Description Table 5. Optical filter banks, continued Bank Laser Total possible PMTs C Top Violet (405 nm) C Bottom Yellow Green (561 nm) 42 | ZE5 Cell Analyzer and Everest Software...
- Page 45 Optics Optical mirrors and filters are configured in a combination of fixed and operator-changeable components. Each bank contains an initial array of fixed dichroic mirrors followed by replaceable dichroic mirrors and filters. User Guide | 43...
- Page 46 (regions B and C). Examples of single and double filters are shown in the next figure. For information about configuring filters, see Working with Optical Filter Configurations on page 120. 44 | ZE5 Cell Analyzer and Everest Software...
-
Page 47: The Ze5-Eye
ZE5-EYE uses multiple LEDs to pulse ten different wavelengths of light into the optical filters that lead to the detector banks. These LEDs are shown in the next figure. The ZE5-EYE process is a component of the QC process and is run any time the QC process is initiated. -
Page 48: Optical Filter Access Door
Everest Software any time the door is opened for at least 5 sec. The ZE5-EYE process runs in the background to check the detection paths any time the filter access door is opened and then closed. It notifies system operators if any filter has been changed, so that the filter configuration in the software can be updated accordingly. -
Page 49: Electronics
Analog-to-digital converters (ADCs) convert the electrical signal coming from the pre-amplifier into a digital signal and transfer that signal to the software for data visualization. The ZE5 Cell Analyzer is a fully digital instrument, transforming signals with 24-bit resolution for signal area and height as well as 17-bit resolution (using linear interpolation at half height) for signal width. - Page 50 Chapter 2 Hardware Description 48 | ZE5 Cell Analyzer and Everest Software...
-
Page 51: Chapter 3 Ze5 Loader
Chapter 3 ZE5 Loader The ZE5™ Cell Analyzer loader provides built-in temperature control (from 4 to 37°C in 1° increments) as well as variable agitation. Agitation speed is preprogrammed for each media type to ensure that sample fluid does not spill. -
Page 52: Loader Components
Loader Components The various components of the loader are depicted in the next figure and described in the accompanying table. 50 | ZE5 Cell Analyzer and Everest Software... -
Page 53: Media Types
Media Types Legend Stat tube position Allows for loading a single tube, rather than a rack of tubes, for quick sample acquisition without requiring experiment configuration in the Experiment Builder. Waste overflow port Utilized for cleaning and wash station maintenance and (behind stat tube position) for removing clogs. - Page 54 Everest Software allows definition of, and sampling from, custom media types, such as 48-well plates. The ZE5 Cell Analyzer includes a bi-level tube lifter, shown in the next figure. When a full 40-tube rack is placed on the tool, tubes in every other row are slightly raised, as shown in the next figure.
-
Page 55: Probe Cleaning
Probe Cleaning Probe Cleaning The integrated sample line wash station is located at the bottom of the gauge. The wash station can introduce either sheath fluid (DI water with additive) or cleaning fluid (from the cleaner bottle) to the sample line, depending on the process and instrument state. You can program washes into the sample run during run list setup, and you can specify both the inside and outside wash times. - Page 56 Chapter 3 ZE5 Loader Combined with photo sensors in the loader, the gauge helps ensure that the vertical travel distance of the probe and wash station is appropriate for the media type. 54 | ZE5 Cell Analyzer and Everest Software...
-
Page 57: Chapter 4 Everest Software
Chapter 4 Everest Software Everest™ Software is the main interface for controlling the ZE5™ Cell Analyzer, indicating overall system status, allowing you to calibrate the instrument, run samples, and print reports. This chapter explains the following main areas of Everest Software:... -
Page 58: Login Window
Shutting Down on page 161. Startup — displayed if the system has not yet been started up. The instrument can be started up without user login. See Starting Up the System on page 152. 56 | ZE5 Cell Analyzer and Everest Software... -
Page 59: Home Window
Home Window Table 7. User login items and their functions User Login panel Item Function User Enter your user name as set up by your system administrator. Enter the password for this user name. Password Notes Enter any notes for this session. Notes appear in the user reports available to administrators. -
Page 60: Experiment Buttons
Note: Sample positions are not imported, so, for example, you can import a run list configured for tubes and easily reconfigure it for a plate. 58 | ZE5 Cell Analyzer and Everest Software... -
Page 61: Help And Information Menu
ZIP file, and saves the file on the computer's desktop. Training Module — displays a list of training videos that guide you through basic ZE5 Cell Analyzer system operations. These videos run in your default browser. Internet access is not required. -
Page 62: Home Window Tools
— opens a report that tracks usage over time and includes session notes entered by logged-in users. Available only to administrators. Global Preferences — allows you to configure global settings for the instrument and software. Available only to administrators. 60 | ZE5 Cell Analyzer and Everest Software... -
Page 63: Resetting Your Password
Home Window Resetting Your Password If you do not have administrative rights, the Reset Password button appears in the Home window tools above the Recent Experiment Sessions panel. To reset your password Click Reset Password. In the Reset Password dialog box, enter the new password twice and click OK. User Guide | 61... -
Page 64: Recent Experiment Sessions
This option is useful if acquisition was interrupted in the middle of the previous experiment. Loads a copy of the previously created run list into the acquisition workspace. 62 | ZE5 Cell Analyzer and Everest Software... -
Page 65: Quick Actions
Home Window Table 11. Recent Experiment Sessions options and their functions, continued Option Function Edit Opens the run list in the Experiment Builder so that you can modify it. Import Copies fluorophores, parameter names, instrument settings, plots, and the compensation matrix from the run list into the new experiment. -
Page 66: Experiment Builder
Facilitates setup of the workspace, where you can create plots, enable lasers, Settings adjust PMT voltages, and set the trigger/threshold as needed. Name Screen The Name screen allows you to assign a unique name to the experiment. 64 | ZE5 Cell Analyzer and Everest Software... -
Page 67: Fluorophores Screen
Activates all available detectors. Note: If the ZE5 Cell Analyzer is configured with a large number of PMTs, enabling all detectors can create large data files that can be difficult to handle upon export to other software packages for analysis. - Page 68 Hides fluorophores that are not used regularly. These settings apply to the logged-in user’s profile; the selected fluorophores will not be hidden from other users. Restores the fluorophore list to the default list delivered with Everest Software. 66 | ZE5 Cell Analyzer and Everest Software...
- Page 69 Experiment Builder Available Detection Panel The Available Detection panel acts as a spectral layout that is specific to the local instrument configuration. Each laser has a spectral graph associated with it. Because multiple dyes are excited with the same laser, spectra are overlaid on the same graph. When you select a fluorophore, its emission spectrum is shown in the graph associated with the laser that optimally excites it.
- Page 70 All signals are collected as raw digital values from the analog-to-digital converters (ADCs) in linear mode and are uncompensated. Logarithmic scaling is performed by Everest Software after the data have been received by the software. 68 | ZE5 Cell Analyzer and Everest Software...
-
Page 71: Samples Screen
Experiment Builder Samples Screen After you select the fluorophores and click the Next arrow, the Samples screen guides you through selecting sample input settings. Table 16. Samples screen items and their functions Item Function Cancels setup of this experiment. Returns you to the Home window, where you can start a new experiment. - Page 72 After you select the media type, the full Samples screen appears. The Samples screen contains three panels: Selected Fluorophores Plate Setup Sample Naming 70 | ZE5 Cell Analyzer and Everest Software...
- Page 73 Experiment Builder Selected Fluorophores Panel The left panel in the Sample screen, Selected Fluorophores, shows a list of the fluorophores that were selected on the previous screen. The Template area of the Selected Fluorophores panel allows you to select a pulse parameter for compensation, add single-color compensation controls to the first wells or tubes, designate a negative control, and designate a universal negative control for the experiment.
- Page 74 The selected media type pane allows you to program each well or group of wells with a set of run conditions. The next figure shows the currently selected well highlighted with a red border. 72 | ZE5 Cell Analyzer and Everest Software...
- Page 75 Experiment Builder If multiple wells are selected, the red border surrounds each of them, as shown in the next figure. User Guide | 73...
- Page 76 To select a well, click it. To select multiple, adjacent wells, click the first well and drag over the target wells. To select multiple nonadjacent wells, press and hold Ctrl and click the wells. 74 | ZE5 Cell Analyzer and Everest Software...
- Page 77 Experiment Builder Table 18. Selected Media items and their functions Item Function Opens the media selector so that you can change the type of input device (for example, switching a 40-tube rack to a 96-well plate). Note: Switching to a different media type resets the run list order.
- Page 78 When high throughput is turned on for selected positions, samples are aspirated continuously and each sample is separated with a series of air and water boundaries depending on the selected inside wash time. 76 | ZE5 Cell Analyzer and Everest Software...
- Page 79 Experiment Builder Select high-throughput mode to achieve the highest throughput with minimal time between each sample. After the probe finishes aspirating sample from a position, any programmed wash or agitation is performed, then the probe immediately moves to the next sample and begins aspirating. Samples are delivered to the flow cell at a constant rate and sample boost to the flow cell is not utilized.
- Page 80 Volume Limit, Event Limit, Agitation Time, (added) Reagent Position, Reagent Volume, Probe Wash Times (outside and inside), Acquisition mode (High Throughput versus Standard), Return Sample, and gate limit (if one is set). 78 | ZE5 Cell Analyzer and Everest Software...
- Page 81 Experiment Builder The Single tab facilitates naming one sample at a time. You can also specify the details of each sample by scrolling across the run list. The Multiple tab facilitates naming multiple samples at a time using components including Date, Well ID, Sequence ID, Experiment Name, and Custom text.
- Page 82 Chapter 4 Everest Software 80 | ZE5 Cell Analyzer and Everest Software...
- Page 83 Experiment Builder The Keyword tab allows you to create custom keyword/value pairs and associate them with sample positions. For more information, see Setting Up Keywords on page 190. User Guide | 81...
- Page 84 Chapter 4 Everest Software 82 | ZE5 Cell Analyzer and Everest Software...
-
Page 85: Settings Screen
Experiment Builder Settings Screen After you have configured your sample and controls in the Samples screen, you can configure other aspects of your experiment in the Settings screen. In the Settings screen you can Create plots, regions, and gates for data collection and analysis For information about creating plots, see Creating Plots and Histograms on page 209. - Page 86 Acquisition workspace. The plate map in the Settings workspace displays different colors and symbols for each well position. Table 23. Plate map symbols Symbol Description Selected position Setup position 84 | ZE5 Cell Analyzer and Everest Software...
- Page 87 Experiment Builder Table 23. Plate map symbols, continued Symbol Description Sample position Reagent position Wash position Unassigned position PMT Control Panel The PMT Control panel in the Settings workspace allows you to control initial settings related to lasers and detectors. These settings can be adjusted later after acquisition begins. User Guide | 85...
- Page 88 Chapter 4 Everest Software Legend Toggle between detector filter numbers and detector names. Load PMT voltages from a selected run list file. Reset PMT voltages to default values. Enable and disable lasers. 86 | ZE5 Cell Analyzer and Everest Software...
- Page 89 Experiment Builder Legend Enable and disable neutral density filter (FSC only). Enable and disable detectors. Modify detector names. Modify PMT voltages (text entry, slider, or mouse scroll wheel). Set threshold. Set primary trigger (and optional secondary trigger). For information about using this panel, see Configuring Instrument Settings on page 257.
- Page 90 You can acquire samples and save data directly from this screen. In stat tube mode, all parameters are activated by default and can be named by directly modifying the name in the parameter list. 88 | ZE5 Cell Analyzer and Everest Software...
-
Page 91: Acquisition Workspace
The Instrument Control panel, located on the left side of the Acquisition workspace, displays sampling controls for setup and Acquisition modes. The Instrument control panel contains the majority of controls and monitoring functions needed to operate the ZE5 Cell Analyzer system and run samples. User Guide | 89... - Page 92 Chapter 4 Everest Software 90 | ZE5 Cell Analyzer and Everest Software...
- Page 93 Acquisition Workspace For information about PMT and trigger controls, see PMT Control Panel on page 85 Configuring Instrument Settings on page 257. There are two modes for running samples: setup and acquisition. Setup Mode Setup mode has two primary uses: You can use the tool in the toolbar to optimize settings and set compensation on a single-sample basis.
- Page 94 Experiment Builder. This mode is typically used after optimizing settings in Setup mode. After sample acquisition has been initiated in Acquisition mode, the ZE5 Cell Analyzer proceeds to each position on the rack or plate, starts and stops sampling as specified in the run list, and records data files.
-
Page 95: The Toolbar
The Toolbar The Toolbar The toolbar appears at the top of the Settings screen and at the top of the Acquisition, Analysis, and Publish tabs in the workspace. The toolbar consists of various sections, depending on the context in which it appears. Details Details appear in the toolbar of the Settings screen. - Page 96 — opens the compensation matrix in the workspace for viewing or editing. — displays the current optical filter configuration for all Optical Filter Configuration detection banks. Also allows you to initiate the ZE5-EYE process. Note: This tool appears only in the Acquisition workspace toolbar. Export —...
-
Page 97: Batch Tools
The Toolbar Some of these tools also appear in the Analysis tab toolbar. For more information, see Analysis Toolbar on page 305. Batch Tools The batch tools appear in the toolbar of the Settings screen. These tools allow you to set gate limits for all experimental samples or for selected positions. -
Page 98: System Tools
Unclogging the Sample Line and Probe on page 322. Bead Swap — informs the system that you are replacing the calibration bead bottle and resets the volume to 5,000 μl. See Replacing the QC Beads on page 335. 96 | ZE5 Cell Analyzer and Everest Software... - Page 99 The Toolbar Table 29. System buttons and their functions, continued Button Function Pause System/Resume System — pauses the sheath fluid flow and disables the lasers, or resumes the sheath flow and enables the lasers. Decontamination — initiates the Decontamination wizard. Fluidics —...
-
Page 100: Other Toolbar Buttons
Reports Tools on page 313. For information about toolbar buttons in the Analysis tab, see Analysis Toolbar on page 305. For information about toolbar buttons in the Publish tab, see Publish Toolbar on page 310. 98 | ZE5 Cell Analyzer and Everest Software... -
Page 101: Status Bar
Note: Do not click the IP address link unless instructed to do so by Bio-Rad Technical Support. This link is used to disconnect Everest Software from the ZE5 Cell Analyzer and reconnect it for troubleshooting purposes. Indicates that the instrument is directly connected to the computer. -
Page 102: Notifications And System Logs
Acquisition workspace after you log in.) For information about adding notifications to the Acquisition workspace, see Status Bar on page 100 | ZE5 Cell Analyzer and Everest Software... - Page 103 Everest Software. System logs can provide useful troubleshooting information needed by Bio-Rad Technical Support. You can use the Help and Information menu to extract detailed system log information to a ZIP file. For information about log files, see...
- Page 104 Chapter 4 Everest Software 102 | ZE5 Cell Analyzer and Everest Software...
-
Page 105: Chapter 5 Configuring The System
Chapter 5 Configuring the System Before the ZE5™ Cell Analyzer is used for acquisition, an administrator must configure the system using Everest™ Software. Administrative configuration tasks include: Setting up users and assigning them access rights Setting instrument default settings in the global preferences... - Page 106 To add a user account In the Home window, click Manage Users. The User Management dialog box opens. Click Add User. The Add user dialog box opens. By default, the Active checkbox is selected. 104 | ZE5 Cell Analyzer and Everest Software...
- Page 107 Managing Users Verify that the Active status checkbox is selected. Enter a user name. Do one of the following: To require that users set their own password: a. In the Password text box, type a default password. For example, Change Password. b.
- Page 108 Note: Any path specified here takes precedence over the default file save path set in the global preferences. For more information, see Setting File Save Parameters on page 115. Type the first and last name of the user. 106 | ZE5 Cell Analyzer and Everest Software...
- Page 109 Managing Users Click OK to save the new user account. User Guide | 107...
-
Page 110: Editing User Information
After a user has been created, you can edit details such as password, email address, default file directory, and user rights. To edit user information In the User Management dialog box, click the pencil button for the user. The Edit user dialog box opens. 108 | ZE5 Cell Analyzer and Everest Software... - Page 111 For more information, see Setting File Save Parameters on page 115. Click OK. Tip: If all administrator passwords are lost or forgotten, call Bio-Rad Technical Support to receive a temporary administrator password. User Guide | 109...
-
Page 112: Managing User Accounts
Select Show inactive users to view inactive user accounts; clear it to hide inactive user accounts. Click Save. Setting Global Preferences Administrators can set global preferences for the ZE5 Cell Analyzer and Everest Software. The Global Preferences button is available in the Home window to users with an Admin account. To access global preferences In the Home window, click Global Preferences. - Page 113 Setting Global Preferences Administrators can: Configure settings for data plots Display or hide off scale data indicator in plots Specify that acquisition stops if sample runs out Set default QC criteria Set permissions for startup, shutdown, and QC when a user is logged out Set default file save parameters Specify number of experiment sessions to load Display or hide button text in the software interface...
-
Page 114: Setting Plot Display Defaults And Stopping Acquisition
In the Home window, click Global Preferences. In the Acquisition and Plots area, select the Show Off Scale Data Indicator checkbox to display indicators when events fall on or below a plot axis. 112 | ZE5 Cell Analyzer and Everest Software... - Page 115 Setting Global Preferences Such off-scale events, as shown in the next figure, might indicate the need to adjust instrument settings. Select a resolution setting for new plots. Select the Sample dry checkbox if you want to stop acquisition when bubbles occur, indicating that sample has run out.
-
Page 116: Editing Qc Criteria
To specify logged out settings In the Home window, click Global Preferences. In the Logged Out area, select the respective checkboxes to permit startup or shutdown when no user is logged into the system. 114 | ZE5 Cell Analyzer and Everest Software... -
Page 117: Setting File Save Parameters
Editing QC Criteria Click OK to save the changes. Setting File Save Parameters Everest Software can autosave each FCS file after acquisition is complete or when acquisition is stopped by a user. As an administrator, you can specify the default save location for all users. You can also set a different file destination for a specific user;... -
Page 118: Specifying Ui Preferences
Click OK to save the changes. Setting Up Vacation Mode To maintain optimal system performance, Bio-Rad recommends that you run the ZE5 Cell Analyzer regularly without long periods of disuse. If your instrument will not be in use for an extended period, you can use the Everest Software vacation mode to schedule automatic startup and perform the QC process regardless of whether an operator is in the lab. - Page 119 Editing QC Criteria During the vacation period, if the system is used on a day on which no startup is scheduled the startup interval is reset, resulting in a new start date. If the system is used on a day on which startup is scheduled, the interval schedule is not affected.
- Page 120 Chapter 5 Configuring the System 118 | ZE5 Cell Analyzer and Everest Software...
-
Page 121: Specifying Statistics Preferences
Editing QC Criteria Specifying Statistics Preferences You can specify which statistics appear in plots, and the order in which they appear. To specify statistics preferences In the Home window, click Global Preferences. In the Statistics area, select the checkbox for each statistic that you want to show, and clear the checkbox for each statistic that you want to hide. -
Page 122: Working With Optical Filter Configurations
Everest Software is currently installed in the instrument. The ZE5-EYE relies on the filter labels used in the software. If you change a filter label without changing 120 | ZE5 Cell Analyzer and Everest Software... - Page 123 Working with Optical Filter Configurations the physical filter, the ZE5-EYE process fails and Everest Software warns you that the correct filter is not installed. For reference, the light wavelengths allowed through by the filters associated with each PMT are shown at the bottom of the filter configuration screen, overlaid on a spectral plot.
- Page 124 Chapter 5 Configuring the System Detection paths for banks B and C are shown in the next four figures. 122 | ZE5 Cell Analyzer and Everest Software...
- Page 125 Working with Optical Filter Configurations User Guide | 123...
- Page 126 Chapter 5 Configuring the System 124 | ZE5 Cell Analyzer and Everest Software...
- Page 127 Working with Optical Filter Configurations The following detection paths can be viewed from the Optical Filter Configuration dialog box, but not edited: FSC1 FSC2 User Guide | 125...
-
Page 128: Standard Filter Combinations
Chapter 5 Configuring the System Standard Filter Combinations The ZE5 Cell Analyzer can be ordered with a variety of filter combinations depending on your requirements for number of lasers and combinations of fluorophores. The following sections show some standard combinations of optical elements that are available. - Page 129 Working with Optical Filter Configurations 405 nm Laser Filter Choices Violet 7 Detectors Fluorophores 405 nm 420/10 Cascade Blue 100 mW BV421 439 DLP (changeable) 460/22 Pacific Blue BD Horizon V450 493 DLP 525/50 AmCyan BV510 Cascade Yellow Pacific Orange 581 DLP (changeable) 615/24 BV605 640 DLP...
- Page 130 558 DSP 593/52 583/30 PE (R- phycoerythrin) 600 DLP (changeable) 615/24 PE-Texas Red 629 DLP 629 DLP 692/80 692/80 PE-Cy5 PerCP-Cy5.5 752 DLP 752 DLP (changeable (changeable) 750 LP 750 LP PE-Cy7 128 | ZE5 Cell Analyzer and Everest Software...
- Page 131 Working with Optical Filter Configurations 561 nm Laser Filter Choices Yellow 7 Detectors Fluorophores Green 577/15 dTomato 561 nm dsRed 50 mW 581 DLP (changeable) 589/15 600 DLP 615/24 PE-Texas Red PI (bound to dead) 629 DLP (changeable) 640/20 mPlum 652 DLP 670/30 PE-Alexa Fluor 647...
-
Page 132: Replacing Optical Filters
Only authorized and trained personnel should access or modify the optical configuration of the ZE5 Cell Analyzer system. The coated pieces of glass are delicate; handle them with care. Any scrape or scratch on the surface could significantly affect the light passing through. - Page 133 Working with Optical Filter Configurations Remove existing optical filters by pulling the filter sticks out of their slots in the filter bank, as shown in the next figure. Insert replacement filter sticks into empty slots as needed. Tip: Store extra optical filter sticks in the slots in the filter access door. User Guide | 131...
-
Page 134: Editing The Optical Filter Configuration
To view and edit the optical filter configuration Click Display Optical Filter Configuration in the toolbar. The Filter Configuration dialog box opens. 132 | ZE5 Cell Analyzer and Everest Software... - Page 135 To save the changes only for the current application session, close the Filter Configuration dialog box. To save the changes for the current and future application sessions, click Save Filter Configuration. The ZE5-EYE process runs automatically. User Guide | 133...
-
Page 136: Exporting Optical Filter Configurations
To revert to the default optical filter configuration In the Filter Configuration dialog box, click Revert to Factory Filter Configuration. Click OK. The ZE5-EYE process runs and a success or failure message appears in the status bar. 134 | ZE5 Cell Analyzer and Everest Software... -
Page 137: Using The Ze5-Eye To Confirm Filter Choices
Working with Optical Filter Configurations Using the ZE5-EYE to Confirm Filter Choices The ZE5-EYE, shown in the next figure, uses multiple LEDs to pulse ten different wavelengths of light through the instrument’s optical detection paths. The next figure shows a graph of these light wavelengths. - Page 138 To confirm filter choices using the ZE5-EYE If the ZE5-EYE did not run automatically, click the ZE5-EYE button located to the right of the Filter Configuration dialog box, as shown in the next figure. 136 | ZE5 Cell Analyzer and Everest Software...
- Page 139 Working with Optical Filter Configurations ZE5-EYE success or failure is shown as follows: If the ZE5-EYE runs successfully, a success confirmation message appears in the status bar and a green check mark appears next to the final filter position for each detector.
- Page 140 If a filter has been changed without a corresponding filter label modification in the software, an error appears in the status bar and a red circle with an exclamation point appears next to each position that caused the ZE5-EYE process to fail. 138 | ZE5 Cell Analyzer and Everest Software...
-
Page 141: Installing A Neutral Density Filter
Editing QC Criteria on page 114. To resolve the ZE5-EYE failure, ensure that the correct optical filter is placed in its slot, and edit the optical filter configuration to reflect this. Installing a Neutral Density Filter To alter the range of detection sensitivity of an SSC or fluorescence detector, you can replace a bandpass filter with a neutral density filter. - Page 142 Note: Installing a neutral density filter causes a reduction in light detection, and can cause the affected filter position to be flagged by the ZE5-EYE. This ZE5-EYE failure serves as a reminder to remove the neutral density filter at the end of the experiment that requires it.
-
Page 143: Chapter 6 Daily Routine
Chapter 10, Analyzing, Saving, and Printing Data System Power Do not turn off the ZE5 Cell Analyzer system by using the main power switch. The system is safe in standby mode after a software shutdown. This facilitates quick or automated startup. If you do need to turn instrument power off, shut down Everest Software first. -
Page 144: Starting Everest Software
The pair that is not illuminated is the pair that can be emptied of waste or filled with DI water during operation. Important: Ensure that replacement bottles are securely connected so that the system can transition to them. 142 | ZE5 Cell Analyzer and Everest Software... -
Page 145: Refilling Bulk Fluidics
Refilling Bulk Fluidics Refilling Bulk Fluidics Important: Follow these guidelines when working with fluidics bottles: When handling bottles, always wear gloves and minimize air exposure to help avoid contamination. When transferring a cap assembly to a new bottle, avoid touching the exterior bottle surface with the cap assembly. - Page 146 Everest Software provides warnings 1 hr, 30 min, and 5 min before the sheath bottles are nearly empty, allowing you to swap the fluidics. To avoid running the system dry, shutdown occurs when 5 min of sheath fluid remain. 144 | ZE5 Cell Analyzer and Everest Software...
-
Page 147: Emptying Waste Bottles
Refilling Bulk Fluidics After the first pair of bottles has been fully utilized, the system automatically switches to the second pair. Additionally, you can force the system to switch to the upper or lower pair of bottles by clicking Switch the Active Sheath and Waste Bottles in the System section of the toolbar, as shown in the next figure. -
Page 148: Replacing Sheath Bottles
Ensure that fluid reaches no higher than the fill line, as shown in the next figure, so that fluid does not leak from the air vent port in the cap. 146 | ZE5 Cell Analyzer and Everest Software... - Page 149 Refilling Bulk Fluidics To refill the sheath bottles Push the quick connect tabs on the connections to disengage the tubes from the instrument. Pull the sheath bottles out of the instrument. Unscrew the cap assemblies, remove them from the bottles, and pull the tubing out of the bottles. User Guide | 147...
-
Page 150: Replacing Sheath Additive And Cleaner Bottles
Ensure that the tubing that extends into the bottle is not contaminated during the refill procedure. To refill an additive or cleaner bottle Push the quick connect tab on the connection to disengage the tube from the instrument. 148 | ZE5 Cell Analyzer and Everest Software... - Page 151 Refilling Bulk Fluidics Pull the bottle out of the instrument. Unscrew the cap assembly and remove it from the bottle. Refill the white-capped bottle with sheath additive, refill the blue-capped bottle with cleaner, or replace a bottle with a new one. User Guide | 149...
- Page 152 Chapter 6 Daily Routine Carefully place the cap assembly onto the bottle and tighten the cap. Place the bottle back into the instrument. 150 | ZE5 Cell Analyzer and Everest Software...
-
Page 153: Logging In
Logging In Attach the cap assembly tubing to the connector on the instrument. Tip: An audible click indicates that the tubing is connected. If you do not hear a click, salt might have built up on the connector. Remove salt using a paper towel moistened with DI water. -
Page 154: Starting Up The System
Everest Software at the end of each day. Note: In Everest Software, a system status of Off indicates that the ZE5 Cell Analyzer is shut down but not powered off. If the ZE5 Cell Analyzer is powered off, a Check Instrument message appears... - Page 155 Powering the system on or off incorrectly can cause the instrument to malfunction. The startup process turns on the lasers, pressurizes the internal sheath reservoir, and initiates sheath fluid flow through the flow cell. The unclog and ZE5-EYE processes run immediately after the startup process.
- Page 156 Chapter 6 Daily Routine To start up the instrument Click Startup. To view startup details, click the down arrow. 154 | ZE5 Cell Analyzer and Everest Software...
- Page 157 Initializing Devices Initializes the ZE5 instrument and subcomponents for startup. Initializing Fluidics Initializes the fluidics system by starting the cleaner, water, waste, waste evacuation, air, and cooling pumps.
-
Page 158: Running Quality Control
(if you have not logged in yet) or in the Home window, if you have logged in. After logging in, run the Quality Control process. Running Quality Control The Quality Control (QC) process can be activated in the following places in Everest Software: Home window 156 | ZE5 Cell Analyzer and Everest Software... - Page 159 The QC process utilizes single-peak beads conveniently located on board. The beads contain a mixture of dyes that can be excited by all lasers installed on the ZE5 Cell Analyzer and that can emit in every fluorescence channel. The level of QC beads is monitored and displayed along with the fluidics status information.
- Page 160 QC process. Add Plots Adds plots to the workspace. Start Runlist Initializes and begins acquisition. Test Validation Event Rate Tests whether the system can acquire beads at 150 events per second. 158 | ZE5 Cell Analyzer and Everest Software...
-
Page 161: Accessing The Loader
After the QC process is complete, you can access the QC report from the Reports section of the toolbar. For more information about reports, see Quality Control and ZE5-EYE Reports on page 313. Accessing the Loader To open the loader door and extend the loader Do one of the following: Press the silver sample chamber button on the front of the instrument. -
Page 162: Running Experimental Samples
All functions in the Instrument Control, PMT Control, and Trigger panels Initiating the ZE5-EYE process Running the QC process Shutting down Everest Software and the ZE5 Cell Analyzer In the Instrument tools: Cleaning the sample line and probe Unclogging the sample line, probe, and flow cell Swapping QC beads... -
Page 163: Shutting Down
Shut down the ZE5 Cell Analyzer system at the end of each day of use. This turns off all lasers; cleans the sample line, probe, and flow cell with cleaner; depressurizes the fluidics; and logs you out of the system. - Page 164 If the system automatically starts up and no user logs in within 1 hr, the system shuts down. Empty the waste bottles and refill the sheath bottles if needed. To view shutdown details, click the down arrow. 162 | ZE5 Cell Analyzer and Everest Software...
- Page 165 Shutting Down Table 33. Steps in the shutdown process Reloading Flash Defaults Turns off the loader, reloads the instrument-specific configuration settings from the onboard flash memory to Everest Software. This includes the instrument's serial number, hardware configuration, channel, and pinhole configuration, as well as settings specific to the loader, sample pump, bulk fluidics, fluidics, flow rate and volume calibration.
- Page 166 4 min. Instrument Shutdown Turns off the LEDs, turns off the loader, ZE5 Cell Anaylzer instrument shuts down. 164 | ZE5 Cell Analyzer and Everest Software...
-
Page 167: Scheduling Automatic Startups
Shutting Down Scheduling Automatic Startups When you perform a shutdown, you can schedule a date and time to restart the ZE5 instrument and Everest Software automatically. The sheath bottles must be sufficiently full and the waste bottles must be sufficiently empty to allow 2 hr of run time. -
Page 168: Exiting Everest Software
To exit Everest Software Click Close in the upper right corner. Note: If the software cannot exit immediately, Bio-Rad recommends waiting rather than forcing the software to exit by clicking I Can’t Wait. 166 | ZE5 Cell Analyzer and Everest Software... -
Page 169: Chapter 7 Creating Experiments And Workspaces
Chapter 7 Creating Experiments and Workspaces The chapter explains how to create a new experiment, load an existing experiment, and resume a paused experiment. It also explains how to set up stat tubes, so that you can run single samples quickly, or add a single sample to an experiment that uses a tube or rack. -
Page 170: Selecting Fluorophores
Select the fluorophores to use in the experiment from the list of fluorophores. Use the Search box to type at least the first few letters of the fluorophore's name. The list narrows to those fluorophores relevant to the search. 168 | ZE5 Cell Analyzer and Everest Software... - Page 171 Selecting Fluorophores Double-click the fluorophore that you want to add. The fluorophore moves to the Selected Fluorophores list. In the Available Detection panel, the following happens: As fluorophores are added, the emission spectra of each fluorophore appear on the emission plot associated with the fluorophore’s optimal excitation laser line.
-
Page 172: Setting Up The Run List
To create a custom rack or plate type, click Custom, select an existing plate type and click Select or create a new custom plate, and Click Next. For more information about creating custom plates, see Creating a Custom Media Type on page 173. 170 | ZE5 Cell Analyzer and Everest Software... - Page 173 Setting Up the Run List The plate setup displays a layout of the selected media. User Guide | 171...
- Page 174 Tip: If you need to change the selected media type, click Switch Media in the upper left corner of the plate panel. Tip: The Experiment Name is the name entered in the Name screen, and can be modified here if needed. 172 | ZE5 Cell Analyzer and Everest Software...
-
Page 175: Creating A Custom Media Type
Setting Up the Run List Creating a Custom Media Type If none of the six predefined media types match the device you intend to use, you can create a custom media type. To create a custom media type In the Media list, click Custom. (Optional) If your custom device is similar to an existing plate (device), select it to use as a template. - Page 176 If you select an existing device to use as a template but do not change the Plate Name value, the calibration for the existing device will be modified. Edit plate settings as necessary and then click Next. 174 | ZE5 Cell Analyzer and Everest Software...
- Page 177 Setting Up the Run List User Guide | 175...
- Page 178 Delta to drive the probe down lower. If the probe hits the well bottom, this information is used in calibrating the probe Z value. Edit the dimensions as needed and click Next. Place the custom device into the sample loader and press Continue. 176 | ZE5 Cell Analyzer and Everest Software...
- Page 179 Setting Up the Run List Determine whether the probe has entered the first position on the custom device. If the probe is centered in the first position, click Yes. If the probe is not centered in the first position, click No, use the arrows to adjust it to the center of the well, and click Accept Current Location.
- Page 180 Chapter 7 Creating Experiments and Workspaces The layout of the custom device appears in the Plate Setup panel. 178 | ZE5 Cell Analyzer and Everest Software...
-
Page 181: Plate Settings Controls
Setting Up the Run List Plate Settings Controls The Plate Settings controls apply to the entire plate or tube rack, with the exception of panel names. Table 34. Plate Settings items and their functions Item Function Displays the name of the currently loaded experiment. Displays the name of a panel (group of samples) within the experiment that has uniquely configured parameters, parameter names, or settings. -
Page 182: Setting The Run List Order
When temperature control is enabled, the specified temperature applies to all positions in the plate or tube rack. To activate temperature control In the Plate Settings area, click the Temperature toggle. Enter the target temperature. 180 | ZE5 Cell Analyzer and Everest Software... -
Page 183: Specifying Shutdown Upon Completion
Setting Up the Run List Note: Allow the ZE5™ Cell Analyzer 5 min to reach the target temperature after activating temperature control. Specifying Shutdown Upon Completion You can instruct the system to shut down when run list acquisition is complete. -
Page 184: Setting Up Compensation Controls
Note: You must select this parameter first; the Area and Height buttons are disabled after the compensation template is activated. To include a negative control tube or well in the experiment, click the Negative Control toggle so that it is ON. 182 | ZE5 Cell Analyzer and Everest Software... -
Page 185: Labeling Positions Manually
Setting Up the Run List To use this negative control as a universal negative in automatic compensation calculations, select the Use Universal Negative checkbox. To automatically create compensation control positions in the plate setup, click the Compensation toggle so that it is ON. In the plate map, positions are filled with controls starting with the first available well;... -
Page 186: Labeling Positions Automatically
Tip: You can also label multiple positions at one time by importing the names from a spreadsheet. For more information, see Importing Names from a Spreadsheet on page 187. To name positions automatically In the plate map, select the positions to label. 184 | ZE5 Cell Analyzer and Everest Software... - Page 187 Setting Up the Run List Tip: If you plan to use the same name components on all positions, you can skip this step. Click the Multiple tab in the Sample Naming panel. There are five available name components: Date Well ID — well position (for example, A1, B5) Sequence ID —...
- Page 188 Specify how to apply the names. That is, whether the name components should Replace existing names Be added to the end of existing names (append) Be added to the beginning of existing names (prepend) Do one of the following: 186 | ZE5 Cell Analyzer and Everest Software...
-
Page 189: Importing Names From A Spreadsheet
Setting Up the Run List Click Apply to All to apply the name to all positions. Click Apply to Selected to apply the name to the selected positions. Click Clear Selected to remove names from the selected positions. Click Undo to reverse the last naming action. To change the Custom component of a name Modify the value in the Custom box. - Page 190 Chapter 7 Creating Experiments and Workspaces In the Multiple tab in the Sample Naming panel in Everest Software, click Import. The names are imported into the corresponding Sample locations in the table. 188 | ZE5 Cell Analyzer and Everest Software...
- Page 191 Setting Up the Run List User Guide | 189...
-
Page 192: Setting Up Keywords
In the Sample Naming panel, click the Keyword tab. Type a keyword in the Add New Keyword box and click Add. The keyword appears in the Keywords area. Repeat Step 2 for additional keywords that you want to add. 190 | ZE5 Cell Analyzer and Everest Software... - Page 193 Setting Up the Run List Assign a value or description to each keyword in the box below the keyword. In the plate map, select the samples to which to apply a keyword. In the Keywords area, select the checkbox for each keyword that you want to apply. Click Apply to Selected.
- Page 194 Ensure that the checkbox for all other keywords is cleared. Click Remove. To remove a keyword from a sample position In the Samples area in the Keyword tab, click the x to the right of the keyword box. 192 | ZE5 Cell Analyzer and Everest Software...
-
Page 195: Position Settings Controls
Setting Up the Run List Position Settings Controls Controls that apply to selected positions are located below the plate map in the Plate Setup panel. Stop Settings Sample stop conditions are determined based on event limit, volume limit, or gate limit. The volume value is used to calculate total plate run time. - Page 196 Full — outside wash 0.25 sec; inside wash 2.0 sec Note: The wash option values are not editable. Important: Wash is turned on by default. Bio-Rad strongly recommends that you leave it on for all positions, especially when using high-throughput sampling mode. Agitation Settings You can activate agitation for any position.
- Page 197 Setting Up the Run List High Throughput When high-throughput mode is activated, the selected samples are aspirated continuously and each sample is separated with a series of air and water boundaries depending on the selected inside wash time. For more information about high-throughput mode, see High-Throughput Mode on page Pause After When Pause After is activated, acquisition stops after the assigned sample position and the system...
- Page 198 0.1 µl/sec up to 3.5 µl/sec. However, you cannot adjust the flow rate during acquisition in high- throughput mode. Note: In high-throughput mode, all samples must use the same target flow rate. 196 | ZE5 Cell Analyzer and Everest Software...
-
Page 199: Assigning Position Types
Setting Up the Run List Reagent Settings Before you can specify addition of reagent to any samples, first designate one or more positions in the plate map as reagent positions. Then, for a selected sample position, you can select a reagent position from the dropdown list and enter the required volume of reagent to add to the sample, in the range of 2–20 µl. - Page 200 Selected positions are highlighted with red boxes. If you turned on Compensation in the Selected Fluorophores panel, Setup positions will have already been configured. To change the location of any assigned position: Click the Drag and Drop button in the lower right of the plate map. 198 | ZE5 Cell Analyzer and Everest Software...
-
Page 201: Selecting Standard Or High-Throughput Acquisition
Setting Up the Run List Drag a filled position to an empty one. Click Drag and Drop to turn off the feature. Selecting Standard or High-Throughput Acquisition In the default standard (single sample) Acquisition mode, there is only one sample in the sample line at any given time. -
Page 202: Pausing After A Tube Or Well
Note: You can set Return Sample to OFF if necessary. However, when using Volumetric Counting with Return Sample set to OFF, you might experience sample loss. If sample loss is a concern, run Volumetric Counting with Return Sample set to ON. 200 | ZE5 Cell Analyzer and Everest Software... -
Page 203: Returning Sample To A Tube Or Well
Setting Up the Run List To set volumetric counting In the plate map, select the relevant positions. Click the Volumetric Counting button. Returning Sample to a Tube or Well If high-throughput mode has not been activated, you can use the Return Sample function to conserve sample. -
Page 204: Setting Stop Conditions
Note: Washes are performed after acquisition of the position. To change the wash time, do one of the following: Click the appropriate wash option. Manually enter the wash times into the Outside and Inside boxes. 202 | ZE5 Cell Analyzer and Everest Software... -
Page 205: Activating Agitation
Setting Up the Run List Important: Bio-Rad highly recommends that you include a wash step for all positions, especially when using high-throughput sampling mode. Activating Agitation For information on agitation settings, see Agitation Settings on page 194. To activate agitation In the plate map, select the relevant positions. -
Page 206: Adding Experimental Reagents
Select the position from which to add reagent in the dropdown list. Specify the reagent volume in the Volume box. To mix the reagent by aspirating and dispensing the combined sample and reagent several times, select the Mix checkbox. 204 | ZE5 Cell Analyzer and Everest Software... - Page 207 Setting Up the Run List Reagent is not added to sample in Setup mode. When the run list proceeds to the assigned position in Acquisition mode, the instrument aspirates the specified volume of reagent from the reagent position and adds it to the selected position, mixing afterward when Mix is selected. Positions to which reagent will be added are marked with an image in the plate map.
- Page 208 Sample — no events were detected. Check PMT voltages and sample setup. No FCS file saved for the position. This symbol appears on Wash positions. 206 | ZE5 Cell Analyzer and Everest Software...
-
Page 209: Reviewing The Run List
Setting Up the Run List Table 35. Plate map symbols, continued Symbol Description Reagent. Wash. Unassigned. The white overlay on various types of positions indicates that the plots, regions, and gates are replicated for each position in the panel. In multipanel experiments, the white overlay appears only on the positions for the current panel. - Page 210 In the Settings screen, you can create plots for analysis and adjust instrument settings such as thresholds and PMT voltages. You can also add experimental panels to a single plate or rack, if needed. 208 | ZE5 Cell Analyzer and Everest Software...
-
Page 211: Creating Plots And Histograms
Creating Plots and Histograms Creating Plots and Histograms To visualize data in the workspace, you can add density plots, time plots, and histograms manually, or you can let Everest Software automatically create plots. The next figure shows the controls for configuring a density plot. - Page 212 If you did not use the compensation template in the Samples screen, you must create plots for compensation controls manually. 210 | ZE5 Cell Analyzer and Everest Software...
-
Page 213: Creating Density Plots
Creating Plots and Histograms Creating Density Plots The density plot builder displays the parameters that were activated in the Experiment Builder Fluorophores screen. To create a density plot Click Create Density Plot on the toolbar. Locate a parameter to assign to the x-axis. Parameters are listed under each laser. Set the axis scaling: For linear scale —... -
Page 214: Creating Histograms
Select the pulse measurement (height, area, or width) for the parameter. The histogram is added to the workspace. Click the X or click outside the histogram creation dialog box to close it. 212 | ZE5 Cell Analyzer and Everest Software... -
Page 215: Creating Time Plots
Creating Plots and Histograms Creating Time Plots The time plot builder displays the parameters that were activated in the Experiment Builder Fluorophores screen. To create a time plot Click Create Time Plot in the toolbar. Locate a parameter to assign to the y-axis. Parameters are listed under each laser. Set the y-axis scaling: For linear scale —... -
Page 216: Creating Histograms For All Channels
To create histograms for all channels Click Advanced Plot Builder in the toolbar. The plot (histogram) builder opens. Clear the checkbox for any laser detection path that you do not want to include. 214 | ZE5 Cell Analyzer and Everest Software... - Page 217 Creating Plots and Histograms Apply a filter, if needed. Note: You can apply a filter only if you have set filters (or regions) on plots that you previously created in the current experiment. Specify linear or log scale. Note: The default scale is linear although Log appears to be selected. To specify log scale, click Log until the box appears blue.
- Page 218 Chapter 7 Creating Experiments and Workspaces Select the pulse measurement (height, area, or width) for the parameter. The histograms are added to the workspace. 216 | ZE5 Cell Analyzer and Everest Software...
-
Page 219: Using Plot And Histogram Tools
Using Plot and Histogram Tools Using Plot and Histogram Tools After creating a plot or histogram, you can modify it using the tools that appear when you point at the plot or histogram. Different tools are available for bivariate density plots (next figure, left) versus univariate histogram plots (next figure, right). - Page 220 Applying a Region to All Plots on page 250 you to either apply a gate (region) to all plots or copy a region and create an identical one in all other plots of the same type in the workspace. 218 | ZE5 Cell Analyzer and Everest Software...
-
Page 221: Modifying Plot Parameters
Using Plot and Histogram Tools Table 37. Plot and histogram tools and their functions, continued Tool Function Further information Assign Data Track Regions — Assigning Data Track Regions on page 242 allows you to specify target event percentage for a region within a plot. If the event percentage within the region does not reach the target, acquisition pauses. - Page 222 Use the slider to select a hyperlog linear coefficient. Click Apply to save the changes. Important: Clicking the X in the upper right corner of the Edit Plot dialog box removes the plot. Take care when clicking this button. 220 | ZE5 Cell Analyzer and Everest Software...
-
Page 223: Managing Plot Statistics
Using Plot and Histogram Tools Managing Plot Statistics You can select specific statistics to view in each plot or histogram. To manage plot statistics Point to a plot or histogram for which you want to manage statistics. The plot and histogram toolbar appears. Click Manage Statistics. -
Page 224: Viewing And Rearranging Plot Statistics
On the plot, click the Statistics down arrow. The plot and region's statistics appear in a table within the plot. Resize the plot window if needed to view all the contents of the table. 222 | ZE5 Cell Analyzer and Everest Software... -
Page 225: Comparing Statistics
Using Plot and Histogram Tools To rearrange plot statistics In the Statistics table, drag a column heading to a new position. Comparing Statistics You can display statistics for selected filters (gates) and compare them to each other as well as to all events. - Page 226 The statistics for the selected gates appear, along with comparisons to all events in the gated plot. The gating hierarchy is shown, and for gates on density plots, values for the x-axis and y-axis are shown. 224 | ZE5 Cell Analyzer and Everest Software...
-
Page 227: Adding Regions To Density Plots And Time Plots
Using Plot and Histogram Tools Adding Regions to Density Plots and Time Plots The steps to follow when adding regions depend on the region type. To display density plot and time plot region tools Point to the plot. The plot and histogram toolbar appears. To add a rectangle region to a plot In the plot and histogram toolbar, click Add Rectangle Region. - Page 228 Chapter 7 Creating Experiments and Workspaces When the pointer changes to a double-headed arrow, use it to drag an edge of the rectangle. 226 | ZE5 Cell Analyzer and Everest Software...
- Page 229 Using Plot and Histogram Tools To add an ellipse region to a plot In the plot and histogram toolbar, click Add Ellipse Region. An ellipse is added to the plot. To move the ellipse to another part of the plot, point inside the region. When the pointer changes to a hand, use it to drag the ellipse.
- Page 230 When the pointer changes to a hollow plus sign, use it to drag an edge of the ellipse. To rotate the ellipse, point inside the region. When the rotation arrow appears on one corner, drag it to rotate the ellipse. 228 | ZE5 Cell Analyzer and Everest Software...
- Page 231 Using Plot and Histogram Tools To add a quadrant region to a plot Note: Quadrants apply only to density plots. In the plot and histogram toolbar, click Add Quadrant Regions. Quadrants are added to the plot. To move the quadrant dividers, point to the center circle. When the pointer changes to a hand, use it to drag the horizontal divider up or down, or use it to drag the vertical divider to the left or right.
- Page 232 Note: Do not apply hit detection, data tracking, or heat maps to quadrant regions in the Settings workpace; wait until you have applied the experiment to the Acquisition workspace. 230 | ZE5 Cell Analyzer and Everest Software...
- Page 233 Using Plot and Histogram Tools To add a polygon region to a plot In the plot and histogram toolbar, click Add Polygon Region. Click inside the plot where you want the first corner of the polygon. Move the pointer and click again to create more corners of the polygon. Double-click to finish drawing the polygon.
- Page 234 When the pointer changes to a hand, use it to drag the polygon. To rotate the polygon, point inside the region. When the rotation arrow appears on one corner, drag it to rotate the polygon. To resize the polygon, point to its outline. 232 | ZE5 Cell Analyzer and Everest Software...
- Page 235 Using Plot and Histogram Tools When the pointer changes to a double-headed arrow, use it to drag an edge of the polygon. To delete any type of region from a plot Click the x that appears on the upper right of the region. User Guide | 233...
-
Page 236: Adding Bar Regions To Histograms
To move the bar region to the left or right, point inside the region. When the pointer changes to a four-headed arrow, use it to drag the bar region. To resize the bar region, point to its left or right edge. 234 | ZE5 Cell Analyzer and Everest Software... -
Page 237: Renaming Regions
Click the x that appears in the upper right of the region. Renaming Regions You can rename regions created in plots or histograms. Bio-Rad recommends that you rename regions before you base gates on the regions. To rename a region Double-click the region name. -
Page 238: Applying Filters (Gates)
A list of available filters appears. Select the checkbox for the filter that you want to apply. The applied region is shown in the upper left corner of the plot or histogram. 236 | ZE5 Cell Analyzer and Everest Software... - Page 239 Using Plot and Histogram Tools The reconfigured plot displays only the data that fall into the region applied in the filter. To remove a filter from a plot or histogram Point to the plot or histogram. Click Remove Filter in the plot and histogram toolbar that appears. The filter is removed form the plot or histogram.
-
Page 240: Applying Filters (Gates) Using Multiple Regions
To apply sequential filters to a plot or histogram Create a region on a plot or histogram. Point to a second plot and click Apply Filter in the plot and histogram toolbar. A list of available filters appears. 238 | ZE5 Cell Analyzer and Everest Software... - Page 241 Using Plot and Histogram Tools Select the region that you created in the first plot. The applied region is shown in the upper left corner of the plot or histogram. Add a region to the second plot. User Guide | 239...
- Page 242 The filter in the upper left corner of the plot or histogram indicates that the plot shows the subset of data from the first region (R3) that also appear in the second region (R4). 240 | ZE5 Cell Analyzer and Everest Software...
-
Page 243: Applying Gate Limits
Using Plot and Histogram Tools Applying Gate Limits Use the Gate Limit tool in the workspace to apply a limit to a region. Acquisition stops when the specified number of events has accumulated in the region or when sample is depleted. To apply a gate limit to a region Point to a plot or histogram that contains the region(s) that you want to gate. -
Page 244: Assigning Data Track Regions
Point to a density plot that contains the region where you want to use data tracking. The plot and histogram toolbar appears. Click Assign Data Track Regions. In the Available Track Region area that appears, select the region where in which to track data. 242 | ZE5 Cell Analyzer and Everest Software... - Page 245 Using Plot and Histogram Tools If needed, modify the target percentage in the Events box. The default value is 20%. The tracked region is outlined in blue. Point outside the plot to save your changes. Note: When specifying the target percentage, leave some room for margin of error to avoid pausing acquisition for samples with regions that come very close to meeting the target percentage.
-
Page 246: Applying Heat Maps
To apply regions to a heat map Point to a plot or histogram that contains the region(s) that you want to apply to a heat map. The plot and histogram toolbar appears. 244 | ZE5 Cell Analyzer and Everest Software... - Page 247 Using Plot and Histogram Tools Click Assign Heat Map Region. In the Available Heat Map Regions dialog box that appears, select the checkbox for each region that you want to apply to the heat map. User Guide | 245...
- Page 248 Chapter 7 Creating Experiments and Workspaces Point outside the plot or histogram to save your changes. Heat mapping is indicated with a pie chart symbol above the region. 246 | ZE5 Cell Analyzer and Everest Software...
-
Page 249: Configuring Hit Detection
Using Plot and Histogram Tools To compare samples using heat maps During acquisition or analysis, point to a position on the plate map. View the heat map that appears for the position. The percentage for the region is shown on each pie slice. To remove regions from a heat map Point to the plot or histogram that contains the region(s) assigned the heat map. - Page 250 If needed, modify the threshold percentage for hit detection in the Threshold box. The default value is 15%. The hit region is indicated with a target symbol. Point outside the plot or histogram to save your changes. 248 | ZE5 Cell Analyzer and Everest Software...
-
Page 251: Adding Diagonal Separators To Plots
Using Plot and Histogram Tools To remove hit detection from a region Point to a plot or histogram that contains the region that uses hit detection. The plot and histogram toolbar appears. Click Assign Hit Regions. In the Available Hit Region dialog box, clear the checkbox of the region for which you want to remove hit detection. -
Page 252: Applying A Region To All Plots
After setting up a region on a plot or histogram, you can apply this region as a filter on all other plots or histograms in the workspace. Note: The change applies to all plots or histograms in the experiment. 250 | ZE5 Cell Analyzer and Everest Software... -
Page 253: Adding Annotations To Plots
Using Plot and Histogram Tools To apply a region to all plots Point to the plot or histogram that contains the region(s) you want to use. The plot and histogram toolbar appears. Click Apply Gate to all Plots. Do one of the following: Click Copy to copy the region to other plots of the same type. - Page 254 To change the font size, double-click the text and click the T symbol in the toolbar that appear. Use the slider to increase or decrease the size. To move the annotation, drag it to another part of the plot or histogram. 252 | ZE5 Cell Analyzer and Everest Software...
-
Page 255: Using Plot Ratios
Using Plot and Histogram Tools To remove the annotation, double-click it and press Delete. Using Plot Ratios Everest Software allows you to select one parameter as the numerator of a ratio, and a different parameter as the denominator of the ratio. You can then plot this signal ratio against time; this can be useful in time-based assays. - Page 256 Chapter 7 Creating Experiments and Workspaces Select a second parameter to use for the ratio denominator. Specify axis scaling, display of compensated data, and pulse measurement as needed. Click Apply. 254 | ZE5 Cell Analyzer and Everest Software...
- Page 257 Using Plot and Histogram Tools The modified time plot appears. The y-axis uses the ratio of the first parameter to the second parameter. User Guide | 255...
-
Page 258: Exporting Plots And Histograms
In the Save As dialog box, browse to a location in which to save the file. Type a name for the file and click Save. The plot or histogram is exported as a PNG file. 256 | ZE5 Cell Analyzer and Everest Software... -
Page 259: Configuring Instrument Settings
Configuring Instrument Settings Configuring Instrument Settings In addition to setting up plots in the workspace, you can use the Settings screen of the Experiment Builder to enter initial instrument settings such as PMT voltages, laser power, and primary and secondary trigger and threshold. Note: The default PMT voltage values are those set at the most recent QC baseline. -
Page 260: Pmt And Laser Controls
— allows you to select and name acquisition parameters. If a parameter is not selected, the box remains unselected, appears gray, and is not acquired or included in the FCS data file. 258 | ZE5 Cell Analyzer and Everest Software... - Page 261 Configuring Instrument Settings Table 38. PMT and Laser Control Items, continued Item Function Editable parameter name — each parameter name is editable and is saved with the acquired FCS data. When changed, this name propagates to plot and histogram axes, compensation screens, and the Filter Configuration dialog box.
- Page 262 FCS file. Tip: When utilizing a trigger parameter in log display, set a threshold value of less than 1% to allow display of data in the lower log decades. 260 | ZE5 Cell Analyzer and Everest Software...
- Page 263 Configuring Instrument Settings Table 38. PMT and Laser Control Items, continued Item Function Current threshold position (threshold plot) — this live data plot shows all the data seen by the acquisition electronics in the trigger parameter. The current threshold position is indicated by the dotted line.
-
Page 264: Setting Up Multiple Panels
In the Name screen, type name for the new panel in the Current Panel box. Click the Next arrow to go to the Fluorophores screen. Define a new set of activated parameters and parameter names. 262 | ZE5 Cell Analyzer and Everest Software... - Page 265 Setting Up Multiple Panels Click the Next arrow to go to the Samples screen. Positions programmed for the previous panel are shown in black; any positions created for the new panel appear as usual. User Guide | 263...
- Page 266 Click Apply to apply the experiment, including all of the panels, to the workspace. When you move to Acquisition mode, the ZE5 Cell Analyzer will acquire the whole plate or set of tubes in a single run and will respect the settings adjustments optimized for each panel in Setup mode;...
-
Page 267: Running Or Saving The Experiment
Running or Saving the Experiment Running or Saving the Experiment After configuring the workspace and initial instrument settings in the Settings screen of the Experiment Builder, you are ready to acquire your samples, as explained in Chapter 8, Acquiring Samples. To run or save the experiment Do one of the following: To load the completed run list, click Apply. -
Page 268: Running A Quick (Stat) Sample
See the following sections for more information: Chapter 8, Acquiring Samples PMT and Laser Controls on page 258 Creating Plots and Histograms on page 209 266 | ZE5 Cell Analyzer and Everest Software... -
Page 269: Adding A Stat Tube To A Plate Or Rack
Running a Quick (Stat) Sample Adding a Stat Tube to a Plate or Rack To accommodate large volumes of sample, you can add a single stat tube to an experiment that is based on a plate or tube rack. An added stat tube can be assigned only the Sample position type; it cannot be assigned as Wash, Reagent, or Setup. - Page 270 Click Sample to select the Sample position type for the stat tube. Specify other settings for the stat tube such as stop limits and target event or flow rate. Click Plate View to return to setting up the plate or rack. 268 | ZE5 Cell Analyzer and Everest Software...
- Page 271 Running a Quick (Stat) Sample The added stat tube is indicated with a symbol in the upper left area of the plate map. User Guide | 269...
-
Page 272: Running An Existing Experiment
Do one of the following: If the experiment session that you want to run is in the list of recently displayed items, click Run for the experiment session. The experiment session is applied to the workspace. 270 | ZE5 Cell Analyzer and Everest Software... - Page 273 Running an Existing Experiment If the experiment session that you want to run is not in the list of recently displayed items: Click Load Run List in the upper right. Browse to find the experiment that you want to run. Select the .rlst file and click Open.
-
Page 274: Importing Settings
In the Home window, click Import Settings. Find the run list file that contains the desired settings, select it, and click Open. In the Home window, expand the list in the Recent Experiment Sessions panel. For the experiment session that contains the desired settings, click Import. 272 | ZE5 Cell Analyzer and Everest Software... - Page 275 Importing Settings The Experiment Builder opens at the Name screen, where you can assign a name for the new experiment that uses the imported settings. In the Fluorophores screen, you can use the imported fluorophore and detection settings as-is, or you can modify them. In the Samples screen, you will need to select a media type and set up controls and samples for the experiment, because these settings are not imported.
- Page 276 Chapter 7 Creating Experiments and Workspaces 274 | ZE5 Cell Analyzer and Everest Software...
-
Page 277: Chapter 8 Acquiring Samples
Chapter 8 Acquiring Samples For information about the types of files produced during acquisition, see File Types in Everest Software on page 301. Loading Sample Media After configuring your experiment in the Everest™ Experiment Builder and applying it, load your samples into the instrument. -
Page 278: Setup Mode Controls
For a stat tube, the Setup button does not appear; sampling occurs in Setup mode by default. Tip: To edit an experiment, navigate to the Instrument Control panel in Setup mode and click Edit. 276 | ZE5 Cell Analyzer and Everest Software... - Page 279 Loading Sample Media Table 39. Setup Mode Control Items Item Function View Run List — expands the run list to display settings for the current experiment. Edit Experiment — guides you through the Experiment Builder to modify the experiment as needed. —...
-
Page 280: Acquiring Initial Sample In Setup Mode
While the system is acquiring sample in Setup mode, the following functions are disabled: Initiating the ZE5-EYE process Shutting down Everest Software and the ZE5 Cell Analyzer In the Instrument tools: Returning sample probe to home position Cleaning the sample line and probe... - Page 281 Loading Sample Media Unclogging the sample line, probe, and flow cell Swapping QC beads Pausing the sheath fluid and disabling the lasers Opening the sample loader door Everest Software enables these functions when sample acquisition is complete. To acquire sample in Setup mode Ensure that the correct experiment has been created and loaded.
- Page 282 Chapter 8 Acquiring Samples In the plate map, click the position from which to start sampling. The current position is outlined in red. Click Play to initiate sampling. 280 | ZE5 Cell Analyzer and Everest Software...
- Page 283 Loading Sample Media The probe moves to the selected position, sample is boosted to the flow cell, and sampling begins. Adjust the flow rate by setting a target volume or event rate as needed. Configure the settings for the current sample by selecting the trigger, setting the threshold, and adjusting the PMT voltages.
-
Page 284: Acquisition Mode Controls
— allows you to apply agitation to a sample that has been sitting for an extended period. Click to turn on agitation at the default speed for the media type. Click again to turn off agitation. 282 | ZE5 Cell Analyzer and Everest Software... -
Page 285: Running Samples In Acquisition Mode
While the system is acquiring sample in Acquisition mode, the following functions are disabled: Initiating the ZE5-EYE process Shutting down Everest Software and the ZE5 Cell Analyzer In the Instrument tools: Returning sample probe to home position Cleaning the sample line and probe Unclogging the sample line, probe, and flow cell Swapping QC beads... - Page 286 List. The run list proceeds as determined in the Experiment Builder, starting from the selected position. To stop the run list before acquisition is complete for all positions, click (Stop) Run List. 284 | ZE5 Cell Analyzer and Everest Software...
-
Page 287: Using High-Throughput Mode
Loading Sample Media Using High-Throughput Mode In high-throughput mode, acquisition time is greatly reduced. Wells are sampled continuously with no boosting to the flow cell in between. In this mode, multiple samples occupy the sample line at the same time. To use high-throughput mode, you must use the Experiment Builder to program it into your run list. -
Page 288: Pausing, Stopping, And Resuming Samples And Experiments
Sample acquisition stops until you are ready to restart it manually. You can use this method to pause after running compensation controls, or to verify results obtained so far. 286 | ZE5 Cell Analyzer and Everest Software... -
Page 289: Stopping And Resuming An Experiment
Pausing, Stopping, and Resuming Samples and Experiments To insert a pause step into a run list Add a Pause After step to a sample position. For more information, see High Throughput, Pause After, Volumetric Counting, and Return Sample Settings on page 194. -
Page 290: Exporting Fcs And Rlst Data Files
To export the FCS file for a single position on the plate data to FCS and RLST Click Export Data in the Tools section of the Acquisition toolbar or the Share section of the Analysis toolbar. The Export Data dialog box appears. 288 | ZE5 Cell Analyzer and Everest Software... - Page 291 Exporting FCS and RLST Data Files Positions for which data have not been acquired and saved are indicated with a red circle rather than a check mark, and the option to export does not appear. To export data for a single position, click the export button for the position in the right column. In the Browse For Folder dialog box that appears, do one of the following: Click OK to accept the default location ( D:\EverestUsers\Export).
-
Page 292: Exporting Fcs And Rlst Data Files
Click Make New Folder to create a new folder in the \Export folder, or browse to another location, rename the new folder and Click OK. Everest Software saves the FCS file for that position. 290 | ZE5 Cell Analyzer and Everest Software... -
Page 293: Chapter 9 Applying Fluorescence Compensation
Chapter 9 Applying Fluorescence Compensation Everest™ Software offers simplified workflows for both manual and automatic compensation. To perform automatic compensation, acquire single-color controls using the Everest compensation template. You can then adjust regions to define the positive populations in all controls’ channels and initiate the automatic compensation calculation. - Page 294 In the Selected Fluorophores panel, enable the Negative Control if your experiment includes one. Enable Compensation to automatically set up fluorophores as controls. To use the negative control as a universal negative in automatic compensation calculations, select the Use Universal Negative checkbox. 292 | ZE5 Cell Analyzer and Everest Software...
- Page 295 Setting Up the Experiment Set up samples. User Guide | 293...
- Page 296 Tip: When creating plots for the samples, select the Comp option for each axis in the plot builder to show compensated parameters on the plots. Click Apply to apply the experiment to the workspace. 294 | ZE5 Cell Analyzer and Everest Software...
-
Page 297: Adjusting Compensation Automatically
Adjusting Compensation Automatically Adjusting Compensation Automatically For automatic compensation, you must use the Compensation template so that Everest Software can reliably attribute signals to the proper detector and accurately calculate compensation. To automatically calculate compensation After setting up the workspace using the Compensation template, record all of the control positions either by using the Record button in Setup mode or running the control samples in Acquisition mode. - Page 298 Click the down arrow next to the Compensation button. Select options as needed: Prevent Automatic Region Determination — If this option is not selected, Everest Software performs automatic region determination and adjusts the regions in all plots for each control 296 | ZE5 Cell Analyzer and Everest Software...
- Page 299 Adjusting Compensation Automatically automatically. If this option is selected, Everest Software respects the regions that you configured in the parameters’ histograms to determine positive and negative populations for compensation. It adjusts the regions in the other plots for each control to match your regions. Only Current Sample —...
-
Page 300: Adjusting Compensation Manually
Tip: If you did not use the Everest compensation template to set up compensation control plots, ensure that y-axis of the control plot is designated as Comp, but that the x-axis is not. For 298 | ZE5 Cell Analyzer and Everest Software... -
Page 301: Editing The Compensation Matrix
Adjusting Compensation Manually experimental sample plots, both axes should be designated as Comp if you want to view compensated data. To perform manual compensation by manipulating the plots directly Point to one of the compensation plots. When the pointer changes to a hand, drag it over the positive population to increase compensation and move the population out of the spillover channel. - Page 302 Save the adjusted compensation values by clicking the X in the upper right corner. Tip: When viewing compensated data, ensure that the Comp option has been selected for the plot axes; otherwise non-compensated data are displayed. 300 | ZE5 Cell Analyzer and Everest Software...
-
Page 303: Chapter 10 Analyzing, Saving, And Printing Data
Chapter 10 Analyzing, Saving, and Printing Data You can access the Everest™ Software Analysis tab by first acquiring data in the Acquisition tab and then sending it to the Analysis tab, or you can directly click the Analysis tab and load a previously acquired experiment session. -
Page 304: Analyzing Data
Note: Wait for acquisition to complete or stop acquisition before moving data to analysis. To access the Analysis tab Acquire data in the Acquisition tab. Do one of the following: Click Analyze in the Quick Actions section of the toolbar. Click the Analysis tab. 302 | ZE5 Cell Analyzer and Everest Software... -
Page 305: Loading Previous Experiments
Analyzing Data Loading Previous Experiments In the Analysis tab, you can view data from previous experiments. To load an experiment in Analysis Click the Analysis tab. In the Recent Experiment Sessions panel, expand the list of recent experiments. Do one of the following: If the experiment session that you want to analyze is in the list of recently displayed items, double-click it. -
Page 306: Resuming Experiment Analysis
During analysis, you can click Home to return to the Analysis start window. From here, you can either click Resume to resume analysis of the previous experiment or click Load Experiment to load a different experiment for analysis. 304 | ZE5 Cell Analyzer and Everest Software... -
Page 307: Analysis Toolbar
Analyzing Data Analysis Toolbar In the Analysis tab, the toolbar contains three sections of tools to assist in performing data analysis: Tools, Comp, and Share. Table 41. Analysis toolbar buttons and their functions Button Function Tools Home — returns to the Analysis start window, where you can load a new experiment to analyze or resume analysis of the current experiment. -
Page 308: Working With Plots And Statistics In The Analysis Tab
For more information, see Dragging Populations on page 298. Click Refresh in the Tools section of the toolbar to update the displayed data. 306 | ZE5 Cell Analyzer and Everest Software... -
Page 309: Working With Compensation In The Analysis Tab
Analyzing Data Below the plate map, the following information about the selected position is displayed: Sample position Sample name Sample type (Sample, Compensation/Control, Wash, or Reagent) Target Flow Rate (μl/sec) or Target Event Rate (events/sec) Sample Volume (μl) Event Limit Event Count Below this area, you can click the Voltages arrow to display or hide PMT voltage conditions at the time of data acquisition. -
Page 310: Exporting Data To Csv
In the Save As dialog box, click Save. The data are saved to a CSV file. For information on exporting data to FCS and RLST files, see Exporting FCS and RLST Data Files on page 288. 308 | ZE5 Cell Analyzer and Everest Software... -
Page 311: Sending Analysis Settings To Acquisition
Publishing Data Sending Analysis Settings to Acquisition After applying compensation or making other changes in the Analysis tab, you can resubmit an experiment run list to be reacquired. This allows the calculated compensation to be applied during acquisition and saved within the resulting FCS file. To send analysis settings to acquisition Click Send Run List to Local Instrument in the Share section of the toolbar. -
Page 312: Publish Toolbar
Drag a plot to another position in the workspace. Tip: To help you align items in the workspace, X and Y coordinates are provided in the Plot Control section of the Publish toolbar. 310 | ZE5 Cell Analyzer and Everest Software... -
Page 313: Printing A Report For The Selected Position
Publishing Data To delete a plot Do one of the following: Click the X in the upper right corner of the plot. Click the plot, then click Delete selected plot in the Plot Control section of the Publish toolbar. Printing a Report for the Selected Position You can either send a report for one position directly to a printer, or save it as a PDF for later printing or viewing. -
Page 314: Printing A Report For All Positions
Click Print. To generate a PDF for the report: Select Adobe PDF. Click Print. In the Save PDF As dialog box, browse to a location, specify a file name, and click Save. 312 | ZE5 Cell Analyzer and Everest Software... -
Page 315: Chapter 11 Reports
You can export reports to CSV so that Bio-Rad Technical Support can assist you with troubleshooting. Quality Control and ZE5-EYE Reports Three report tools are available to track performance of the ZE5™ Cell Analyzer: daily QC reports, QC trending reports, and ZE5-EYE trending reports. Reports Tools The buttons available to you in the Reports section of the toolbar depend on whether you have administrative rights. - Page 316 Chapter 11 Reports The most recent daily QC report appears. A green checkmark appears next to those detectors whose CV, PMT voltage, and ZE5-EYE values pass the QC criteria. When all values for all detectors are green, the QC status is Passed.
- Page 317 Quality Control and ZE5-EYE Reports If more than one report exists for a date, click the time selector and select a time. To perform other actions on QC reports Point to the report and select an option from the buttons that appear.
-
Page 318: Generating Qc Trending Reports
To view a QC trending report for a different laser, click its tab. To export the QC trending report to a comma-delimited file: Click Export to CSV. Specify a file name and location. Click Save. 316 | ZE5 Cell Analyzer and Everest Software... -
Page 319: Generating Ze5-Eye Trending Reports
Quality Control and ZE5-EYE Reports Generating ZE5-EYE Trending Reports The EYE trending report facilitates visualization of ZE5-EYE data (PMT voltages) over time. Data are organized by laser. Each detection channel is represented by a unique color and can be shown or hidden as needed. -
Page 320: Generating User Reports
In the Home window, click User Reports. Set the date range for the report by selecting dates from the Start date and End date calendars. To export the report to a CSV, click Export Data. 318 | ZE5 Cell Analyzer and Everest Software... -
Page 321: Chapter 12 Maintenance
Chapter 12 Maintenance To ensure reliable operation of the ZE5™ Cell Analyzer and accuracy of experimental results, perform preventive maintenance regularly. Important: Always follow the personal protective equipment (PPE) guidelines relevant to your laboratory’s safety procedures for handling the chemicals recommended in this section and for any biohazards encountered during instrument maintenance, including the waste bottles. -
Page 322: Monthly
Bio-Rad recommends that you purchase the annual preventative maintenance (PM) plan offered with the ZE5 Cell Analyzer. The PM plan includes but is not limited to an annual onsite visit by a Bio-Rad Service engineer to: Replace peristaltic pump heads (6) -
Page 323: Cleaning Solutions
Cleaning Solutions Cleaning Solutions Important: Always follow the PPE guidelines relevant to your laboratory’s safety procedures for handling the following recommended disinfectants. Disinfectants for Use in Sample Line 70% ethanol in DI water Bleach (sodium hypochlorite) solution with a maximum concentration of 5,800 ppm active chlorine (a 1:10 dilution, which is roughly equivalent to 10% active chlorine). -
Page 324: Unclogging The Sample Line And Probe
To unclog the sample line and probe In the System section of the toolbar, click Unclog Sample Line in the Instrument Tools dropdown list. To view unclog details, click the down arrow. 322 | ZE5 Cell Analyzer and Everest Software... - Page 325 Unclogging the Sample Line and Probe The system is ready for use when this process is complete, but you can choose to run the QC process to confirm that the clog has been cleared. Important: To avoid clogs when working with cells, resuspend cells into single cell suspension and use a 40 µm or smaller filter prior to cell analysis.
-
Page 326: Cleaning The Sample Line And Probe
In the System section of the toolbar, click Clean the Sample Probe in the Instrument Tools dropdown list.. Follow the directions that appear on screen. The system is ready for use when this process is complete, but you can choose to run the QC process afterward. 324 | ZE5 Cell Analyzer and Everest Software... -
Page 327: Decontaminating The System
Decontaminating the System Decontaminating the System Note: Bio-Rad strongly recommends that your preventive maintenance program include decontamination of the entire ZE5 Cell Analyzer fluidics system. You can use the Decontamination wizard to completely decontaminate the system using 1% filtered bleach solution (25 ml household bleach and 2.475 L filtered water). See Cleaning Solutions on page for details. -
Page 328: Required Materials
Before beginning the decontamination process you must Decontaminate the outside of the probe with 10% bleach solution. Prepare bleach and rinse bottles for decontamination. Replace both sheath bottles with bottles filled with 2.5 L diluted 1% bleach. 326 | ZE5 Cell Analyzer and Everest Software... - Page 329 Decontaminating the System Replace the additive and cleaner bottles with bottles filled with 200 ml diluted 1% bleach. This section explains how to decontaminate the probe and prepare the bleach solution. Tip: You can prepare the bottles while the system is decontaminating the probe. To decontaminate the probe and sample lines Prepare 100 ml of filtered bleach solution using a 0.2 µl filter flask or syringe filter.
-
Page 330: Decontaminating The System
Before running the wizard, ensure that the waste bottles are empty. The bottles containing the bleach solution must be filled no more than halfway. Important: When handling sheath fluid and DI water bottles, always wear gloves and minimize air exposure to help avoid contamination. 328 | ZE5 Cell Analyzer and Everest Software... - Page 331 Decontaminating the System To decontaminate the system Before starting the procedure, ensure that you have performed the steps in Preparing for the Decontamination Process on page 326. The Decontamination wizard will prompt you to replace the existing bottles. In the System section of the toolbar, click Decontamination in the Instrument Tools dropdown list. The Decontamination wizard starts.
- Page 332 If you have not completed the preparation steps, click Cancel to stop the Decontamination wizard and perform the steps in Preparing for the Decontamination Process on page 326 before continuing. To view the decontamination progress details, click the down arrow on the Decontamination button. 330 | ZE5 Cell Analyzer and Everest Software...
- Page 333 Decontaminating the System User Guide | 331...
- Page 334 Approximately 190 min into the procedure, the system prompts you to replace both sheath bottles with bottles filled to the Fill Line with sheath fluid, and replace the additive and cleaner bottles with the default (original) bottles filled to the Fill Line with the appropriate solutions. 332 | ZE5 Cell Analyzer and Everest Software...
- Page 335 Decontaminating the System After replacing the bottles, click Complete. Everest Software initiates a fluidics startup and then a fluidics shutdown to complete the process. This can take an additional 12 min. After decontamination completes, the user login window appears. User Guide | 333...
-
Page 336: Cleaning The Optical Filters
Chapter 12 Maintenance Cleaning the Optical Filters The optical filters used in the ZE5 Cell Analyzer lose performance when dirt, dust, or fingerprints are present on the glass surface. Regularly inspect and clean these optical components to maintain high system performance. See... -
Page 337: Replacing The Qc Beads
Replacing the QC Beads Bio-Rad suggests that you replace the QC beads when the QC calibration bead volume is low (less than 150 μl), as indicated in the fluidics status. If the fluid level in the calibration bead bottle drops too low, the system displays air bubble warning messages. - Page 338 Chapter 12 Maintenance The QC Bead Swap dialog appears. In the ZE5 Cell Analyzer, replace the QC bead bottle. In the QC Bead Swap dialog box, select the appropriate update options: If you replace the QC bead bottle with a bottle that is not full, clear the Reset bead volume to full checkbox.
- Page 339 Replacing the QC Beads Note: In order for the next QC calibration to become the new QC baseline, you must select the Change bead lot number checkbox and provide the new bead lot number, for example: Click Continue. The recalibration process verifies the new median range for CV and PMT voltages in each channel for the new bead lot against the previous QC baseline set by the administrator.
-
Page 340: Maintaining The System When Not In Use
Everest Software includes a vacation mode, which you can use to schedule regular and automatic startup and QC on the instrument regardless of whether an operator is in the lab. For more information, see Setting Up Vacation Mode on page 116. 338 | ZE5 Cell Analyzer and Everest Software... -
Page 341: Appendix A Troubleshooting
Exporting and Viewing Log Files Everest system log files contain information that is helpful in troubleshooting problems with the system. Bio-Rad Technical Support might ask you to provide these files so that they can better assist you in resolving problems. -
Page 342: Deleting Acquired Data Files
Users can then rerun the experiment and collect data in future sessions. Important: Everest Software does not back up data or run list files. Bio-Rad strongly suggests that you use the Export Run List and FCS Files option to export the experiment’s run list and all associated FCS files before performing this procedure. - Page 343 Deleting Acquired Data Files At least one folder labeled with a global unique identifier (GUID) The experiment’s run list (.rlst) file (5Color_2.rlst in this example) A run list status (.rlstatus) file for each GUID folder The instrument.definition file The GUID folder contains the FCS data that you recently acquired for the session. If you have more than one GUID folder, open each folder and locate those that contain a folder labeled fcs.
-
Page 344: Viewing Everest Software 2.0 Fcs Files In Flowjo Software
To configure FlowJo to recognize Everest Software 2.0 FCS files Open FlowJo Software and import an Everest 2.0 FCS file. On the FlowJo toolbar, click Instrumentation. You should see the ZE5 Cell Analyzer instrument listed as ZE5. On the FlowJo toolbar, click Preferences. -
Page 345: Fluidics Issues
Fluidics Issues Fluidics Issues Error Possible causes Troubleshooting steps System suddenly Bulk fluidics bottles empty Empty the waste and refill DI water bottles as shuts down necessary. See Refilling Bulk Fluidics on page 143. DI water uptake line and filter Ensure that the filter on the DI water uptake in wrong position line falls into the lower corner of the bottle on... -
Page 346: Acquisition/Event Issues
0 during acquisition Then, adjust the trigger voltage and threshold value until data appear as expected in the plots in the workspace. Configuring Instrument Settings on page 257. 344 | ZE5 Cell Analyzer and Everest Software... - Page 347 Run the cleaning process, using bleach. See Cleaning the Sample Line and Probe on page 324. If this does not resolve the problem, contact Bio-Rad Technical Support for assistance. Flow cell dirty Ensure that the flow cell is clean. Built-up cellular...
- Page 348 1. Run the cleaning process. Cleaning the Sample Line and Probe on page 324. 2. Run the Decontamination wizard. See Decontaminating the System on page 325. 346 | ZE5 Cell Analyzer and Everest Software...
- Page 349 Acquisition/Event Issues Error Possible causes Troubleshooting steps Dramatic change in PMTs for all Incorrect beads used Ensure single peak ZE- channels Series QC Beads are being used. ProLine™ Rainbow Beads or ProLine™ Universal Calibration Beads do not fluoresce in certain channels, especially for the UV and violet lasers.
- Page 350 Note that settled samples might require a longer agitation than usual. Activating Agitation on page 203, Setup Mode Controls on page 276, and Acquisition Mode Controls on page 282. 348 | ZE5 Cell Analyzer and Everest Software...
- Page 351 Acquisition/Event Issues Error Possible causes Troubleshooting steps High event rate Trigger channel voltage too high Decrease the trigger channel voltage until data start to appear in the threshold plot. Then, adjust the trigger voltage and threshold value until data appear as expected in the trigger channel plot in the workspace.
- Page 352 Run the QC process again. Running Quality Control on page 156. Beads have gone bad or expired Install a new bottle of QC beads. See Replacing the QC Beads on page 335. 350 | ZE5 Cell Analyzer and Everest Software...
- Page 353 Acquisition/Event Issues Error Possible causes Troubleshooting steps Incorrect optical filter in place Run the ZE5-EYE to ensure that installed filters match the filter configuration in Everest Software. See Using the ZE5-EYE to Confirm Filter Choices on page 135. High fluorescence...
- Page 354 PMTs set too high or too low to Edit PMT voltages in Setup see data mode or change trigger threshold in order to visualize data. See Configuring Instrument Settings on page 257. 352 | ZE5 Cell Analyzer and Everest Software...
- Page 355 Contact Bio-Rad Technical Support for assistance with checking for leaks in the sample line connection. Incorrect optical filter in place Run the ZE5-EYE process to ensure that all filters are correct and in the right locations. See Using the ZE5-EYE to Confirm Filter Choices on page 135.
- Page 356 Bead bottle empty Replace bead bottle. See Replacing the QC Beads on page 335. Bead bottle has been diluted Replace bead bottle. See Replacing the QC Beads on page 335. 354 | ZE5 Cell Analyzer and Everest Software...
- Page 357 Acquisition/Event Issues Error Possible causes Troubleshooting steps Noisy threshold plot Debris in sample line Follow these steps, testing after each to determine whether the problem has been resolved: 1. Run the cleaning process. Cleaning the Sample Line and Probe on page 324.
- Page 358 Large number of doublets in Adjust the flow rate down. sample Unexpected fluorescence signal Free dye accumulating in sample Run the cleaning process. line Cleaning the Sample Line and Probe on page 324. 356 | ZE5 Cell Analyzer and Everest Software...
- Page 359 Lasers turned off Turn on lasers in software. Configuring Instrument Settings on page 257. Lasers misaligned Contact Bio-Rad Technical Support. User Guide | 357...
-
Page 360: Hardware/Electronics/Laser Issues
Recalibrate the probe, using custom media stops settings if needed. See Media Selector on page Incorrect plate inserted Place the sample into a plate that is compatible with the ZE5 Cell Analyzer. 358 | ZE5 Cell Analyzer and Everest Software... -
Page 361: Appendix B Example 9-Color Immunophenotyping Experiment
Example 9-Color Immunophenotyping Experiment This section provides an example of how to set up a typical multicolor experiment using the ZE5™ Cell Analyzer and Everest™ Software. It shows how to set up compensation controls using the compensation template and how to apply auto compensation. The sample experiment uses the... -
Page 362: Setting Up Fluorophores And Controls
In the Selected Fluorophores pannel, double-click fluorophore names in the Fluorophores list to add them to the Selected Fluorophores list. In the Available Detection panel, change the parameter names to reflect the cell markers used in the experiment. Click the Next arrow. 360 | ZE5 Cell Analyzer and Everest Software... - Page 363 Setting Up Fluorophores and Controls Select the Media type, for example, 40 Tube Rack. In the Template area of the Selected Fluorophores panel, click Negative Control to indicate that the experiment will use a negative control. The first position in the compensation template is automatically assigned to the negative control, as shown in the next figure.
-
Page 364: Setting Up The Sample And Sampling Parameters
Next, set up a fully stained sample and specify settings such as gate limits, agitation time, and target flow rate or target event rate. In the Plate Setup pane, select an unused position and then click Sample for the position type. 362 | ZE5 Cell Analyzer and Everest Software... - Page 365 Setting Up the Sample and Sampling Parameters (Optional) To change the sample name, click the name box in the Sample Naming pane and type a new name. User Guide | 363...
- Page 366 The volume defaults to the maximum volume for the media type you are using. You will set sample and control gate limits in the Settings screen after completing the plate setup. In the Volume box, enter the actual volume used in the tubes for this experiment. 364 | ZE5 Cell Analyzer and Everest Software...
- Page 367 Setting Up the Sample and Sampling Parameters Specify any other sampling parameters to apply to these positions, such as agitation or target flow rate or target event rate. Click the position for the last compensation control. Click Pause After to instruct the run list to pause after the last compensation control is acquired. This allows you to perform automatic compensation before running the fully stained sample.
-
Page 368: Creating Plots For The Experimental Sample
Creating Plots for the Experimental Sample Click the sample position in the plate map and click Create Density Plot. Create a forward scatter versus side scatter plot (FSC/SSC) for the 488 laser. 366 | ZE5 Cell Analyzer and Everest Software... - Page 369 Creating Plots for the Experimental Sample Create plots for the remaining parameters in the experiment. For each plot, click Comp so that the plots will display compensated data. Create a region in the FSC/SSC plot. This region will be used to apply a gate limit to the other plots. In the Gate area of the toolbar, apply a gate limit to the sample by typing a value in the Limit box and then clicking Sample.
-
Page 370: Acquiring Initial Data
Click the first position in the template. This is the position from which the instrument will start sampling. In the Instrument Control panel, ensure that Setup mode is active. Click Play. The system displays plots in the workspace. 368 | ZE5 Cell Analyzer and Everest Software... - Page 371 Acquiring Initial Data In the FSC/SSC plot, position the gate over the relevant part of the sample population. In the PMT Control panel, adjust PMT voltages to position the population. After setting up gates and voltages, click Record to save data for the sample. This clears existing data, disables PMT adjustment, and starts saving a data file.
- Page 372 Note: A check mark appears on the control positions in the Instrument Control panel to show that they have been acquired. 370 | ZE5 Cell Analyzer and Everest Software...
-
Page 373: Performing Initial Data Analysis
Performing Initial Data Analysis 13. After acquisition is complete, click Analyze on the toolbar to move data to the Analysis tab. Performing Initial Data Analysis When applying automatic compensation, you have two options: Manually adjust regions to include stained populations and instruct the automatic compensation process to include these manually adjusted regions. - Page 374 FCS files for any samples that are subsequently acquired. If all sample acquisition is done before compensation is performed, compensation settings will not be saved within the FCS files. 372 | ZE5 Cell Analyzer and Everest Software...
-
Page 375: Performing Automatic Compensation
Performing Automatic Compensation Performing Automatic Compensation Before running the fully stained sample, perform automatic compensation. The FCS file for the fully stained sample will be exported with the compensation matrix. Data are exported in accordance with FCS 3.1 standards and can be analyzed using third-party software. Click the down arrow on the Compensation button to select auto compensation options. - Page 376 Click Send to Instrument to send the calculated compensation values back to the local instrument. Everest software displays the contents on the Acquisition tab. On the Acquisition toolbar, click View Compensation Matris. The compensation matrix displays the calculated compensation values. 374 | ZE5 Cell Analyzer and Everest Software...
-
Page 377: Resuming Acquisition
Resuming Acquisition Resuming Acquisition After applying compensation, acquire sample again. In the Instrument Control panel, ensure that Acquisition Mode is active. In the plate map, click the sample position from which acquisition should resume. Click Play to start acquiring data from the fully stained sample. To ensure that the gate is applied to all of the plots, click the filter tool in each plot and select R1. -
Page 378: Analyzing Or Exporting Final Data
Select an export option and click Export. Note: Everest Software exports one FCS file per acquired control or sample. For more information about exporting data files, see Exporting FCS and RLST Data Files on page 288. 376 | ZE5 Cell Analyzer and Everest Software... - Page 379 Analyzing or Exporting Final Data In the Browse For Folder dialog box that appears, accept the default Export folder or navigate to another location and click OK. Close the export dialog box when the export is complete. User Guide | 377...
- Page 380 Appendix B Example 9-Color Immunophenotyping Experiment 378 | ZE5 Cell Analyzer and Everest Software...
-
Page 381: Appendix C Optional External Di Water And Waste Ports
Optional External DI Water and Waste Ports Ports for connecting the ZE5™ Cell Analyzer to house DI water and house waste are located on the instrument back panel. Contact Bio-Rad Technical Support if you plan to use either of these ports. - Page 382 Appendix C Optional External DI Water and Waste Ports Caution: Only Bio-Rad Service personnel are permitted to install and connect the External Deionized Water Supply kit. The water supply must be of a pressure between 10 and 20 psi, filtered by a 1 μm or better filter, and be of pure deionized water with at least 10 megaohm-cm resistivity.
-
Page 383: Connecting External Waste
Specifying External Port Use After the instrument has been connected to an external DI water or waste line, a Bio-Rad service engineer must configure your system to use the external port. User Guide | 381... - Page 384 Appendix C Optional External DI Water and Waste Ports 382 | ZE5 Cell Analyzer and Everest Software...
- Page 385 Appendix D ZE5 Cell Analyzer Specifications The specifications for the ZE5™ Cell Analyzer are shown in Table Table 44. ZE5 Cell Analyzer specifications Category Description Specification System Fluorescence sensitivity <100 MESF (molecules of equivalent soluble fluorochrome) for FITC, PE, APC Scatter sensitivity <0.5 µm FSC resolution with standard FSC...
-
Page 386: Appendix D Ze5 Cell Analyzer Specifications
Onboard sheath additive concentrate and cleaner Optional kit for connecting to house DI water and waste (field upgrade) Sample flow rates 0.1–3.5 µl/sec (6–210 µl/min) (standard mode) 0.5–2.5 µl/sec (30–150 µl/min) (high-throughput mode) 384 | ZE5 Cell Analyzer and Everest Software... - Page 387 Table 44. ZE5 Cell Analyzer specifications, continued Category Description Specification Software/computer Workstation Operating system: Windows 10 Pro system CPU: Intel Core i7-6700 Quad Core 3.4 GHz RAM: 8 GB DDR4 2133 MHz Storage: 1 TB 7200 RPM hard drive Networking: Dual gigabit network interface card, 802.11ac...
- Page 388 EN 50581:2012 Laser IEC 60825-1:2014, EN 60825-1:2014 Class 1 laser product per IEC 60825-1 and CDRH requirements and regulations Safety IEC 61010-1:2010, EN61010-1:2010 IEC 61010-2-081:2015, EN61010-2-081:2015 UL/CSA 61010-1:2012 For research use only 386 | ZE5 Cell Analyzer and Everest Software...
-
Page 389: Appendix E Ordering Information
Appendix E Ordering Information Ordering information for the ZE5™ Cell Analyzer, accessories, and replacement parts is shown in Table Table 45. Ordering information Catalog # Description Instrumentation 17002031 ZE5 Cell Analyzer, 5 laser 27 color (355/405/488/561/640) 17002032 ZE5 Cell Analyzer, 4 laser 24 color (405/488/561/640) - Page 390 Appendix E Ordering Information Catalog # Description 12004404 ZE5 Additive Bottle with Tubing, white cap, 450 ml 12004444 ZE5 Cleaner/Additive Bottle, 450 ml 12005002 Bi-level Tube Lifter for 40 x 5 ml tube rack 12005163 Replacement Filter, single bandpass 525/35, position A4 GF00175 Neutral Density Filter, 2.0, 11 mm square 400–650 nm...
- Page 391 Appendix F References The following references and resources are useful for learning more about flow cytometry and its applications. Shapiro HM (2003). Practical Flow Cytometry: Fourth Edition (Hoboken: John Wiley & Sons). Cytometry: Part A; Journal of the International Society for the Advancement of Cytometry. Wiley. http://onlinelibrary.wiley.com/journal/10.1002/%28ISSN%291552-4930 Purdue University Cytometry Laboratories: cytometry and confocal microscopy education and research material, cytometry email archive, and links to cytometry web sites and suppliers...
-
Page 392: Appendix F References
Appendix F References 390 | ZE5 Cell Analyzer and Everest Software... -
Page 393: Glossary
— debris, cell clumps, and other material also contribute to the event rate as they pass through the laser. Another name for a run list. experiment ZE5-EYE on page 394. User Guide | 391... - Page 394 In the ZE5™ Cell Analyzer, the sample is injected into the middle of the sheath fluid flow at the base of the cuvette just before the interrogation point. The two fluids form a two-layer stable flow, centering the sample in the middle of the sheath (carrier) fluid without mixing of the fluids.
- Page 395 A carrier fluid used to hydrodynamically focus the sample stream for proper interrogation by the laser beam(s). For the ZE5 Cell Analyzer, this is typically DI water containing a sheath additive, but a saline solution can also be used.
- Page 396 Glossary ZE5-EYE A ZE5 hardware feature that verifies the configuration of the optical filter setup by using multiple LEDs to pulse ten different wavelengths of light into the optical filters that lead to the detector banks. 394 | ZE5 Cell Analyzer and Everest Software...
- Page 398 Life Science Web site bio-rad.com USA 1 800 424 6723 Australia 61 2 9914 2800 Austria 43 01 877 89019 Belgium 32 03 710 53 00 Brazil 55 11 3065 7550 Canada 1 905 364 3435 China 86 21 6169 8500 Czech Republic 36 01 459 6192 Denmark 45 04 452 10 00...
Need help?
Do you have a question about the ZE5 and is the answer not in the manual?
Questions and answers