
Related Manuals for Thermo Scientific NanoDrop One


Summary of Contents for Thermo Scientific NanoDrop One
- Page 1 NanoDrop Micro-UV/Vis Spectrophotometer NanoDrop One User Guide 269-309102 NanoDrop One UG Revision B July 2020...
- Page 2 © 2020 Thermo Fisher Scientific Inc. All rights reserved. Wi-Fi is either a trademark or a registered trademark of Wi-Fi Alliance in the United States and/or other countries. Bluetooth is either a trademark or a registered trademark of Bluetooth Special Interest Group. Windows is either a trademark or a registered trademark of Microsoft Corporation in the United States and/or other countries.
-
Page 3: Table Of Contents
Settings for Nucleic Acid Measurements ..... .30 Calculations for Nucleic Acid Measurements ....30 Thermo Scientific NanoDrop One User Guide... - Page 4 Protein BCA Reported Results ......103 Settings for Protein BCA Measurements .....106 NanoDrop One User Guide Thermo Scientific...
- Page 5 Chapter 9 Learning Center ........183 Micro-Volume Sampling—How it Works ..... . .184 Thermo Scientific NanoDrop One User Guide...
- Page 6 Basic Instrument Operations ....... .209 NanoDrop One Home Screen ......209 NanoDrop One Measurement Screens .
- Page 7 Hazardous Materials ........276 Thermo Scientific NanoDrop One User Guide...
- Page 8 Contents viii NanoDrop One User Guide Thermo Scientific...
-
Page 9: Chapter 1 About The Spectrophotometer
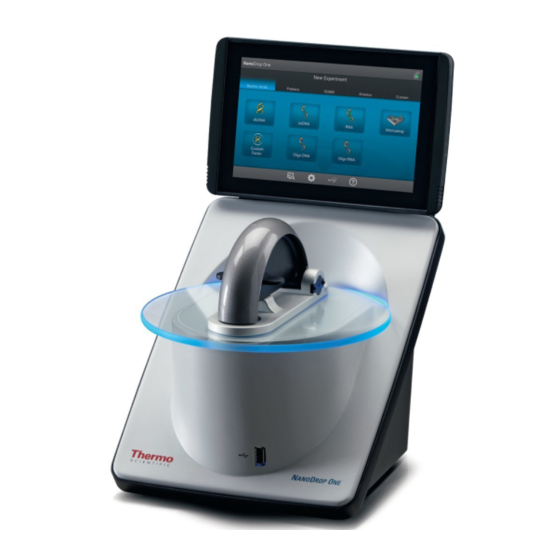
The NanoDrop One system comes with preloaded software and a touchscreen display. NanoDrop One PC Control software can be installed on a local PC and used to control the instrument and view data. The instrument can be connected to an optional printer with a USB cable or to a remote printer through an Ethernet connection or wireless network. -
Page 10: Features
Features Features TheNanoDrop One spectrophotometer features the patented micro-volume sample retention system. The NanoDrop One also features a cuvette holder for analyzing dilute samples using standard UV-Visible cuvettes. Touchscreen TheNanoDrop One comes with a built-in, 7-inch high-resolution touchscreen preloaded with easy-to-use instrument control software. The touchscreen can slide... -
Page 11: Cuvette Holder
• micro-stirring option to ensure sample homogeneity and support kinetic studies For details, see Measure a Sample using a Cuvette. USB-A port One USB-A port is located on the front of the instrument and two more USB-A ports are located on instrument back panel. Thermo Scientific NanoDrop One User Guide... -
Page 12: Accessories
About the Spectrophotometer Accessories Accessories This section lists the accessories included for use with the NanoDrop One DYMO™ LabelWriter™ 450 USB Label Printer Prints two 5/16-in x 4-in self-adhesive labels for transferring sample data directly into laboratory notebooks or posting on bulletin boards. The software allows... -
Page 13: Instrument Detection Limits
About the Spectrophotometer Instrument Detection Limits Instrument Detection Limits Measurement Upper Detection Limit Location Pathlength (mm) (10 mm Equivalent Absorbance) Pedestal 12.5 62.5 0.05 0.03 Cuvette Thermo Scientific NanoDrop One User Guide... - Page 14 About the Spectrophotometer This page is intentionally blank. NanoDrop One User Guide Thermo Scientific...
-
Page 15: Chapter 2 Instrument Set Up
Quickly and easily download and install the latest NanoDrop One software and release notes from our website. Follow the steps to update or upgrade the software on your local instrument and/or install or update the NanoDrop One software on a personal computer (PC). An Internet connection is required to download software. -
Page 16: Setting Up User Account Control (Optional)
Security Administration, you will need to enter your Windows log-in information. User Account Control Launch the Security Administration application and select NanoDrop One from the directory on the left to reveal Access Control and System Policies. Access control Access control is used to grant or deny individual users or groups access to protected features in the instrument application. -
Page 17: Security Administration Policies
“Security Administration Policies.” Security Administration Policies System policies allow you to assign data and method creation and deletion and editing privileges for users and groups. Launch the Security Administration application and select NanoDrop One-> System Policies Thermo Scientific NanoDrop One User Guide... - Page 18 Setting Up User Account Control (Optional) You can add, delete, or edit policy groups and enable or disable the group’s users permission to delete data. Select NanoDrop One-> Access Control. When you are finished, select Save. Changes will take effect the next time NanoDrop One is launched.
-
Page 19: Technical Support
If you are experiencing an issue with your system, refer to the troubleshooting information. If the issue persists, contact us. If you are outside the U.S.A. and Canada, please contact your local distributor. If your instrument requires maintenance or repair, contact us or your local distributor. Thermo Scientific NanoDrop One User Guide... - Page 20 Instrument Set up Technical Support NanoDrop One User Guide Thermo Scientific...
-
Page 21: Chapter 3 Application Measurement Ranges
±2% for samples >100 ng/µL ssDNA 1.3 ng/µL (pedestal) 18,150 ng/µL ±2.0 ng/µL for sample (pedestal) concentrations between 2.0 and 0.13 ng/µL (cuvette) 100 ng/µL samples; 49.5 ng/µL (cuvette) ±2% for samples >100 ng/µL Thermo Scientific NanoDrop One User Guide... - Page 22 ±3 µg/mL for 50–125 µg/mL samples reagent/sample ±2% for samples > 125 µg/mL volume) ±3 µg/mL for 25–125 µg/mL samples 1000 µg/mL 25 µg/mL (7.5:1 ±2% for samples >125 µg/mL reagent/sample volume) Based on five replicates (SD=ng/µL; CV=%) NanoDrop One User Guide Thermo Scientific...
-
Page 23: Detection Limits For Pre-Defined Dyes
±2% for samples >8.0 pmol/µL Alexa Fluor 546 0.3 pmol/µL 145 pmol/µL ±0.30 pmol/µL for sample (pedestal) (pedestal) concentrations between 0.30 and 6.0 pmol/µL; ±2% for samples >6.0 pmol/µL Values are approximate Based on five replicates (SD=ng/µL; CV=%) Thermo Scientific NanoDrop One User Guide... - Page 24 Application Measurement Ranges Detection Limits for All Applications NanoDrop One User Guide Thermo Scientific...
-
Page 25: Chapter 4 Nucleic Acid Applications
• Do not use a squirt or spray bottle on or near the instrument as liquids will flow into the instrument and may cause permanent damage. • Do not use hydrofluoric acid (HF) on the pedestals. Fluoride ions will permanently damage the quartz fiber optic cables. Thermo Scientific NanoDrop One User Guide... - Page 26 Measure dsDNA, ssDNA or RNA Before you begin... Before taking pedestal measurements with the NanoDrop One instrument, lift the instrument arm and clean the upper and lower pedestals. At a minimum, wipe the pedestals with a new laboratory wipe. For more information, see Cleaning the Pedestals.
-
Page 27: Best Practices For Nucleic Acid Measurements
Preparing Samples for more information. Note Extraction reagents such as guanidine, phenol, and EDTA contribute absorbance between 230 nm and 280 nm and will affect measurement results if present in samples (even residual amounts). Thermo Scientific NanoDrop One User Guide... - Page 28 – Use a 1-2 µL sample volume. See Recommended Sample Volumes for more information. • For cuvette measurements (NanoDrop One instruments only), use compatible cuvettes and follow best practices for cuvette measurements. Related Topics • Measure a Micro-Volume Sample •...
-
Page 29: Nucleic Acid Reported Results
Sample name; Nucleic acid Purity ratios select to edit concentration Measurement screen of PC Control software Note Micro-volume absorbance measurements and measurements taken with nonstandard cuvettes are normalized to a 10.0 mm pathlength equivalent. Thermo Scientific NanoDrop One User Guide... - Page 30 Pinch and zoom to Swipe screen left to view Tap to end adjust axes; double-tap table with more experiment and to reset measurement results export data Measurement screen of NanoDrop One local control software NanoDrop One User Guide Thermo Scientific...
- Page 31 • sample details (application and sampling method used, that is, pedestal or cuvette) • sample name • created on (date sample measurement was taken) • nucleic acid concentration • A260/A280 • A260/A230 • A260 • A280 • factor • baseline correction Thermo Scientific NanoDrop One User Guide...
-
Page 32: Settings For Nucleic Acid Measurements
c = A * [1/( * b)] c = A * f where: c = analyte concentration in ng/µL A = absorbance in absorbance units (A) f = factor in ng-cm/µL (see below) NanoDrop One User Guide Thermo Scientific... - Page 33 • For cuvette measurements, pathlength is determined by the cuvette Pathlength setting in the software (see General Settings). • Displayed spectra and absorbance values are normalized to a 10 mm pathlength equivalent. Thermo Scientific NanoDrop One User Guide...
- Page 34 Reported Values • Nucleic acid concentration. Reported in selected unit (i.e., ng/µL, µg/uL or µg/mL). Calculations are based on modified Beer’s Law equation using corrected nucleic acid absorbance value. • A260/A280 purity ratio. Ratio of corrected absorbance at 260 nm to corrected absorbance at 280 nm.
-
Page 35: Measure Microarray
Before you begin... Before taking pedestal measurements with the NanoDrop One instrument, lift the instrument arm and clean the upper and lower pedestals. At a minimum, wipe the pedestals with a new laboratory wipe. For more information, see Cleaning the Pedestals. - Page 36 When the sample measurement is completed, the spectrum and reported values are displayed (see the next section). 8. When you are finished measuring samples, tap End Experiment. 9. Lift the arm and clean both pedestals with a new wipe, or remove the sample cuvette. NanoDrop One User Guide Thermo Scientific...
- Page 37 • Best Practices for Nucleic Acid Measurements • Measure a Micro-Volume Sample • Measure a Sample Using a Cuvette • Best Practices for Micro-Volume Measurements • Best Practices for Cuvette Measurements • Prepare Samples and Blanks • Basic Instrument Operations Thermo Scientific NanoDrop One User Guide...
-
Page 38: Microarray Reported Results
• A baseline correction is performed at 750 nm (absorbance value at 750 nm is subtracted from absorbance values at all wavelengths in sample spectrum). • Micro-volume absorbance measurements and measurements taken with nonstandard cuvettes are normalized to a 10.0 mm pathlength equivalent. NanoDrop One User Guide Thermo Scientific... -
Page 39: Settings For Microarray Measurements
When selected, available DNA base units (i.e., G, A, T, C) appear as keys. Define sequence by tapping appropriate keys. Factor is calculated automatically based on widely accepted value for each base unit. Thermo Scientific NanoDrop One User Guide... - Page 40 To access the Dye/Chromophore Editor: • from the Home screen, tap > Dye Editor • from the Microarray or Proteins & Labels measurement screen, tap > Settings > Dye Editor NanoDrop One User Guide Thermo Scientific...
- Page 41 Setup: – select or deselect corresponding checkbox Add custom dye – to show New Dye box – enter unique Name for new dye (tap field to display keyboard, tap Done key to close keyboard) Thermo Scientific NanoDrop One User Guide...
- Page 42 Delete custom dye Tip Dyes pre-defined in the software cannot be deleted. – tap to select custom dye – NOTICE Deleting a custom dye permanently removes the dye and all associated information from the software. NanoDrop One User Guide Thermo Scientific...
-
Page 43: Calculations For Microarray Measurements
Note: See Sample Type for more information. Tip: Ideally, the factor or extinction coefficient should be determined empirically using a solution of the study nucleic acid at a known concentration using the same buffer. Thermo Scientific NanoDrop One User Guide... - Page 44 • The final corrected absorbance at 260 nm is reported and used to calculate sample concentration. A280 absorbance • 750-corrected and normalized absorbance value at 280 nm (minus the A280 dye correction) is used to calculate an A260/A280 ratio. NanoDrop One User Guide Thermo Scientific...
- Page 45 • For cuvette measurements, pathlength is determined by the cuvette Pathlength setting in the software (see General Settings). • Displayed spectra and absorbance values are normalized to a 10 mm pathlength equivalent. Thermo Scientific NanoDrop One User Guide...
- Page 46 Note: Although purity ratios are important indicators of sample quality, the best indicator of DNA or RNA quality is functionality in the downstream application of interest (e.g., microarray). Related Topics • Calculations for Nucleic Acid Measurements NanoDrop One User Guide Thermo Scientific...
-
Page 47: Measure Using A Custom Factor
Before you begin... Before taking pedestal measurements with the NanoDrop One instrument, lift the instrument arm and clean the upper and lower pedestals. At a minimum, wipe the pedestals with a new laboratory wipe. For more information, see Cleaning the Pedestals. - Page 48 (see the next section). 8. When you are finished measuring samples, tap End Experiment. 9. Lift the arm and clean both pedestals with a new wipe, or remove the sample cuvette. Typical nucleic acid spectrum NanoDrop One User Guide Thermo Scientific...
-
Page 49: Custom Factor Reported Results
Note The Custom Factor measurement screen is identical to the measurement screen for the other nucleic acid applications except the Custom Factor is reported in the lower left corner (see image below). factor Custom used to calculate nucleic acid concentration Thermo Scientific NanoDrop One User Guide... -
Page 50: Settings For Nucleic Acid Measurements Using A Custom Factor
= molar extinction coefficient at 260 nm in ng-cm/µL sample pathlength in cm (1 cm for nucleic acids measured with the NanoDrop One instruments) Baseline Correction On or off Optional user-defined baseline correction. Can be used to correct for any offset caused by light scattering... -
Page 51: Detection Limits For Nucleic Acid Measurements Using A Custom
(550 AU * 55 ng-cm/µL) = 30,250 ng/µL Note For measurements with 10 mm pathlength cuvettes, the upper absorbance limit is 1.5 AU, which is approximately 75 ng/µL for dsDNA. Related Topics • Detection Limits for All Applications Thermo Scientific NanoDrop One User Guide... - Page 52 This page is intentionally blank. NanoDrop One User Guide Thermo Scientific...
-
Page 53: Measure Oligo Dna Or Oligo Rna
Before you begin... Before taking pedestal measurements with the NanoDrop One instrument, lift the instrument arm and clean the upper and lower pedestals. At a minimum, wipe the pedestals with a new laboratory wipe. For more information, see Cleaning the Pedestals. - Page 54 When the sample measurement is completed, the spectrum and reported values are displayed (see the next section). 8. When you are finished measuring samples, tap End Experiment. 9. Lift the arm and clean both pedestals with a new wipe, or remove the sample cuvette. NanoDrop One User Guide Thermo Scientific...
- Page 55 • Best Practices for Nucleic Acid Measurements • Measure a Micro-Volume Sample • Measure a Sample Using a Cuvette • Best Practices for Micro-Volume Measurements • Best Practices for Cuvette Measurements • Prepare Samples and Blanks • Basic Instrument Operations Thermo Scientific NanoDrop One User Guide...
-
Page 56: Oligo Reported Results
Measured oligo: TTT TTT TTT TTT TTT TTT TTT TTT Note Micro-volume absorbance measurements and measurements taken with nonstandard cuvettes are normalized to a 10.0 mm pathlength equivalent. NanoDrop One User Guide Thermo Scientific... - Page 57 • baseline correction • stirrer status Note The five nucleotides that comprise DNA and RNA exhibit widely varying A260/A280 ratios. See Oligo Purity Ratios for more information. Related Topics • Basic Instrument Operations • Oligo Calculations Thermo Scientific NanoDrop One User Guide...
-
Page 58: Settings For Oligo Dna And Oligo Rna Measurements
f = 1/( * b) where: f= factor = molar extinction coefficient at 260 nm in ng-cm/µL sample pathlength in cm (0.1 cm for nucleic acids measured with the NanoDrop One instrument) NanoDrop One User Guide Thermo Scientific... -
Page 59: Detection Limits For Oligo Dna And Oligo Rna Measurements
To calculate upper detection limits in ng/µL, use the following equation: (upper absorbance limit * extinction coefficient instrumen sample For example, for a sample measurement using an extinction coefficient of 55, the equation looks like this: Thermo Scientific NanoDrop One User Guide... -
Page 60: Calculations For Oligo Dna And Oligo Rna Measurements
Tip: The extinction coefficient is wavelength specific for each oligonucleotide and can be affected by buffer type, ionic strength and pH. NanoDrop One User Guide Thermo Scientific... - Page 61 • For cuvette measurements, pathlength is determined by the cuvette Pathlength setting in the software (see General Settings). • Displayed spectra and absorbance values are normalized to a 10 mm pathlength equivalent. Thermo Scientific NanoDrop One User Guide...
- Page 62 See side bar for more information. Related Topics • Calculations for Nucleic Acid Measurements NanoDrop One User Guide Thermo Scientific...
-
Page 63: Chapter 5 Protein Applications
• Do not use a squirt or spray bottle on or near the instrument as liquids will flow into the instrument and may cause permanent damage. • Do not use hydrofluoric acid (HF) on the pedestals. Fluoride ions will permanently damage the quartz fiber optic cables. Thermo Scientific NanoDrop One User Guide... - Page 64 Measure Protein A280 Before you begin... Before taking pedestal measurements with the NanoDrop One instrument, lift the instrument arm and clean the upper and lower pedestals. At a minimum, wipe the pedestals with a new laboratory wipe. For more information, see Cleaning the Pedestals.
-
Page 65: Best Practices For Protein Measurements
Note Extraction reagents that contribute absorbance between 200 nm and 280 nm will affect measurement results if present in samples (even residual amounts). • Ensure the sample absorbance is within the instrument’s absorbance detection limits. Thermo Scientific NanoDrop One User Guide... - Page 66 – Use a 2 µL sample volume. See Recommended Sample Volumes for more information. • For cuvette measurements (NanoDrop One instruments only), use compatible cuvettes and follow best practices for cuvette measurements. Related Topics • Best practices for protein measurements •...
-
Page 67: Protein A280 Reported Results
Note Micro-volume absorbance measurements and measurements taken with nonstandard cuvettes are normalized to a 10.0 mm pathlength equivalent. Thermo Scientific NanoDrop One User Guide... -
Page 68: Settings For Protein A280 Measurements
To show the Protein A280 settings, in local instrument control, from the Protein A280 measurement screen, tap > Protein A280 Setup. From the PC control software, from the Protein A280 measurement screen, select the settings icon to view Protein A280 Setup. NanoDrop One User Guide Thermo Scientific... - Page 69 ( ) of 6.7 L/gm-cm at 280 nm for 1% (i.e., 10 mg/mL) BSA solution. Assuming MW is 66,400 daltons (Da), molar extinction coefficient at 280 nm for BSA is approximately 43,824 M Thermo Scientific NanoDrop One User Guide...
- Page 70 Assumes protein has known mass extinction extinction coefficient coefficient ( ). Enter mass extinction coefficient in L/gm-cm for 10 mg/mL ( protein solution. To add or edit a custom protein, use Protein Editor. NanoDrop One User Guide Thermo Scientific...
-
Page 71: Protein Editor
Click to add custom protein Click to edit selected custom protein Click to delete selected custom protein Custom proteins (will appear in Sample Type list in Protein A280 Setup and Proteins & Labels Setup) Thermo Scientific NanoDrop One User Guide... - Page 72 4. Specify whether to enter Molar Extinction coefficient or Mass Extinction coefficient for custom protein. – If Mass Extinction coefficient is selected, enter mass extinction coefficient in L/gm-cm for 10 mg/mL ( 1%) protein solution. NanoDrop One User Guide Thermo Scientific...
- Page 73 6. Enter your password to sign the changes if prompted. Enter your password to sign the changes The new custom protein appears in the Type list in Protein A280 Setup and Proteins & Labels Setup. Thermo Scientific NanoDrop One User Guide...
-
Page 74: Detection Limits For Protein A280 Measurements
For example, if the sample’s mass extinction coefficient at 280 nm is 6.7 for a 1% (10 mg/mL) solution, the equation looks like this: (550 / 6.7) * 10 = 824.6 (or ~825) NanoDrop One User Guide Thermo Scientific... -
Page 75: Calculations For Protein A280 Measurements
= (nW * 5500) + (nY * 1490) + (nC * 125) strength and pH. where: = molar extinction coefficient = number of each amino acid residue 5500, 1490 and 125 = amino acid molar absorptivities at 280 nm Thermo Scientific NanoDrop One User Guide... - Page 76 (i.e., 1% or 1 g/100 mL solution measured in a 1 cm cuvette) • protein absorbance values for 0.1% (i.e., 1 mg/mL) solutions Tip: Assess published values carefully to ensure unit of measure is applied correctly. NanoDrop One User Guide Thermo Scientific...
- Page 77 = (A / 1%) * 10 a conversion factor of 10. protein Tip: The NanoDrop One software includes Example: If measured absorbance for a protein sample at the conversion factor when reporting 280 nm relative to the reference is 5.8 A, protein protein concentrations.
- Page 78 • For cuvette measurements, pathlength is determined by the cuvette Pathlength setting in the software (see General Settings). • Displayed spectra and absorbance values are normalized to a 10 mm pathlength equivalent. NanoDrop One User Guide Thermo Scientific...
- Page 79 280 nm. An A260/A280 purity ratio of ~0.57 is generally accepted as “pure” for proteins. Note: Although purity ratios are important indicators of sample quality, the best indicator of protein quality is functionality in the downstream application of interest (e.g., real-time PCR). Thermo Scientific NanoDrop One User Guide...
-
Page 80: Measure Protein A205
Before you begin... Before taking pedestal measurements with the NanoDrop One instrument, lift the instrument arm and clean the upper and lower pedestals. At a minimum, wipe the pedestals with a new laboratory wipe. For more information, see Cleaning the Pedestals. - Page 81 (see the next section). 8. When you are finished measuring samples, tap End Experiment. 9. Lift the arm and clean both pedestals with a new wipe, or remove the sample cuvette. Thermo Scientific NanoDrop One User Guide...
-
Page 82: Protein A205 Reported Results
Note Micro-volume absorbance measurements and measurements taken with nonstandard cuvettes are normalized to a 10.0 mm pathlength equivalent. NanoDrop One User Guide Thermo Scientific... -
Page 83: Settings For Protein A205 Measurements
Related Topics • Basic Instrument Operations • Protein A205 Calculations Settings for Protein A205 Measurements To show the Protein A205 settings, from the Protein A205 measurement screen, tap > Protein A205 Setup. Thermo Scientific NanoDrop One User Guide... - Page 84 As a result, absorbance of sample spectrum is (340 nm) zero at specified baseline correction wavelength. Tip: If the sample has a modification that absorbs light at 340 nm, select a different correction wavelength or turn off Baseline Correction. NanoDrop One User Guide Thermo Scientific...
-
Page 85: Calculations For Protein A205 Measurements
205 nm is reported and used to calculate protein concentration. A280 absorbance • Normalized and baseline-corrected (if selected) absorbance value at 280 nm is also reported. Thermo Scientific NanoDrop One User Guide... - Page 86 • Displayed spectra and absorbance values are normalized to a 10 mm pathlength equivalent. Reported Values • Protein concentration. Reported in selected unit (mg/mL or µg/mL). Calculations are based on Beer-Lambert equation using corrected protein absorbance value. NanoDrop One User Guide Thermo Scientific...
-
Page 87: Measure Proteins And Labels
Before you begin... Before taking pedestal measurements with the NanoDrop One instrument, lift the instrument arm and clean the upper and lower pedestals. At a minimum, wipe the pedestals with a new laboratory wipe. For more information, see Cleaning the Pedestals. - Page 88 When the sample measurement is completed, the spectrum and reported values are displayed (see the next section). 8. When you are finished measuring samples, tap End Experiment. 9. Lift the arm and clean both pedestals with a new wipe, or remove the sample cuvette. NanoDrop One User Guide Thermo Scientific...
-
Page 89: Proteins & Labels Reported Results
• Basic Instrument Operations Proteins & Labels Reported Results Proteins & Labels measurement screen For each measured sample, this application shows the absorbance spectrum and a summary of the results. Here is an example: Thermo Scientific NanoDrop One User Guide... - Page 90 • A baseline correction is performed at 750 nm (absorbance value at 750 nm is subtracted from absorbance values at all wavelengths in sample spectrum). • Micro-volume absorbance measurements and measurements taken with nonstandard cuvettes are normalized to a 10.0 mm pathlength equivalent. NanoDrop One User Guide Thermo Scientific...
-
Page 91: Settings For Proteins And Labels Measurements
• Basic Instrument Operations • Proteins & Labels calculations Settings for Proteins and Labels Measurements To show the Proteins & Labels settings, from the Proteins & Labels measurement screen, tap > Proteins & Labels Setup. Thermo Scientific NanoDrop One User Guide... - Page 92 555, 594, 647, or 660 Editor for specific Dye/Chrom. Editor. values for each Dye 1/Dye 2 picomoles/microliter not applicable Select unit for reporting dye concentrations. Unit (pmol/uL), micromoles (uM), or millimoles (mM) NanoDrop One User Guide Thermo Scientific...
-
Page 93: Detection Limits For Proteins And Labels Measurements
For example, if the sample’s mass extinction coefficient at 280 nm is 6.7 for a 1% (10 mg/mL) solution, the equation looks like this: (550 / 6.7) * 10 = 824.6 (or ~825) Related Topics • Detection Limits for All Applications Thermo Scientific NanoDrop One User Guide... -
Page 94: Calculations For Proteins And Labels Measurements
Note: See Sample Type for details. Tip: Ideally, the extinction coefficient should be determined empirically using a solution of the study protein at a known concentration using the same buffer. NanoDrop One User Guide Thermo Scientific... - Page 95 Dye correction • Pre-defined dyes have known correction values for A260 and A280. See Dye/Chromophore Editor for correction values used. • A280 dye correction is subtracted from A280 absorbance value used to calculate protein concentration. Thermo Scientific NanoDrop One User Guide...
- Page 96 Beer-Lambert equation using corrected protein absorbance value. • Dye1/Dye2 concentration. Reported in pmol/µL. Calculations are based on Beer’s Law equation using (sloping) baseline-corrected dye absorbance value(s). Related Topics • Beer-Lambert Equation • Protein A280 Calculations NanoDrop One User Guide Thermo Scientific...
-
Page 97: Measure Protein Bca
Protein assay kits and protocols Please refer to the NanoDrop website for up-to-date kits and protocols for the NanoDrop One instruments. Follow the assay kit manufacturer’s recommendations for all standards and samples (unknowns). Ensure each is subjected to the same timing and temperature throughout the assay. - Page 98 Measure Protein BCA Protein standards for generating a standard curve may also be provided by the kit manufacturer. Since the NanoDrop One pedestals can measure higher protein concentrations than traditional cuvette-based spectrophotometers, you may need to supply your own protein standards at higher concentrations than provided by the manufacturer.
- Page 99 Menu; tap to Reference concentration and Standard concentrations and open absorbance values absorbance value Press and hold any row to view details Swipe left one screen to view standard curve Thermo Scientific NanoDrop One User Guide...
- Page 100 Swipe left one screen to view data points for standards table for standards The R value indicates how well the standard curve fits the standard data points (1.0 is a perfect fit; all points lie exactly on the curve). NanoDrop One User Guide Thermo Scientific...
- Page 101 Press and hold any row to view details Press and hold a row in any of the previous screens to view details about an individual standard. Here is an example: delete this Tap to measurement Thermo Scientific NanoDrop One User Guide...
- Page 102 The standard no longer appears in the table on the measurement screen and its concentration value no longer appears on the setup screen. Note You can use this method to delete the reference measurement; however, a new reference must be measured immediately afterwards. NanoDrop One User Guide Thermo Scientific...
- Page 103 Before you begin... Before taking pedestal measurements with the NanoDrop One instrument, lift the instrument arm and clean the upper and lower pedestals. At a minimum, wipe the pedestals with a new laboratory wipe. For more information, see Cleaning the Pedestals.
- Page 104 Replicates setting is greater than 1, repeat measurement 7. When you are finished measuring samples, tap End Experiment. 8. Lift the arm and clean both pedestals with a new wipe, or remove the sample cuvette. NanoDrop One User Guide Thermo Scientific...
-
Page 105: Protein Bca Reported Results
Press and hold sample row to view measurem ent details. Drag tab down/up to see more/less sample data Pinch and zoom to adjust axes; Swipe screen left to view double-tap to reset standard curve Thermo Scientific NanoDrop One User Guide... - Page 106 A horizontal line connects the sample absorbance value on the Y-axis to the standard curve. A vertical line connects that point to the sample concentration value on the X-axis. NanoDrop One User Guide Thermo Scientific...
- Page 107 Drag tab down/up data points standard data points to see more/less sample data Page control; swipe screen left or right to Pinch and zoom to adjust axes; view next or previous screen double-tap to reset Thermo Scientific NanoDrop One User Guide...
-
Page 108: Settings For Protein Bca Measurements
You can edit the concentration value for a standard from the application setup screen. After the first sample measurement, these settings cannot be changed. NanoDrop One User Guide Thermo Scientific... - Page 109 Standards Enter actual concentration value of each standard. Note: Concentration values can be entered in any order but the standards must be measured in the order they were entered. Related Topics • Instrument Settings Thermo Scientific NanoDrop One User Guide...
- Page 110 Protein Applications Measure Protein BCA NanoDrop One User Guide Thermo Scientific...
-
Page 111: Measure Protein Bradford
• Work quickly and do not allow prepared standards or samples to sit longer than necessary. Coomassie dye-dye and Coomassie dye-protein aggregates can form particulates with increasing development time, resulting in significant fluctuations in absorbance readings. Thermo Scientific NanoDrop One User Guide... - Page 112 Before you begin... Before taking pedestal measurements with the NanoDrop One instrument, lift the instrument arm and clean the upper and lower pedestals. At a minimum, wipe the pedestals with a new laboratory wipe. For more information, see Cleaning the Pedestals.
- Page 113 Replicates setting is greater than 1, repeat measurement 7. When you are finished measuring samples, tap End Experiment. 8. Lift the arm and clean both pedestals with a new wipe, or remove the sample cuvette. Thermo Scientific NanoDrop One User Guide...
- Page 114 Related Topics • Working with standard curves • Best practices for protein measurements • Measure a Micro-Volume Sample • Measure a Sample Using a Cuvette • Prepare Samples and Blanks • Basic Instrument Operations NanoDrop One User Guide Thermo Scientific...
-
Page 115: Protein Bradford Reported Results
Press and hold sample row to view measure ment details. Drag tab down/up to see more/less sample data Swipe screen left to view Pinch and zoom to adjust axes; standard curve double-tap to reset Thermo Scientific NanoDrop One User Guide... - Page 116 X-axis. The R value indicates how well the standard curve fits the standard data points (1.0 is a perfect fit; that is, all points lie exactly on the curve). NanoDrop One User Guide Thermo Scientific...
- Page 117 The initial screen that appears after each measurement and the standards screen (see previous image) show a summary of the reported values. To view all reported values, press and hold the sample row. Here is an example: Thermo Scientific NanoDrop One User Guide...
-
Page 118: Settings For Protein Bradford Measurements
You can edit the concentration value for a standard from the application setup screen. After the first sample measurement, these settings cannot be changed. NanoDrop One User Guide Thermo Scientific... - Page 119 Standards Enter actual concentration value of each standard. Note: Concentration values can be entered in any order but the standards must be measured in the order they were entered. Related Topics • Instrument Settings Thermo Scientific NanoDrop One User Guide...
- Page 120 Protein Applications Measure Protein Bradford NanoDrop One User Guide Thermo Scientific...
-
Page 121: Measure Protein Lowry
Protein assay kits and protocols Follow the assay kit manufacturer’s recommendations for all standards and samples (unknowns). Ensure each is subjected to the same timing and temperature throughout the assay. Thermo Scientific NanoDrop One User Guide... -
Page 122: To Measure Protein Lowry Standards And Samples
Before you begin... Before taking pedestal measurements with the NanoDrop One instrument, lift the instrument arm and clean the upper and lower pedestals. At a minimum, wipe the pedestals with a new laboratory wipe. For more information, see Cleaning the Pedestals. - Page 123 Related Topics • Working with standard curves • Best practices for protein measurements • Measure a Micro-Volume Sample • Measure a Sample Using a Cuvette • Prepare Samples and Blanks • Basic Instrument Operations Thermo Scientific NanoDrop One User Guide...
-
Page 124: Protein Lowry Reported Results
• A baseline correction is performed at 405 nm (absorbance value at 405 nm is subtracted from absorbance values at all wavelengths in sample spectrum). • Micro-volume absorbance measurements and measurements taken with nonstandard cuvettes are normalized to a 10.0 mm pathlength equivalent. NanoDrop One User Guide Thermo Scientific... - Page 125 Drag tab down/up to data points standard data points see more/less sample data Page control; swipe screen left Pinch and zoom to adjust axes; or right to view next or previous double-tap to reset screen Thermo Scientific NanoDrop One User Guide...
-
Page 126: Settings For Protein Lowry Measurements
You can edit the concentration value for a standard from the application setup screen. After the first sample measurement, these settings cannot be changed. NanoDrop One User Guide Thermo Scientific... - Page 127 Standards Enter actual concentration value of each standard. Note: Concentration values can be entered in any order but the standards must be measured in the order they were entered. Related Topics • Instrument Settings Thermo Scientific NanoDrop One User Guide...
- Page 128 Protein Applications Measure Protein Lowry NanoDrop One User Guide Thermo Scientific...
-
Page 129: Measure Protein Pierce 660
The IDCR dissolves completely by thorough mixing and has no effect on the assay. Pre-formulated kits of the protein binding material are available from us or a local distributor. For information about IDCR, refer to the kit manufacturer. Thermo Scientific NanoDrop One User Guide... -
Page 130: To Measure Protein Pierce 660 Standards And Samples
Before you begin... Before taking pedestal measurements with the NanoDrop One instrument, lift the instrument arm and clean the upper and lower pedestals. At a minimum, wipe the pedestals with a new laboratory wipe. For more information, see Cleaning the Pedestals. - Page 131 7. When you are finished measuring samples, tap End Experiment. 8. Lift the arm and clean both pedestals with a new wipe, or remove the sample cuvette. Related Topics • Working with standard curves • Best practices for protein measurements Thermo Scientific NanoDrop One User Guide...
-
Page 132: Protein Pierce 660 Reported Results
Press and hold sample row to view measurem details. Pinch and zoom to adjust axes; Swipe screen left to view Drag tab down/up to see double-tap to reset standard curve more/less sample data NanoDrop One User Guide Thermo Scientific... - Page 133 X-axis. The R value indicates how well the standard curve fits the standard data points (1.0 is a perfect fit; that is, all points lie exactly on the curve). Thermo Scientific NanoDrop One User Guide...
- Page 134 The initial screen that appears after each measurement and the standards screen (see previous image) show a summary of the reported values. To view all reported values, press and hold the sample row. Here is an example: NanoDrop One User Guide Thermo Scientific...
-
Page 135: Settings For Protein Pierce 660 Measurements
You can edit the concentration value for a standard from the application setup screen. After the first sample measurement, these settings cannot be changed. Thermo Scientific NanoDrop One User Guide... - Page 136 If you also want to enter previously measured absorbance values for the standards, select this check box: and then enter absorbance values for all the standards. Related Topics • Instrument Settings NanoDrop One User Guide Thermo Scientific...
-
Page 137: Chapter 6 Measure Od600
The OD600 application measures light transmission and uses that value to calculate absorbance. In spectroscopy, transmitted light is defined as any light that is not absorbed by, reflected from and scattered off a sample. Thermo Scientific NanoDrop One User Guide... - Page 138 Calculations for OD600 Measurements for details. • For cuvette reading with the NanoDrop One instrument, accurate absorbance readings are typically in the range between 0.04 A and 1.5 A. Serial dilutions of the sample are usually needed to bring the absorbance readings within this range.
-
Page 139: To Measure Od600 Samples
For dilute samples that exhibit low absorbance at 600 nm, use an alternative wavelength such as 400 nm to measure absorbance, or use cuvettes instead of micro-volume measurements. • For cuvette measurements (NanoDrop One instruments only): – Use clean plastic, glass or quartz cuvettes. - Page 140 Measure OD600 Before you begin... Before taking pedestal measurements with the NanoDrop One instrument, lift the instrument arm and clean the upper and lower pedestals. At a minimum, wipe the pedestals with a new laboratory wipe. For more information, see Cleaning the Pedestals.
-
Page 141: Od600 Reported Results
Swipe screen left to view table with Drag tab down/up double-tap to reset more measurement results to see more/less sample data Note Micro-volume absorbance measurements and measurements taken with nonstandard cuvettes are normalized to a 10.0 mm pathlength equivalent. Thermo Scientific NanoDrop One User Guide... -
Page 142: Settings For Od600 Measurements
Cell culture concentration (A600 Factor wavelength * Factor) Related Topics • Basic Instrument Operations • OD600 Calculations Settings for OD600 Measurements To show the OD600 settings, from the OD600 measurement screen, tap > OD600 Setup. NanoDrop One User Guide Thermo Scientific... - Page 143 Absorbance correction value is subtracted from absorbance values at all wavelengths in sample spectrum. (All displayed absorbance values are corrected values.) Thermo Scientific NanoDrop One User Guide...
- Page 144 ) * b) in mL/cell-cm where: ) = molar absorption coefficient (or extinction coefficient) at specified wavelength b = pathlength in cm (1.0 cm for the NanoDrop One instruments) Cell number Any number User-defined factor. Generally accepted factor for conversion factor...
-
Page 145: Calculations For Od600 Measurements
Settings). • Displayed spectra and absorbance values are normalized to a 10 mm pathlength equivalent. • Reported Values Cell concentration. Reported in cells/mL. Calculations are based on Beer-Lambert equation using corrected A600 absorbance value. Thermo Scientific NanoDrop One User Guide... -
Page 147: Chapter 7 Custom Applications
Custom Applications Use the NanoDrop One to perform UV-Vis or your own Custom measurements. The UV-Vis application can be set up directly from the touchscreen and allows the instrument to function as a conventional spectrophotometer. Up to 40 wavelengths from 190 nm to 850 nm can be monitored and reported. -
Page 148: Measure Uv-Vis
Before you begin... Before taking pedestal measurements with the NanoDrop One instrument, lift the instrument arm and clean the upper and lower pedestals. At a minimum, wipe the pedestals with a new laboratory wipe. For more information, see Cleaning the Pedestals. -
Page 149: Best Practices For Uv-Vis Measurements
• For micro-volume measurements: – Ensure pedestal surfaces are properly cleaned conditioned. – Ensure samples are homogeneous before taking a measurement. Avoid introducing bubbles when mixing and pipetting. – Follow best practices for micro-volume measurements. Thermo Scientific NanoDrop One User Guide... -
Page 150: Uv-Vis Reported Results
Measure UV-Vis – Use a 1-2 µL sample volume. See Recommended Sample Volumes for more information. • For cuvette measurements (NanoDrop One instruments only), use compatible cuvettes and follow best practices for cuvette measurements. UV-Vis Reported Results UV-Vis measurement screen For each measured sample, this application shows the absorbance spectrum and a summary of the results. - Page 151 Baseline correction absorbance Absorbance at 450 nm User-defined Baseline correction Absorbance at Absorbance at wavelength 635 nm wavelengths 623 nm Note Scroll up to display absorbance values for any additional user-defined wavelengths. Thermo Scientific NanoDrop One User Guide...
- Page 152 Right-click and select Autoscale to fit spectra to window Tips: Click sample row to select sample and update spectrum Shift-click multiple sample rows to overlay up to five spectra Click a sample and hover locations on spectra to view measurement values NanoDrop One User Guide Thermo Scientific...
-
Page 153: Settings For Uv-Vis Measurements
10 or higher. • When deselected, the pedestal pathlength is restricted to 10 mm across all wavelengths. Note: In either case, displayed absorbance values have been normalized to a 1 mm pathlength equivalent. Thermo Scientific NanoDrop One User Guide... - Page 154 (750 nm) values at all wavelengths in sample spectrum. As a result, absorbance of sample spectrum is zero at specified baseline correction wavelength. NanoDrop One User Guide Thermo Scientific...
-
Page 155: Measure Custom
To load a custom method Custom methods can only be created on a personal computer running the NanoDrop One software. If you want to run a custom method and store the measurement results on the instrument, the method must also reside on the instrument. - Page 156 Custom Applications Measure Custom 5. Select Load Method. A message box shows the NanoDrop One methods available on the selected USB device. 6. Select one or more method names in the Load Method box to select the methods to load.
- Page 157 5. Follow the on-screen instructions to measure a sample. To measure a sample using a custom method using the PC software 1. From the Home screen, from the Custom tab, select Custom Methods. Custom Custom Method Icon Thermo Scientific NanoDrop One User Guide...
-
Page 158: Delete Custom Method
4. Follow the on-screen instructions to measure a sample. Delete Custom Method – From Home screen, from the Custom tab, select Custom Methods. – In Select Method box, select a method to delete – Select NanoDrop One User Guide Thermo Scientific... -
Page 159: Custom Method Reported Results
Custom method reported values The initial screen that appears after each measurement (see previous image) shows a summary of the reported values. To view all reported values, press and hold the sample row. Here is an example: Thermo Scientific NanoDrop One User Guide... - Page 160 Custom Applications Measure Custom Method Sampling Sample name; name method tap to edit Date/time measured Analyte concentration Method details NanoDrop One User Guide Thermo Scientific...
-
Page 161: Manage Custom Methods
Measure Custom Manage Custom Methods The NanoDrop One PC Control software is your tool for creating and managing custom methods, which contain user-defined settings that can be used to acquire data with the instrument. Custom methods can be made with or without standards. - Page 162 Select Custom Method (existing methods are listed in Select Method box along with their type (formula or standards) and Description – From the Custom Method Management screen, select the method you would like to edit from the list of loaded methods. NanoDrop One User Guide Thermo Scientific...
- Page 163 • For micro-volume absorbance measurements and measurements taken with nonstandard (other than 10 mm) cuvettes, the spectra are normal- ized to a 10 mm pathlength equivalent. Thermo Scientific NanoDrop One User Guide...
- Page 164 A = absorbance in absorbance units (A) = wavelength-dependent molar absorptivity coefficient (or extinction coefficient) b = pathlength in cm (determined at measurement time, then normalized to 10 mm (1 cm) pathlength equivalent) NanoDrop One User Guide Thermo Scientific...
- Page 165 Concentration range of the standards must cover the dynamic range of the assay and the expected range of the unknown samples. Sample analyte concentrations are not extrapolated beyond the concentration of the highest standard. Thermo Scientific NanoDrop One User Guide...
- Page 166 Note: Software subtracts absorbance value at specified baseline correction wavelength from absorbance values at all wavelengths in sample spectrum. As a result, absorbance of sample spectrum is zero at specified baseline correction wavelength. NanoDrop One User Guide Thermo Scientific...
- Page 167 • When Automated Pathlength is deselected, the software uses a 1 mm pathlength regardless of the sample absorbance. This can cause detector saturation (resulting in jagged peaks) for highly absorbing samples (e.g., ~15 A at 10 mm pathlength equivalent). Thermo Scientific NanoDrop One User Guide...
- Page 168 • Use period “.” decimal separators for floating point and double-floating point numbers. • Use comma “,” list separators (for example, “POW(2,8)”). • Do not use comma “,” group separators for large numbers (for example, enter 1000 rather than 1,000). NanoDrop One User Guide Thermo Scientific...
- Page 169 USB memory device and then load the method (see Load a Custom Method for details) Import custom method Import a custom method back to a computer running the NanoDrop One software in order to edit the method settings. – From the Custom Methods screen, choose Import –...
- Page 170 Choose Save Delete custom method – From Custom Methods screen, select a custom method from the list of available methods – From the drop-down menu , choose Delete – After the confirmation message, choose Yes NanoDrop One User Guide Thermo Scientific...
-
Page 171: Chapter 8 Measure Kinetics
• To prevent damage from spills, keep containers of liquids away from the instrument. • Do not use a squirt or spray bottle on or near the instrument as liquids will flow into the instrument and may cause permanent damage. Thermo Scientific NanoDrop One User Guide... - Page 172 The Kinetics Setup screen is displayed. If one or more kinetic methods exist in the currently selected Data Storage Location, they will be listed in the Select Method box. A description of the selected method appears in the Method Details box. NanoDrop One User Guide Thermo Scientific...
- Page 173 Fill clean, dry cuvette with enough blanking solution to cover instrument optical path – Lift instrument arm and insert blanking cuvette into cuvette holder, making sure to align light path of cuvette with light path of instrument – Tap Blank Thermo Scientific NanoDrop One User Guide...
- Page 174 7. When you are finished reviewing the data, tap End Experiment. Each saved experiment contains one complete set of kinetic measurements based on the selected method. NanoDrop One User Guide Thermo Scientific...
-
Page 175: Create Kinetics Method
– tap Create Method (the method settings are displayed with Name and Range tab selected) – enter Method Name and Description (if desired), select Measurement range and specify up to three Wavelengths to monitor Thermo Scientific NanoDrop One User Guide... -
Page 176: Edit Kinetics Method
Kinetics menu, tap Save Method – to run the method, tap Run Method Edit Kinetics Method Kinetics methods can be edited only on the NanoDrop One instrument. To edit an existing kinetics method: – from Home screen, tap Kinetics tab > Kinetics application –... -
Page 177: Kinetics Reported Results
Tap to end experiment data double-tap to reset measurement screen and export data Note For measurements taken with nonstandard (other than 10 mm) cuvettes, the spectra are normalized to a 10 mm pathlength equivalent. Thermo Scientific NanoDrop One User Guide... - Page 178 (see example below) Swipe screen left to view data table; swipe right to return Tap to end experiment and to absorbance measurement screen export data NanoDrop One User Guide Thermo Scientific...
- Page 179 Tap to update plot to show measured absorbance over time (see example above) Swipe screen left to view data table; swipe right to return Tap to end experiment and to absorbance measurement screen export data Thermo Scientific NanoDrop One User Guide...
- Page 180 Absorbance values for each Stage number (click to specify unit) user-defined wavelength Press and hold row to view measurement details Swipe screen right to return to Tap to end experiment and Rate measurement screen export data NanoDrop One User Guide Thermo Scientific...
- Page 181 260 nm Absorbance at 340 nm Absorbance at 660 nm Print this Return to previous screen screen Delete this measurement User-defined Method details (scroll up wavelengths to view more) Related Topics • Basic Instrument Operations Thermo Scientific NanoDrop One User Guide...
-
Page 182: Settings For Kinetic Measurements
Note: Many kinetic measurements include only one stage. Additional stages are necessary only when a variation in stage interval or duration is needed. Time Unit Select the unit for time-based measurements (seconds or minutes). NanoDrop One User Guide Thermo Scientific... - Page 183 If the unit is seconds in the example above, a total of 11 measurements are taken at the following times over a period of 32 seconds: Thermo Scientific NanoDrop One User Guide...
- Page 184 This means the total number of measurements from all intervals in all stages must be less than 1000. Consider available instrument or computer disc space for lengthy experiments. Related Topics • Instrument Settings NanoDrop One User Guide Thermo Scientific...
-
Page 185: Chapter 9 Learning Center
• Measure a Micro-Volume Sample 196 • Measure a Sample Using a Cuvette 201 • Prepare Samples and Blanks 204 • Basic Instrument Operations 209 • Instrument Settings 237 • PC Control Software 245 Thermo Scientific NanoDrop One User Guide... -
Page 186: Micro-Volume Sampling-How It Works
The example at the left shows a typical absorbance spectrum taken of a nucleic acid sample. The spectrum is measured from 190 nm to 850 nm. The displayed range may vary for each application. NanoDrop One User Guide Thermo Scientific... - Page 187 “anchoring” the spectrum to zero absorbance units at the reference wavelength. Thermo Scientific NanoDrop One User Guide...
-
Page 188: Set Up The Instrument
(front, back-left or back-right). See Accessories for information about accessories compatible with the NanoDrop One instruments. Set Up Bluetooth Connections Use Bluetooth™ to connect the instrument to one or more Bluetooth (wireless) input devices such as a Bluetooth keyboard, mouse or barcode scanner. - Page 189 Bluetooth device, follow manufacturer instructions to pair the device (for example, you may need to hold down a button) and tap Search For Devices on instrument) device name should appear in Available Devices list Thermo Scientific NanoDrop One User Guide...
- Page 190 – tap Back (Bluetooth status is displayed at right of Bluetooth button) – repeat steps above to add another Bluetooth device or tap Done to close Settings NanoDrop One User Guide Thermo Scientific...
- Page 191 • If no Bluetooth device is selected for input, the instrument relies on the integrated touchscreen keyboard for input. • To select the device again, follow the steps above and select the device’s Use for Input checkbox. Thermo Scientific NanoDrop One User Guide...
- Page 192 Bluetooth device, tap its Profiles button – tap Unpair device is no longer listed under “Paired Devices” but remains in Available Devices list – tap Back to return to System settings – tap Done to close Settings NanoDrop One User Guide Thermo Scientific...
-
Page 193: Set Up Ethernet Connection
Ethernet option and choose OK. • Direct connection to a PC. Select if you plan to connect an Ethernet cable between the NanoDrop One instrument and a personal computer. • Connection to a network jack. Select if you plan to connect an Ethernet cable between the NanoDrop One instrument and a network wall jack. -
Page 194: Set Up Wireless Connections
Networking tab – tap Wi-Fi (if Wi-Fi is disabled, button in upper right is set to “OFF” and no wireless networks are listed) – tap button to enable Wi-Fi and display available Wi-Fi networks NanoDrop One User Guide Thermo Scientific... - Page 195 (that is, you may have to search for them by name). For more information, see the system administrator at your work site. – tap Done to exit Settings Thermo Scientific NanoDrop One User Guide...
-
Page 196: Assess Instrument Connectivity
Tap to show connectivity status Show connectivity status – on instrument Home screen to open System Status box Location of database where instrument is currently storing data Wi-Fi status Bluetooth status – tap OK to exit System Status NanoDrop One User Guide Thermo Scientific... -
Page 197: Operating Specifications
Locate the instrument away from air vents and exhaust fans to minimize evaporation. Note If operating the instrument at the low end of the recommended humidity range, use adequate sample volume to avoid evaporation. After the instrument is installed, you can leave it turned on. Thermo Scientific NanoDrop One User Guide... -
Page 198: Measure A Micro-Volume Sample
Learning Center Measure a Micro-Volume Sample Measure a Micro-Volume Sample The NanoDrop One spectrophotometer uses surface tension to hold a small volume of sample between two pedestals. The patented sample retention system enables the measurement of highly concentrated samples without the need for dilutions. -
Page 199: Best Practices For Micro-Volume Measurements
• Use new tip for each blank and sample aliquot. • Use new aliquot of sample for each measurement. • If solvents are used, make sure they are compatible with the pedestals. (see “Compatible Solvents” in Hazardous Materials). Thermo Scientific NanoDrop One User Guide... -
Page 200: Recommended Sample Volumes
1. From the instrument Home screen, select an application from one of the application categories, such as UV-Vis, or Custom Methods. 2. Lift the instrument arm and clean the upper and lower pedestals with new laboratory wipe. NanoDrop One User Guide Thermo Scientific... - Page 201 The new spectrum replaces the previous one on the spectral display and the new reported values appear under the previous ones in the table. (Drag tab down to show both sets of data.) Tap to end experiment Thermo Scientific NanoDrop One User Guide...
- Page 202 Tap to end and save more samples experiment instrument according to acquisition date, experiment name, application used and any assigned labels (see Manage identifiers on the instrument). NanoDrop One User Guide Thermo Scientific...
-
Page 203: Measure A Sample Using A Cuvette
• sample material resuspended in appropriate buffer solution (see Preparing Samples) • pure buffer solution for blanking instrument (see Choosing and Measuring a Blank or watch multimedia training What is a blank?) Thermo Scientific NanoDrop One User Guide... -
Page 204: Best Practices For Cuvette Measurements
• To prevent damage from spills, keep containers of liquids away from the instrument. • Do not use a squirt or spray bottle on or near the instrument as liquids will flow into the instrument ans may cause permanent damage. NanoDrop One User Guide Thermo Scientific... - Page 205 Lift instrument arm and insert blanking cuvette into cuvette holder, making sure to align light path of cuvette with light path of instrument – Tap Blank and wait for the Instrument light path measurement to complete Thermo Scientific NanoDrop One User Guide...
-
Page 206: Prepare Samples And Blanks
Avoid introducing bubbles when mixing and pipetting. For more information, watch multimedia training Effects of Bubbles in Samples. Note Samples dissolved in extremely volatile solvent such as hexane may work best with cuvette sampling option (NanoDrop One instruments only). NanoDrop One User Guide Thermo Scientific... - Page 207 If the resulting spectrum is greater than 0.04 A around the analysis wavelength, that buffer solution may interfere with the sample analyses, especially for low concentration Good blanking buffer (measured abs < 0.04) samples. See below for details. Thermo Scientific NanoDrop One User Guide...
- Page 208 The blanking solution should be a similar pH and ionic strength as the analyte solution. For details, see “To measure samples” in the application used. NanoDrop One User Guide Thermo Scientific...
-
Page 209: Run A Blanking Cycle
• Do not use a squirt or spray bottle on or near the instrument as liquids will flow into the instrument and may cause permanent damage. • Do not use hydrofluoric acid (HF) on the pedestals. Fluoride ions will permanently damage the quartz fiber optic cables. Thermo Scientific NanoDrop One User Guide... - Page 210 If spectrum is still outside specifications, see Solutions for Blanking Problems. 5. When you are finished with the blanking cycle, tap End Experiment. 6. Lift the arm and clean both pedestals with a new wipe. NanoDrop One User Guide Thermo Scientific...
-
Page 211: Basic Instrument Operations
NanoDrop One Home Screen • NanoDrop One Measurement Screens • View History • NanoDrop One General Operations NanoDrop One Home Screen These operations are available from the NanoDrop One Home screen. Applications System Status History Instrument Instrument Settings Diagnostics Thermo Scientific... - Page 212 Learning Center Basic Instrument Operations Applications The NanoDrop One software offers several configurable applications, which gives users full control of the measurement. See“Custom Applications” page 145 detailed information about each available application. System Status on the instrument Home screen to open the system status box.
- Page 213 Home screen to verify instrument operation. Instrument diagnostics should be run periodically according to the recommended maintenance schedule. See “Instrument Diagnostics” page 260 for information about how to run the available instrument diagnostics. Thermo Scientific NanoDrop One User Guide...
-
Page 214: Nanodrop One Measurement Screens
View or change instrument settings Note: The Dye/Chrom. Editor and Protein Editor tabs appear in Settings only when the Settings tab is opened from the NanoDrop One Home screen or from applications compatible with that functionality. Print Print selected measurement results... - Page 215 Home screen, tap to open History – select experiment – swipe left to show data table – press and hold sample name to show Sample Details box – tap Sample Name field to display keyboard Thermo Scientific NanoDrop One User Guide...
- Page 216 For each measured sample, each application shows the UV or UV-Visible absorbance spectrum and a summary of the results. The vertical axis shows absorbance in absorbance units (A). The horizontal axis shows wavelength in nm. Here is an example for a UV-Vis method. NanoDrop One User Guide Thermo Scientific...
- Page 217 For more information, see Preparing Samples. and Measure a Micro-Volume Sample Measure a Cuvette Sample Absorbance Detection Limits. Note The Measure button is enabled after a valid blank measurement is completed. Thermo Scientific NanoDrop One User Guide...
- Page 218 Basic Instrument Operations Auto-Measure and Auto-Blank Options Speed up sample analysis with the NanoDrop One Auto-Measure and Auto-Blank features, which cause the instrument to start the measurement immediately after you lower the instrument arm. These options eliminate the need for repetitive Measure or Blank operations for large batches of samples.
- Page 219 Learning Center Basic Instrument Operations Note The End Experiment button is enabled after the first sample measurement is completed. After you tap End Experiment, the End Experiment box is displayed: Thermo Scientific NanoDrop One User Guide...
- Page 220 Print button Print measurement results for current experiment End Experiment button End the experiment and save the measurement results using the entered experiment name. The experiment is saved in the selected database location. NanoDrop One User Guide Thermo Scientific...
- Page 221 Information about the measured values displayed in Sample Details is provided in this Help system, under the application used to acquire the data. Note You can also edit the sample name from the Sample Details box. Thermo Scientific NanoDrop One User Guide...
- Page 222 Whether you collect one sample or many in a row, after you choose End Experiment, the acquired data are automatically saved in an experiment with an experiment name. In the default configuration, experiments are stored in the NanoDrop One database on the local instrument according to acquisition date, experiment name, application used and any assigned labels.
- Page 223 Learning Center Basic Instrument Operations Menu in History to see the available menu options. Home Return to NanoDrop One Home screen Settings View or change instrument settings Import Import data from a USB flash drive Disk Status View remaining space available for storing measurement...
- Page 224 Search feature to find experiment – tap to select one or more experiments to export (tap again to deselect an experiment; to select all experiments in database, select All) – tap Export NanoDrop One User Guide Thermo Scientific...
- Page 225 – tap Select – tap to select one or more experiments to delete (tap again to deselect an experiment) – tap Delete and OK Note Deleted data cannot be recovered. Thermo Scientific NanoDrop One User Guide...
- Page 226 Note The data shown are dependent upon the application used to measure the samples (nucleic acids in these examples). For more information, see the application details. NanoDrop One User Guide Thermo Scientific...
- Page 227 UV spectrum for selected sample Drag tab down/up to see more/less Page control; swipe screen left or right to view Selected Pinch and zoom to sample data next or previous screen adjust axes application Thermo Scientific NanoDrop One User Guide...
- Page 228 Menu from any Spectral Data or Data Table screen to see the available menu options. Home Return to NanoDrop One Home screen Manage Identifiers Add or delete labels for selected experiment to make it easier to find (see Manage identifiers on the...
-
Page 229: Nanodrop One General Operations
You can add one or more “identifiers” (i.e., labels or metadata tags) to an experiment to make the experiment easier to find. Labels can be added from the NanoDrop One software running on the instrument, or from the NanoDrop One control software... - Page 230 OK Edit Experiment Name You can edit the experiment name when you save the experiment or afterwards from the History. Edit experiment name at end of experiment – when finished measuring samples, tap NanoDrop One User Guide Thermo Scientific...
- Page 231 Home screen, tap to open History – tap row to list experiments acquired on that date, or use Search feature to find experiment – press and hold experiment name to open experiment details box Thermo Scientific NanoDrop One User Guide...
- Page 232 • as NanoDrop (.sql) files containing spectra and measurement results for each exported experiment Use any spreadsheet or word processing application to open a CSV or TSV file. Here is an example of several sample measurement results in CSV format: NanoDrop One User Guide Thermo Scientific...
- Page 233 (front, back-left or back-right USB port, or a network location) – – from Export box, select one or more formats to export to (see above for details) and tap Export – after “Export Success” message, tap OK – tap End Experiment Thermo Scientific NanoDrop One User Guide...
- Page 234 Search feature to find experiment – tap to select one or more experiments to export (tap again to deselect an experiment; to select all experiments in database, select All) – tap Export NanoDrop One User Guide Thermo Scientific...
- Page 235 Note Deleted data cannot be recovered. Delete data from any measurement screen – press and hold sample row to open Sample Details box – Delete data from History – from Home screen, tap to open History – tap Select Thermo Scientific NanoDrop One User Guide...
- Page 236 (“Auto” setting is recommended), margin and alignment to adjust the image in the preview window Note The software saves the print settings each time you print. – choose Print NanoDrop One User Guide Thermo Scientific...
- Page 237 If a label printer is connected to the instrument, the software prints one label for each selected measurement. If a full service printer is connected, the selected measurement screen is printed for each selected measurement. Thermo Scientific NanoDrop One User Guide...
- Page 238 Print If a label printer is connected to the instrument, the software prints a label for the selected measurement. If a full service printer is connected, the selected sample details screen is printed. NanoDrop One User Guide Thermo Scientific...
-
Page 239: Instrument Settings
Language Select language for displaying NanoDrop One software and for any connected input device such as a keyboard, mouse or barcode scanner Notice: Changing the language requires a software restart. - Page 240 Use 24-hour format: use 24-hour time format Choose date format: choose an available date format Update Software Update NanoDrop One software via USB device connected to instrument; if connected USB device contains multiple eligible update files, you can choose which files to update (see...
-
Page 241: Network Settings
These options are available: Wi-Fi Set up wireless local area network (WLAN) connection on the instrument Ethernet Set up Ethernet (wired) local area network (LAN) connection between the instrument and a personal computer or network wall jack. Thermo Scientific NanoDrop One User Guide... -
Page 242: Export Settings
(connection can be wired or wireless). Network paths defined here will appear in the Export Data list box when exporting data, from both the History and the End Experiment box after you complete a measurement. NanoDrop One User Guide Thermo Scientific... - Page 243 Network Locations list on the Export Settings tab. Edit Edit network path, path name or authentication setting for selected network location Delete Delete selected network location Test Test connection for selected network location Thermo Scientific NanoDrop One User Guide...
-
Page 244: General Settings
10 RPM to 850 RPM with controlled ramping from zero) Heat cuvette to 37 °C: Select this option if sample cuvettes require heating. Cuvette heater increases from room temperature to 37 °C at rate of 5 °C/minute. NanoDrop One User Guide Thermo Scientific... -
Page 245: Data Deletion Settings
You have the option to save a password reset key to a USB drive. Saving a password reset key to a USB drive allows you to reset the password in the event you do not remember or have access to your password. Thermo Scientific NanoDrop One User Guide... - Page 246 • If you do not have a password key, select No. Continue to step 4 4. With a USB drive inserted into the instrument, select Yes. NanoDrop One User Guide Thermo Scientific...
-
Page 247: Pc Control Software
PC Control Software Control your NanoDrop One from a PC through a direct Ethernet connection with the PC Control software. If your PC does not have an Ethernet port, you can use an Ethernet-to-USB adapter. You can store or view data acquired with a NanoDrop One instrument on the PC, as well as change instrument settings, and create or edit custom methods. -
Page 248: Control Options
Set security server location and path if desired. “User Account Control” page 14 Help: View help History option functions similarly to the instrument History. You can view all experiments performed from the local PC. NanoDrop One User Guide Thermo Scientific... - Page 249 If you make any changes to an experiment from History, you may be asked to sign for the changes upon exiting. – Enter your password to sign the changes if prompted. Enter your password to sign the changes Thermo Scientific NanoDrop One User Guide...
- Page 250 Learning Center PC Control Software Settings to modify security settings, view the selected database, select a file path for exporting data, and change the interface language. NanoDrop One User Guide Thermo Scientific...
-
Page 251: Instrument Status
Select the Instrument Status button to view the status and instrument configuration. If the Instrument status button is red , select the button and then click troubleshoot to learn more about the problem. Instrument status Thermo Scientific NanoDrop One User Guide... -
Page 252: Measurement Screen Display Options
Found peaks for the defined range are listed in the table below the spectrum. Wavelength start Wavelength end Absorbance minimum UV spectrum Peak 1 Table of calculated peaks for the specified range Maximum number of peaks NanoDrop One User Guide Thermo Scientific... -
Page 253: Chapter 10 Maintenance
Maintenance • Maintenance Schedule 252 • Cleaning the Touchscreen 253 • Maintaining the Pedestals 253 • Decontaminating the Instrument 258 • Maintaining the Cuvette Sampling System 260 • Instrument Diagnostics 260 Thermo Scientific NanoDrop One User Guide... -
Page 254: Maintenance Schedule
If the issue persists, contact us. If you are outside the U.S.A. and Canada, please contact your local distributor. If your instrument requires maintenance or repair, contact us or your local distributor. NanoDrop One User Guide Thermo Scientific... -
Page 255: Cleaning The Touchscreen
To avoid carryover and cross contamination, clean the pedestals before the first blank or sample measurement and at the end of each measurement. Additional cleaning (see below) or reconditioning may be required for periodic maintenance. Thermo Scientific NanoDrop One User Guide... - Page 256 If the diaphragm becomes loose, contact • Note Solutions containing detergent or isopropyl alcohol may uncondition the pedestals. If these are required for sample analyses, follow immediately with 3– 5 µL DI H NanoDrop One User Guide Thermo Scientific...
- Page 257 (for example, to remove dried sample left on the pedestals), substitute 0.5M HCl for the DI H2O in the procedure above and follow with 3-5 µL DI H2O. You can also recondition the pedestals using PR-1 compound. Thermo Scientific NanoDrop One User Guide...
-
Page 258: Reconditioning The Pedestals
Properly conditioned pedestal (droplet flattens out) (droplet beads up) Supplies needed • lint-free laboratory wipes • PR-1 pedestal reconditioning kit (available from us or a local distributor) • calibrated precision pipettor (0-2 µL) • canned air NanoDrop One User Guide Thermo Scientific... - Page 259 5. Use canned air to remove any paper residue from the pedestals. 6. Pipette 1 µL DI H O onto the lower pedestal. The DI H O should “bead up” or form a rounded droplet. Droplet “beads up” on properly conditioned Thermo Scientific NanoDrop One User Guide...
-
Page 260: Decontaminating The Instrument
• Do not allow HCl, alcohol, bleach, acetone or any other solvent to remain on the diaphragm for more than one minute or it may loosen the seals. If the diaphragm becomes loose, contact • NanoDrop One User Guide Thermo Scientific... - Page 261 (see Supplies needed) and use it to gently wipe the outside surfaces of the instrument. 2. Use a clean cloth or wipe dampened with DI H O to remove the bleach solution. Thermo Scientific NanoDrop One User Guide...
-
Page 262: Maintaining The Cuvette Sampling System
Maintenance Maintaining the Cuvette Sampling System Maintaining the Cuvette Sampling System The cuvette sampling system is included only with the NanoDrop One model instrument. For information about compatible cuvettes, see Measuring a Sample using a Cuvette. Note Clean and dry cuvettes after each measurement. Use cuvettes that are free of scratches and avoid fingerprints which may affect results. -
Page 263: Intensity Check
Maintenance Instrument Diagnostics Diagnostics can be performed using the NanoDrop One instrument or the PC Control software. Intensity Check, Performance Verification, and Pedestal Image Check are all accessible from the PC Control software Home screen: Figure 3. Control options History: View data stored locally. - Page 264 6. To rerun the intensity check, tap Measure. 7. When finished, tap End Experiment. After the test is completed, the results are available from the History (see example below). See Manage identifiers on the instrument for details. NanoDrop One User Guide Thermo Scientific...
-
Page 265: Performance Verification
After the ampoule is opened, its contents must be used within one hour. Pipette directly from the ampoule; do not transfer the solution. Thermo Scientific NanoDrop One User Guide... - Page 266 2. Enter each lot-specific target absorbance value from the label on the PV-1 ampoule in its associated entry box and then tap Done. 3. Lift the instrument arm and clean the upper and lower pedestal with a new laboratory wipe. NanoDrop One User Guide Thermo Scientific...
- Page 267 Swipe screen left to view detailed results 7. Repeat step 6 to measure the PV-1 solution nine more times using a new 1 µL aliquot for each measurement and cleaning both pedestals after each measurement. Thermo Scientific NanoDrop One User Guide...
- Page 268 After each measurement, a new sample result is added to the display. Swipe the screen left to see a summary of the 10 sample results. Swipe left again to see additional measurement details, along with the overall test result. Performance test result NanoDrop One User Guide Thermo Scientific...
- Page 269 After the test is completed, the results are available from the History (see example below). See Manage identifiers on the instrument for details. To interpret performance verification results If your instrument failed performance verification and you repeated ten measurements using 2 uL aliquots, contact Thermo Scientific NanoDrop One User Guide...
-
Page 270: Pedestal Image Check
If the Pedestal Image Check displays a yellow triangle instead of the green check mark, follow the on-screen instructions to fix any possible problems. Then rerun the Pedestal Image Check. If the instrument fails again, contact NanoDrop One User Guide Thermo Scientific... -
Page 271: Chapter 11 Safety And Operating Precautions
Safety and Operating Precautions Contents • Operating Precautions 270 • Safety Informationpage 271 Note Be sure that all persons operating this system read the safety manual first. Thermo Scientific NanoDrop One User Guide... -
Page 272: Operating Precautions
The instrument warranty is void if the cover has been removed. NanoDrop One spectrophotometers are designed to operate indoors in an environment that meets our specifications. For details, see the site preparation guide for your instrument. -
Page 273: Safety Information
Safety and Operating Precautions Safety Information Safety Information Before operating a NanoDrop One instrument, please read the safety information and follow its recommendations for the system. Safety and Special Notices In many cases, safety information is displayed on the instrument itself. The symbol indicates that there is additional safety information in the documentation and failure to heed the safety precautions could result in injury. - Page 274 Use approved containers and proper procedures to dispose of waste. Symbol Description Alternating current Earth terminal or ground Direct current Protective conductor terminal Frame or chassis terminal Fuse Power on Power off NanoDrop One User Guide Thermo Scientific...
-
Page 275: When The System Arrives
Utility installations must comply with all local building and safety codes. Lifting or Moving the Instrument To avoid risk of injury, use proper lifting techniques when lifting or moving the instrument or other system components. Thermo Scientific NanoDrop One User Guide... -
Page 276: Electrical Requirements And Safety
Be sure to use an appropriate grounded power cord for your electrical service. If the power cord received is not appropriate for the electrical system in your location, or if the power cord becomes damaged, contact us. Power Line Conditioning Accessories NanoDrop One User Guide Thermo Scientific... -
Page 277: Fire Safety And Burn Hazards
• Use caution when testing flammable or explosive samples (see the “Hazardous Materials” section) • Never block any of the vents on the instrument or its power supply • Only use exact replacement power supplies from us Thermo Scientific NanoDrop One User Guide... -
Page 278: Optical Safety
• carbon tetrachloride • DMSO • DMF • acetonitrile • THF • toluene • hexane • benzene • sodium hydroxide • sodium hypochlorite (bleach) • dilute HCl • dilute HNO • dilute acetic acid NanoDrop One User Guide Thermo Scientific... - Page 279 Individuals should be trained according to applicable regulatory and organization requirements before working with potentially infectious materials. Follow your organization’s Biosafety Program protocols for working with and/or handling potentially infectious materials. Thermo Scientific NanoDrop One User Guide...
- Page 280 Contact us if you have questions about decontamination requirements. NanoDrop One User Guide Thermo Scientific...
Need help?
Do you have a question about the NanoDrop One and is the answer not in the manual?
Questions and answers