Table of Contents
Advertisement
Advertisement
Table of Contents

Related Manuals for Thermo Scientific NanoDrop 1000 V3.7


Summary of Contents for Thermo Scientific NanoDrop 1000 V3.7
- Page 1 NanoDrop 1000 Spectrophotometer V3.7 User’s Manual...
- Page 2 The information in this publication is provided for reference only. All information contained in this publication is believed to be correct and complete. Thermo Fisher Scientific shall not be liable for errors contained herein nor for incidental or consequential damages in connection with the furnishing, performance or use of this material. All product specifications, as well as the information contained in this publication, are subject to change without notice.
-
Page 3: Table Of Contents
Table of Contents 1. Overview..................1-1 Instrument Description ..............1-1 Operation..................1-1 Applications ................... 1-1 Patents ..................1-2 2. Initial Set Up................. 2-1 Computer Requirements ............... 2-1 Software Installation ..............2-1 Software Upgrades................ 2-2 Registering Your Instrument............2-3 3. General Operation ............... 3-1 The Sample Retention System............ - Page 4 Spectrum Overlay Control ............. 8-4 9. Proteins & Labels ................ 9-1 Fluorescent Dye Selection ............9-1 Sample Volume Requirements............9-1 Pedestal Reconditioning..............9-2 Measurement Concentration Range ..........9-2 Unique Screen Features ............... 9-2 Baseline Type................9-4 10. Protein BCA ................10-1 Sample Volume Requirements............
- Page 5 Error USB2000 ................17-1 Connection Error ................. 17-2 Signal Error.................. 17-4 Saturated Detector ..............17-5 Liquid Column Breakage ............. 17-6 Other Software Error Messages..........17-8 Sample Accuracy and Reproducibility........17-10 260/280 Ratio ................17-11 Unusual Spectrum ..............17-13 Technical Support..............17-13 18.
-
Page 6: Overview
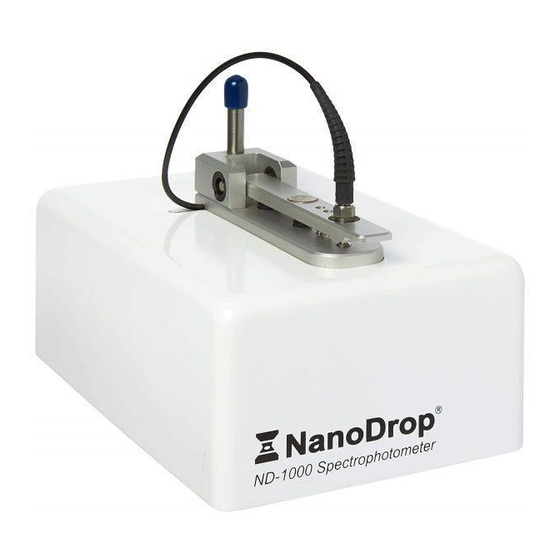
Section 1- Overview 1. Overview Instrument Description The Thermo Scientific NanoDrop™ 1000 Spectrophotometer measures 1 ul samples with high accuracy and reproducibility. The full spectrum (220nm-750nm) spectrophotometer utilizes a patented sample retention technology that employs surface tension alone to hold the sample in place. This eliminates the need for cumbersome cuvettes and other sample containment devices and allows for clean up in seconds. -
Page 7: Patents
Section 1- Overview • General UV-Vis spectrophotometry Patents The sample retention technology used in the NanoDrop 1000 Spectrophotometer is covered under US patents 6,628,382 and 6,809,826. Other patents are pending. -
Page 8: Initial Set Up
Section 2-Initial Set-up 2. Initial Set Up Computer Requirements The operating software will only run on an IBM compatible PC meeting the below criteria. No Mac versions of the software are currently available. • Microsoft Windows XP or 2000 operating system. Windows Vista has also been tested successfully with the software. -
Page 9: Software Upgrades
Section 2-Initial Set-up Intro Page: Windows XP- SP2 All Windows Operating Systems Your NanoDrop 1000 Spectrophotometer should now be ready for operation. If the software does not start properly, refer to the Troubleshooting Section for possible solutions. Configuring the System Font The software is designed to look best with the MS Sans Serif font, 8 point. -
Page 10: Registering Your Instrument
Section 2-Initial Set-up switch or give a visual indication of the operability of the 12V power supply. Registering Your Instrument Please register your product! We periodically update our software and add new features free of charge. We would like to keep our user list updated so that we may alert you to these updates and all information supplied is completely confidential. -
Page 11: General Operation
Section 3-General Operation 3. General Operation The Sample Retention System Basic Use The main steps for using the sample retention system are listed below: 1. With the sampling arm open, pipette the sample onto the lower measurement pedestal. 2. Close the sampling arm and initiate a spectral measurement using the operating software on the PC. -
Page 12: Cleaning The Sample Retention System
Section 3-General Operation 3. When the measurement is complete, open the sampling arm and wipe the sample from both the upper and lower pedestals using a soft laboratory wipe. Simple wiping prevents sample carryover in successive measurements for samples varying by more than 1000 fold in concentration. - Page 13 Section 3-General Operation “buff” the measurement pedestal surfaces by rubbing each measurement surface aggressively with a dry laboratory wipe 30-40 times. This will “re-condition” the surface allowing the liquid sample column to form. Alternatively, use the NanoDrop Pedestal Reconditioning Compound (PR-1) as a rapid means of reconditioning the pedestals when the surface properties have been compromised and liquid columns break during measurement.
-
Page 14: Software Architecture And Features
Section 3-General Operation spectrophotometry. Genomic DNA, lambda DNA and viscous solutions of highly concentrated nucleic acids are common examples known to the molecular biologist. Proteins are subject to denaturation, precipitation, and aggregation and therefore may require special handling to ensure sample homogeneity. Effect of Evaporation and Solvents Evaporation of the sample during the measurement cycle usually has just a minimal effect on absorbance readings and may result in a 1-... - Page 15 Section 3-General Operation Application Modules The operating software has been tailored to meet the life scientist’s needs. It includes the following application modules: • Nucleic Acid – concentration and purity of nucleic acid • MicroArray – dye incorporation concentration and purity of nucleic acid •...
-
Page 16: User Preferences
Section 3-General Operation • Protein BCA – protein concentration using the BCA assay • Protein Bradford – protein concentration using the Bradford assay • Protein Lowry – protein concentration using the Modified Lowry assay • Pierce 660 nm Protein Assay – protein concentration using the new 660 nm assay User Preferences Each user has the option to configure a number of settings in the... -
Page 17: Utilities And Diagnostics
Section 3-General Operation • UV/Vis The default settings for the two cursors used to monitor specific wavelengths are 300 nm for λ1 and 700 nm for λ2. The user may elect to have the HiAbs on (automatic utilization of the 0.2 mm path). -
Page 18: Account Management
Section 3-General Operation For more information on using this module, refer to both Section 15 (Calibration Check) and Section 16 (Troubleshooting) of this manual. Account Management The Account Management module provides options for directing where specific data files are archived by allowing users to segregate their data into personal folders. - Page 19 Section 3-General Operation for this account. All data generated will be automatically archived to the Default folder within the c:\Nanodrop Data folder. Note: For laboratories requiring that every user have a unique user-account, the administrator may disable the default user account. Account Log-in/Log-out and Time Out The user’s account will remain active until 1) a user logs out of his/her account by using the pull down menu to select either Default or...
-
Page 20: Dye/Chromophore Editor
Section 3-General Operation Passwords.log file This file contains the User ID & password for all accounts and is readable only by the software. It can be found in the c:\nanodrop data\log files folder. It is strongly recommended that the administrator make a copy of that file and store it in the same log files folder as above each time a new user account is added or a password is changed. - Page 21 Section 3-General Operation Note: If upgrading from a version prior to 3.3, zero values (0) for 260 nm % and 280 nm % correction factors will be entered for all user defined dyes. 3-11...
-
Page 22: Common Module Functions
Section 4-Common Module Functions 4. Common Module Functions Module Startup When the software starts, you should see this message: For best results, ensure measurement pedestal surfaces are clean, load a water sample onto the lower measurement pedestal and then click ‘OK’. The message “Initializing Spectrometer- please wait”... -
Page 23: Re-Blank (F2)
Section 4-Common Module Functions For the most consistent results, it is best to begin any measurement session with a blanking cycle. This will assure the user that the instrument is working properly and that the pedestal is clean. Follow the steps below to perform a blanking cycle: 1. -
Page 24: Print Screen (F4)
Section 4-Common Module Functions Print Screen (F4) The ‘Print Screen’ button will print a copy of the current operating screen to the default printer attached to the operating PC. Note: The system is configured to work with the Dymo Label Writer 400 printing on #30256 [2-5/16”... -
Page 25: Print Report (F5)
Section 4-Common Module Functions All data is stored in the archive file at C:\NanoDrop Data (and in a duplicate location if selected in User Preferences). Note: This feature can be set so that ‘Recording’ is the default mode. See User Preferences in Section 3 for more information. Print Report (F5) Selecting the ‘Print Report’... -
Page 26: Sample
Section 4-Common Module Functions the screen and should have a flashing text cursor when the instrument is waiting to make a new measurement. Sample # The ‘Sample #’ indicator is activated when a sample report is being recorded. It indicates the sample number of the last sample processed in the current report and increments with each successive measurement until the sample report is fully populated. -
Page 27: Nucleic Acids
Section 5- Nucleic Acids 5. Nucleic Acids Nucleic acid samples can be readily checked for concentration and quality using the NanoDrop 1000 Spectrophotometer. To measure nucleic acid samples select the ‘Nucleic Acid’ application module. Sample Volume Requirements Field experience has indicated that 1ul samples are sufficient to ensure accurate and reproducible results when measuring aqueous nucleic acid samples. - Page 28 Section 5- Nucleic Acids Sample Type: used to select the (color-keyed) type of nucleic acid being measured. The user can select ‘DNA-50’ for dsDNA, ‘RNA-40’ for RNA, ‘ssDNA-33’ for single-stranded DNA, or ‘Other’ for other nucleic acids. The default is DNA-50. If ‘Other’ is selected, the user can select an analysis constant between15-150.
-
Page 29: Spectrum Normalization
Section 5- Nucleic Acids appreciably lower in either case, it may indicate the presence of protein, phenol or other contaminants that absorb strongly at or near 280 nm. See “260/280 Ratio” in the Troubleshooting section for more details on factors that can affect this ratio. 260/230: ratio of sample absorbance at 260 and 230 nm. - Page 30 Section 5- Nucleic Acids The default option is set to clear the display for the next reading. The user may set the overlay control to clear after each sample plot, (default setting), after each new report, or accumulate plots until prompted to clear.
-
Page 31: Microarray
Section 6- MicroArray 6. MicroArray The capability to pre-select viable fluorescent-tagged hybridization probes for gene expression in micro arrays can eliminate potentially flawed samples and improve research effectiveness. The NanoDrop 1000 Spectrophotometer measures the absorbance of the fluorescent dye, allowing detection at dye concentrations as low as 0.2 picomole per microliter. -
Page 32: Measurement Concentration Range
Section 6- MicroArray nucleic acid samples containing incorporated fluorescent dyes. However, if you are unsure about the surface tension properties of your sample or your pipettor accuracy, a 1.5-2 ul sample is recommended to ensure that the liquid sample column is formed and the light path is completely covered by sample. - Page 33 Section 6- MicroArray Unique Screen Features Max Absorbance: used to rescale the upper limit of the vertical axis. Sample Type: used to select the (color-keyed) type of nucleic acid being measured. The user can select ‘DNA-50’ for dsDNA, ‘RNA-40’ for RNA, ssDNA-33’ for single-stranded DNA, or ‘Other’ for other nucleic acids.
- Page 34 Section 6- MicroArray normalized at 340 nm) and the nucleic acid analysis constant. See “Concentration Calculation (Beer’s Law)” in the appendix for more details on this calculation. 260/280: ratio of sample absorbance at 260 and 280 nm. The ratio of absorbance at 260 and 280 nm is used to assess the purity of DNA and RNA.
-
Page 35: Uv-Vis
Section 7- UV/Vis 7. UV-VIS The ‘UV/VIS Absorbance’ module allows the NanoDrop 1000 Spectrophotometer to function as a conventional spectrophotometer. Sample absorbance is displayed on the screen from 220 nm to 750 nm and cursors permit the measurement of individual peaks. Sample Volume Requirements Field experience has indicated that 1 ul samples are sufficient to ensure accurate and reproducible results when measuring most... - Page 36 Section 7- UV/Vis pathlength. The wavelengths can be set by dragging the cursor, using the up/down arrows or typing in the desired wavelength. Baseline: the absorbance of the user selectable-baseline (horizontal) cursor. The user may drag this cursor to a new vertical position to create a new baseline.
-
Page 37: Protein A280
Section 8- Protein A280 8. Protein A280 Proteins, unlike nucleic acids, can exhibit considerable diversity. The A280 method is applicable to purified proteins exhibiting absorbance at 280nm. It does not require generation of a standard curve and is ready for quantitation of protein samples at startup. This module displays the UV spectrum, measures the protein’s absorbance at 280 nm (A280) and calculates the concentration (mg/ml). -
Page 38: Unique Screen Features
Section 8- Protein A280 Approx. Typical Reproducibility Sample Detection Upper (minimum 5 replicates) Type Limit Limit (SD= mg/ml; CV= %) sample range 0.10-10 mg/ml: ± Purified 0.10 100 mg/ml 0.10 mg/ml mg/ml sample range >10mg/ml: ± 2% Unique Screen Features Sample Type: There are six sample types (options) available for purified protein analysis and concentration measurement. -
Page 39: Spectrum Normalization
Section 8- Protein A280 Lysozyme reference. Unknown (sample) protein concentrations are calculated using the mass extinction coefficient of 26.4 at 280 nm for a 1% (10 mg/ml) Lysozyme solution. User-entered values for molar extinction coefficient (M ) and molecular weight (MW) in kilo Daltons for their respective protein reference. -
Page 40: Spectrum Overlay Control
Section 8- Protein A280 Note: If the spectra baseline offset is significant, the calculated protein concentration may be higher than the true value. Some samples may exhibit a greater baseline offset than the example above. Spectrum Overlay Control The user can display more than one spectrum in the same display using this feature. - Page 41 Section 8- Protein A280 (default setting), after each new report, or accumulate plots until prompted to clear. The ‘Clear Now’ setting will clear all current and previous plots. When the overlay function is active, the software module will auto scale the y-axis based on the sample with the highest absorbance at 280nm.
-
Page 42: Proteins & Labels
Section 9- Proteins & Labels 9. Proteins & Labels This software module can be used to determine protein concentration (A280nm) as well as fluorescent dye concentration (protein array conjugates), or to measure the purity of metalloproteins (such as hemoglobin) using wavelength ratios. Fluorescent Dye Selection There are currently nine fluorescent dyes that are hard-coded for use with the Proteins and Labels module (see table below). -
Page 43: Pedestal Reconditioning
Section 9- Proteins & Labels the presence of surfactants or detergents in reagents, such as the Bradford reagent, can significantly alter surface tension. This occurrence can be overcome without affecting the sample’s absorbance by using a larger sample volume. A 2 ul sample size is recommended for protein measurements. - Page 44 Section 9- Proteins & Labels Max Absorbance: used to rescale the upper limit of the vertical axis. Sample Type: The same six sample types (options) listed under Protein A280 (Section 8) are available for purified Proteins & Labels analysis and concentration measurement. All of the options can be viewed by clicking the mouse while it is positioned within the sample type box.
-
Page 45: Baseline Type
Section 9- Proteins & Labels normalized at 340 nm). See the “Concentration Calculation (Beer’s Law)” Appendices for more details on this calculation. Baseline Type This application module has two user-selectable “Baseline Type” options. The default setting is set to normalize the display spectrum at 750nm. -
Page 46: Protein Bca
Section 10- Protein BCA 10. Protein BCA The BCA (Bicinchoninic Acid) Protein Assay is an alternative method for determining protein concentration. It is often used for more dilute protein solutions and/or in the presence of components that also have significant UV (280 nm) absorbance. Unlike the Protein A280 method, the BCA Assay requires a standard curve to be generated each time it is run, before unknown proteins can be measured. -
Page 47: Bca Kits, Protocols, And Sample Preparation
Section 10- Protein BCA Approx. Approx. Typical Reproducibility Assay Lower Upper (minimum 5 replicates) Type Limit Limit (SD= mg/ml; CV= %) ± 2% (over entire range) Regular BCA 0.2 mg/ml 8.0 mg/ml ± 0.01 mg/ml (over entire range) Mini BCA 0.01 mg/ml 0.20 mg/ml BCA Kits, Protocols, and Sample Preparation... -
Page 48: Making Bca Measurements
Section 10- Protein BCA samples refer to the dye reagent without any protein added (ie the “0” sample). Replicate #: counter for tracking replicate number during reference and standard measurement. Reset all Standards (F11): clears all replicates of all standards. Reset 1 Standard (F12): clears all replicates of the selected standard. - Page 49 Section 10- Protein BCA Step 1: Measure the ‘Reference’ (BCA reagent – a ‘zero’ Standard) Note: The software will guide the user with instructions in the large text box on the right side of the screen. Step 2: Measure Standards Up to 5 replicates of each of up to 7 standards can be...
-
Page 50: Standard Curve Features
Section 10- Protein BCA Step 3: Measure Samples Sample concentrations can be calculated by using linear interpolation (point-to-point) between the two standards flanking the unknown sample or by using polynomial fitting. [Note: In order to obtain a concentration value (mg/ml) the sample (unknown) must fall within the limits of the standard curve]. -
Page 51: Exiting The Bca Module
Section 10- Protein BCA Regular BCA Standard Curve: 0.2 – 8.0 mg/ml mini-BCA Standard Curve: 0.01 – 0.20 mg/ml Exiting the BCA Module It is recommended that you process all of the unknowns to be assayed before exiting the BCA software module 10-6... -
Page 52: Protein Lowry
Section 11-Protein Lowry 11. Protein Lowry The Modified Lowry Protein Assay is an alternative method for determining protein concentration based on the widely used and cited Lowry procedure for protein quantitation. Like the BCA and Bradford Assays, the Modified Lowry Assay requires standard curve generation each time it is run, before unknown proteins can be measured. -
Page 53: Modified Lowry Kits, Protocols, And Sample Preparation
Section 11-Protein Lowry Approx. Approx. Typical Reproducibility Assay Lower Upper (minimum 5 replicates) Type Limit Limit (CV= %) ± 2% (over entire range) Modified Lowry 0.2 mg/ml 4.0 mg/ml Modified Lowry Kits, Protocols, and Sample Preparation Commercial Modified Lowry Protein kit manufacturers typically outline procedures for their assays. -
Page 54: Making Lowry Measurements
Section 11-Protein Lowry Reset all Standards (F11): clears all replicates of all standards. Reset 1 Standard (F12): clears all replicates of the selected standard. Absorbance at 650 nm: the Cu-complex’s absorbance at 650 nm for the 1mm pathlength. Cursor λ and Absorbance: this feature allows the user to adjust the cursor wavelength and view the corresponding absorbance. - Page 55 Section 11-Protein Lowry Step 1: Measure the ‘Reference’ (Lowry reagent – a ‘zero’ Standard) Note: The software will guide the user with instructions in the large text box on the right side of the screen. Step 2: Measure Standards Up to 5 replicates of each of up to 7 standards can be measured.
-
Page 56: Standard Curve Features
Section 11-Protein Lowry Step 3: Measure Samples Sample concentrations can be calculated by using linear interpolation (point-to-point) between the two standards flanking the unknown sample or by using polynomial fitting. [Note: In order to obtain a concentration value (mg/ml) the sample (unknown) must fall within the limits of the standard curve]. -
Page 57: Exiting The Lowry Module
Section 11-Protein Lowry Modified Lowry Standard Curve: 0.2 – 4.0 mg/ml Exiting the Lowry Module It is recommended that you process all of the unknowns before exiting the Lowry software module. 11-6... -
Page 58: Protein Bradford
Section 12- Protein Bradford 12. Protein Bradford The Bradford Assay is a commonly used method for determining protein concentration. It is often used for more dilute protein solutions where lower detection sensitivity is needed and/or in the presence of components that also have significant UV (280 nm) absorbance. Like the BCA and Lowry methods, the Bradford assay requires a standard curve to be generated before unknown proteins can be measured. -
Page 59: Measurement Concentration Range
Section 12- Protein Bradford Measurement Concentration Range Unknown protein concentrations from ~100ug/ml up to several thousand micrograms/ml (ug/ml) can be determined on the NanoDrop 1000 Spectrophotometer using the regular Bradford assay. The best linearity is in the 100-1000 ug/ml range. A mini-Bradford assay covers the approximate range of 15-125 ug/ml. -
Page 60: Unique Screen Features
Section 12- Protein Bradford Protein standards (BSA) for generating a standard curve may also be provided by the manufacturer for the Bradford assay kit. Follow the manufacturer’s protocol for the assay including recommended incubation times and temperature. Additionally, use the respective standard (e.g. - Page 61 Section 12- Protein Bradford each assay. Additionally, a standard curve ‘set-up’ may be reloaded. This feature will recall the respective standard series used in a previously saved standard curve. Both single and multi-point standard curve generation is incorporated into the software. A standard curve can be developed using a reference (Modified Bradford reagent only –...
-
Page 62: Standard Curve Features
Section 12- Protein Bradford Step 2: Measure Standards Up to 5 replicates of each of up to 7 standards can be measured. The software will not allow measurement of samples until a minimum of 1 standard and references – or 2 standards –... -
Page 63: Delete Standard Points
Section 12- Protein Bradford standard curve concentration series using the ‘Load Standard Curve Set-up’. Delete Standard Points The Delete Point button allows the user to delete points by first selecting the data point to be deleted in the table and then choosing the ‘Delete Point’... -
Page 64: Exiting The Bradford Module
Section 12- Protein Bradford Exiting the Bradford Module It is recommended that you process all of the unknowns to be assayed before exiting the Bradford software module. 12-7... -
Page 65: Protein Pierce 660 Nm
Section 13- Protein Pierce 660 nm 13. Protein Pierce 660 nm The Thermo Scientific Pierce 660 nm Protein Assay reagent is a ready-to-use formulation that offers rapid, accurate and reproducible colorimetric detection of minute amounts of protein in solution. The reagent is ideal for measuring total protein concentration in samples containing both reducing agents and detergents. -
Page 66: Making Pierce 660 Nm Protein Measurements
Section 13- Protein Pierce 660 nm View Standard Curve (F8): selecting this button allows the user to view the standard curve at any time. Sample Type: choices are Reference, Standards 1-7, and Sample. The software will guide you to measure your reference, then at least one standard before allowing measurement of samples. - Page 67 Section 13- Protein Pierce 660 nm A blank must be measured before the standard curve may be generated. It is advisable to use use the dye reagent without any protein added as both the Blank and the “0” reference sample. Note- This is unlike the other colorimetric assays on the NanoDrop 1000 where it is recommended that water be used as the blank.
-
Page 68: Standard Curve Features
Section 13- Protein Pierce 660 nm Step 2: Measure Standards Up to 5 replicates of each of up to 7 standards can be measured. The software will not allow measurement of samples until a minimum of 1 standard and references – or 2 standards –... -
Page 69: Delete Standard Points
Section 13- Protein Pierce 660 nm Delete Standard Points The Delete Point button allows the user to delete points by first selecting the data point to be deleted in the table and then choosing the ‘Delete Point’ button. If erroneous or non-representative readings are encountered for a specific standard, all replicates of that standard are cleared by selecting ‘Delete 1 Standard’. -
Page 70: Cell Cultures
Section 14- Cell Cultures 14. Cell Cultures Using an absorbance spectrophotometer to monitor light scattered by non-absorbing suspended cells is common practice in life science laboratories. Such applications, more than any other, accentuate the differences amongst the optical systems of the numerous spectrophotometer designs. -
Page 71: Sample Size Requirements
Section 14- Cell Cultures λ and Abs: current value of the user-selectable wavelength cursor and corresponding absorbance. The wavelength can be set by dragging the cursor, using the up/down arrows or typing in the desired wavelength. Baseline: the absorbance of the user selectable-baseline (horizontal) cursor. - Page 72 Section 14- Cell Cultures Compatibility” appendix.) Note: Please do not use a squirt bottle to apply either a cleaning solution or water to the pedestal. 14-3...
-
Page 73: Archived Data And Data Viewer
Section 15- Archived Data and Data Viewer 15. Archived Data and Data Viewer Sample data from all application modules are automatically stored in archive files and can be opened by either the integrated Data Viewer software program or spreadsheet programs such as MS Excel. Archive File Creation Every time an application module is started, an application-specific archive file is created for the user that is logged in. -
Page 74: Data Storage Hierarchy
Section 15- Archived Data and Data Viewer Data Storage Hierarchy The hierarchy for archive files is as follows: C:\NanoDrop Data User name Application Module (BCA Protein, Lowry, Bradford, Cell Culture, MicroArray, Nucleic Acid, Protein A- 280, Proteins & Labels, UV-Vis or UV-Vis HiAbs) All archived data files are stored within an application module folder that is within the User folder as shown below: User-Defined Archive File Location... - Page 75 Section 15- Archived Data and Data Viewer to customize report structures, import stored data and re-plot data from previously generated data. Using the Data Viewer is the most expedient method to review data. This feature may be accessed during measurement sessions from the Show Report function found within each method module.
- Page 76 Section 15- Archived Data and Data Viewer Import To import samples for viewing, select Import Samples from the Data drop down of either the Plots or Report pages within the Data Viewer software. This will bring up a new window with an Import Folder box and a Directory Tree as shown in the following image: Import Features include: Import folder...
- Page 77 Section 15- Archived Data and Data Viewer Search Function allows the user to locate specific data by searching through sample ID names. Sample Information and Spectrum: Populated with the information associated with the most recently highlighted sample Import and Return: Uses selected sample data to populate Plots and Reports windows.
- Page 78 Section 15- Archived Data and Data Viewer Test Type: Auto fills in module name. Date: Auto fills in the date and time when a report is generated. Selected Plot: There are two methods of selecting or highlighting individual sample data. The user may simply move the cursor over the plot of interest and click or use the ‘Selected Plot’...
- Page 79 Section 15- Archived Data and Data Viewer Some key options useful for the Reports page are accessible through the Report tool bar drop down. Choosing the ‘Configure Report’ option brings up the following box: Selecting ‘OK’ will return the user to the reports page displaying only the columns of interest.
- Page 80 Section 15- Archived Data and Data Viewer Report Format’ to see the list of saved formats available for the specific method type. Load Report Format: Allows saved report formats to be loaded either before or after data is imported. Print report: Will print out only the Report page by default. Users may choose whether or not to print out the standards or plots pages by selecting these options under the Configuration drop down on the tool bar.
-
Page 81: Archive File Converter
Section 15- Archived Data and Data Viewer Report Full Mode: Drop down box defining options for managing reports. The four options include ‘Ignore’, ‘Save’, ‘Print’, ‘Save and Print’. The selected action will be executed when the report reaches the designated ‘Max Report Size’. Max Report Size: Default number is set at 200. -
Page 82: Opening Archived Data With Spreadsheet Programs
Section 15- Archived Data and Data Viewer Opening Archived Data with Spreadsheet Programs The archived files are in tab-delimited format and can be opened in Microsoft Excel or an equivalent spreadsheet program. When opening with Excel, be sure to save the file as a new name before making any changes to the data. -
Page 83: Calibration Check
Section 16- Calibration Check 16. Calibration Check The Calibration Check is found within the Utilities and Diagnostics module and is accessed through the Main Menu. It is used to confirm that both pathlengths are within calibration specifications. A vial of CF-1 is required to run the calibration check procedure. CF-1 is an aqueous potassium dichromate (K Cr O ) solution for use in confirming calibration of NanoDrop 1000 Spectrophotometers. - Page 84 Section 16- Calibration Check Add 1ul of deionized water and select “Blank”. Before opening the ampoule of CF-1 Calibration Fluid, shake vigorously to ensure solution is thoroughly mixed. Ensure all solution is collected in the bottom portion of the ampoule. Carefully break the neck of the ampoule to open the CF-1 Calibration Fluid.
- Page 85 Section 16- Calibration Check NOTE: The CF-1 Calibration Fluid is supplied in a single use vial. The CF-1 must be used within one hour of opening the vial. Exposure to the environment or transferring of the fluid to another container may cause a significant change in concentration. Procedure for Removal of Lint Build-up Under Solenoid occasion, bottom...
-
Page 86: Troubleshooting
Section 17- Troubleshooting 17. Troubleshooting Error USB2000 This error might appear upon software startup and usually indicates that the USB cable is not properly connected or the software is not loaded properly. To troubleshoot, do the following: 1. Confirm that the USB cable is connected to both the PC and the instrument. -
Page 87: Connection Error
Section 17- Troubleshooting lick on the ‘Device Connected’ as shown below. If more than one USB device is connected, view each of them. One of the connected devices should give an “idVendor’”and “idProduct” as 0x2457 and 0x1002 respectively as shown below. If these are present, the USB function of the instrument should be OK. - Page 88 Section 17- Troubleshooting Power management scheme on the PC: If your PC is automatically going into standby or hibernate mode, the USB communication will be lost whenever it occurs and ‘Retry’ will NOT reconnect the instrument. If this occurs, the USB cable will need to be disconnected/reconnected before selecting ‘Retry’.
-
Page 89: Signal Error
Section 17- Troubleshooting Signal Error This error occurs because no light or not enough light is reaching the detector. If the troubleshooting steps outlined in the message do not fix the problem, perform an Intensity Check: Open the Utilities and Diagnostics module from the main menu. With the sampling arm down, select OK to initialize the spectrometer and then select ‘Intensity Check’. -
Page 90: Saturated Detector
Section 17- Troubleshooting If none of the troubleshooting steps above solves the problem, contact your local distributor or Technical Support. UV Wavelength signal Intensity is low The above error message indicates that the detector signal in the UV region is low. The most likely explanation for the signal is that a sample with absorbance in the UV range (such as protein or nucleic acid) has dried down on the pedestal. -
Page 91: Liquid Column Breakage
Section 17- Troubleshooting This error message can occur when the software calculates too high integration times during initialization. This is most likely due to a dried sample left on the measurement surface after the last use of the instrument. Cleaning both the top and bottom pedestals with de- ionized water and exiting out of the software module to the main menu should alleviate the problem. - Page 92 Section 17- Troubleshooting Use the NanoDrop Pedestal Reconditioning Compound (PR-1) as a rapid means of reconditioning the pedestals when the surface properties have been compromised and liquid columns break during measurement. Open the vial containing PR-1 and use the applicator provided in the kit to remove a pin-head sized amount of the compound., Apply a very thin, even layer of PR-1 to the surface of the upper and lower pedestals.
-
Page 93: Other Software Error Messages
Section 17- Troubleshooting This error code is most likely to occur if the Windows account that is currently logged into Windows does not have read and write access to the folder c:\nanodrop data or one of its subfolders. See your PC administrator to make sure that all users of the operating software have the appropriate Windows access level. - Page 94 Section 17- Troubleshooting This error occurs when trying to install the software without administrator privileges. Contact your system administrator to install the software. Source Error… This error indicates that there is insufficient light getting through to make good absorbance measurements. Check that the sampling arm is in the down position and the power is connected.
-
Page 95: Sample Accuracy And Reproducibility
Section 17- Troubleshooting Insufficient Memory… This error message (or others with similar wording) occurs when attempting to install the operating software on a computer that does not have at least 40MB of free hard disk space. No Printer Connected… This error appears when attempting to print when a printer is not attached to the PC. -
Page 96: 260/280 Ratio
Section 17- Troubleshooting lambda DNA are particularly susceptible to this phenomenon. Note: Larger volumes used with cuvette-based spectrophotometers will mask the effect of sample non- homogeneity. Perform a Blanking Cycle This will confirm that the instrument is working well and that any sample carryover from previous measurements is not a concern. - Page 97 Section 17- Troubleshooting NanoDrop Spectrophotometer. The three main causes for this are listed below: Change in sample acidity Small changes in solution pH will cause the 260:280 to vary . Acidic solutions will under-represent the 260:280 ratio by 0.2-0.3, while a basic solution will over-represent the ratio by 0.2-0.3.
-
Page 98: Unusual Spectrum
Section 17- Troubleshooting of thumb”. The actual ratio will depend on the composition of the nucleic acid. Note: RNA will typically have a higher 260:280 ratio due to the higher ratio of Uracil compared to that of Thymine. Leninger, A. L. Biochemistry, 2 ed., Worth Publishers, New York, 1975 Unusual Spectrum A sample that exhibits jagged “cuts”... - Page 99 Section 17- Troubleshooting Save to your hard drive and email as an attachment to your local distributor or Technical Support. Application Module Screen Captures • Screen captures of the actual spectrum as seen on your PC are of great use in diagnosing problems. Making a screen capture is quite easy.
-
Page 100: Maintenance And Warranty
Section 18- Maintenance and Warranty 18. Maintenance and Warranty Cleaning The primary maintenance requirement of the NanoDrop 1000 Spectrophotometer is keeping the measurement pedestal surfaces clean. Upon completion of each sample measurement, wipe the sample from the upper and lower pedestals to prevent sample carryover and avoid residue buildup. -
Page 101: Warranty
Section 18- Maintenance and Warranty stop altogether. Contact Technical Support or your local distributor if you suspect your lamp may need replacing. Warranty All NanoDrop spectrophotometers and accessories manufactured by Thermo Fisher Scientific are warranted against manufacturing defects in parts and labor for a period of one year. Preventive Maintenance as well as additional one, two, and three year warranty extensions are available. -
Page 102: Appendices
Section 19- Appendices 19. Appendices Instrument Specifications • Sample Size: 1 microliter • Path Length: 1 mm (with auto-ranging to 0.2 mm) • Light Source: Xenon flash lamp • Detector Type: 2048-element linear silicon CCD array • Wavelength Range: 220-750 nm •... -
Page 103: Concentration Calculation (Beer's Law)
Section 19- Appendices Concentration Calculation (Beer’s Law) General The Beer-Lambert equation is used to correlate the calculated absorbance with concentration: A = E * b * c Where A is the absorbance represented in absorbance units (A), E is the wavelength-dependent molar absorptivity coefficient (or extinction coefficient) with units of liter/mol-cm, b is the path length in cm, and c is the analyte concentration in moles/liter or molarity (M). -
Page 104: Solvent Compatibility
Section 19- Appendices • RNA: 40 ng-cm/ul For the NanoDrop 1000 Spectrophotometer, path lengths of 1.0 mm and 0.2 mm are used compared to a standard spectrophotometer using a 10.0 mm path. Thus, the NanoDrop 1000 Spectrophotometer is capable of measuring samples that are 50 times more concentrated than can be measured in a standard spectrophotometer. - Page 105 Section 19- Appendices • Halftoning: Super Cell • Print Quality: Barcodes and Graphics 4. Click ‘OK’ to close this window then click ‘Apply’ 5. Next, click on the ‘Advanced’ tab. Ensure that ‘Enable advanced printing features’ box is checked. 6. Click on ‘Printing Defaults’ then ‘Advanced’ and set the following: •...
Need help?
Do you have a question about the NanoDrop 1000 V3.7 and is the answer not in the manual?
Questions and answers