
Subscribe to Our Youtube Channel
Related Manuals for Promax AE-166


Summary of Contents for Promax AE-166
- Page 1 Test Equipment Depot - 800.517.8431 - 99 Washington Street Melrose, MA 02176 - TestEquipmentDepot.com AE-166/167 SPECTRUM ANALYSER - 0 MI2134 -...
- Page 2 SAFETY NOTES Read the user’s manual before using the equipment, mainly "SAFETY RULES" paragraph. The symbol on the equipment means "SEE USER’S MANUAL". In this manual may also appear as a Caution or Warning symbol. WARNING AND CAUTION statements may appear in this manual to avoid injury hazard or damage to this product or other property.
- Page 3 SAFETY RULES This chapter contains important safety instructions that you must follow during operation and storage. Read the following before any operation to insure your safety and to keep the instrument in the best possible condition. Safety Guideline General Do not place any heavy object on the instrument.
- Page 4 Operation Environment Location: Indoor, no direct sunlight, dust free, almost non-conductive pollution (Note below). Temperature: 5 °C to 45 °C. Humidity: 90 % to 45 °C. (Pollution Degree) EN 61010-1:2010 specifies the pollution degrees and their requirement as follows. The instrument falls degree 2. ...
- Page 5 Symbols related with safety: Descriptive Examples of Over-Voltage Categories Low voltage installations isolated from the mains. Cat I Portable domestic installations. Cat II Fixed domestic installations. Cat III Cat IV Industrial installations. February 2017...
-
Page 6: Table Of Contents
TABLE OF CONTENTS INTRODUCTION ..................1 Description ................1 Main Features ................1 SETTING UP ..................3 Accessories ................3 Appearance ................4 First Use Instructions ..............12 2.3.1 Tilting the Stand ..............12 2.3.2 Inserting the Battery Pack (optional) ........13 2.3.3 Power Up ................ - Page 7 Bandwidth / Average Settings ............ 42 3.5.1 Resolution Bandwidth Setting (RBW) ........42 3.5.2 Video Bandwidth Setting (VBW) ..........43 3.5.3 VBW / RBW Ratio ..............43 3.5.4 Average Trace ............... 44 3.5.5 Average Type ................ 46 3.5.6 EMI Filter ................46 Sweep ..................
- Page 8 3.11.2 Error Messages ..............85 3.11.3 Set the System Language ............86 3.11.4 Set the Date and Time ............86 3.11.5 Display the Date and Time on the Screen ........86 3.11.6 Using the Wake Up Clock ............87 3.11.7 Alarm Output ................. 87 3.12 Preset ..................
- Page 9 FAQ ....................174 APPENDIX ..................175 Replace the Clock Battery ............175 Glossary of Acronyms .............. 176 AE-166/167 Default Settings ............ 178 Menu Tree ................181 8.4.1 Amplitude ................181 8.4.2 Frequency, Span, Autoset, BW Avg, Sweep ......183 8.4.3 Limit Line ................184 8.4.4 Trigger, Sequence ..............
-
Page 10: Introduction
SPECTRUM ANALYSER AE-166/167 1 INTRODUCTION Description The AE-166/167 builds on the strong feature set of the PROMAX spectrum analysers and significantly increases performance in almost every aspect; making this the most comprehensive and feature-rich spectrum analyser Promax has released. The AE-166/167 features a split window display to view data in spectrum, topographic or spectrographic views. - Page 11 Gate sweep Marker Frequency counter Two operating modes: Spectrum and Power Meter mode SEM measurement ACPR measurement OCBW measurement Phase jitter measurement Harmonics measurement P1dB measurement Channel power measurement Demodulation analyser ...
-
Page 12: Setting Up
2 SETTING UP Accessories Check that your package contains the following elements: Power cord Quick start guide Tracking generator (only for AE-167) “N”/ M –BNC/ H adapter Options ► Battery (11.1 V / 5200 mAH Li-ion battery) Optional accessories ►... -
Page 13: Appearance
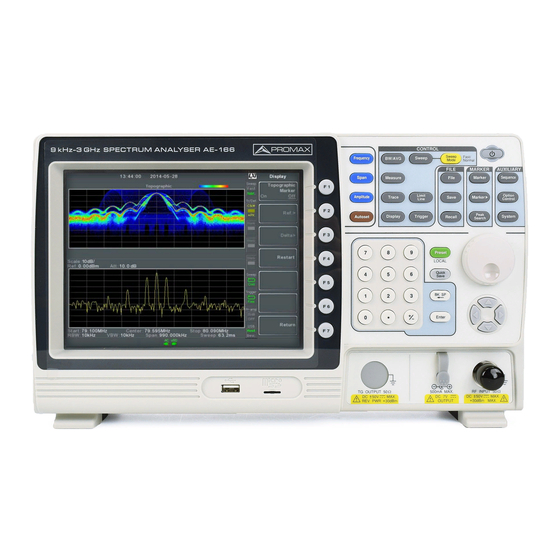
Appearance Front Panel Figure 1. LCD display: 800 X 600 color LCD display. The display shows the soft keys current function, frequency, amplitude marker information. Function keys: The F1 to F7 function keys directly correspond to the soft keys on the right-hand side of display. Main keys: ... - Page 14 Control keys: BW/Avg: Sets the resolution bandwidth, video bandwidth, average type and turns the EMI filter on/off. Sweep: Sets the sweep time and gate time. Sweep Mode: Toggles the Sweep Control between Fast and Normal mode. Measure: Accesses measurement options such as ACPR, OCBW, demodulation measurements, SEM, TOI, phase jitter and other advanced measurements.
- Page 15 Preset LOCAL: The Preset key will restore the spectrum analyser to the Factory or User Preset settings. The Preset key will also return the instrument back to local control after it has been in remote control mode. Quick Save: The Quick Save utility allows you to save either the state, trace, display screen, limit line, correction or sequence with only a single press.
- Page 16 Rear Panel Figure 2 RS232 port: 9 pin DSUB port. IF OUT: SMA IF Out port. DVI-I port: DVI video out port. Supports SVGA (800 X 600) @ 60 Hz. USB B / LAN port: USB B Device port. USB 1.1/2.0. ...
- Page 17 ALARM OUT / OPEN COLLECTOR: BNC female open collector Alarm output. TRIG IN/GATE IN port: BNC female 3.3 V CMOS trigger input/gated sweep input. Headphone: 3.5 mm stereo headphone jack (wired for mono operation). February 2017...
- Page 18 Display ► Figure 3. Scale and Reference level: Scale: Displays the vertical scale of the vertical grid. Reference level: Displays the reference level. Attenuation level: Displays the vertical scale (attenuation) of the input signal. Date/Time: Displays the date and time. Marker information: Displays marker information.
- Page 19 Blank: Unassigned setting icons. Settings, Trigger, Pre-amp and USB settings: Sweep mode icon that shows the sweep status. Trigger icon that shows the trigger status. Pre-amplifier icon that shows the Pre-amplifier status. USB settings icon displays the status of the USB A port. Status Icons: Displays the interface status, power source status and alarm status, etc.
- Page 20 Amplitude Offset Indicates that the amplitude-shift is active. This icon appears when amplitude-related functions are used: Reference level offset Amplitude Correction Input Z = 75 Ω and Input Z cal > 0 Battery indicator Indicates the battery charge. Bandwidth Indicator Indicates that or VBW...
-
Page 21: First Use Instructions
First Use Instructions Use the procedures below when first using the AE-166/167 to tilt the stand, power up the instrument, set the internal clock, set the wake-up clock, update the firmware and to restore the default settings. Lastly, the Conventions sections will introduce you to the basic operating conventions used throughout the user manual. -
Page 22: Inserting The Battery Pack (Optional)
2.3.2 Inserting the Battery Pack (optional) Description ► The AE-166/167 has an optional battery pack. The battery should be inserted before power is connected to the AC power socket and before the unit is turned on. Steps ► Ensure the power is off and the AC power is disconnected. -
Page 23: Power Up
The power button exterior will be lit blue to indicate that the AE-166/167 is in standby mode. Press the power button for a few seconds to turn the AE-166/167 on. The power button will turn orange and the AE-166/167 will start to boot up. -
Page 24: Setting The Date, Time And Wake-Up Clock
2.3.5 Setting the Date, Time and Wake-Up Clock Description ► The AE-166/167 can be setup to power-up automatically using the Wakeup Clock function. This feature is useful to wake-up the instrument early and eliminate settling time. System Date ►... -
Page 25: Firmware Update
2.3.6 Firmware Update Description ► The AE-166/167 allows the firmware to be updated by end-users. Before using the AE-166/167, please check the PROMAX website. System version ► Before updating the firmware, please check the firmware version. -
Page 26: Restoring Default Settings
The spectrum analyser will load the preset settings. 2.3.8 Conventions The following conventions are used throughout the user manual. Read the conventions below for a basic grasp of how to operate the AE-166/167 menu system and front panel keys. February 2017... - Page 27 Soft Menu keys ► The F1 to F7 function keys on the right side of the display correspond directly to the soft-menu keys on their left. Figure 9. Input Parameter Values ► Selecting this type of menu key will allow you to enter a new value with the numeric keypad or increment / decrement the value using the scroll wheel.
- Page 28 Toggle State & Input Parameter ► Pressing this menu key will allow you to toggle the state of the function between Auto and Man(ual) state. When in the Man state, the parameter value can be manually edited. Use the numeric keypad to enter the new value or use the scroll wheel to increment/decrement the current value.
- Page 29 Parameter input ► Parameter values can be entered using the numeric keypad, the scroll wheel and occasionally with the arrow keys. Figure 16. Using the numeric keypad ► When prompted to enter a parameter, use the number keys (0~9), the decimal key (.) and the sign key (+/-) to enter a value.
-
Page 30: Basic Operation
3 BASIC OPERATION Frequency Settings 3.1.1 Center Frequency Description ► The center frequency function sets the center frequency and centers the display to the center frequency. Operation ► Press > Center[F1] and enter the frequency and unit. Range: 0 kHz ~ 3 GHz Resolution: 1 Hz Default: 1.5 GHz Display... -
Page 31: Start And Stop Frequency
3.1.2 Start and Stop Frequency Description ► The start/stop frequency function will set the start and stop frequency of the span. Operation ► To set the start frequency, press > Start Freq[F2] and enter the frequency and unit. To set the stop frequency, press >... -
Page 32: Center Frequency Step
3.1.3 Center Frequency Step Description ► The CF Step function sets the step size of the center frequency when using the arrow keys or scroll wheel. When the scroll wheel or arrow keys or are used to alter the center frequency, each turn/press will move the center frequency by the step size specified by the CF Step function. -
Page 33: Frequency Offset
3.1.4 Frequency Offset Description ► The Freq Offset function allows you to add an offset to the Center, Start and Stop frequencies as well as the marker frequencies. The offset value does not affect displaying the trace on the display. Operation ►... -
Page 34: Span Settings
Span Settings 3.2.1 Span Description ► The Span function will set the frequency range of the sweep. The sweep will be centered around the center frequency. Setting the span will alter the start and stop frequencies. Operation ► Press > Span[F1] and enter the span frequency range and unit. Range: 0 kHz ~ 3 GHz Resolution: 1 Hz Default Span: 3 GHz... -
Page 35: Full Span
3.2.2 Full Span Description ► The Full Span function will set the span to the full frequency range. This function will set the start and stop frequencies to 0 Hz and 3 GHz respectively. Operation ► Press > Full Span[F2]. 3.2.3 Zero Span Description... -
Page 36: Last Span
The measurement functions such as TOI, SEM, CNR, CTB, NOTE: CSO, ACPR, OCBW, phase, Jitter, Harmonics, NdB, P1dB and other measurement functions are not available with the zero span setting. 3.2.4 Last Span Description ► The last span function returns the spectrum analyser to the previous span settings. -
Page 37: Attenuation
Display ► Figure 24. 3.3.2 Attenuation Description ► The attenuation of the input signal level can be set to automatic (Auto) or manual (Man). When the attenuation is set to Man, the input attenuator can be changed manually in 1dB steps. Operation ►... -
Page 38: Scale / Div
3.3.3 Scale / Div Description ► Sets the logarithmic units for the vertical divisions when the scale is set to Log. Operation ► Press > Scale/Div[F3] repeatedly to select the vertical division units. Unit Range: 10, 5, 2, 1 Display ►... -
Page 39: Scale Type
3.3.5 Scale Type Description ► Sets the vertical scale in linear or logarithmic units. By default the linear scale is set to volts and the logarithmic scale is set to dBm. Operation ► Press > More[F7] > Scale Type[F2] and set the vertical scale to Log or Lin. -
Page 40: Vertical Scale Units
3.3.7 Vertical Scale Units Description ► Change the vertical units for both linear or logarithmic scales. Operation ► Press > More[F7] > Y Axis[F1] and then choose the desired units. The units are changed accordingly. Units: dBm, dBmV, dBuV, Watts, Volts 3.3.8 Reference Level Offset Description... -
Page 41: Amplitude Correction
Example ► Figure 28. Before reference level offset(offset: 0dB) Figure 29. After reference level offset (offset: 10dB) 3.3.9 Amplitude Correction Description ► Amplitude correction adjusts the frequency response of the spectrum analyser by altering the amplitudes at specified frequencies. This allows the spectrum analyser to compensate for loss or gain from an external network or device at certain frequencies. -
Page 42: Create A Correction Set
3.3.10 Create a Correction Set Description ► The AE-166/167 can create and edit up to 5 sets of correction points. The correction points and associated values are all tabulated for ease of use. Operation ► Press >... - Page 43 Press Point Num[F1] and choose a point number to edit. Point numbers can only be created in order. For example Point Num 2 can only be selected after Point Num 1 is created, and point Num 3 can only be selected after Point Num 2 is created and so on.
-
Page 44: Amplitude Correction On/Off
3.3.11 Amplitude Correction On/Off Description ► Any one of the 5 correction sets can be turned on. Activate Correction ► Press > More[F7] > Correction[F3] > Correction Set[F1] and choose a correction set. Correction Set: 1 ~ 5 Press Correction[F2] and toggle correction on. Deactivate Correction ►... -
Page 45: Save Correction Set To Memory
3.3.13 Save Correction Set to Memory Operation ► Press > Save To[F1] and choose the save location. Location: Register, Local, USB, SD Press Type[F2] > Correction[F5]. Press Data Source[F3] and choose a correction. Correction Set: Correction 1 ~ 5 To name the file, press Name[F5]. Name the selected file using the F1 ~ F7 keys, as shown below or use the numeric keypad to enter numbers. -
Page 46: Recall Correction Set From Memory
Press to confirm the filename. If the file name is not user-defined, a file name will be NOTE: automatically created in the following format: File name: type_data source_file number.file extension: Example: Correction1_0.cor The file number parameter is incremented each time the same file type is created. -
Page 47: Input Impedance Calibration
The built-in pre-amplifier boosts weak input signals, such as EMI testing signals, to levels that are easy to handle, over the entire frequency range. The built-in pre-amplifier on the AE-166/167 has a nominal gain of 20 dB. In the Auto setting, the pre-amplifier will be automatically turned on when the reference level is less than -30 dBm. -
Page 48: Autoset
Example ► Figure 35. NOTE: When the pre-amplifier is on, the attenuator becomes fixed at 0 dB (i.e. Attenuation = 0 dB). Autoset The Autoset function searches the peak signals in two stages (full span & 0 Hz – 100 MHz limited span), picks the signal peak with the maximum amplitude, and then shows it in the display. - Page 49 Example ► Figure 36. Before Autoset, preset state Figure 37. After Autoset NOTE: RBW, VBW and sweep settings are reset to Auto when the Autoset function is used. February 2017...
-
Page 50: Limiting The Autoset Vertical Search Range
3.4.2 Limiting the Autoset Vertical Search Range Description ► You can set the amplitude floor so that the signals lower than the setting will be ignored by the Autoset search. Operation ► Press > Amp.Floor[F2] and switch the range from Auto to Man. Enter the amplitude limit and unit for the Autoset search. -
Page 51: Bandwidth / Average Settings
Bandwidth / Average Settings BW/AVG key sets the resolution bandwidth (RBW), video bandwidth (VBW) and averaging functions. The resolution, sweep time, and averaging are in a trade- off relationship, so configuration should be done with care. 3.5.1 Resolution Bandwidth Setting (RBW) Description ►... -
Page 52: Video Bandwidth Setting (Vbw)
If the setting is in Auto mode, using the scroll wheel or NOTE: arrow keys will automatically set the RBW to manual mode. Display Icon ► The BW icon is displayed at the bottom of the screen when the RBW is in Man mode. NOTE: If the RBW settings have an asterisk (*), it indicates that the -6 dB filters are used. -
Page 53: Average Trace
Display ► Figure 38. ► Signals that are masked by the noise floor level should have a ratio of less than 1 to smooth the noise out. Signals with strong frequency components should use a ratio equal to or greater than 1. 3.5.4 Average Trace Description... - Page 54 Example ► Figure 39. Average:Off Figure 40. Average: On (20 X) February 2017...
-
Page 55: Average Type
3.5.5 Average Type Description ► The Average Type function determines how the AE-166/167 determines the average value. LOG Average: Averages the trace points on a logarithmic scale. Volt Average: Averages the amplitudes of the trace points on a linear voltage scale. -
Page 56: Sweep
Sweep The AE-166/167 has a number of sweep options including setting the sweep time, the sweep run mode (continuous, single) and sweep mode (fast, slow). The AE-166/167 also has gated sweep modes. 3.6.1 Sweep Time Description ► Sweep time defines the length of time the system takes to "sweep” the current frequency span. -
Page 57: Single Sweep
3.6.2 Single Sweep Description ► The single sweep function is used to perform a single sweep. When Sweep Single is pressed the AE-166/167 will perform a single sweep and then stop. Operation ► Press > Sweep Single[F2] to put the spectrum analyser into single sweep mode. -
Page 58: Gated Sweep Overview
3.6.4 Gated Sweep Overview Description ► The Gated Sweep mode allows a trigger signal to dictate when the spectrum analyser can sweep. This mode is useful for characterizing signals that are pulsed on and off, such as RF burst transmissions or for measuring spurious noise levels between transmission bursts. -
Page 59: Using The Gated Sweep Mode
3.6.5 Using the Gated Sweep Mode Connection ► Connect a trigger signal (3.3v CMOS) to the GATE IN port on the rear panel. Figure 42. NOTE: RBW must be equal to or greater than 10 kHz for the gated sweep mode function to be available. Operation ►... - Page 60 Example ► The example below shows the spectrum of an FSK modulated signal when gated sweep mode is off. Figure 43. The example below shows the same signal with the gated sweep timed to sweep when only the desired frequency is output. Figure 44.
-
Page 61: Sweep Control / Sweep Mode
3.6.6 Sweep Control / Sweep Mode Description ► The Sweep Control function and the Sweep Mode key toggles the Sweep Mode from Normal to Fast. The Fast setting speeds up the signal processing and the display update rate to increase the overall sweep time. This mode is especially useful when the span is greater than 1 MHz. - Page 62 Sweep Times ► Center Frequency = 1.5 GHz Sweep Mode Span (Hz) RBW (Hz) AUTO Norm. Fast. 169 ms 84.8 ms 104 ms 52.2 ms 52 ms 31.1 ms 500 M 31 ms 16.8 ms 200 M 13.4 ms 6.72 ms 100 M 6.7 ms 3.36 ms...
-
Page 63: Trace
Trace The AE-166/167 is able to set the parameters of up to 4 different traces on the display at once. Each trace is represented by a different color and is updated with each sweep. 3.7.1 Selecting a Trace Description ►... - Page 64 Display Icon Example ► Figure 45. Operation ► Press > Trace[F1] and choose the trace number. 1, 2, 3, 4 Trace: Select the trace type: Clear & Write[F2] Max Hold[F3] Min Hold[F4] View[F5] Blank[F6] If Max Hold[F3] was selected, set the threshold level. NOTE: Traces, 2, 3 and 4 are set to Blank by default.
-
Page 65: Trace Math
3.7.2 Trace Math Description ► Performs trace math from two traces (TR1, TR2) and stores the result in the currently selected trace. It also performs trace shift. Math functions ► Power Diff: Subtracts the TR1 amplitude data from the TR2 amplitude data. -
Page 66: Trace Detection Mode
Display Icon ► The Math icon is displayed when trace math is turned on. 3.7.3 Trace Detection Mode Description ► Each time the spectrum analyser samples data for each point on the trace, a number of samples are usually taken for each point, known as a sample bucket. - Page 67 Auto Detector Selection Method ► Below is a flow chart diagram showing the Detector selection for the Auto mode. Figure 46. Operation ► Press > More[F7] > Detection[F2]. Select the trace detection mode for the selected trace: Auto[F1] Normal[F2] ...
- Page 68 Display Icon ► Normal Peak+ icon Sample icon Peak- icon RMS Average icon February 2017...
-
Page 69: Trigger
Trigger The Trigger function sets the signal conditions upon which the spectrum analyser triggers captured waveforms, including frequency, amplitude, and delay. An external trigger signal, instead of the default internal signal, may be used as required for special conditions. The sections below can be used to skip to the relevant section: ... -
Page 70: Activate External Trigger
Operation ► Press > Trigger Condition[F2] > Video[F1] Press Video Edge[F1] and choose the edge. Range: Positive, Negative Press Video Level[F2] and set the video voltage trigger level. Trigger level: (-120 dBm to +30 dBm) +Ref Level Offset Press Trigger Freq[F3] and choose the frequency at which the spectrum analyser will check the triggering conditions. -
Page 71: Selecting The Trigger Mode
Press Action Now[F5] to activate the external trigger. The system will now wait for the trigger conditions to be matched before starting a sweep. Display Icon ► The EXT Trigger icon is displayed when the external trigger is activated. The trigger will revert back to the Free Run mode if any NOTE: parameter settings are changed, such as the span or amplitude settings. -
Page 72: Set The Trigger Delay Time
3.8.5 Set the Trigger Delay Time Description ► Sets the delay time between when the analyser triggers and when the analyser begins to capture the signal. Delay time range: 1ns to 1ks Operation ► Press > Trigger Delay[F4] and set the trigger delay time. Delay range: 0 ~ 1000 s February 2017... -
Page 73: Marker
Marker A Marker shows the frequency and amplitude of a waveform point. The AE-166/167 can activate up to 6 markers or marker pairs simultaneously as well as up to 10 peak markers in the marker table. The marker table helps editing and viewing multiple markers in a single display. -
Page 74: Activate A Normal Marker
3.9.1 Activate a Normal Marker Operation ► Press > Select Marker[F1] and select a marker number. Marker: 1 ~ 6 Press [F2] to turn the selected marker on. Press Normal[F3] to set the selected marker to the Normal type. The display will show the marker on the trace (centered by default) with the marker measurement at the top of the display. -
Page 75: Move Marker To Preset Locations
3.9.3 Move Marker to Preset Locations Description ► key is used to move the selected marker to a number of preset positions. Functions ► Mkr>Center: Move to center frequency. Mkr>Start: Move to start frequency. Mkr>Stop: Move to stop frequency. ... -
Page 76: Move Delta Marker(S) Manually
Delta Markers ► Ref: Reference marker, designated as . Delta: Delta marker, designated as Operation ► Press > Select Marker[F1] and select a marker number. Press [F2] to turn the selected marker on. Press Delta[F4] > Delta[F1] to set the selected marker to the Delta type. 3.9.5 Move Delta Marker(s) Manually Move Delta or Reference Marker... -
Page 77: Marker Noise
3.9.6 Marker Noise Description ► The noise marker function calculates the average noise level over a bandwidth of 1 Hz, referenced from the marker position. Operation ► Press > Select Marker[F1] and select a marker number. Press [F2] to turn the selected marker on. Press Normal[F3] and then position the marker to the desired location. -
Page 78: Frequency Counter
3.9.7 Frequency Counter Description ► The frequency counter function is used to make accurate frequency measurements. Operation ► Press > Select Marker[F1] and select a marker number. Press [F2] to turn the selected marker on. Press Normal[F3] and then position the marker to the desired location. Press Function[F5] >... -
Page 79: Vswr
Description ► The Voltage Standing Wave Ratio is the voltage ratio between transmitted and reflected waves, usually measured in RF electrical transmission systems. The VSWR function will use the Tracking Generator of the AE-166/167 as reference signal. Operation ► Before starting a VSWR measurement, the tracking generator must be turned on and normalized. -
Page 80: Move Marker To Trace
The display will show the VSWR measurement at the top of the screen. Figure 52. 3.9.9 Move Marker to Trace Description ► The Marker Trace function moves the selected marker to any of the currently active traces. Operation ► Press >... -
Page 81: Show Markers In Table
Trace2. Figure 53. 3.9.10 Show Markers in Table Description ► The AE-166/167 has a Marker Table function to show all the active markers and measurements at once. Operation ► Press > More[F7] > Marker Table[F2] and turn the marker table The display will split into two screens. -
Page 82: Move Marker To Peak
Figure 54. 3.9.11 Move Marker to Peak Description ► key is used to find trace peaks. Operation ► Press > Select Marker[F1] and select a marker number. Press > Peak Search[F1]. The marker will move to the highest signal peak. To continually search for the peak on each sweep, press, >... -
Page 83: Move Marker To Peak To Center
3.9.12 Move Marker to Peak to Center Description ► The Center function moves the marker to the highest signal peak and moves the center frequency to that peak. This function can be used with the Next Peak, Next Peak Right, Next Peak Left and Min Search peak functions. Operation ►... - Page 84 Example ► Figure 55. Next Peak Figure 56. Next Peak Right February 2017...
-
Page 85: Peak Configuration
Figure 57. Next Peak Left 3.9.14 Peak Configuration Description ► There are two peak search configuration options: Peak Excursion and Peak Threshold. Peak Excursion: Peak Excursion sets the minimum value above the peak threshold for which peaks will be detected. Peak Threshold: Peak threshold sets the minimum threshold level for the analyser to detect peaks. -
Page 86: Peak Table
3.9.15 Peak Table Description ► The Peak Table function will display all peaks (up to 10) that meet the peak configuration settings. The amplitude and frequency for each peak is listed. Operation ► Press > More[F7] > Peak Table[F5]. Press Peak Sort[F2] and set the sorting type: Freq: Sort by frequency in ascending order Amp: Sort by amplitude in ascending order. -
Page 87: Display
3.10 Display The Display key configures the basic display settings as well as setting up the display mode (spectrum, spectrographic, topographic) and the split screen modes. 3.10.1 Adjusting the LCD Brightness Description ► The LCD brightness levels can be adjusted to three pre-set levels. Operation ►... -
Page 88: Using The Video Out Port
Figure 60. Display line set at -50 dBm 3.10.4 Using the Video Out Port Description ► The AE-166/167 has a dedicated DVI terminal to output the display to an external monitor. The video output is always on. Output resolution: 800 x 600 (fixed) Operation ►... - Page 89 Operation ► Press > Window Setup[F1] and select the display mode: Spectrum[F1]: Spectrogram[F3]: Topographic[F4]: Spectrogram+Spectrum[F5]: Topographic+Spectrum[F6]: NOTE: The same trace is used on the top and bottom for the Spectrogram+Spectrum and Topographic+Spectrum modes. Example: Spectrogram ► Figure 62. The Spectrogram view shows signals in both the frequency and time domain. The X-axis represents frequency, the Y-axis represents time and the color of each point represents the amplitude at a particular frequency &...
- Page 90 Topographic ► Figure 63. The topographic view shows the frequency of events. The topographic view is useful for observing smaller signals that have been overpowered by stronger signals or to easily observe intermittent events. Color is used to represent the frequency of an event.
-
Page 91: Spectrogram And Topographic Markers
Topographic + Spectrum ► Figure 65. Displays both topographic and spectrum views of the signal. 3.10.6 Spectrogram and Topographic Markers Description ► The Spectrogram and Topographic display view can also use markers and delta markers to mark the frequency and amplitude of points of interest. This function is particularly useful as it allows you to make delta measurements both in the frequency and time domain. - Page 92 To set the delta marker, press Return[F7] > Delta[F3] > X Axis[F1] and set the x-axis position of the delta marker (frequency). Press Y Axis[F2] to set the y-axis position of the delta marker (amplitude). The frequency and amplitude delta will be displayed on the remaining function keys: ΔFrequency[F3]: Position of the delta marker.
-
Page 93: Split Spectrum View
3.10.7 Split Spectrum View Description ► The split spectrum view is able to view two different sweep ranges on the display at the same time using a split screen view. The top and bottom view can have independent sweep ranges, amplitudes, spans and other settings. However only one split screen (top or bottom) can be swept each time. -
Page 94: System Settings
3.11 System Settings 3.11.1 System Information Description ► The System Information displays the following. Serial Number Installed Options Version: Calibration Date: Software Firmware File sys DNS Hostname MAC Address Wordlist Core Operation ► Press > System Information[F1] to bring up a list of the system information. -
Page 95: Set The System Language
3.11.3 Set the System Language Description ► The AE-166/167 supports a number of languages. The system language sets the soft menu keys to the selected language. Operation ► Press > Language[F3] and choose the system language. 3.11.4 Set the Date and Time Operation ►... -
Page 96: Using The Wake Up Clock
3.11.6 Using the Wake Up Clock Description ► The AE-166/167 has a wake-up clock to allow the spectrum analyser to automatically turn on at a set time. Operation ► Press > Date/Time[F4] > Wake-Up Clock[F3] and set the following parameters. -
Page 97: Preset
3.12 Preset The Preset function loads either factory default states or the user-defined states – depending on the Preset configuration settings. Using the Preset Key Save the User Preset Settings Preset Type Settings Power on Preset Settings 3.12.1 Using the Preset Key Description... -
Page 98: Power On Preset Settings
3.12.4 Power on Preset Settings Description ► When the spectrum analyser is turned on, either the preset configuration settings are loaded (default) or the configuration settings that were used before the instrument was turned off. Operation ► Press > Pwr On/Preset[F5] > Power On[F1] and choose the power on settings: Power On: Last, Preset. -
Page 99: Advanced Operation
4 ADVANCED OPERATION Measurement This section describes how to use the automatic measurement modes. The AE-166/167 includes the following measurements: ACPR OCBW AM Analysis FM Analysis AM/FM Demodulation Phase Jitter SEM measurement ... -
Page 100: Acpr
Adjacent channel offset 1 ~ 3: The frequency distance between the adjacent channels and main channel. Range: 1 Between 0 Hz ~ 3 GHz (0 Hz excepted) OCBW%: The ratio of occupied bandwidth to the amount of power consumed. - Page 101 Operation: Setting up the main channel ► Press > Channel Analysis[F1] > ACPR[F2] and turn ACPR on. Any other measurement mode will automatically be disabled. The display splits into two screens. The top screen shows the main channel, adjacent channels and their corresponding limits. The bottom screen shows the ACPR measurement results in real time.
-
Page 102: Ocbw
Move Channels Up/Down ► Press > Channel Analysis[F1] and press the following to move to another channel: Channel Move Up[F5]: Next main channel. Channel Move Down[F6] Previous main channel. NOTE: The channel space (CH SPC) parameter determines where the next main channel is located. - Page 103 Operation: Setting up the main channel ► Press > Channel Analysis[F1] > OCBW[F4] and turn OCBW on. Any other measurement mode will automatically be disabled. The display splits into two screens. The top shows the channel bandwidth. The bottom screen shows the OCBW measurement results in real time. Figure 73.
-
Page 104: Am Analysis
The channel space (CH SPC) parameter determines where NOTE: the next main channel is located. The CH SPC parameters from the ACPR and OCBW setups are independent. 4.1.4 AM Analysis Description ► When amplitude modulation is turned on, the input signal is centered on the center frequency and the span is automatically set to zero-span. - Page 105 Press Setup[F2] > IF Bandwidth[F1] and set the Intermediate frequency bandwidth. Set with adequate bandwidth to accommodate spectrum contained in the carrier. Press LPF[F2] to set the low pass filter frequency, alternatively the frequency can be set to bypass: AM Signal Frequency (Hz) Selectable bandwidth of LPF (Hz) =78,125...
- Page 106 Press Depth Axis[F4] to set depth (vertical) parameters: Ref.Value[F1]: Offsets the reference position as a percentage of the vertical scale/div. Ref.Pos[F2]: Sets the reference position of the waveform on a vertical grid subdivision (1:10). Scale/Div[F3]: Sets the vertical grid division scale when Auto Scale is Off.
-
Page 107: Am Pass Fail Testing
4.1.5 AM Pass Fail Testing Description ► The Limit Edit function puts a pass limit on the AM depth, carrier offset and carrier power. Measurement Range ► AM Depth: 5 % ~ 95 % Carr. Offset: 1 Hz ~ 400 kHz Carrier Power: -120 dBm ~ 30 dBm Operation: configuration ►... -
Page 108: Fm Analysis
4.1.6 FM Analysis Description ► When frequency modulation is turned on, the input signal is centered on the carrier frequency and the span is automatically set to zero-span. Measurement ítems ► Freq. Deviation: Current, Min, Cent, Max Mod. Rate: Current, Min, Cent, Max ... - Page 109 Press LPF[F2] to set the low pass filter frequency, alternatively the frequency can be set to bypass: FM Signal Frequency (Hz) Selectable bandwidth of LPF (Hz) =78,125 156,250 78,125 52,083 39,063 31,250 =39,063 78,125 39,063 26,042 19,531 15,625 =19,531 39,063 19,531 13,021 9,766...
-
Page 110: Fm Pass Fail Testing
Operation: trigger configuration ► Press AF Trigger[F5] > Trigger Setup[F2] to set the triggering conditions: Edge Slope[F1]: Sets the trigger to rising or falling edge. Trigger Mode[F2]: Sets the triggering mode: Norm.: Normal trigger Sgl.: Single trigger Cont.: Continuously trigger ... -
Page 111: Am/Fm Demodulation
Example ► Figure 77. 4.1.8 AM/FM Demodulation Description ► The AE-166/167 has a convenient AM/FM demodulation function to tune into AM or FM broadcast signals and listen to the demodulated baseband signals using the ear phone out socket. February 2017... -
Page 112: Phase Jitter Measurement
Operation: Setup ► Set the center frequency to the desired FM/AM carrier frequency. Set the span to zero. Set the Preamp to Auto. Connect an antenna to the RF input. Connection ► Connect headphones or a speaker to the phone output port. Operation ►... - Page 113 Example ► Figure 78. Operation: Setting up the main channel ► Press > Phase Jitter[F4]>Phase Jitter[F1] and turn Phase Jitter on. Any other measurement mode will automatically be disabled. The display splits into two screens. The top shows the trace with the start and stop offsets.
-
Page 114: Spectrum Emission Mask Overview
SEM measurements are often carried out for a number of different wireless standards. For 3GPP, the AE-166/167 supports BS (base station) and UE (user equipment) testing standards for both FDD (frequency-division duplexing) and TDD (time-division duplexing) modes. - Page 115 Select Offset: Selects the offset pairs (1 ~ 5) used for configuration. Start Freq: Sets the start frequency offset for the selected offset number. Stop Freq: Sets the stop frequency offset for the selected offset number. RBW: Sets the resolution bandwidth of the selected offset number.
- Page 116 3GPP Operating Bands* UL Frequencies DL Frequencies Operating Band UE transmit, Node B receive UE receive, Node B transmit 1920 ~ 1980 MHz 2110 ~ 2170 MHz 1850 ~ 1910 MHz 1930 ~ 1990 MHz 1710 ~ 1785 MHz 1805 ~ 1880 MHz 1710 ~ 1755 MHz 2110 ~ 2155 MHz 824 ~ 849 MHz...
- Page 117 3GPP-FDD BS ► For the FDD configuration, different limits can by chosen based on the total channel power, P. The default value for Δfmax is 12.5 MHz. Δfmax can be user-defined. The channel span is set to 5 MHz. Note: A, B, C, D, E denote offsets 1 to 5, respectively. P ≥...
- Page 118 For P < 31, two additional power limits (shown below) can be selected via the Additional Max Out. Pwr option for Home BS applications: (The default value for Δfmax is 14.5 MHz. Δfmax can be user-defined). 6 ≤ P ≤ 20 Unit: MHz 12.5 ≤...
- Page 119 3GPP-FDD UE Additional Requirements ► Additional requirements for 3GPP-FDD UE. Bands II, IV, X Unit: MHz Additional 2.5 ≤ A < 3.5 -15 dBm 30 kHz 3.5 ≤ B < 12.5 -15 dBm 1 MHz Band V Unit: MHz Additional 2.5 ≤...
- Page 120 31≤P<39 Unit: MHz 2.5 ≤ A < 2.7 P-53 dBm 30 kHz 2.7 ≤ B < 3.5 P-53 ~ P-65 dBm 30 kHz 3.5 ≤ C < 7.5 P-52 dBm 1 MHz 7.5 ≤ C < 12 P-56 dBm 1 MHz P≤31 Unit: MHz 2.5 ≤...
- Page 121 3GPP-TDD BS 7.68 Mcps ► The channel span: 7.68 Mcps: 10 MHz. P ≥ 43 Unit: MHz 5 ≤ A < 5.2 -17 dBm 30 kHz 5.2 ≤ B < 6 -17 ~ -29 dBm 30 kHz 6 ≤ C < 24.5 -16 dBm 1 MHz 39 ≤...
- Page 122 3GPP-TDD UE ► The channel span: 3.84 Mcps: 5 MHz. 1.28 Mcps: 1.6 MHz. 7.68 Mcps: 10 MHz. Note: A, B, C, D, E denote offsets 1 to 5, respectively. 3.84 Mcps Unit: MHz 2.5 ≤ A < 3.5 -35 ~ -50 dBc 30 kHz 3.5 ≤...
- Page 123 802.11g* ► The channel span: ERP-OFDM/DSSS-OFDM: 18 MHz ERP-DSSS/ERP-PBCC/ERP-CCK: 22 MHz Note: A, B, C, D denote offsets 1 to 4, respectively. Here the default value of “f” is 40 MHz (ERP-OFDM/ DSSS-OFDM) or 25 MHz (ERP-DSSS/ ERP-PBCC/ ERP-CCK). This can be user-defined. ERP-OFDM/ Unit: MHz DSSS-OFDM...
- Page 124 802.16* ► The channel span: CH BW 20 MHz: 19 MHz CH BW 10 MHz: 9.5 MHz Note: A, B, C, D denote offsets 1 to 4, respectively. Here the default value of “f” is 16.75 MHz (CHBW 20 MHz) or 31.5 MHz (CHBW 10 MHz). This can be user-defined.
-
Page 125: Spectrum Emission Mask Testing
4.1.11 Spectrum Emission Mask Testing Description ► For spectrum emission mask testing, the AE-166/167 has pre-defined testing parameters for 3GPP, 802.11x and 802.16. The AE-166/167 also allows you to perform user-defined SEM testing. Operation ► Press > SEM[F5] > SEM[F2] and turn SEM on. - Page 126 Press Offset/Limit[F3] to set the offset parameters: SelectOffset[F1]: Select which offset to edit. [F2]: Toggles the selected offset on/off. StartFreq[F3]: Sets the start frequency of the selected offset. StopFreq[F4]: Sets the Stop Frequency of the selected offset. ...
- Page 127 Pre-Set Test Parameters: 3GPP ► For details on 3GPP SEM test parameters. Press Setup[F1] > 3GPP[F1] to choose 3GPP measurement. Press Ref. Channel[F2] and set the following: RBW[F3]: Sets the resolution bandwidth. All other reference channel settings are pre-defined. Press Return[F7] to return the previous menu. Press Offset/Limit[F3]>Duplexing Mode[F1] and choose FDD or TDD duplexing: For FDD, press FDD Setup[F2] set the FDD parameters, for TDD, press...
-
Page 128: Third Order Intermodulation Distortion (Toi)
Pre-Set Test Parameters: 802.XX ► For details on 802.11x and 802.16 SEM test parameters, please see the SEM overview. Press Setup[F1]> and choose a 802.XX test: 802.11b[F2] 802.11g[F3] 802.11n[F4] 802.16[F5] Press Ref. Channel[F2] to view the predefined settings for channel integrated bandwidth, channel span, RBW and PSD ref. - Page 129 Example ► Figure 82. Operation ► Press > TOI[F6] > TOI[F1] and turn TOI on. Any other measurement mode will automatically be disabled. The display splits into two screens. The top shows the trace with markers in the upper and lower base frequencies and the upper and lower 3 order intermodulation products.
-
Page 130: Carrier To Noise Ratio (Cnr)
Press Reference[F2] to set the reference to the upper or lower base frequencies. icon will be displayed next to the selected upper or lower reference. Press Limit[F3] and set the limit for the upper and lower 3 order intermodulation product amplitude. Press Pass/Fail Test[F4] to toggle pass/fail testing on/off. - Page 131 Operation ► Press > More[F7] > CNR/CSO/CTB[F1] > Setup[F1] > CNR[F1] to choose CNR measurement. Press Noise Marking[F1] and toggle the noise marker type between Min and ΔMarker. If Min was selected, press Return[F7] to return to the previous menu. If ΔMarker was selected, press >...
-
Page 132: Composite Second Order (Cso)
NOTE: Ensure the aural and color subcarriers are turned off when making CNR measurements. 4.1.14 Composite Second Order (CSO) Description ► Composite Second Order measurement calculates the difference in amplitude between the carrier signal and the composite second order beat. Parameters ►... -
Page 133: Composite Triple Beat (Ctb)
Figure 87. Press CSO CH SPC[F3] to set the channel space. Range: 0 ~ 3 GHz Press Channel Move Down[F4] or Channel Move Up [F5] to move to next or previous channel. 4.1.15 Composite Triple Beat (CTB) Description ► Composite triple beat measurement calculates the difference in amplitude between the visual carrier and the composite triple beat amplitude. - Page 134 Example ► Figure 88. Operation ► Press > More[F7] > CNR/CSO/CTB[F1] > Setup[F1] > CTB[F3] > Return[F7] to choose CTB measurement and return to the previous menu. Press CTB[F2] and turn CTB on. Any other measurement mode will automatically be disabled. The display splits into two screens.
-
Page 135: Harmonic Measurements
Turn off the visual carrier signal from the input and press the on the front panel. A second trace will appear to mark the CTB amplitude. This will place a marker ( ) on the second trace and calculate the difference ( Press CTB CH SP[F2] to set the channel space. - Page 136 Operation ► Press > More[F7] > Harmonic[F2] > Harmonic[F1] and turn Harmonic on. Any other measurement mode will automatically be disabled. The display splits into two screens. The top shows a bar graph with fundamental measurement (1) and the each of the harmonic frequencies (2 ~ 10).
-
Page 137: N Db Bandwidth
4.1.17 N dB Bandwidth Description ► N dB bandwidth measurements are used to measure the frequency bandwidth that covers a specified amplitude (N dB) from the top of the peak. Example ► Figure 93. Operation ► Press > More[F7] > NdB Bandwidth[F3] > NdB BW[F1] and turn N dB BW on. -
Page 138: P1Db Measurement
NOTE: The NdB bandwidth measurements are strongly tied to the RBW and VBW. 4.1.18 P1dB Measurement Description ► The P1dB compression point describes the point at which the gain of an active DUT is 1dB less than the ideal linear gain (or small signal gain) relative to the input. - Page 139 The display splits into two screens. After setup has been completed (see step 3), the top shows the trace (yellow) with the ideal response in red. The P1dB measurement is shown in green. The bottom screen shows the P1dB measurement results in real time. Figure 97.
-
Page 140: P1Db Normalization
If the equivalent gain exceeds 30 dBm the gridicule area will WARNING: be bordered in red to indicate that the input exceeds specified levels. Figure 98. NOTE: The maximum power the DC output can provide is 7 volts / 500 mA. 4.1.19 P1dB Normalization Description... - Page 141 Example 1 ► Location = Prev Figure 99. Example 2 ► Location = Post Figure 100. NOTE: This function can only be used when the P1dB is turned on. February 2017...
- Page 142 Operation ► Connect the cable that is to be connected to the DUT between the TG and the other cable to the RF input. Figure 101. Press > More[F7] > P1dB[F4] > Normalize[F3]. Press Execute Norm[F3]. This will normalize the cable loss. The cable loss will be shown in the Execute Norm icon.
-
Page 143: Limit Line Testing
> Edit Select Limit[F1] > Limit Line [F1] and choose a limit line. Limit line: 1 ~ 5 Press Point by Point[F2]. The AE-166/167 is split into two screens. The top screen shows the trace and limit lines and the bottom screen shows the limit line table. Figure 105. February 2017... -
Page 144: Creating A Limit (From Trace Data)
> Edit Select Limit[F1] > Limit Line [F1] and choose a limit line. Limit line: 1 ~ 5 Press Trace Data to Limit Line[F3]. The AE-166/167 is split into two screens. The top screen shows the trace and limit lines and the bottom screen shows the limit line table. February 2017... -
Page 145: Creating A Limit (From Marker Data)
> Edit Select Limit[F1] > Limit Line [F1] and choose a limit line. Limit line: 1 ~ 5 Press Mkr Data to Limit Line[F4]. The AE-166/167 is split into two screens. The top screen shows the trace and limit lines and the bottom screen shows the limit line table. February 2017... - Page 146 Figure 107. Press Point Num[F1] and choose a point number to edit (must start at #1). Press Limit Offset[F3] and set the offset level for the point. This will only create an offset for the currently selected point, not all the points.
-
Page 147: Delete Limit Line
Press Pass Criterion[F3] and select the pass criteria. Criteria: All-In, Max-In, Min-In Press Pass/Fail Mode[F5] to select what the AE-166/167 will do on a fail judgment. Single will stop testing after a single fail. Continue will continue testing after each fail judgment. - Page 148 Example ► Figure 108. At least one limit line (high or low) must be turned on to NOTE: enable testing. If the high limit or low limit is turned off, the maximum or minimum* display level is set automatically as the high or low limit, respectively.
-
Page 149: Sequence
Sequence The Sequence function records and plays back user-defined macros. There are up to 5 sequences available in repeat or single running mode, with up to 20 steps each. Delays and pauses can also be introduced into a sequence to view measurement results during a sequence. - Page 150 Add a Step ► Up to 20 steps can be added to each sequence. Each panel operation is recorded as a step. After each panel operation is performed, press the key to record the step (in some cases this is not necessary – check if the operation appears in the sequence editor window).
- Page 151 Pause Sequence ► The Wait to Go function is used to pause a sequence until Continue[F1] is pressed. This is useful for observing measurements before moving onto the next step. Press Wait to Go[F3] > Wait to Go will be inserted as a step. Figure 112.
-
Page 152: Running A Sequence
Press Delete Step[F5] > to delete the step. The selected step will b removed from the Sequence editor. Figure 115. Stop Editing ► Press Stop Edit[F6]. icon turns off. Save Current Sequence ► After a sequence has been edited (and stopped) it can be saved. Press >... -
Page 153: Traking Generator (Only For Ae-167)
Traking Generator (only for AE-167) The tracking generator is a factory installed option that generates a sweep signal with its sweep time and frequency range matching the AE-166/167. The amplitude is maintained at a constant value over the entire frequency range. -
Page 154: Normalize The Tracking Generator
4.4.2 Normalize the Tracking Generator Background ► The normalize function subtracts the trace after each sweep with a reference trace. The resultant trace is added to a normalized reference level. Connection ► When normalizing the TG output, connect the TG output directly to the RF input. - Page 155 Figure 117. The normalized data will be turned off automatically if any NOTE: X-axis related parameters are changed or if the TG output level is changed. The warning message, “Execute Normalization again!” will appear under these circumstances. February 2017...
-
Page 156: Power Meter
Data Logging Power Meter Measurements 4.5.1 Activating Power Meter Mode Connection ► Connect the power sensor to the front panel USB A port on the AE-166/167. Connect the RF source to the power meter. Figure 118. Operation ► Press > Power Meter[F2] > Power Meter[F1] and toggle the power meter on. - Page 157 The display splits into two screens. The top screen shows the power measurement in dBm or W. The bottom screen shows a graph of the measurements. Figure 119. Press Power Unit[F2] and choose the unit: Unit: dBm, W Press Frequency[F3] choose measurement frequency (use the number pad): Frequency: 1 MHz ~ 6200 MHz Resolution: 1 MHz...
-
Page 158: Data Logging Power Meter Measurements
Press More[F6] > Trigger[F1] to toggle between a free run (internal) trigger and an external trigger. Trigger: Free, Ext Ext trigger input: 3.3 V CMOS Press More[F6] > MAX/MIN HOLD[F2] to toggle the MAX/MIN hold measurements on/off in the power meter bar. ... - Page 159 Press Save To[F1] and select a destination source: Local: Internal memory SD Card: External micro SD card NOTE: The micro SD card option will only be available when a micro SD card is inserted into the front panel port. After a destination has been selected, recording options appear.
- Page 160 The filename appears on the bottom of the screen as it is created. Figure 122. Press to confirm setting the filename. If the file name is not user-defined, a file name will be NOTE: automatically created in the following format: File name: type_data source_file number.file extension The file number parameter is incremented each time the same file type is created.
-
Page 161: File
File Overview The File function is used for basic file related operations including navigation, sorting copying and deleting. The AE-166/167 has a number of different file formats for trace data, limit lines, amplitude correction, sequences and other panel operations. File source and destination locations (local, USB or micro SD) can also be chosen with the file function. -
Page 162: File Types
5.1.2 File Types Overview ► The file types are listed in order as shown in the File menu. State ► State data contains the state of the each of the panel operations: Frequency Limit Line Span Sequence ... -
Page 163: Using The File Explorer
Correction ► Correction data contains the following correction (line) data: Point number Frequency value of point Gain offset of point Unit Sequence ► The sequence files contain the sequence number and step operations for that sequence. This data is not designed to be user editable. Tracking Generador ►... - Page 164 Selecting files ► Press > File Explorer. Select memory location: Local[F1]: ternal memory. USB[F2]: ont panel USB memory. SD Card[F3]: icro SD card. The up/down arrow keys or the scroll wheel can be used to move up/down the file list. The left/right arrow keys can be used to move to the next/previous page of files in the file list.
-
Page 165: Copy Files
Preview Image Files ► Image files can be previewed on the screen by enabling the preview function. Press More[F7] > Preview[F2] and toggle preview on or off. Example ► Figure 123. NOTE: When Preview is turned on, other file types will not be viewable. -
Page 166: Move Files
The USB and micro SD card options will only be available NOTE: when a flash drive/SD card is inserted into the front panel ports. 5.1.5 Move Files Description ► Files from local memory can be moved to external memory such as USB or micro SD card and vice versa. -
Page 167: Delete Files
5.1.6 Delete Files Description ► Any files in local memory or external memory such as USB or micro SD card can be deleted. Connect External Memory ► To delete files on a USB flash drive or micro SD card, insert the appropriate device into the front panel port. - Page 168 Rename File ► Press > File Explorer. Select a file from local or external memory. Press Rename[F6]. Rename the selected file using the F1 ~ F7 keys, as shown below or use the numeric keypad to enter numbers: Limitations: No spaces ...
-
Page 169: Save Files
The USB and micro SD card options will only be available NOTE: when a flash drive/SD card is inserted into the front panel ports. 5.1.8 Save Files Description ► Any function settings or configurations that have been applied to the spectrum analyser can be saved using the key. - Page 170 For trace data, press Format[F4] to select the format type to save: Trace: Save trace data only Trace+State: Save trace and state data Press Save To[F1] and select a destination source: Register 1~6: Internal memory registers, these internal registers are not part of local memory.
- Page 171 The filename appears on the bottom of the screen as it is created. Figure 127. Press to confirm the naming of the file. NOTE: If the file name is not user-defined, a default naming scheme will be used. See the note below for details. To save the selected file type, press Save Now[F7].
-
Page 172: Recall Files
5.1.9 Recall Files Description ► Most files that have previously saved a setting or state can be recalled using key. The exception to this are the data logging settings. Connect External Memory ► To recall files from a USB flash drive or micro SD card, insert the appropriate device into the front panel ports. -
Page 173: Quick Save
5.1.10 Quick Save Description ► key is a hot key to save files with a single press. The type of file that is saved is pre-configured with the key. By default, the the key will save screen shots to the local memory or to an external flash drive (if inserted). -
Page 174: Remote Control
NOTE: It may take a few moments to switch USB modes. 6.1.2 Configure the LAN Interface The AE-166/167 can be configured for remote control or monitoring over a LAN or WLAN. The AE-166/167 supports HiSlip. HiSlip (High-Speed LAN Instrument Protocol) - Page 175 LAN configuration Settings ► IP Address, Default Gateway, Subnet Mask, DNS Server, DHCP on/off. Connection ► Connect an Ethernet cable from the network to the rear panel LAN port. Settings ► Press > More[F7] > RmtInterface[F1] > LAN[F2] > LAN Config[F1] to set the LAN settings: ...
-
Page 176: Configure The Wlan Interface
AE-166/167 via remote control commands. Background ► To use the AE-166/167 as a server using a 3G modem, you must first obtain a fixed IP address from a network provider. Each provider will assign different fixed IP addresses. - Page 177 Settings ► Insert the 3G USB modem into the front panel USB A port and wait for the 3G USB icon to appear. Press > More[F7] > RmtInterface[F1] > LAN[F2] > WLAN Config[F2] > Apply[F6] and wait for the 3G USB modem to establish the WLAN settings.
-
Page 178: Configure Rs232C
RS232 remote control. *idn? This should return the Manufacturer, Model number, Serial number, and Firmware version in the following format. *PROMAX,AE-166 AES01,XXXXXXXX,V3.X.X.X Manufacturer: PROMAX Model number: AE-166 AES01 Serial number: XXXXXXXX Firmware version: V3.X.X.X February 2017... -
Page 179: Lxi Browser Interface And Function Check
6.1.6 Browser Interface and Function Check Functionality check ► Enter the IP address of the spectrum analyser in a web browser after the instrument has been configured and connected to the LAN or WLAN. http:// XXX.XXX.XXX.XXX The web browser interface appears: Welcome Page ►... - Page 180 View & Modify Configuration ► The View & Modify Configuration allows you to modify the LAN settings from the browser. Press the Modify Configuration button to modify any of the configuration files. A password must be entered to alter the settings. Default password: lxiWNpwd [Note: password is case sensitive.] Figure 131.
- Page 181 A password must be entered before remote commands can be used. Default password: lxiWNpwd [Note: password is case sensitive.] Figure 132. Get Image ► The Get Image page allows the browser to remotely capture a screenshot of the AE-166/167 display. Figure 133. February 2017...
-
Page 182: Gpib/Lan/Usb Control Function Check
6.1.7 GPIB/LAN/USB Control Function Check Functionality check ► Please use the National Instruments Measurement & Automation Controller software to confirm GPIB/LAN functionality. February 2017... -
Page 183: Faq
7 FAQ I connected the signal but it does not appear on screen. Run Autoset and let the AE-166/167 find the best display scale for your target signal. Press the Autoset key, then press Autoset[F1]. I want to see which optional items are installed. -
Page 184: Appendix
The system clock and wake-up clock keep time using a button battery. Battery type: CR2032, 3 V, 210 mAh Connection ► Turn off the AE-166/167 and remove the battery cover and battery (if connected). Figure 134. Replace the battery with the same type and specification. -
Page 185: Glossary Of Acronyms
Glossary of Acronyms Acronym Definition Binary Frequency Shift Keying 2FSK Generation Partnership Project 3GPP Adjacent Channel Power Ratio ACPR Base Station Center Frequency Channel Bandwidth CH BW Channel Space CH SPC International Special CISPR Committee on Radio Interference Carrier to Noise Ratio Composite Second Order Composite Triple Beat Displayed Average Noise Level... - Page 186 One-dB compression point P1dB Resolution Bandwidth Reference Spectrum Emission Mask Signal to Noise and Distortion Ratio SINAD Time-Division Duplexing Tracking Generator Third Order Intercept User Equipment Up Link Video Bandwidth February 2017...
-
Page 187: Ae-166/167 Default Settings
AE-166/167 Default Settings The following default settings are the factory configuration settings for the spectrum analyser (Function settings/Test settings). Frequency Center Frequency: 1.5 GHz Start Frequency: 0 Hz Stop Frequency: 3 GHz CF Step: Auto Frequency Offset: 0 Hz Span... - Page 188 Display Window Setup: Spectrum LCD Brightness: Hi LCD Backlight: On Display Line, -50.0 dBm, Off Meas All measurement functions: Off EMC Pretest All EMC test functions: Off Limit Line Limit lines: Off Pass/Fail Test: Off Trigger Free Run Trigger Condition: Video Trigger Mode: Norm.
- Page 189 Option Control Tracking Generator: Off Power Meter: Off System Language: region dependent Power On: Preset Preset Type: Factory Preset Alarm Output: Off Remote Interface Config GPIB Address: 3 LAN: DHCP HiSPIP Port:4880 RS232 BaudRate: 115200 USB Mode: Host February 2017...
-
Page 190: Menu Tree
Menu Tree 8.4.1 Amplitude Figure 136. February 2017... - Page 191 Figure 137. February 2017...
-
Page 192: Frequency, Span, Autoset, Bw Avg, Sweep
8.4.2 Frequency, Span, Autoset, BW Avg, Sweep Figure 138. February 2017... -
Page 193: Limit Line
8.4.3 Limit Line Figure 139. February 2017... -
Page 194: Trigger, Sequence
8.4.4 Trigger, Sequence Figure 140. February 2017... -
Page 195: Trace
8.4.5 Trace Figure 141. February 2017... -
Page 196: Display
8.4.6 Display Figure 142. February 2017... -
Page 197: Marker
8.4.7 Marker Figure 143. February 2017... -
Page 198: Peak Search, Marker
8.4.8 Peak Search, Marker Figure 144. February 2017... -
Page 199: System
8.4.9 System Figure 145. February 2017... - Page 200 Figure 146. February 2017...
- Page 201 Figure 147. February 2017...
- Page 202 Figure 148. February 2017...
-
Page 203: Option Control
8.4.10 Option Control Figure 149. February 2017... -
Page 204: File
8.4.11 File Figure 150. February 2017... - Page 205 Figure 151. February 2017...
-
Page 206: Save
8.4.12 Save (Mode = Power Meter) Figure 152. February 2017... - Page 207 Figure 153. February 2017...
- Page 208 (Mode = Spectrum) Figure 154. February 2017...
-
Page 209: Recall
8.4.13 Recall (Mode = Power Meter) Figure 155. February 2017... - Page 210 (Mode = Spectrum) Figure 156. February 2017...
-
Page 211: Measure
8.4.14 Measure Figure 157. February 2017... - Page 212 Figure 158. February 2017...
- Page 213 Figure 159. February 2017...
- Page 214 Figure 160. February 2017...
- Page 215 Figure 161. February 2017...
- Page 216 Figure 162. February 2017...
- Page 217 Figure 163. February 2017...
- Page 218 Figure 164. February 2017...
- Page 219 Figure 165. February 2017...
- Page 220 Figure 166. February 2017...
- Page 221 Figure 167. February 2017...
- Page 222 Figure 168. February 2017...
- Page 223 Figure 169. February 2017...
-
Page 224: Ae-166/167 Specifications
AE-166/167 Specifications The specifications apply when the AE is powered on for 45 minutes* to warm- up to a temperature of 20°C to 30°C, unless specified otherwise: 8.5.1 Frequency Frequency Range 9 kHz to 3 GHz Resolution 1 Hz Frequency Reference Accuracy ±(period since last adjustment X aging rate) - Page 225 Phase Noise Offset from Carrier Fc =1 GHz; RBW = 1 kHz, VBW = 10 Hz; Average = 40 10 kHz <-88 dBc/Hz Typical 100 kHz <-95 dBc/Hz Typical 1 MHz <-113 dBc/Hz Typical Resolution Bandwidth (RBW) Filter Filter Bandwidth 1 Hz to 1 MHz in -3dB bandwidth 1-3-10 sequence...
-
Page 226: Amplitude
8.5.2 Amplitude Amplitude Range Measurement 100 kHz to 1 MHz Displayed Average Range Noise Level (DANL) to 18 dBm 1 MHz to 10 MHz DANL to 21 dBm 10 MHz to 3 GHz DANL to 30 dBm Attenuator Input Attenuator 0 to 50 dB, in 1 dB Auto or manual Range... - Page 227 100 kHz to 1 MHz < -108 dBm - 3 x (f/100 kHz) dB 1 MHz to 10 MHz < -142 dBm Nominal 10 MHz to 3 GHz < -142 dBm + 3 x (f/1 GHz) dB Level Display Range Scales Log, Linear Units...
- Page 228 Frequency Response Preamp off Attenuation: 10 dB; Reference: 160 MHz; 20 to 30°C 100 kHz to 2.0 GHz ± 0.5 dB 2 GHz to 3 GHz ± 0.7 dB Preamp on Attenuation: 0 dB; Reference: 160 MHz; 20 to 30°C 1 MHz to 2 GHz ±...
-
Page 229: Sweep
Spurious Response Second Harmonic Preamp off; signal input - Intercept 30 dBm; 0 dB attenuation +35 dBm Typical; 10 MHz < fc < 775 MHz +60 dBm Typical; 775 MHz = fc < 1.625 GHz Third-order Preamp off; signal input - Intercept 30 dBm;... -
Page 230: Front Panel Input/Output
8.5.5 Front Panel Input/Output RF Input Connector Type N-type female Impedance 50 ohm Nominal VSWR <1.6 :1 300 kHz to 3 GHz; Input attenuator = 10 dB Power for Option Connector Type SMB male Voltage/Current DC +7V / 500 With short-circuit mA max protection USB Host... - Page 231 Alarm Output Connector Type BNC female Open-collector Trigger Input/ Gated Sweep Input Connector Type BNC female Input Amplitude 3.3V CMOS Switch Auto selection by function LAN TCP/IP Interface Connector Type RJ-45 Base 10Base-T; 100Base-Tx; Auto-MDIX USB Device Connector Type B plug For remote control only;...
-
Page 232: General
Battery Pack (Optional) Battery pack 6 cells, Li-Ion With UN38.3 rechargeable, 3S2P Certification Voltage DC 10.8 V Capacity 5200 mAh / 56Wh 8.5.7 General Internal Data 16 MB nominal storage Power <82 W Consumption Warm-up Time < 45 minutes Temperature +5 °C to +45 °C Operating Range... -
Page 233: Tracking Generator (Only For Ae-167)
8.5.8 Tracking Generator (only for AE-167) Frequency Range 100 kHz to 3 GHz Output Power -50 dBm to 0 dBm in 0.5 dB steps Absolute Accuracy ± 0.5 dB @160 MHz, -10 dBm, Source attenuation 10 dB, 20 to 30°C Output Flatness Referenced to 160 MHz, -10 dBm 100 kHz to 2 GHz... -
Page 234: Ae-166/167 Dimensions
AE-166/167 Dimensions Figure 170. February 2017... - Page 235 PROMAX ELECTRONICA, S. L.
Need help?
Do you have a question about the AE-166 and is the answer not in the manual?
Questions and answers