Satec Expertmeter EM720 Operation Manual
Power quality and revenue meter
Hide thumbs
Also See for Expertmeter EM720:
- Reference manual (149 pages) ,
- Installation manual (32 pages) ,
- Operation manual (218 pages)
Table of Contents
Advertisement
Quick Links
Advertisement
Table of Contents

Related Manuals for Satec Expertmeter EM720


Summary of Contents for Satec Expertmeter EM720
- Page 1 POWER QUALITY AND REVENUE METER EM720/EM720T Operation Manual BG0451 Rev. A1...
- Page 2 LIMITED WARRANTY The manufacturer offers the customer a 24-month functional warranty on the instrument for faulty workmanship or parts from date of dispatch from the distributor. In all cases, this warranty is valid for 36 months from the date of production.
- Page 3 Failure to observe precautions can result in serious or even fatal injury or damage to equipment. All trademarks are property of their respective owners December 2008 Copyright 2008 © SATEC Ltd. EM720 Power Quality and Revenue Meter...
-
Page 4: Table Of Contents
T able of Contents Chapter 1 Introduction ............. 7 Chapter 2 Operating the EM720 ........14 Controls and Indicators ..............14 TEST Mode ..................15 Device Diagnostics................ 15 Meter Security ................16 Meter Clock and Time Synchronization ......... 17 Monitoring Meter Batteries ............17 Billing and Energy Metering ............ - Page 5 Communicating through a Serial Port..........52 Communicating through the Internet ..........54 Communicating through a GSM/GPRS Modem ........54 Communicating through a USB ............56 Setting Up the Meter..............57 Downloading Setups to the Meter ............58 Uploading Setups from the Meter ............58 Authorization and Security ............
- Page 6 Operating Event Flags..............130 Upgrading Meter Firmware ............131 Chapter 7 Monitoring Meters......... 133 Viewing Real-time Data .............. 133 Viewing Real-time Min/Max Log ..........138 Viewing Real-time Waveforms ............ 139 Chapter 8 Retrieving Recorded Data ......140 Uploading Files on Demand............140 Using the Upload Scheduler ............
-
Page 7: Chapter 1 Introduction
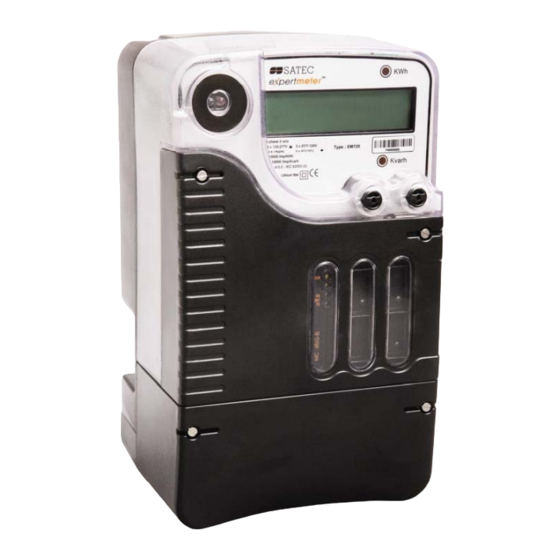
Chapter 1 Introduction Chapter 1 Introduction eXpertmeter™ EM720/EM720T The EM720 is especially designed for utility, industrial and commercial billing metering where high reliability of power quality monitoring and high availability of the meter are essential requirements. eXpertmeter™ EM720 is an electronic revenue- accuracy multi-rate polyphase static meter integrated with a multi-function powermeter, an EN50160 power quality recorder, a digital fault recorder and a programmable... - Page 8 Chapter 1 Introduction Fast transient recorder An optional high-voltage fast transient recorder (EM720T) detects impulsive and low frequency oscillatory transient overvoltages with peaks up to 2kV and durations of less than 20 microseconds. Digital fault recorder An embedded fault recorder is capable of recording current faults up to 50 amps.
- Page 9 Chapter 1 Introduction overvoltages with peaks up to 2kV and durations of less than 20 microseconds • Ready-for-use compliance statistics reports Fault Recorder • Fast digital Fault recorder: up to 8 external digital triggers from protection relays; onboard voltage and current fault detector; programmable fault thresholds and hysteresis •...
- Page 10 Chapter 1 Introduction • OR/AND logic, extensive triggers, programmable thresholds and delays, relay control, event-driven data recording • 8 digital counters for counting pulses from external sources and internal events • 4 programmable timers from 1 cycle to 24 hours for periodic recording and triggering operations on a time basis.
- Page 11 Software Support • PAS – free meter configuration and data acquisition tool • eXpertPower – SATEC proprietary Internet services EM720 Models The EM720 meter series includes two models: • EM720 – basic model - offers all the EM720 billing, instrumentation, control, power quality and fault recording capabilities •...
- Page 12 Chapter 1 Introduction Supplemental Documents BG0450 EM720 Installation Manual BG0457 EM720 Modbus Reference Guide BG0458 EM720 DNP3 Reference Guide BG0459 EM720 IEC 61850 Reference Guide BG0460 EM720 IEC 62056-21 Reference Guide BG0337 PAS Getting Started Guide EM720 Power Quality and Revenue Meter...
- Page 13 Chapter 1 Introduction Meter Nameplate Meter serial number MAC address Voltage input Rated current Watt-hour meter EM720 Power Quality and Revenue Meter...
-
Page 14: Chapter 2 Operating The Em720
Chapter 2 Operating the EM720 Chapter 2 Operating the EM720 Controls and Indicators Push Buttons The EM720 provides two sealable push buttons that do not have labels. They allow you to scroll through the multi- page display screens for local meter reading, to inspect or change meter setup parameters, and to control display operations. -
Page 15: Test Mode
Chapter 2 Operating the EM720 TEST Mode The LED pulse rate in NORMAL mode is indicated on the meter nameplate. The LED pulse rate in TEST mode is user-programmable from 0.01 to 0.25 Wh/imp, or from 100,000 to 4,000 imp/kWh. The factory set test LED pulse rate is 0.01 Wh/imp, or 10,000 imp/kWh. -
Page 16: Meter Security
Chapter 2 Operating the EM720 Meter Security clock. In the event of a configuration reset, check the setup affected by the fault via the device Event log, and then verify the setup data. Hardware failures are normally non-critical recoverable faults that do not cause a system failure but may cause data loss. -
Page 17: Meter Clock And Time Synchronization
Chapter 2 Operating the EM720 Meter Clock and Time Synchronization Password-tampering events are automatically recorded to the Event log file after every three unsuccessful login attempts in 5 minutes. Meter Clock and Time Synchronization Time synchronization provides a common time basis for the meter billing and tariff system, and for the power quality fault... -
Page 18: Billing And Energy Metering
Chapter 2 Operating the EM720 Billing and Energy Metering Billing and Energy Metering EM720 provides true four-quadrant energy measurements for kWh imported and exported, kvarh imported and exported, and total kVAh, with Class 0.2S IEC 62053-22 accuracy. Energy Measurement Channels The EM720 uses two independent current channels for high-accuracy energy measurements and for conventional high-range instrumentation. - Page 19 Chapter 2 Operating the EM720 Billing and Energy Metering registers providing the same demand tariff structure as you selected for energy registers. Tariff Rates The meter tariff structure supports 8 different tariff rates using an arbitrary tariff schedule. A total of 4 types of days and 4 seasons are supported with up to eight tariff changes per day.
-
Page 20: Instrumentation Metering
Chapter 2 Operating the EM720 Instrumentation Metering the present billing period and for three previous billing periods. The display is automatically configured for your set of billing registers and your tariff schedule. See Billing Period Data Displays in Chapter 3 for the display layout. Instrumentation Metering Instrumentation metering... -
Page 21: Operating Digital Inputs
Chapter 2 Operating the EM720 Operating Digital Inputs Operating Digital Inputs The EM720 can monitor a total of 8 digital inputs including four fast internal digital inputs and up to 2 replaceable two-channel 2DI/2DO modules. EM720 Installation Manual for digital input ratings. The module is provided with four indication LEDs that show the status of the digital inputs and relay outputs: Color... -
Page 22: Operating Relay Outputs
Chapter 2 Operating the EM720 Operating Relay Outputs Fault Recorder setup (see Configuring the Fault Recorder in Chapter 5) • External synchronization of power demand intervals – select a digital input as an external power demand sync source (see Basic Meter Setup in Chapter 5) •... -
Page 23: Operating The Event Recorder
Chapter 2 Operating the EM720 Operating the Event Recorder value exceeds the predefined threshold or when a status transition is detected on the meter inputs. It provides a 1/2-cycle response time for fast analog and digital triggers. The controller can monitor internal diagnostics events and meter operation status to give a fault indication via relay outputs or provide cross triggering multiple devices. -
Page 24: Operating The Fault Recorder
Chapter 2 Operating the EM720 Operating the Fault Recorder The recorder does not require any special setup above a conventional Power Quality recorder setup for transient overvoltages. Waveform log #3 is especially dedicated for the fast transient recorder. It automatically stores 1-cycle voltage transient waveforms sampled at a rate of 1024 samples/cycle whenever a transient overvoltage event is detected. - Page 25 Chapter 2 Operating the EM720 Communicating with the EM720 The IR port is identified in the EM720 as port COM1. It is factory preset to 19200 bps, 8-bits/No-parity data format, and is pre-programmed for the IEC 62056-21 protocol. You can change the default baud rate or protocol for the IR port from the front display or via PAS (see Setting Up Serial Communication Ports...
- Page 26 Chapter 2 Operating the EM720 Communicating with the EM720 The port has two indication LEDs that operate as follows: Color Status Description LINK Green Lights The good link is detected (slightly blinks when the port receives or transmits data) Blinks Activity on the port - the port receives or transmits data...
- Page 27 Chapter 2 Operating the EM720 Communicating with the EM720 A GSM/GPRS module may only be installed into expansion slot 3. The module has two indication LEDs that operate as follows: Color Status Description LINK Green Flashes/Lights Flashes while the modem is registering on the GPRS network and is lit up after the meter has logged on the network RSSI...
-
Page 28: Auxiliary Dc Backup Power Supply
Chapter 2 Operating the EM720 Auxiliary DC Backup Power Supply NOTE When you add new modules to the meter, or change their location in the expansion slots, or change either Ethernet or GPRS network parameters, the meter logs out of the network and logs on again so the IP address you might use for connecting to the meter will no longer be supported. -
Page 29: Chapter 3 Using Front Display
Chapter 3 Using Front Display Display Operations Chapter 3 Using Front Display Display Operations The EM720 has a high-contrast graphical LCD display with backlight for local data read outs, meter setup and servicing. The display operates in two modes: • Multi-page data display mode with the Auto-Scroll feature allows you to scroll through display screens and pages to view various billing, instrumentation... -
Page 30: Navigating In Data Display Mode
Chapter 3 Using Front Display Display Operations The function of each button changes depending on what operating mode the display is in. The SCROLL button operates once it’s briefly pressed. It has two functions: • In data display mode, it scrolls through the display pages. -
Page 31: Status Indicators
Chapter 3 Using Front Display Display Operations BILL 3 Third previous (-3) billing period data MAX. DEMAND Engineering maximum demands ENGINEERING Instrumentation data SETUP Basic meter setup data DEVICE INFO Device service data DIAGNOSTICS Device diagnostics messages Your present location is indicated by three numbers at upper right of the display as shown in the following picture. - Page 32 Chapter 3 Using Front Display Display Operations Indicator Icon Event Description Priority High Low lithium battery indicator with auto-reset. Indicates that the battery voltage is below its operational limit. The battery should be checked and replaced. See the meter installation manual for the battery replacement procedure.
-
Page 33: Display Features
Chapter 3 Using Front Display Display Operations If the phase voltage is either missing or below the voltage interruption threshold, the phase indicator is replaced with a dash. Display Features The EM720 display has a number of programmable features that can be disabled, enabled and adjusted via the meter Display Setup (see Display Setup in Chapter 5). -
Page 34: Measurement Units
Chapter 3 Using Front Display Display Operations Measurement Units The following table shows the display resolution for some displayed quantities. Measured Voltage Units and Display Resolution Quantity Connection Energy kWh, kvarh, kVAh with one decimal place. The number of digits is programmable (see Device Options and Mode Control... -
Page 35: Data Displays
Chapter 3 Using Front Display Data Displays Data Displays TEST Mode Data Display The TEST display is only shown in the meter TEST mode. D evice Options and Mode Control in Chapter 5 on how to enter the meter TEST mode. TEST mode display: test LED pulse rate in Wh/impulse, test kWh and kvarh energy registers readings with an extended 0.001 kWh resolution. - Page 36 Chapter 3 Using Front Display Data Displays Number of Pages Display Contents Register 1 tariff 1…8 maximum demand Register 2 tariff 1…8 maximum demand … … Register 10 tariff 1…8 maximum demand 1-10 Register 1…10 total cumulative maximum demand Register 1 tariff 1…8 cumulative maximum demand Register 2 tariff 1…8 cumulative maximum demand …...
- Page 37 Chapter 3 Using Front Display Data Displays Total energy reading of register 4 – exported (capacitive) kvarh. Tariff 1 energy reading of register 1 – imported kWh. Tariff 2 energy reading of register 1 – imported kWh. … … Tariff 3 energy reading of register 4 – exported kvarh.
- Page 38 Chapter 3 Using Front Display Data Displays Tariff 1 cumulative maximum demand reading of register 1 – imported kW. … … Tariff 3 cumulative maximum demand reading of register 4 – exported kvar. Previous Billing Period Data The following example demonstrates billing displays for the three previous billing periods.
-
Page 39: Engineering Maximum Demand Data Display
Chapter 3 Using Front Display Data Displays Tariff 1 maximum demand reading of register 1 – imported kW. Tariff 2 maximum demand reading of register 1 – imported kW. … … Total cumulative maximum demand reading of register 1 – imported kW. Total cumulative maximum demand reading of register 1 –... - Page 40 Chapter 3 Using Front Display Data Displays kVA maximum demand kW export maximum demand kvar export (capacitive) maximum demand V1 maximum demand Indicate V12 voltage in line-to-line configurations. … … V3 maximum demand Indicate V31 voltage in line-to-line configurations I1 maximum demand …...
-
Page 41: Engineering Data Display
Chapter 3 Using Front Display Data Displays Engineering Data Display Engineering data represent general instrumentation data you can use while installation and inspecting the meter. Use phase angles displays to check the order of phases when connecting wires to the meter terminals. Phase-to-neutral voltages. -
Page 42: Setup Data Display
Chapter 3 Using Front Display Data Displays Phase current phase angles (relative to V1 voltage) Auxiliary current phase angle (relative to V1 voltage) Setup Data Display The setup data display shows basic device settings that can be required for immediate inspecting while meter testing and at the time of installation. -
Page 43: Device Diagnostics Display
Chapter 3 Using Front Display Data Displays Meter operation time counters (since start of operation): Start of operation date Total operation time in hours Out of service time in hours Power failure counters (since start of operation): Total number of power failures Total number of 3-phase voltage interruptions Internal meter temperature Lithium battery status and operation time:... - Page 44 Chapter 3 Using Front Display Data Displays Diagnostics for information on how to clear the device diagnostics from the display and via PAS. The diagnostic icon can be disabled or enabled via the Display Setup menu. EM720 Power Quality and Revenue Meter...
-
Page 45: Programming Mode
Chapter 3 Using Front Display Programming Mode Programming Mode To enter programming mode from the data display, press and hold the SELECT/ENTER button for more than 5 seconds. Navigation Buttons The following table gives a summary of the button operations in programming mode. Button Press Operations... -
Page 46: Setup Menus And Access Rights
Chapter 3 Using Front Display Programming Mode Enter the password as you enter numeric values. As you move to the next place, the digit entered is saved and then zeroed. If you missed a digit, you should re-type all preceding digits before you reach the missed place again. Once the password is set to the desired value, press and hold the SELECT/ENTER button for more than 1 second. - Page 47 Chapter 3 Using Front Display Programming Mode To select a desired menu entry from the menu list: 1. If the left window is not highlighted yet, highlight it by briefly pressing the SELECT/ENTER button. 2. Use the SCROLL button to scroll through the menu list until the desired menu entry appears.
-
Page 48: Chapter 4 Using Pas Software
Chapter 4 Using PAS Software Software Installation Chapter 4 Using PAS Software The support PAS software is a configuration and data acquisition tool that allows you to configure all of the EM720 features, monitor your meter on-line, retrieve recorded files and view reports. PAS can communicate with your meter via any communication interface installed in your meter, including the embedded infrared port, serial ports,... -
Page 49: Installing The Usb Driver
Chapter 4 Using PAS Software Software Installation Installing the USB Driver To take an advantage of the USB communications, install the EM720 USB driver on your PC. Connect the EM720 to your PC’s USB port using the supplied USB cable. When the EM720 is powered up, Windows automatically detects the meter and launches the hardware installation wizard. - Page 50 Chapter 4 Using PAS Software Software Installation 4. Point to the “USB” folder located in the PAS installation directory and click “OK” 5. Click “Next”. EM720 Power Quality and Revenue Meter...
-
Page 51: Creating A New Site For Your Meter
Chapter 4 Using PAS Software Creating a New Site for your Meter 6. Click "Finish" to complete installation. The next time you power up the EM720 or connect it to your PC with the USB cable, Windows automatically launches the driver for your meter. Creating a New Site for your Meter PAS keeps all communication and configuration data for your meter in a configuration database called a site... -
Page 52: Setting Up Communications
Chapter 4 Using PAS Software Setting up Communications 3. From the “Look in” box, select the directory where a new database will be stored. By default, it will be the “Sites” directory. Type a site name for your device in the “File name” box, click New, and then click OK. - Page 53 Chapter 4 Using PAS Software Setting up Communications 2. Specify the baud rate and data format for the port. Choose the same baud rate and data format as you have set in the meter, and then click OK. Selecting the Communications Protocol 1.
-
Page 54: Communicating Through The Internet
Chapter 4 Using PAS Software Setting up Communications message transfer time, and excessive increasing it may slow down communications. 6. In the “Retries” box, define the number of attempts that PAS should use to receive a response from the meter in the event the communication fails, before announcing a communication failure. - Page 55 Chapter 4 Using PAS Software Setting up Communications See your local GSM/GPRS modem manual and Windows help on how to create a new Dial-Up PPP connection for your GPRS modem. Configuring a Dial-up GPRS Connection To communicate through a GPRS modem: 1.
-
Page 56: Communicating Through A Usb
Chapter 4 Using PAS Software Setting up Communications access it from PAS; otherwise you must manually dial your connection. Manual Dialing your Connection To manually dial your GPRS connection: 1. Select your connection name from the Start menu - > Settings -> Network and Dial-Up Connections. 2. -
Page 57: Setting Up The Meter
Chapter 4 Using PAS Software Setting Up the Meter Setting Up the Meter PAS allows you to prepare setup data for your meter off- line without the need to have it connected to your PC. To prepare a setup for your meter: 1. -
Page 58: Downloading Setups To The Meter
Chapter 4 Using PAS Software Setting Up the Meter Downloading Setups to the Meter You can update each setup in your meter one at a time or download all setups together from the site database. Individual Download To update a particular setup in your meter: 1. -
Page 59: Authorization And Security
Chapter 4 Using PAS Software Authorization and Security Batch Upload To upload all setups from the device to the site database at once: 1. Check the On-line button on the toolbar. 2. Select the device site from the list box on the toolbar. -
Page 60: Chapter 5 Configuring The Em720
Chapter 5 Configuring the EM720 Configuring Communications Chapter 5 Configuring the EM720 This chapter describes how to configure the EM720 for your particular environment and application from the front display and via PAS. To access your meter configuration options via PAS, you should create a site database for your device as shown in Chapter 4. - Page 61 Chapter 5 Configuring the EM720 Configuring Communications The following table lists available port options. Display Parameter Options Default Description Label Protocol Communication Modbus RTU, IEC 62056-21 The communications protocol (COM1) protocol for the port Modbus ASCII, Modbus RTU DNP3, (COM 3) IEC 62056-21 Interface Port interface...
-
Page 62: Setting Up The Ethernet
Chapter 5 Configuring the EM720 Configuring Communications Setting Up the Ethernet Using the Front Display To enter the setup menu, select Net from the main menu. Viewing and Changing Setup Options in Chapter 3 for information on navigating in menus. See the table below for available network options. -
Page 63: Setting-Up Dial-Up Gprs Network
Chapter 5 Configuring the EM720 Configuring Communications Setting-Up Dial-Up GPRS Network To enter the setup dialog, select Communications Setup from the Meter Setup menu, and then click on the Dial-Up Networking Setup tab. The following table lists available connection options. Parameter Options Default... - Page 64 Chapter 5 Configuring the EM720 Configuring Communications Parameter Options Default Description Phone Number *99# The telephone number of the ISP provider. The default number provides a connection to the GPRS network for your EM720 GSM/GPRS modem. Login Name Login name for logging onto the Internet.
-
Page 65: Setting-Up Expertpower Client
The EM720 has an embedded eXpertPower client that provides communications with the eXpertPower server – the SATEC proprietary Internet services. Connections to the eXpertPower server are handled on a periodic basis. To enter the Setup dialog, select the site from the list box... - Page 66 Chapter 5 Configuring the EM720 Configuring Communications NOTES 1. Do not enable the eXpertPower client in your meter if you do not use the eXpertPower service. 2. Do not change the connection period setting. The eXpertPower server updates it automatically. EM720 Power Quality and Revenue Meter...
-
Page 67: General Meter Setup
Chapter 5 Configuring the EM720 General Meter Setup General Meter Setup Basic Meter Setup The Basic Setup provides the meter with basic information about your electrical network. Using the Front Display To enter the setup menu, select Basic from the main menu. - Page 68 Chapter 5 Configuring the EM720 General Meter Setup Display Label Parameter Options Default Description Basic Configuration Wiring Wiring Mode See Table 4LN3 The wiring connection of the below device PT Ratio PT Ratio 1.0-6500.0 The phase potential transformer’s primary to secondary ratio Nom.
- Page 69 Chapter 5 Configuring the EM720 General Meter Setup In 4LN3 and 3LN3 wiring modes, the voltage readings for volt demands represent line-to-neutral voltages; otherwise, they will be line-to-line voltages. The voltage waveforms and harmonics in 4LN3 and 3LN3 wiring modes represent line-to-neutral voltages;...
-
Page 70: Device Options And Mode Control
Chapter 5 Configuring the EM720 General Meter Setup Device Options and Mode Control Using the Front Display To enter the Options setup menu, select Options from the main menu. To enter the TEST mode setup, select Test from the main menu. - Page 71 Chapter 5 Configuring the EM720 General Meter Setup The following table lists available device options. Display Parameter Options Default Description Label Power/Energy Options Power Mode Power S=f(P, Q) (reactive S=f(P, Q) The method used for calculating Calculation power mode), reactive and apparent powers (see Mode “Power Calculation Modes”...
-
Page 72: Local Settings
Chapter 5 Configuring the EM720 General Meter Setup − Local Settings This setup allows you to specify your local time zone, daylight saving time options and time synchronization source. Using the Front Display To enter the setup menu, select Local from the main menu. - Page 73 Chapter 5 Configuring the EM720 General Meter Setup Display Label Parameter Options Default Description Country Country Default, or Default Defines calendar setting. The country default setting stands for the U.S.A. name Offset Time zone -720 to 720 Local offset in minutes from UTC offset, min (Universal Coordinated or Greenwich Mean Time).
- Page 74 Chapter 5 Configuring the EM720 General Meter Setup beginning of the minute. If the IRIG-B option is selected but the IRIG-B signal is not present on the device input, the EM720 automatically uses its internal RTC clock. Using the IRIG-B To use the IRIG-B input, select the GPS IRIG-B option and connect the GPS master clock to the IRIG-B BNC connector on the IRIG-B communication module.
-
Page 75: Display Setup
Chapter 5 Configuring the EM720 General Meter Setup Display Setup Using the Front Display To enter the setup menu, select Display from the main menu. See Viewing and Changing Setup Options Chapter 3 for information on navigating in menus. See the table below for available display options. Using PAS To configure your display, select the device site from the list box on the PAS toolbar, select General Setup from the... - Page 76 Chapter 5 Configuring the EM720 General Meter Setup Display Parameter Options Default Description Label Auto Scroll Auto-Scroll Disabled, Defines the display scroll Interval interval or disables auto- 2-10, 15, 20, 25, 30 scroll seconds Scroll Seq. Auto-Scroll 1-2, 1-3, 1-4, 1, 9 Selects the display Sequence...
-
Page 77: Configuring Digital Inputs
Chapter 5 Configuring the EM720 General Meter Setup Configuring Digital Inputs The EM720 has four embedded digital inputs ((DI1 to DI4) and supports up to two expansion 2DI/2DO modules with a total of 4 digital inputs (DI5 to DI8). I/O numbers are automatically assigned to the inputs in the order of connection. - Page 78 Chapter 5 Configuring the EM720 General Meter Setup Parameter Options Default Description Debounce time 1-1000 ms 10 ms The amount of time while the state of the digital input should not change to be recognized as a new state. Too low debounce time could produce multiple events on the input change.
-
Page 79: Configuring Relay Outputs
Chapter 5 Configuring the EM720 General Meter Setup Configuring Relay Outputs The EM720 supports up to two expansion 2DI/2DO modules with a total of 4 relays (RO1 to RO4). I/O numbers are automatically assigned to the relay outputs in the order of connection. To configure the relay outputs in your meter, select General Setup from the Meter Setup menu, and then click on the Relay Outputs tab. - Page 80 Chapter 5 Configuring the EM720 General Meter Setup Parameter Options Default Description Operation UNLATHCED UNLATCHED Unlatched mode: the relay goes to its active mode state when the control setpoint is in active LATCHED (operated) state, and returns to its non-active PULSE state when the setpoint is released.
-
Page 81: Using Counters
Chapter 5 Configuring the EM720 General Meter Setup Using Counters The EM720 provides 8 universal nine-digit counters that can count different events. Each counter can be independently linked to any digital input and count input pulses with a programmable scale factor. -
Page 82: Using Periodic Timers
Chapter 5 Configuring the EM720 General Meter Setup Using Periodic Timers The EM720 has 4 programmable interval timers that are normally used for periodic recording and triggering operations on a time basis through the Control Setpoints. Whenever a programmed timer interval is expired, the timer generates an internal event that can trigger any setpoint (see Using Control... -
Page 83: Using Control Setpoints
Chapter 5 Configuring the EM720 General Meter Setup Using Control Setpoints The EM720 has an embedded logical controller that runs different actions in response to user-defined internal and external events. Unlike a PLC, the EM720 uses a simplified programming technique based on setpoints that allows the user to define a logical expression based on measured analog and digital values that produces a required action. - Page 84 Chapter 5 Configuring the EM720 General Meter Setup Option Format/Range Description Relation <=, >=, =, ON, The relational operator used in the conditional expression for the trigger Operate limit The threshold (in primary units) at which the conditional expression would be evaluated to true. Not applicable for digital triggers.
- Page 85 Chapter 5 Configuring the EM720 General Meter Setup when the trigger condition is asserted, and with the AND operator, if the setpoint should not be operated while the critical trigger is not asserted. Using Numeric Triggers For numeric (analog) triggers, a setpoint allows you to specify thresholds each...
- Page 86 Chapter 5 Configuring the EM720 General Meter Setup Using Interval Timers The EM720 has 4 interval timers that are commonly used for periodic recording of interval data at the time of the fault or in the presence of other events detected by setpoints.
- Page 87 Chapter 5 Configuring the EM720 General Meter Setup Using Setpoint Events and Actions When a setpoint status changes, i.e., a setpoint event is either asserted or de-asserted, the following happens in your device: The new setpoint status is logged to the setpoint status register that can be monitored from the SCADA system or from a programmable controller in order to give an indication on the expected event.
-
Page 88: Configuring Billing/Tou
Chapter 5 Configuring the EM720 Configuring Billing/TOU Configuring Billing/TOU The EM720 provides 10 universal billing energy registers that can be linked to any internal energy source or to any external pulse source that delivers pulses through the device digital inputs. Any of energy registers can provide either a single-tariff energy accumulation or be individually linked to the TOU system providing both total and multi-tariff energy billing. -
Page 89: Configuring Billing/Tariff Registers
Chapter 5 Configuring the EM720 Configuring Billing/TOU Configuring Billing/Tariff Registers To configure the meter billing/TOU registers, select Energy/TOU from the Meter Setup menu. The available options are shown in the following table: Parameter Options Default Description Billing/TOU Registers Unchecked Unchecked Links multi-tariff registers to the selected energy source Checked... -
Page 90: Configuring The Daily Tariff Schedule
Chapter 5 Configuring the EM720 Configuring Billing/TOU Parameter Options Default Description Channel No, Ch1-Ch6 None Defines a measurement channel for multi- meter energy metering. Not used for a single self-metering channel if there are no external sources. Set to Ch1 for internal energy sources, and to Ch2 through Ch6 for external sources in the event of multi- channel energy metering. -
Page 91: Configuring The Season Tariff And Dst Schedule
Chapter 5 Configuring the EM720 Configuring Billing/TOU 2. Select the start time for each tariff change point and the corresponding active tariff number. Repeat the setup for all active profiles. The first tariff change point is fixed at 00:00 hours, and the last tariff change you specified will be in use until 00:00 hours on the next day. -
Page 92: Configuring Recorders
Chapter 5 Configuring the EM720 Configuring Recorders recognize your settings and to select a proper daily tariff schedule for any day within a year. The above picture gives you an example of a single- season tariff schedule configured for weekends and the designated U.S.A. -
Page 93: Configuring Meter Memory
Chapter 5 Configuring the EM720 Configuring Recorders The meter memory is fully configurable except of the files that keep monthly and daily billing profiles and energy load profile. They are pre-configured at the factory and may not be changed by the user. Two of the data log files are automatically configured in your meter for recording EN51060 compliance statistics data and harmonics survey data. - Page 94 Chapter 5 Configuring the EM720 Configuring Recorders Option Range Description Record size The size of the file record for a single channel or a single section. It is set automatically depending on the file and on the number of parameters in the data records Parameters 0-16 The number of parameters in a single data record...
- Page 95 Chapter 5 Configuring the EM720 Configuring Recorders The following table can help you calculate an estimated file size for conventional log files when planning your memory allocation. The actual file size will normally be a bit bigger. File Record Size, Bytes File Size, Bytes Event Log Record size ×...
-
Page 96: Configuring The Event Recorder
Chapter 5 Configuring the EM720 Configuring Recorders Configuring the Event Recorder To configure the Event log file: 1. Double click on the Event Log file partition with the left mouse button. 2. Select a desired file type for your file. 3. -
Page 97: Configuring The Data Recorder
Chapter 5 Configuring the EM720 Configuring Recorders Configuring the Data Recorder Conventional Data Log Files The Data recorder is programmable for recording up to 16 data parameters per record in each of the conventional data log files. The list of parameters to be recorded to a data log is configurable individually for each file. - Page 98 Chapter 5 Configuring the EM720 Configuring Recorders 2. Configure the list of parameters to be recorded in a log file. You are not allowed to select more parameters than you defined when configuring your file. Refer to Appendix A for a list of available parameters.
- Page 99 Chapter 5 Configuring the EM720 Configuring Recorders Data Log #1 Data Log #1 is configured for recording 1-second phase voltages, currents total harmonics, and total powers. The list of parameters is shown in the following table. Data Log #1 Parameter V1/V12 V2/V23 V3/V31...
- Page 100 Chapter 5 Configuring the EM720 Configuring Recorders Configuring the Fault Recorder in Chapter 5 on how to enable or disable RMS profiling and how to define the maximum duration of the fault RMS profiles. The factory pre-configured list of parameters for Data log #13 is shown in the following table.
- Page 101 Chapter 5 Configuring the EM720 Configuring Recorders Monthly and Daily Billing Data Logs Data log #15 is pre-configured for recording billing period data. It keeps billing energy, maximum demand and cumulative maximum demand for last 24 billing periods. The file is updated at an end of billing period, normally once a month.
-
Page 102: Configuring The Waveform Recorder
Chapter 5 Configuring the EM720 Configuring Recorders Configuring the Waveform Recorder The EM720 can store input waveforms in three log files. Waveform log #1 and Waveform log #2 are conventional files that can record waveforms at four programmable sampling rates: 32, 64, 128 or 256 samples per cycle. A conventional waveform log file can store up to 7 channels simultaneously: three voltage channels and four current channels. - Page 103 Chapter 5 Configuring the EM720 Configuring Recorders Number of Records = Number of Records per Series x Number of Series For example, if you want to record a 64-cycle waveform sampled at a rate of 32 samples per cycle, the number of records required for one waveform series would be: Number of Records per Series = (32 x 64)/512 = 4.
- Page 104 Chapter 5 Configuring the EM720 Configuring Recorders 2. Select the sampling rate for your waveform file. 3. Select the number of cycles to be recorded prior to an event, and a total number of cycles in the waveform series. 4. Add the name for your waveform log file in the “Name”...
-
Page 105: Configuring The Fault Recorder
Chapter 5 Configuring the EM720 Configuring Recorders Configuring the Fault Recorder The Fault recorder automatically records all fault events to the Fault log file. It can be triggered via the embedded fault detector, or externally through any of the 8 digital inputs. - Page 106 Chapter 5 Configuring the EM720 Configuring Recorders Option Range Default Description Thresholds Threshold, % 0-200.0% Defines the operating threshold for the fault trigger in percent of the nominal (reference) value Threshold, Shows the setup value in secondary units for secondary the selected operating threshold Hysteresis, % 0-50.0% Defines the hysteresis for fault trigger in...
- Page 107 Chapter 5 Configuring the EM720 Configuring Recorders The picture above shows the factory set Fault recorder options. Notice that the Overcurrent trigger can be used along with the second Undervoltage trigger combined by logical AND. If you wish to use the only Overcurrent trigger, disable (uncheck)
-
Page 108: Configuring The En50160 Recorders
Chapter 5 Configuring the EM720 Configuring the EN50160 Recorders To provide cross triggering, the triggering digital inputs of all devices should be tied together and connected to the normally opened relay contacts that indicate a fault. To avoid self-triggering through its own digital input for the device that indicates a fault, it is recommended to use a Form C relay and to connect the digital input through the normally closed contacts. -
Page 109: En50160 Evaluation Limits And Options
Chapter 5 Configuring the EM720 Configuring the EN50160 Recorders EN50160 Harmonics Survey Log Data log file #10 is automatically configured in the EM720 for recording harmonics survey statistics on a weekly or daily basis. You can see parameters recorded to the file in Appendix D. -
Page 110: En50160 Pq Recorder Setup
Chapter 5 Configuring the EM720 Configuring the EN50160 Recorders The Power Quality event log file is configured for 1000 event records. You can increase or change the size of the EN50160 data log files in your meter via the Log Memory Setup (see Configuring the Data Recorder). - Page 111 Chapter 5 Configuring the EM720 Configuring the EN50160 Recorders 4. Disabling recording events to the PQ log does not prevent the evaluation of the voltage characteristics and collecting the EN50160 statistics for these events. 5. Select the waveform logging options for PQ events. If you have the EM720T, then one-cycle duration transient waveforms are automatically recorded to Waveform log #3 at a rate of 1024-samples/cycle.
-
Page 112: En50160 Harmonics Limits Setup
Chapter 5 Configuring the EM720 Configuring the EN50160 Recorders asserted all the time while the fault condition exists. The “PQ EVENT” trigger is used to give a power quality fault indication via relay contacts, or can be combined using the AND operator with timer ticks for periodic data recording at the time of the fault to produce voltage trending charts. -
Page 113: En50160 Advanced Setup
Chapter 5 Configuring the EM720 Configuring the EN50160 Recorders EN50160 Advanced Setup The EN50160 Advanced Setup allows you to configure the EN50160 evaluation options in your meter. To configure the EN50160 evaluation options: 1. Select Memory/Log from the Meter Setup menu, and then click on the EN50160 Advanced Setup tab. -
Page 114: Clearing En50160 Evaluation Counters
Chapter 5 Configuring the EM720 Configuring the EN50160 Recorders Option Range Default Description Rapid Voltage Changes Repetition Rate 1-10 Defines the maximum repetition rate in variations per hour (equal or less than) for rapid voltage changes. Voltage changes at higher rates are not classified since they will be subject for flicker. -
Page 115: Configuring Communication Protocols
Chapter 5 Configuring the EM720 Configuring Communication Protocols Configuring Communication Protocols This section describes how to customize protocol options for use with your application software. Configuring Modbus Modbus Point Mapping The EM720 provides 120 user assignable registers in the address range of 0 to 119. You can re-map any register available in the device to any assignable register so that Modbus registers that reside at different locations may be simply accessed using a single request by re-mapping... -
Page 116: Configuring Dnp3
Chapter 5 Configuring the EM720 Configuring Communication Protocols Configuring DNP3 DNP Options can be changed both via DNP3 and Modbus. Refer to the EM720 DNP3 Reference guide for information on the protocol implementation and a list of the available data points. DNP Options From the Meter Setup menu select Protocol Setup and click on the DNP Options tab. - Page 117 Chapter 5 Configuring the EM720 Configuring Communication Protocols Parameter Options Default Description Analog Input Object 32-bit 16-bit -Flag The default AI object variation for requests with qualifier code 06 32-bit –Flag when no specific variation is 16-bit requested 16-bit –Flag Analog Input Change 32-bit -Time 16-bit +Time The default AI change event object...
- Page 118 Chapter 5 Configuring the EM720 Configuring Communication Protocols Scaling 16-bit AI objects Scaling 16-bit AI objects allows accommodating native 32- bit analog input readings to 16-bit object format; otherwise it may cause an over-range error if the full- range value exceeds a 16-bit point limit. Scaling is enabled by default.
- Page 119 Chapter 5 Configuring the EM720 Configuring Communication Protocols Configuring DNP Event Classes The EM720 generates object change events for any static analog input, binary input, and binary counter point when corresponding point either exceeds predefined threshold, or the point status changes. A total of 64 change event points are available for monitoring.
- Page 120 Chapter 5 Configuring the EM720 Configuring Communication Protocols The number of event setpoints for each static object type is specified via the DNP Options setup. NOTE The device clears all event buffers and links the default set of static points to each event object type every time you change the number of points for any of the objects.
- Page 121 Chapter 5 Configuring the EM720 Configuring Communication Protocols Hysteresis for the return threshold is 0.05 Hz for frequency and 2% of the operating threshold for all other points. 4. Check the “Ev On” box for the points you wish to be included into event poll reports.
-
Page 122: Configuring Meter Passwords
Chapter 5 Configuring the EM720 Configuring Meter Passwords Configuring Meter Passwords Using the Front Display To enter the passwords setup menu, select Access from the main menu. You should have administration rights to enter this menu. Viewing and Changing Setup Options in Chapter 3 for information on navigating in menus. - Page 123 Chapter 5 Configuring the EM720 Configuring Meter Passwords The present passwords settings are never uploaded from the meter via the Passwords setup. When you open the dialog, all passwords are zeroed. To setup new passwords: 6. Enter the first (lower-level) password in the “Password 1”...
- Page 124 Chapter 5 Configuring the EM720 Configuring Meter Passwords 3. Click Send to update the password in the meter. EM720 Power Quality and Revenue Meter...
-
Page 125: Chapter 6 Device Control And Upgrading
Chapter 6 Device Control and Upgrading Updating the Meter Clock Chapter 6 Device Control and Upgrading This chapter describes how to perform control functions in your meter from the front panel display and via PAS. To access device control options from PAS, you should have your meter online and provide a correct password with respective permissions. -
Page 126: Clearing Device Diagnostics
Chapter 6 Device Control and Upgrading Clearing Device Diagnostics 8. To synchronize the meter clock with the PC clock, click Set. You need not update the clock in your meter if the clock is synchronized to the external GPS master clock. Clearing Device Diagnostics Using the Front Display See the following section... -
Page 127: Resetting Accumulators And Log Files
Chapter 6 Device Control and Upgrading Resetting Accumulators and Log Files Resetting Accumulators and Log Files Using the Front Display From the front panel display, you can only reset the device diagnostics, billing maximum demands, engineering maximum demands, meter operation time counters and fault counters. - Page 128 Chapter 6 Device Control and Upgrading Resetting Accumulators and Log Files Using PAS To open the Reset dialog, select a device site from the list box on the toolbar, check the On-line button, and then select Reset from the Monitor menu. Refer to the table above for required permissions.
-
Page 129: Remote Relay Control
Chapter 6 Device Control and Upgrading Remote Relay Control 2. Check the corresponding boxes, and then click OK. 3. Confirm your command to send it to the meter. Remote Relay Control From PAS, you can send a command to any relay in your meter or to release a latched relay, except of the relays that are linked to the internal pulse sources. -
Page 130: Operating Event Flags
Chapter 6 Device Control and Upgrading Operating Event Flags 2. Click on Send. The dialog shows you the present relay status and whether it is latched by a remote command or locally from the setpoint. Operating Event Flags The EM720 has 8 common event flags that are intended for use as temporary event storage and can be tested and operated from the control setpoints. -
Page 131: Upgrading Meter Firmware
Chapter 6 Device Control and Upgrading Upgrading Meter Firmware Upgrading Meter Firmware upgrade device firmware through communication port installed in your meter: a serial port, USB, wireless GSM/GPRS modem, or via the Internet. Downloading firmware is only supported through the Modbus RTU/ASCII and Modbus/TCP protocols. - Page 132 Chapter 6 Device Control and Upgrading Upgrading Meter Firmware 5. Wait about 10 seconds until the meter completes burning firmware into the flash and reboots before any further manipulating with the meter. NOTES 1. When the meter reboots, the Ethernet and GPRS networks are both restart, so communications may be temporarily lost.
-
Page 133: Chapter 7 Monitoring Meters
Chapter 7 Monitoring Meters Viewing Real-time Data Chapter 7 Monitoring Meters Viewing Real-time Data Real-time data is continuously retrieved from your devices and updated on the screen at the rate you defined in the Instrument Setup. To get real-time data from your device, select the device site from the list box on the PAS toolbar, point to RT Data Monitor on the Monitor menu, and then select a data set you want to view. - Page 134 Chapter 7 Monitoring Meters Viewing Real-time Data Continuous Poll button on the local toolbar. Click on the Stop button to stop continuous polling, You can open as many data monitor windows as you wish, either for different sites, or for the same site using different data sets.
- Page 135 Chapter 7 Monitoring Meters Viewing Real-time Data If you check “Do not stop on errors”, polling is resumed automatically when communication error occurs, otherwise polling stops until you restart it manually. Viewing a Data Table Changing the Data View PAS displays data in either a single record or multi-record view.
- Page 136 Chapter 7 Monitoring Meters Viewing Real-time Data Selecting Channels To select data channels for your trend, click on the trend window with the right mouse button, select “Channels”, check the channels you want displayed, and then click OK. Customizing Line Colors and Styles Trend lines for different channels can be shown in different colors using different line styles.
- Page 137 Chapter 7 Monitoring Meters Viewing Real-time Data mouse, or use the right and left arrow keys on your keyboard to change the marker position. Click on the trend pane with the mouse before using the keyboard, to allow the keyboard to get your input. Delta Measurements To measure the distance between two trend points, click on the Delta button...
-
Page 138: Viewing Real-Time Min/Max Log
Chapter 7 Monitoring Meters Viewing Real-time Min/Max Log Run an application to where you want to copy data, position cursor at the correct place, and then click on the Paste button on the application's toolbar, or select Paste from the Edit menu. If you want only a part of data to be copied, select with the mouse while holding the left mouse button the rows or columns in the table you want to copy, and then click on... -
Page 139: Viewing Real-Time Waveforms
Chapter 7 Monitoring Meters Viewing Real-time Waveforms You can save retrieved data to a file or print it in the same manner as described in the previous section. Viewing Real-time Waveforms To retrieve real-time waveforms from your meter, check the On-line button on the PAS toolbar, select the device site from the list box on the toolbar, and then select RT Waveform Monitor from the Monitor menu. -
Page 140: Chapter 8 Retrieving Recorded Data
Chapter 8 Retrieving Recorded Data Uploading Files on Demand Chapter 8 Retrieving Recorded Data Using PAS, you can retrieve recorded events, data and waveforms from your devices and save them to files on your PC in the MS Access database format. Historical data can be uploaded on demand any time you need it, or periodically through the Upload Scheduler that retrieves data automatically on a predefined schedule, for... -
Page 141: Using The Upload Scheduler
Chapter 8 Retrieving Recorded Data Using the Upload Scheduler 6. If you wish to retrieve data starting with a known date, check the “From” box and select the start date for retrieving data. 7. If you wish to retrieve data recorded before a known date, check the “To”... - Page 142 Chapter 8 Retrieving Recorded Data Using the Upload Scheduler 5. Select a daily, weekly or monthly schedule, and adjust the start time. If you wish to upload data periodically in predefined intervals, click on “Periodic” and define the time period in hours and minutes.
-
Page 143: Retrieving En50160 Statistics Files
Chapter 8 Retrieving Recorded Data Retrieving EN50160 Statistics Files Running the Scheduler on Demand You can run the scheduler at any time outside the schedule by checking the Start Now box at right. This is a one-time action. After uploading is completed, the Upload Scheduler un-checks this box automatically. - Page 144 Chapter 8 Retrieving Recorded Data Viewing Historical Data On-line to appear in the log. PAS allows you to retrieve historical data from a particular log without storing it to a file. The data appears only in the window on your screen. You can save it manually to the database.
-
Page 145: Chapter 9 Viewing Log Files And Reports
Chapter 9 Viewing Log Files and Reports General Operations Chapter 9 Viewing Log Files and Reports General Operations Opening a Log File To open a log file, click on the Open button on the PAS toolbar, or select “Open...” from the File menu. In the “Files of type”... - Page 146 Chapter 9 Viewing Log Files and Reports General Operations want to check how your document appears on the printed page, select Print Preview from the File menu. Customizing Views Date Order To change the way PAS displays the date, select Options from the Tools menu, click on the Preferences tab, select the preferred date order, and then click OK.
-
Page 147: Viewing The Event Log
Chapter 9 Viewing Log Files and Reports Viewing the Event Log Viewing the Event Log Event log files are displayed in a tabular view, one event per row. PAS loads the entire database table to a window, so that you can scroll through the entire log to view its contents. - Page 148 Chapter 9 Viewing Log Files and Reports Viewing the Event Log Linking to Waveforms and Data Records If you programmed a setpoint to log setpoint operations to the Event log and the setpoint can trigger the Waveform or Data recorder, PAS automatically establishes links between the event and other database records where it finds a relationship with the event.
-
Page 149: Viewing The Power Quality Event Log
Chapter 9 Viewing Log Files and Reports Viewing the Power Quality Event Log Viewing the Power Quality Event Log IEEE 1159 and EN 50160 PQ log files are displayed in a tabular view, one event per row. The IEEE 1159 PQ log normally contains both power quality and fault events. -
Page 150: Viewing The Iti (Cbema) Curve
Chapter 9 Viewing Log Files and Reports Viewing the Power Quality Event Log Linking to Waveforms and Data Records PQ events for which PAS finds related links are blue colored. Click on the colored event ID to check a list of the event links. - Page 151 Chapter 9 Viewing Log Files and Reports Viewing the Power Quality Event Log curve chart, click on the “ITI” button on the window toolbar. To view the event details, click on the event point with the left mouse button. To directly move to the related power quality report entry or to a waveform record, click on the corresponding list item with the left mouse button.
-
Page 152: Viewing En50160 Statistics Reports
Chapter 9 Viewing Log Files and Reports Viewing EN50160 Statistics Reports Viewing EN50160 Statistics Reports Viewing the EN50160 Compliance Report To get the EN50160 Compliance report, select “EN50160 Compliance Statistics” from the Reports menu, point to the database where you stored the retrieved statistics data, uncheck the voltage characteristics’... - Page 153 Chapter 9 Viewing Log Files and Reports Viewing EN50160 Statistics Reports Selecting the Time Range To change the time range or contents of the report, click on the report with the right mouse button, select “Options…”, select the required time range, check the voltage characteristics to be included in the report, and then click OK.
- Page 154 Chapter 9 Viewing Log Files and Reports Viewing EN50160 Statistics Reports Customizing Reports If you wish to add a logo image, header and footer to your reports: 1. Select “Report Setup…” from the Reports menu, or click on the report window with the right mouse button, and then select “Report Setup…”.
-
Page 155: Viewing The En50160 Online Statistics Report
Chapter 9 Viewing Log Files and Reports Viewing EN50160 Statistics Reports Viewing the EN50160 Online Statistics Report If you retrieved the EN50160 online statistics data, you can view the online report on the last retrieved statistics in the same manner as the EN50160 Compliance statistics report. -
Page 156: Viewing The Fault Log
Chapter 9 Viewing Log Files and Reports Viewing the Fault Log Viewing the Fault Log Fault log files are displayed in a tabular view. PAS loads the entire database table to a window, so that you can scroll through the entire log to view its contents. Filtering and Sorting Events To filter events, click on the Filter button , or click on... - Page 157 Chapter 9 Viewing Log Files and Reports Viewing the Fault Log To change the sorting order, click on the Sort button or click on the report window with the right mouse button and select “Sort...”, check a desired sort order, and then click OK.
-
Page 158: Viewing The Data Log
Chapter 9 Viewing Log Files and Reports Viewing the Data Log Viewing the Data Log Data log files can be displayed in a tabular view, one data record per row, or in a graphical view as a data trend graph. Viewing Data Trend To view data in a graphical form, click on the Data Trend button on the local toolbar. - Page 159 Chapter 9 Viewing Log Files and Reports Viewing the Data Log button, select “Options...”, click on the “Display” tab, adjust colors and styles for channels, and then click OK. You can also change the colors for the background and gridlines. Using the Marker Lines The trend window has two blue dashed marker lines.
- Page 160 Chapter 9 Viewing Log Files and Reports Viewing the Data Log Delta Measurements To measure the distance between two trend points, click on the Delta button , then click on the first point, and then click on the second point. The first reference point is still frozen until you close and reopen Delta, while the second point can be placed anywhere within the trend line.
-
Page 161: Viewing Waveforms
Chapter 9 Viewing Log Files and Reports Viewing Waveforms Viewing Waveforms Waveform data can be displayed in five different views. When you open a new file, PAS shows you a waveform graph showing non-overlapped waveforms. Each waveform window has a local toolbar from where you can open another window to examine the waveform in a different view. -
Page 162: Viewing An Rms Plot
Chapter 9 Viewing Log Files and Reports Viewing Waveforms Waveform data is recorded in series that may contain many cycles of the sampled waveform. A waveform window displays up to 128 waveform cycles. If the waveform contains more cycles, the scroll bar appears under the waveform pane allowing you to scroll through the entire waveform. -
Page 163: Viewing A Frequency Plot
Chapter 9 Viewing Log Files and Reports Viewing Waveforms Viewing a Frequency Plot To view a cycle-by-cycle frequency plot of the sampled voltage waveforms, click on the button. Viewing a Spectrum Chart Click on the button to view a spectrum chart for the selected waveform channel. - Page 164 Chapter 9 Viewing Log Files and Reports Viewing Waveforms The order of the highest displayed harmonic component is equal to the half sampling rate at which the waveforms are sampled minus one. If the waveform was sampled at a rate of 128 samples per cycle, 63 harmonics are available. With 32 samples per cycle, only 15 harmonics are calculated, while others will be zeros.
-
Page 165: Viewing A Spectrum Table
Chapter 9 Viewing Log Files and Reports Viewing Waveforms Viewing a Spectrum Table Click on the button on the local toolbar to display the harmonics spectrum in a tabular view for a selected phase or for all phases together. The spectrum table shows voltage, current, active power and reactive power harmonic components both in percent of the fundamental and in natural units, and harmonic phase angles. -
Page 166: Waveform Options
Chapter 9 Viewing Log Files and Reports Viewing Waveforms To change a phase, click on the window with the right mouse button, select “Options...”, check the phase you want displayed, and then click OK. Waveform Options Scrolling through Waveforms The status bar at the bottom of the window shows you how many records the log file contains. - Page 167 Chapter 9 Viewing Log Files and Reports Viewing Waveforms To select the channels you want to view on the screen, click on the waveform window with the right mouse button, select “Channels...”, check the channels you want displayed, and then click OK. Checkboxes for channels that are not present in the waveform are dimmed.
- Page 168 Chapter 9 Viewing Log Files and Reports Viewing Waveforms Viewing Phasor Diagrams The phasor diagrams show you the relative magnitudes and angles of the three-phase voltage and current fundamental component. All angles are shown relative to the reference voltage channel. To change the reference channel, click on the waveform window with the right mouse button, select “Options...”, EM720 Power Quality and Revenue Meter...
- Page 169 Chapter 9 Viewing Log Files and Reports Viewing Waveforms click on the “Phasor” tab, check the channel you want to make a reference channel, and then click “OK”. If you leave the Triangle box checked, PAS connects the ends of the voltage and current vectors showing you three-phase voltage and current triangles.
-
Page 170: Viewing Synchronized Waveforms
Chapter 9 Viewing Log Files and Reports Viewing Synchronized Waveforms average and peak values. The minimum distance between the two markers is exactly one cycle. To change the marker position, click on the button, or click on the waveform window with the right mouse button and select Set Marker, and then click on the point where you want to put the marker. - Page 171 Chapter 9 Viewing Log Files and Reports Viewing Synchronized Waveforms waveforms that have the same time span as your selected waveform. 3. Check the sites your want to see displayed. 4. Click on the “Channels” button and select channels for each site. 5.
-
Page 172: Chapter 10 Comtrade And Pqdif Converters
Chapter 10 COMTRADE and PQDIF Converters Manual Converting Chapter 10 COMTRADE and PQDIF Converters The COMTRADE and PQDIF file converters allow you to convert waveforms into COMTRADE or PQDIF file format, and data log tables – into PQDIF format. Manual Converting To manually convert your waveforms or a data log into COMTRADE or PQDIF format: 1. -
Page 173: Automatic Converting
Chapter 10 COMTRADE and PQDIF Converters Automatic Converting not want your files to be compressed, uncheck the Compress box before saving the file. In COMTRADE format, each waveform event is recorded into a separate file. A COMTRADE waveform file name contains a site name followed by an ID of the fault or power quality event, which triggered the waveform record. - Page 174 Chapter 10 COMTRADE and PQDIF Converters Automatic Converting 6. Repeat the same for all tables you wish to be converted. 7. Click OK. EM720 Power Quality and Revenue Meter...
-
Page 175: Appendix A Parameters For Monitoring And Logging
Appendix A Parameters for Monitoring and Logging Appendix A Parameters for Monitoring and Logging following table lists electricity status parameters available for monitoring via communication ports, for data logging, and for triggering setpoints. Designation Description NONE None (stub, read as zero) SETPOINTS Setpoint Status SP1:16... - Page 176 Appendix A Parameters for Monitoring and Logging Designation Description MINUTE INTERVAL Minute interval: 1-5, 10, 15, 20, 30, 60 min SYMM COMP Symmetrical Components V PSEQ Positive-sequence voltage V NSEQ Negative-sequence voltage V ZSEQ Zero-sequence voltage V NSEQ UNB% Negative-sequence voltage unbalance V ZSEQ UNB% Zero-sequence voltage unbalance I PSEQ...
- Page 177 Appendix A Parameters for Monitoring and Logging Designation Description I1 KF I1 K-Factor I2 KF I2 K-Factor I3 KF I3 K-Factor I1 TDD I1 current TDD I2 TDD I2 current TDD I3 TDD I3 current TDD V12 voltage V23 voltage V31 voltage V1x phase-to-ground voltage V2x phase-to-ground voltage...
- Page 178 Appendix A Parameters for Monitoring and Logging Designation Description FREQ Frequency V UNB% Voltage unbalance I UNB% Current unbalance NiMH battery voltage V4 neutral/zero-sequence voltage (V1+V2+V3)/3 V4x neutral-to-ground voltage AVR PHASE 1-Second Phase Values V1 voltage V2 voltage V3 voltage I1 current I2 current I3 current...
- Page 179 Appendix A Parameters for Monitoring and Logging Designation Description I HIGH High current kW HIGH High kW kvar HIGH High kvar kVA HIGH High kVA PF LAG LOW High PF Lag PF LEAD LOW High PF Lead THD LOW High voltage THD V THD LOW High current THD KF LOW...
- Page 180 Appendix A Parameters for Monitoring and Logging Designation Description V4 neutral/zero sequence voltage V12 voltage V23 voltage V31 voltage I1 current I2 current I3 current I4 current In current V ZERO-SEQ Zero-sequence voltage I ZERO-SEQ Zero-sequence current V UNB% Voltage unbalance I UNB% Current unbalance RMS (10 min)
- Page 181 Appendix A Parameters for Monitoring and Logging Designation Description V2 THD V2/V23 THD V3 THD V3/V31 THD I1 THD I1 THD I2 THD I2 THD I3 THD I3 THD I4 THD I4 THD V1 THD/I V1/V12 interharmonics THD V2 THD/I V2/V23 interharmonics THD V3 THD/I V3/V31 interharmonics THD...
- Page 182 Appendix A Parameters for Monitoring and Logging Designation Description I1 Ang I1 current angle I2 Ang I2 current angle I3 Ang I3 current angle I4 Ang I4 current angle DEMANDS Present Demands V1 DMD V1/V12 Volt demand V2 DMD V2/V23 Volt demand V3 DMD V3/V31 Volt demand I1 DMD...
- Page 183 Appendix A Parameters for Monitoring and Logging Designation Description SUMM SW DMD Billing Summary (Total) Sliding Window Demands REG1 SD Register #1 sliding demand REG2 SD Register #2 sliding demand … … REG10 SD Register #10 sliding demand ENERGY Instrumentation Total Energy kWh IMPORT kWh import kWh EXPORT...
- Page 184 Appendix A Parameters for Monitoring and Logging Designation Description I3 %HD50 H50 Harmonic distortion ANG V1 V1/V12 Harmonic Angles V1 H01 ANG H01 Harmonic angle V1 H02 ANG H02 Harmonic angle … V1 H50 ANG H50 Harmonic angle ANG V2 V2/V23 Harmonic Angles V2 H01 ANG H01 Harmonic angle...
- Page 185 Appendix A Parameters for Monitoring and Logging Designation Description HRM TOT POW Fundamental Total Power Values kW H01 Total fundamental kW kvar H01 Total fundamental kvar kVA H01 Total fundamental kVA PF H01 Total fundamental PF FLICKER Flicker V1 Pst V1 short-term (10 min) flicker severity V2 Pst V2 short-term (10 min) flicker severity...
- Page 186 Appendix A Parameters for Monitoring and Logging Designation Description In MIN In current FREQ MIN Frequency V UNB% MIN Voltage unbalance I UNB% MIN Current unbalance MAX PHASE Maximum 1-Cycle Phase Values V1 MAX V1 voltage V2 MAX V2 voltage V3 MAX V3 voltage I1 MAX...
- Page 187 Appendix A Parameters for Monitoring and Logging Designation Description I1 DMD MAX I1 maximum ampere demand I2 DMD MAX I2 maximum ampere demand I3 DMD MAX I3 maximum ampere demand kW IMP SD MAX Maximum kW import sliding demand kvar IMP SD MAX Maximum kvar import sliding demand kVA IMP SD MAX Maximum kVA sliding demand...
- Page 188 Appendix A Parameters for Monitoring and Logging Designation Description REG2 TRF2 Tariff #2 register … … REG2 TRF8 Tariff #8 register TOU REG3 Billing TOU Energy Register #3 REG3 TRF1 Tariff #1 register REG3 TRF2 Tariff #2 register … … REG3 TRF8 Tariff #8 register TOU REG4...
- Page 189 Appendix A Parameters for Monitoring and Logging Designation Description … … REG2 TRF8 MD Tariff #8 maximum demand REG2 TRF1 CMD Tariff #1 cumulative maximum demand REG2 TRF2 CMD Tariff #2 cumulative maximum demand … … REG2 TRF8 CMD Tariff #8 cumulative maximum demand TOU MAX DMD REG3 Billing TOU Maximum Demand Register #3 REG3 TRF1 MD...
- Page 190 Appendix A Parameters for Monitoring and Logging Designation Description REG8 TRF8 MD Tariff #8 maximum demand REG8 TRF1 CMD Tariff #1 cumulative maximum demand REG8 TRF2 CMD Tariff #2 cumulative maximum demand … … REG8 TRF8 CMD Tariff #8 cumulative maximum demand TOU MAX DMD REG9 Billing TOU Maximum Demand Register #9 REG9 TRF1 MD...
- Page 191 Appendix A Parameters for Monitoring and Logging Short Data Name Long Data Name Description TRF1 MD SEASON TRF1 Generic billing tariff register maximum demand EM720 Power Quality and Revenue Meter...
-
Page 192: Appendix B Setpoint Parameters
Appendix B Setpoint Parameters Appendix B Setpoint Parameters Setpoint Triggers For setpoint triggers, see Appendix A Parameters for Monitoring and Logging. Setpoint Actions The available setpoint actions are listed in the following table. Setpoint Actions Action Target Description NONE No action SET EVENT FLAG Set user event flag 1-8 CLEAR EVENT FLAG... -
Page 193: Appendix C Billing And Load Profile Log Files
Appendix C Billing and Load Profile Log Files Appendix C Billing and Load Profile Log Files The following tables show the record structure for the monthly and daily billing data profile and energy load profile log files. The second column shows data abbreviations used in the PAS data log reports. - Page 194 Appendix C Billing and Load Profile Log Files Field No. Designation Description Monthly Maximum Demand Register #1 REG1 MD Summary (total) max. demand TIME0 Summary (total) max. demand timestamp REG1 CMD Summary (total) cumulative max. demand TRF1 MD Tariff #1 max. demand TIME1 Tariff #1 max.
- Page 195 Appendix C Billing and Load Profile Log Files Field No. Designation Description TIME8 Tariff #8 max. demand timestamp TRF8 CMD Tariff #8 cumulative max. demand The number of parameters in each section is automatically configured depending on the number of actual tariffs you defined in the TOU Daily Profiles Daily Billing Profile Data Log (Data Log #16) Field No.
- Page 196 Appendix C Billing and Load Profile Log Files EM720 Power Quality and Revenue Meter...
-
Page 197: Appendix D En50160 Statistics Log Files
Appendix D EN50160 Statistics Log Files Appendix D EN50160 Statistics Log Files following tables list EN50160 evaluation parameters recorded by the device to the EN50160 statistics data log files. The second column shows data abbreviations used in the PAS data log reports. Data log file sections are highlighted in bold. - Page 198 Appendix D EN50160 Statistics Log Files Field No. Designation Description V2 Plt Max Maximum Plt on phase V2 V3 N1 Number of incidents Plt > 1% on phase V3 V3 Plt Max Maximum Plt on phase V3 Voltage Dips (indicative statistics) N11 90%/100ms Number of polyphase incidents u<90%/t<100ms N12 85%/100ms...
- Page 199 Appendix D EN50160 Statistics Log Files Field No. Designation Description N25 200%/60s Number of polyphase incidents u>200%/t<60s N31 110%/>60s Number of polyphase incidents u>110%/t>60s N32 120%/>60s Number of polyphase incidents u>120%/t>60s N33 140%/>60s Number of polyphase incidents u>140%/t>60s N34 160%/>60s Number of polyphase incidents u>160%/t>60s N35 200%/>60s Number of polyphase incidents u>200%/t>60s...
- Page 200 Appendix D EN50160 Statistics Log Files Field No. Designation Description V2 N2 Number of voltage THD incidents on phase V2 V2 HD% Max Worst-case harmonic magnitude on phase V2, %Un V2 H# Worst-case harmonic component number on phase V2 V2 THD Max Worst-case voltage THD on phase V2 V3 N1 Number of harmonic voltage incidents on phase V3...
- Page 201 Appendix D EN50160 Statistics Log Files EN50160 Harmonics Survey Log (Data Log #10) Field No. Designation Description V1 Harmonic Voltage THD MAX Maximum THD THDO MAX Maximum odd harmonics THD THDE MAX Maximum even harmonics THD %HD02 MAX Maximum H02 harmonic voltage magnitude, %Un %HD03 MAX Maximum H03 harmonic voltage magnitude, %Un …...
-
Page 202: Appendix E En50160 Evaluation And Recording
Appendix E EN50160 Evaluation and Recording Appendix E EN50160 Evaluation and Recording EN50160 Background The EN50160 European standard “Voltage characteristics of electricity supplied by public distribution systems” issued CENELEC defines main physical characteristics of electric energy supplied by low and medium voltage public distribution systems under normal operating conditions. - Page 203 Appendix E EN50160 Evaluation and Recording Indicatives Values For the remaining characteristics of the voltage, by their unpredictable nature, the standard gives only indicative values, which intended provide users with information on the order of magnitude which can be expected. The following table gives the characteristics for which indicative values have been specified by the standard.
-
Page 204: Evaluation Techniques
Appendix E EN50160 Evaluation and Recording Evaluation Techniques EN50160 Evaluation Counters Evaluation Counters and Evaluation Period The EM720 uses a set of the evaluation counters for collecting EN50160 statistics within a specified evaluation period. The evaluation period is the period of time within which the meter collects statistical evaluation data. - Page 205 Appendix E EN50160 Evaluation and Recording Frequency Variations Method of Evaluation The basic frequency measurement is the mean value of the frequency over fixed time intervals of 10 seconds under normal operating conditions. A frequency variation is not evaluated if the supply voltage crosses a voltage tolerance limit (±15% Un).
- Page 206 Appendix E EN50160 Evaluation and Recording selected from three 1-second consecutive intervals and compares it with the target compliance limit. A rapid voltage change is not classified if it crosses a voltage tolerance limit (±10% Un), as it would be considered a voltage dip or a temporary overvoltage.
- Page 207 Appendix E EN50160 Evaluation and Recording Voltage Dips A voltage dip is a sudden reduction of the RMS voltage below 90% of the nominal value, followed by a return to a value higher than 90% of the nominal in a time varying from 10 ms to 60 s.
- Page 208 Appendix E EN50160 Evaluation and Recording Statistical Survey The EM720 provides the statistical evaluation of voltage interruptions using the classification recommended by Eurelectric’s Measurement guide voltage characteristics. Interruptions are classified by duration as shown in Appendix D. Indicative Values Under normal operating conditions the expected number of short voltage interruptions in a year may be from up to a few tens to up to several hundreds.
- Page 209 Appendix E EN50160 Evaluation and Recording Transient Overvoltages Transient overvoltages correspond to disturbances of very short duration, lasting typically less than one half-cycle, i.e. a few microseconds to several milliseconds. Method of Evaluation Transient overvoltages are detected as impulsive or low frequency oscillatory transients with a rise time less than 0.5 ms and duration from 20 us with the Fast Transient coprocessor option or from 75 us without it and to ½...
- Page 210 Appendix E EN50160 Evaluation and Recording Harmonic Voltage Method of Evaluation The basic measurements are the individual harmonic voltage distortion factors (HD) and the total harmonic distortion factor (THD) over a period of 10 minutes under normal operating conditions. Harmonic voltages are evaluated by instrumentation complying with IEC 61000-4-7.
- Page 211 Appendix E EN50160 Evaluation and Recording selected in the meter in the range of 25 to 50 via the EN50160 Advanced setup. Interharmonic voltages are not evaluated if the supply voltage crosses a voltage tolerance limit (±15% Un). Target Values EN50160 does provide...
- Page 212 Appendix E EN50160 Evaluation and Recording Target Values The voltage levels given by the EN50160 in Figure 1 of Clause 2.13 are taken from the so-called “Meister-curve” which defines the maximum permissible ripple control voltages in LV networks. Compliance with the EN50160 requires that the 3-second mean of signal voltages shall be less or equal to the specified limits for 99% of a day.
-
Page 213: Appendix F Data Scales
Appendix F Data Scales Appendix F Data Scales The maximum values for volts, amps and powers in the EM720 setup and in communications are limited by the voltage and current scale settings. See Device Options and Mode Control in Chapter 5 on how to change the voltage and current scales in your meter. -
Page 214: Appendix G Device Diagnostic Codes
Appendix G Device Diagnostic Codes Appendix G Device Diagnostic Codes Diagnosti Display Message Description Reason c Code RAM/Data fault RAM/Data error Hardware failure Watchdog reset Hardware watchdog reset Hardware failure Sampling fault DSP/Sampling fault Hardware failure CPU exception CPU exception Hardware failure Run-time error Run-time error... -
Page 215: Appendix H Obis Identification Codes
Appendix H OBIS Identification Codes Appendix H OBIS Identification Codes The OBIS (Object Identification System IEC 62056-61) codes are used to identify energy and maximum demand readings in the IEC 62056-21 protocol Data Readout (see the EM720 IEC 62056-21 Reference Guide) and in the billing data displays on the EM720 front display. - Page 216 Appendix H OBIS Identification Codes OBIS Code Unit Description 9.6.1- 9.6.8 kVA/MVA kVA maximum demand, tariff 1-8 1.2.0 kW/MW kW import cumulative maximum demand, total 1.2.1- 1.2.8 kW/MW kW import cumulative maximum demand, tariff 1-8 2.2.0 kW/MW kW export cumulative maximum demand, total 2.2.1- 2.2.8 kW/MW kW export cumulative maximum demand, tariff 1-8...
Need help?
Do you have a question about the Expertmeter EM720 and is the answer not in the manual?
Questions and answers