
Related Manuals for Satec PM172P


Summary of Contents for Satec PM172P
- Page 1 Powermeters Series PM172 PM172P/PM172E/PM172EH Installation and Operation Manual BG0399 Rev. A9...
-
Page 2: Limited Warranty
LIMITED WARRANTY The manufacturer offers the customer a 24-month functional warranty on the instrument for faulty workmanship or parts from date of dispatch from the distributor. In all cases, this warranty is valid for 36 months from the date of production. This warranty is on a return to factory basis. -
Page 3: Table Of Contents
Table of Contents Chapter 1 General Information............6 Chapter 2 Installation..............10 Mechanical Installation ................... 10 Panel Mounting ......................10 DIN Rail Mounting ....................13 Remote Display Installation................14 Mechanical Installation .....................14 Electrical Connection ....................16 Electrical Installation..................17 Typical Installation ....................17 Terminals ........................18 Power Source Connection ..................18 Chassis Ground Connection..................19 Wiring Diagrams ......................19... - Page 4 Device Options......................43 Transformer Correction.....................44 Communication Ports ....................45 Network Address......................46 Counters Setup ......................47 Relay Output Setup ....................47 Control Setpoints Setup ....................48 Analog Inputs Setup....................49 Analog Outputs Setup....................50 Analog Expander Setup ....................51 Timers Setup ......................52 Display Setup......................52 Meter Security......................53 Setting the Device Clock ...................54 Resetting Accumulators and Maximum Demands............
- Page 5 Updating the Clock ....................102 Resetting Accumulators and Clearing Log Files............102 Administration ....................103 Changing a Password ..................... 103 Upgrading Device Firmware ................. 103 Monitoring Devices..................106 Viewing Real-time Data ..................106 Viewing Min/Max Log ..................... 106 Viewing Real-time Waveforms................. 106 Viewing Harmonic Spectrum and Synthesized Waveforms.........
-
Page 6: Chapter 1 General Information
LAN and the Internet. The PM172 Series product line includes three models of devices: • PM172P – basic model – offers all standard metering and control capabilities of the PM172 Series • PM172E – adds to above an energy meter, an event recorder and a multi-channel data recorder. - Page 7 Chapter 1 General Information tariff changes per day, easy programmable tariff schedule • Automatic daily profile for energy and maximum demand readings (total and tariff registers) • Embedded programmable controller; 16 control setpoints; programmable thresholds and delays; relay output control; 1-cycle response time •...
- Page 8 Chapter 1 General Information COM2: RS-422/RS-485 • Modbus RTU, Modbus/TCP, DNP3, DNP3/TCP, GE EGD producer, Profibus DP and proprietary ASCII communication protocols • Easy field upgrading device firmware through any communication port Measured Parameters Parameter Display Comm. Analog Pulse Alarm 1-cycle Real-time Measurements RMS Voltage per phase RMS Current per phase...
- Page 9 Chapter 1 General Information Parameter Display Comm. Analog Pulse Alarm Total kVAh E, EH Energy per Phase kWh Import per phase kvarh Import per phase kVAh per phase E, EH TOU Registers 8 TOU energy registers (kWh and kvarh import & export, kVAh, 2 pulse sources) 8 TOU maximum demand registers 8 tariffs, 4 seasons x 4 types of day Harmonic Measurements...
-
Page 10: Chapter 2 Installation
Chapter 2 Installation Mechanical Installation Chapter 2 Installation Mechanical Installation Panel Mounting Figure 2-1 Dimensions Figure 2-2 STEP 1 (ANSI 4" round cutout): Mount the display module in cutout Series PM172 Powermeters... - Page 11 Chapter 2 Installation Mechanical Installation Figure 2-3 STEP 1 (DIN 92x92mm square cutout): Mount the display module in cutout Figure 2-4 STEP 2: Assemble the four locating studs Series PM172 Powermeters...
- Page 12 Chapter 2 Installation Mechanical Installation Figure 2-5 STEP 3: Slide and position the meter on locating studs Figure 2-6 STEP 4: Affix the meter using the thumb nuts Series PM172 Powermeters...
-
Page 13: Din Rail Mounting
Chapter 2 Installation Mechanical Installation DIN Rail Mounting The PM172 can be mounted on a 35-mm DIN rail. The display module is mounted separately on the switchboard panel and is connected to the meter by a communication cable (see “Remote Display Installation”). FRONT VIEW SIDE VIEW BG0386-1... -
Page 14: Remote Display Installation
Chapter 2 Installation Remote Display Installation Remote Display Installation Mechanical Installation Standard Cutouts (ANSI 4" round or DIN 92x92 mm square) Figure 2-9 Display cutout dimensions STEP 1: Insert the display module into cutout. STEP 2: Fasten washers and nut on screws. Figure 2-10 ANSI 4"... -
Page 15: Electrical Connection
Chapter 2 Installation Remote Display Installation Figure 2-11 Panel cutout dimensions Figure 2-12 Display mounting Electrical Connection The remote display is connected to the meter via a 3-wire or 5-wire communication cable provided with two 15-pin D-type connectors. At distances of up to 3 m, the display can receive power through the communication cable directly from the meter. - Page 16 Chapter 2 Installation Remote Display Installation Figure 2-13 Self-powered remote display connection Figure 2-14 Remote display powered from a 12V DC power source If required, the remote display may be connected to one of the regular meter ports COM1 or COM2 via a three-wire RS-485 communication cable using a separate 12V DC power source as shown in Figure 2-14.
-
Page 17: Electrical Installation
Chapter 2 Installation Electrical Installation Electrical Installation Before installation ensure that all incoming power sources are shut OFF. Failure to observe this practice can result in serious or even fatal injury and damage to equipment. Typical Installation DIGITAL INPUTS ANALOG INPUTS RELAYS ANALOG OUTPUTS COM.1... -
Page 18: Terminals
Chapter 2 Installation Electrical Installation Terminals Analog Inputs/Outputs Relay Outputs AC Current Inputs Digital Inputs 18 19 21 22 DIGITAL INPUTS ANALOG INPUTS RELAYS ANALOG OUTPUTS 690V OPT.U POWER SUPPLY CALIBRATED AT : 90-264VAC 50/60Hz 25 Hz 50 Hz STANDARD 85-290VDC 60 Hz 400 Hz... -
Page 19: Chassis Ground Connection
Chapter 2 Installation Electrical Installation Chassis Ground Connection Connect the chassis ground of the device to the switchgear earth ground using a dedicated wire greater than 2 mm /14 AWG. Wiring Diagrams For AC input ratings, see “Technical Specifications” in Appendix A. The following wiring configurations are available in the meter: Wiring Configuration Setup Code... - Page 20 Chapter 2 Installation Electrical Installation Figure 2-18 4-Wire Wye 3-Element Direct Connection Using 3 CTs. Wiring Mode = 4LL3 or 4Ln3 Figure 2-19 4-Wire Wye 3-Element Connection Using 3 PTs, 3 CTs. Wiring Mode = 4LL3 or 4Ln3 Series PM172 Powermeters...
- Page 21 Chapter 2 Installation Electrical Installation Figure 2-20 3-Wire 2-Element Open Delta Connection Using 2 PTs, 2 CTs. Wiring Mode = 3OP2 Figure 2-21 4-Wire Wye 2½-Element Connection Using 2 PTs, 3 CTs. Wiring Mode = 3LL3 or 3Ln3 This configuration provides accurate power measurements only if the voltages are balanced. Series PM172 Powermeters...
- Page 22 Chapter 2 Installation Electrical Installation Figure 2-22 3-Wire Open 2½-Element Delta Connection Using 2 PTs, 3 CTs. Wiring Mode = 3OP3 Figure 2-23 4-Wire 3-Element Delta Direct Connection Using 3 CTs. Wiring Mode = 4LL3 or 4Ln3 Series PM172 Powermeters...
- Page 23 Chapter 2 Installation Electrical Installation Figure 2-24 3-Wire 2½-Element Broken Delta Connection Using 2 PTs, 3 CTs. Wiring Mode = 3bLn3 or 3bLL3 Series PM172 Powermeters...
-
Page 24: I/O Connections
Chapter 2 Installation I/O Connections I/O Connections For I/O ratings, see “Technical Specifications” in Appendix A. Relay Outputs LOAD LOAD 10A FUSE LINE 18 19 21 22 DIGITAL INPUTS ANALOG INPUTS RELAYS ANALOG OUTPUTS 690V OPT.U POWER SUPPLY CALIBRATED AT : 90-264VAC 50/60Hz 25 Hz... -
Page 25: Analog Outputs
Chapter 2 Installation I/O Connections Analog Outputs LOAD SHIELD PROTECTIVE GROUND 18 19 21 22 DIGITAL INPUTS ANALOG INPUTS RELAYS ANALOG OUTPUTS 690V OPT.U POWER SUPPLY CALIBRATED AT : 90-264VAC 50/60Hz 25 Hz 50 Hz STANDARD 60 Hz 400 Hz 85-290VDC ANALOG IN/OUT : Figure 2-27 Analog Output Connection... -
Page 26: Communications Connections
Chapter 2 Installation Communications Connections Communications Connections Several communication options are available for the PM172: COM1 (check the label on the back of your meter): RS-232/RS-422/RS-485 56K Dial-up modem Ethernet 10/100BaseT Profibus DP COM2: RS-422/RS-485 The RS-232/RS-422/RS-485 port is a standard port for COM1. Other options are ordered separately. -
Page 27: Com1 Rs-422/485 Connection
POWER SUPPLY COM.1 COM.2 RS-422/RS-485 13 14 Connector 9-pin D-type female: Signal RS-422/485 +RxD RS-422/485 +TxD RS-422/485 –TxD RS-422/485 –RxD RS-422 (MALE) TO SATEC CONVERTER PM172 COM1 RS-422 CABLE Figure 2-30 COM1: Connection to the RS-422/485-RS-232 Converter Series PM172 Powermeters... -
Page 28: Com1 Dial Up Modem Connection
Chapter 2 Installation Communications Connections COM1 Dial Up Modem Connection AC0140 05-12001-3 Figure 2-31 COM1: Telephone Line Connection Connector 9-pin D-type female: Signal Ring COM1 Ethernet Connection AC0139 RJ45 05-12001-4 Figure 2-32 COM1: Ethernet Connection Series PM172 Powermeters... -
Page 29: Com1 Profibus Connection
Chapter 2 Installation Communications Connections Connector 9-pin D-type female: Signal –Tx –Rx COM1 Profibus Connection ANALOG IN/OUT : (12) 10-16VDC - +1mA (24) 18-36VDC LOW DC 0-20mA (48) 36-72VDC 0-1mA COM.1 : 4-20mA RS-232/422/485 STANDARD ATTENTION ETHERNET Static-Sensitive Devices MODEM Handle Only at N/- 10 PROFIBUS... -
Page 30: Com2 Rs-422/485 Connection
Chapter 2 Installation Communications Connections COM2 RS-422/485 Connection ANALOG IN/OUT : (12) 10-16VDC - +1mA LOW DC (24) 18-36VDC 0-20mA (48) 36-72VDC 0-1mA COM.1 : 4-20mA RS-232/422/485 STANDARD ATTENTION ETHERNET Static-Sensitive Devices MODEM Handle Only at N/- 10 PROFIBUS Static-Safe Workstations POWER SUPPLY COM.1... - Page 31 Chapter 2 Installation Communications Connections ANALOG IN/OUT : (12) 10-16VDC - +1mA (24) 18-36VDC LOW DC 0-20mA (48) 36-72VDC 0-1mA COM.1 : 4-20mA RS-232/422/485 STANDARD ATTENTION ETHERNET Static-Sensitive Devices MODEM Handle Only at N/- 10 PROFIBUS Static-Safe Workstations POWER SUPPLY COM.1 COM.2 RS-422/RS-485...
-
Page 32: Chapter 3 Display Operations
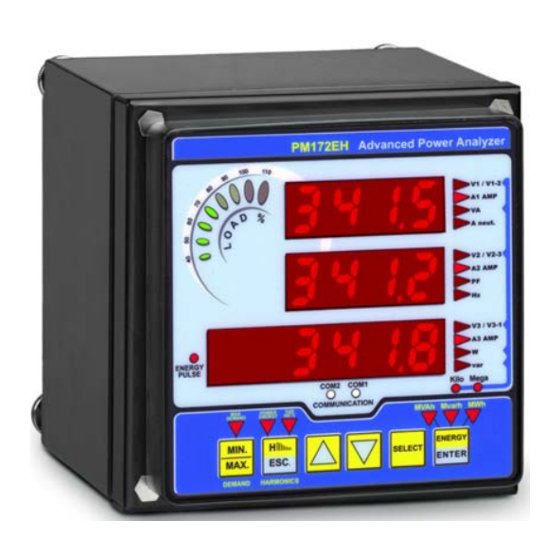
Chapter 3 Display Operations Indicators and Controls Chapter 3 Display Operations Displayed Parameters Load Bar Graph Wh/varh Pulse LED Measurement Units Navigation Buttons Port Activity LEDs Indicators and Controls Display Diagnostics diSP The display may indicate a connection error as shown on the left picture if it fails to establish a connection with the meter. -
Page 33: Load Bar Graph
Chapter 3 Display Operations Data Display numeric LED display shows up to three parameters at a time. Small rectangular or triangular LEDs at right and below the display indicate the displayed parameters and their measurement units. The display layout may change depending on the meter type and mode of operation. -
Page 34: Navigation Buttons
When briefly pressed again, it switches back to the common measurements display. The THD/TDD button in the PM172P and PM172E switches to the Total Harmonics display. The similar H/ESC button in the PM172EH switches between different harmonic displays: Total Harmonics, Individual Harmonics, Harmonic Powers, and Harmonic Energies. -
Page 35: Simple Reset Of Accumulated Data
The ENERGY button switches to the Energy display in the PM172E and PM172EH. In the PM172P, the button is not operational. If TOU registers are configured in the meter, you can repeatedly press this button to scroll through all available TOU registers. When briefly pressed once again, it... -
Page 36: Min/Max And Max. Demands Display
Chapter 3 Display Operations Data Display Common Measurements (Main Display) kVA/MVA Phase L1 powers Ph.L1 (if enabled) kvar/Mvar Ph.L2 Phase L2 powers (if enabled) kW/MW kVA/MVA Phase L2 powers Ph.L2 (if enabled) kvar/Mvar Ph.L3 Phase L3 powers (if enabled) kW/MW kVA/MVA Phase L3 powers Ph.L3... -
Page 37: Harmonics Display
Chapter 3 Display Operations Data Display Min/Max and Maximum Demands V1/V12 Maximum volt demands V2/V23 V3/V31 Maximum ampere demands kVA/MVA Maximum VA demand PF at maximum VA demand kW/MW Maximum W demand Harmonics Display Press the THD/TDD, or H/ESC in the PM172EH, button. The THD/TDD LED is illuminated. -
Page 38: Energy Display
Chapter 3 Display Operations Data Display Harmonic Energies Ac.En. Harmonic Wh import Ac.En. Harmonic Wh export AP.En. Harmonic VAh MVAh Energy Display Press the ENERGY button. The MVAh, Mvarh, or MWh LED is illuminated. If TOU registers are configured in the meter, press the button again to scroll through all active TOU registers. -
Page 39: Status Display
Chapter 3 Display Operations Status Display ENERGY TOU Energy Register 1 ENTER rEG.1 Tariff 1 reading trF.1 rEG.1 Tariff 1 reading trF.2 rEG.1 Tariff 8 reading trF.8 … ENERGY TOU Energy Register 8 ENTER rEG.8 Tariff 1 reading trF.1 rEG.8 Tariff 1 reading trF.2 rEG.8... -
Page 40: Using The Menus
Chapter 3 Display Operations Using the Menus Status Display Cnt.1 Counter #1 Cnt.2 Counter #2 Cnt.3 Counter #3 Cnt.4 Counter #4 batt Backup battery status (Normal/Low) nor/Lo Using the Menus Navigation Buttons ENERGY THD/TDD SELECT ENTER The PM172 has a menu-driven setup. To enter the menus, press and release the SELECT button. -
Page 41: Entering The Password
Chapter 3 Display Operations Using the Menus Press the SELECT button to activate the OPS window. Press the ENTER button to enter the main menu. To change the meter setup, or to clear the accumulated values: Press the SELECT button to activate the CHG window. Press the ENTER button to enter the main menu. -
Page 42: Menu Operations
Chapter 3 Display Operations Menu Operations Highlight the middle window by pressing the SELECT button. bASc bASc ConF 4Ln3 Scroll through the parameter list with the UP and DOWN buttons until the desired parameter name appears. To change the selected parameter: Press the SELECT button to highlight the lower item. -
Page 43: Device Options
Chapter 3 Display Operations Menu Operations Label Parameter Options Default Description ConF Wiring connection See “Basic 4Ln3 The wiring connection of the (configuration) mode Meter device Setup” in Chapter 4 PT ratio 1.0-6500.0 The phase potential transformer’s primary to secondary ratio Pt.F PT Ratio multiplier ×1, ×10... -
Page 44: Transformer Correction
Do not enable the analog expander output if you do not have the analog expander connected to the meter, otherwise it will disturb the computer communications. Transformer Correction This menu is available in the PM172P/E with firmware V13.1.19 and later, or V13.71.12 and later. Transformer correction allows you to compensate ratio and phase angle t.Cor... -
Page 45: Communication Ports
The following tables list available port options. COM1 Settings Label Parameter Options Default Description Prot Communications ASCII = SATEC ASCII Modbus The communications protocol rtu = Modbus RTU protocol supported by dnP3 = DNP3 the port dtE = DTE PrFb = Profibus DP... -
Page 46: Network Address
Selecting the Modbus protocol for the port disables the DNP3/TCP server. COM2 Settings Label Parameter Options Default Description Prot Communications ASCII = SATEC ASCII Modbus The communications protocol rtu = Modbus RTU protocol supported by dnP3 = DNP3 the port dtE = DTE... -
Page 47: Counters Setup
Chapter 3 Display Operations Menu Operations Press ENTER to confirm your new setting, or press ESC to discard changes. To exit the menu, press ESC. Counters Setup The PM172 has four six-digit counters that can count pulses delivered through the device digital inputs with a programmable scale factor, or events that trigger setpoint operations. -
Page 48: Control Setpoints Setup
Chapter 3 Display Operations Menu Operations Use the UP and DOWN arrow buttons to select the desired value. Press ENTER to confirm the new parameter setting, or rEL.1 press ESC to discard changes. tYPE You are returned to the middle window to select and configure another parameter, or confirm the settings and PulS exit the menu. -
Page 49: Analog Inputs Setup
Chapter 3 Display Operations Menu Operations Use the UP and DOWN arrow buttons to scroll to the desired setpoint. SP.1 To select a setpoint parameter: trG.1 Press the SELECT button to activate the middle window. rtHi.C1 Use the UP and DOWN arrow buttons to scroll to the desired parameter. -
Page 50: Analog Outputs Setup
Chapter 3 Display Operations Menu Operations To change the analog input options: A.In.1 Use the UP and DOWN arrow buttons to scroll to the desired parameter. Press the SELECT button to activate the lower window. Use the UP and DOWN arrow buttons to adjust the parameter A.In.1 value. -
Page 51: Analog Expander Setup
Chapter 3 Display Operations Menu Operations Label Parameter Options Description See Appendix B OutP Output Selects the measured parameter to parameter be transmitted through the analog output channel. Zero scale Low engineering scale (in primary units) for the analog output corresponding to a lowest (zero) output current (0 or 4 mA) Full scale... -
Page 52: Timers Setup
Chapter 3 Display Operations Menu Operations You are returned to the upper window to select another analog output or exit the menu. To exit the menu, press ESC. The following table lists available analog output options. Label Parameter Options Description See Appendix B OutP Output... -
Page 53: Meter Security
Chapter 3 Display Operations Menu Operations The following table lists available options. Label Parameter Options Default Description UPdt Display update rate 0.1-10.0 sec 1 sec Defines the interval between display updates ScrL Auto scroll interval None, None Defines the scroll interval for the main data display or 2-15 sec disables auto scroll... -
Page 54: Setting The Device Clock
Chapter 3 Display Operations Menu Operations Select “CtrL” in the upper window using the UP and CtrL DOWN arrow buttons. Press the SELECT button to activate the middle window. Use the UP and DOWN arrow buttons to select the desired option. “On” enables password protection, “OFF’ disables password protection. -
Page 55: Resetting Accumulators And Maximum Demands
Chapter 3 Display Operations Menu Operations Label Option Format/Range Description Daylight saving diS = disabled When DST is disabled, the RTC operates time option En = enabled in standard time only. When enabled, the device automatically updates the time at 2:00 AM at the pre-defined DST switch dates. -
Page 56: Chapter 4 Pas Application Software
New, and then click OK. On the Instrument Setup tab, select “PM172-N” for the PM172P and PM172E, or select “PM172EH-N” for the PM172EH, in the “Model” box. PAS automatically selects the appropriate instrument options for your meter. -
Page 57: Communicating Through A Serial Port
Chapter 4 PAS Application Software Setting up Communications be equipped with an RS-232/RS-422/RS-485 serial interface, with a dial-up modem for communicating through public telephone lines, with an Ethernet module for communicating through the Internet, or with a Profibus port. PAS does not support communications through Profibus. -
Page 58: Communicating Through A Dial-Up Modem
Chapter 4 PAS Application Software Setting up Communications In the “Protocol” box, select the same communications protocol as you have in your meter. The default protocol setting in your meter for all ports excluding the Profibus port is Modbus RTU. For more information on configuring the protocol parameters, refer to the “PAS Getting Started”... -
Page 59: Setting Up The Meter
Chapter 4 PAS Application Software Setting Up the Meter select the protocol. Select “Modbus RTU” for Modbus/TCP or “DNP3” for DNP3/TCP. In the “Wait for answer” box, adjust the time that PAS will wait for a connection before announcing an error and the number of retries PAS will use to receive a response from the device if communications fail. -
Page 60: Configuring Communications In Your Meter
Chapter 4 PAS Application Software Configuring Communications in your Meter Enter the password and click OK. If your authorization was successful, you are not prompted for the password again until you close the dialog window. Configuring Communications in your Meter This section describes how to configure communication ports in your meter through PAS. -
Page 61: Setting Up The Ethernet
Chapter 4 PAS Application Software Configuring Communications in your Meter will be temporarily lost. You may need to wait some additional time until PAS restores a connection with your device. Setting Up the Ethernet To enter the Setup dialog, select the device site from the list box on the PAS toolbar, select Communications Setup from the Meter Setup menu, and then click on the Network Setup tab. -
Page 62: Configuring Ge Egd Production Exchanges
Chapter 4 PAS Application Software Configuring Communications in your Meter additional time until PAS restores a connection with your device. Configuring GE EGD Production Exchanges The PM172 provides a GE EGD (Ethernet Global Data) data producer that supports four data exchanges. Each data exchange is individually configurable and can produce and send data to the same or to different consuming nodes. - Page 63 Chapter 4 PAS Application Software Configuring Communications in your Meter PM172 GE EGD Communications Protocol Reference Guide. Select a desired data type for the point range. Data transferred through the exchange can be represented in word (16-bit) or double word (32-bit) integer format, or in IEEE single precision floating-point format.
-
Page 64: General Meter Setup
Chapter 4 PAS Application Software General Meter Setup General Meter Setup This section describes how to configure the PM172 for your particular environment and application using PAS. Basic Meter Setup Before operating your meter, provide the device with basic information about your electrical network. -
Page 65: Device Options
Chapter 4 PAS Application Software General Meter Setup Parameter Options Default Description Demand Setup Power block 1, 2, 3, 5, 10, 15, 15 min The length of the demand period for 20, 30, 60 min, power demand calculations. If the demand period E=external sync external synchronization is selected, a... - Page 66 Specifies the low current measurement limit in percent of the full scale current (1A, 5A). Available in the PM172P/E, V13.1.19 and later. Do not enable the analog expander output if you do not have the analog expander connected to the meter, otherwise it will disturb the computer communications.
-
Page 67: Transformer Correction
− Transformer Correction This setup is available in the PM172P/E with firmware V13.1.19 and later, or V13.71.12 and later. Transformer correction allows you to compensate ratio and phase angle inaccuracies of the user voltage and current instrument transformers. -
Page 68: Local Settings
Chapter 4 PAS Application Software General Meter Setup Parameter Options Default Description -600 to 600 Phase Angle Error, The phase displacement, in minutes (-2700 to 2700 with minutes, between the primary V13.7X.XX) and secondary values. The phase angle of a transformer is positive when the secondary value leads the primary value. -
Page 69: Using Digital Inputs
Chapter 4 PAS Application Software General Meter Setup Parameter Options Default Description DST end month Month-week- First The date when Daylight Saving Time weekday Sunday in ends. The DST switch point is DST end week November specified by the month, week of the Week = 1 DST end weekday month and weekday. -
Page 70: Using Relay Outputs
Chapter 4 PAS Application Software General Meter Setup The debounce time is used the same for both digital inputs. If you change the debounce time for one digital input, the same debounce time is automatically assigned to the other. Using Relay Outputs The PM172 is equipped with two relays. - Page 71 Chapter 4 PAS Application Software General Meter Setup The available relay options are shown in the following table: Parameter Options Default Description Operation UNLATHCED UNLATCHED Unlatched mode: the relay goes into its mode LATCHED active state when the control setpoint is PULSE in active (operated) state, and returns into its non-active state when the...
-
Page 72: Programming Analog Inputs
Chapter 4 PAS Application Software General Meter Setup Programming Analog Inputs The PM172 can be provided with two optional analog inputs with options for 0-1mA, ±1mA, 0-20mA or 4-20mA input currents, depending on the order. Inputs with 0-1mA and ±1mA options can accept ×200% overload currents, i.e., can actually accommodate currents in the range of 0-2 mA and ±2mA. -
Page 73: Programming Analog Outputs
Chapter 4 PAS Application Software General Meter Setup Scaling Non-directional Analog Inputs For non-directional analog inputs with the 0-1mA, 0-20mA and 4-20mA current options, provide both zero and full engineering scales. Each of the scales operates independently. Scaling ±1mA Analog Inputs For directional ±1mA analog inputs, you should provide only the engineering scale for the +1 mA input current. - Page 74 Chapter 4 PAS Application Software General Meter Setup When you select an output parameter for the analog output channel, the default engineering scales are set automatically. They represent the maximum available scales. If the parameter actually covers a lower range, you can change the scales to provide a better resolution on the analog outputs.
-
Page 75: Programming The Analog Expander
Chapter 4 PAS Application Software General Meter Setup Scaling Analog Outputs for 0-2 mA and ±2 mA The output scales for 0-1 mA and ±1 mA analog outputs are programmed for 0 mA and +1 mA regardless of the desired output current range. To use the entire output range of 2 mA or ±2 mA, set the analog output scales in your device as follows: 0-2 mA: set the 1 mA scale to 1/2 of the required full scale output for uni-... -
Page 76: Using Counters
Chapter 4 PAS Application Software General Meter Setup Option Range Description See Appendix B Output Selects the measured parameter to be transmitted parameter through the analog output channel. Zero scale Defines the low engineering scale (in primary units) for the analog output corresponding to a lowest (zero) output current (0 or 4 mA) Full scale Defines the high engineering scale (in primary units) -
Page 77: Using Periodic Timers
Chapter 4 PAS Application Software General Meter Setup Option Range Default Description Multiplier 1-9999 The value added to the counter when a pulse is detected on the pulse source input Counter Value Displays the present counter contents You can preset a counter to a desired value or clear it through this dialog without affecting the counter setup. - Page 78 Chapter 4 PAS Application Software General Meter Setup The meter provides 16 control setpoints with programmable operate and release delays. Each setpoint evaluates a logical expression with up to four arguments using OR/AND logic. Whenever an expression is evaluated as “true”, the setpoint performs up to four concurrent actions that can send a command to the output relays, increment or decrement a counter, or trigger a recorder.
- Page 79 Chapter 4 PAS Application Software General Meter Setup Setpoint #1 is factory preset to provide standard periodic data logs on a 15- minute time basis. It is linked to the device clock and runs data logs #1 and #2 at 15-minute boundaries of an hour. Using Logical Expressions Logical operators OR/AND are treated in a simplified manner.
- Page 80 Chapter 4 PAS Application Software General Meter Setup programmed to generate periodic events at user-defined intervals (see “Using Periodic Timers”). Interval timers are not synchronized with the clock. When you run a timer, it generates a pulsed event that can trigger a setpoint if you have put the timer into a list of the setpoint triggers.
- Page 81 Chapter 4 PAS Application Software General Meter Setup controller in order to give an indication on the expected event. The operated setpoint status is latched to the setpoint alarm latch register accessible through communications. The register holds the last setpoint alarm status until it is explicitly cleared through communications.
-
Page 82: Configuring Summary Energy And Tou Registers
Chapter 4 PAS Application Software Configuring Summary Energy and TOU Registers Configuring Summary Energy and TOU Registers The PM172E and PM172EH provide 8 total (summary) energy and 8 concurrent tariff energy and maximum demand registers that can be linked to any internal energy source or to any external pulse source that delivers pulses through the device digital inputs. -
Page 83: Configuring The Daily Tariff Schedule
Chapter 4 PAS Application Software Configuring Summary Energy and TOU Registers The available options are shown in the following table: Parameter Options Default Description Summary/TOU Registers Unchecked Unchecked Links tariff registers to the selected energy source Checked Use Profl Unchecked Unchecked Enables automatic daily profiling for energy usage registers (both total and... -
Page 84: Configuring The Season Tariff Schedule
Chapter 4 PAS Application Software Configuring Summary Energy and TOU Registers Configuring the Season Tariff Schedule To configure your season tariff schedule, select Energy/TOU from the Meter Setup menu, and then click on the TOU Calendar tab. The meter’s TOU calendar allows you to configure any tariff schedule based on any possible utility regulation. - Page 85 Chapter 4 PAS Application Software Configuring Summary Energy and TOU Registers are no limitations on how to define your schedule. The meter is able to automatically recognize your settings and to select a proper daily tariff schedule for any day within a year. The above picture gives you an example of a single-season tariff schedule configured for weekends and the designated U.S.A.
-
Page 86: Configuring Recorders
Chapter 4 PAS Application Software Configuring Recorders Configuring Recorders The PM172E and PM72EH are provided with a 1-Megabyte onboard non- volatile memory for data, event and waveform recording. Before using recorders, the device memory should be partitioned between log files. The device memory is fully configurable. You can define how much memory to allocate for each log file. -
Page 87: Configuring The Event Recorder
Chapter 4 PAS Application Software Configuring Recorders performs de-fragmentation of the memory each time you re-organize your files. This helps keep all free memory in one continuous block and thus prevents possible leakage of memory caused by fragmentation. To change the file properties or to allocate the memory for a new file, double click on the file partition you want to change, select desired parameters for your log, and then click OK. -
Page 88: Configuring The Data Recorder
Chapter 4 PAS Application Software Configuring Recorders Click OK, and then send your new setup to the meter or save to the device database. By default, the Event Recorder stores all events related to configuration changes, reset, and device diagnostics. In addition, it records events related to setpoint operations. - Page 89 Chapter 4 PAS Application Software Configuring Recorders automatically update the “Parameter” box with the following parameter in the group. Add the name for your data log file in the “Name” box. It will appear in the data log reports. Save your new setup to the device database, and send it to the meter.
-
Page 90: Configuring The Waveform Recorder
Chapter 4 PAS Application Software Configuring Recorders maximum demands along with energy registers, then the number of sections in the file will be twice the number of the allocated TOU registers. To configure a TOU daily profile log file: Configure your TOU registers and TOU schedule in the meter before allocating memory for the profile log file (see “Configuring Summary and TOU Registers”). - Page 91 Chapter 4 PAS Application Software Configuring Recorders Number of Records per Series = Sampling Rate (Samples per Cycle) x Number of Cycles per Event / 512 The total number of records you must allocate to store the required number of events (series) is defined as follows: Number of Records = Number of Records per Series x Number of Series For example, if you want to record a 64-cycle waveform sampled at a rate of 32 samples per cycle, the number of...
- Page 92 Chapter 4 PAS Application Software Configuring Recorders The following table lists available waveform options. Option Format/Range Description 32, for Waveform Log #1 Samples per Cycle Fixed for the file 128, for Waveform Log #2 16-2560 (32 samples/cycle), Cycles per Series Defines the total duration of the 4-640 (128 samples/cycle) waveform per event/series...
-
Page 93: Configuring Communication Protocols
Chapter 4 PAS Application Software Configuring Communication Protocols Configuring Communication Protocols This section describes how to customize protocol options for use with your application software. Configuring Modbus Modbus Point Mapping The PM172 provides 120 user assignable registers in the address range of 0 to 119. -
Page 94: Configuring Dnp3
Chapter 4 PAS Application Software Configuring Communication Protocols Configuring DNP3 DNP Options can be changed both via DNP3 and Modbus. Refer to the PM172 DNP3 Reference guide for information on the protocol implementation and a list of the available data points. DNP Options To view or change the factory-set DNP options, select Protocol Setup from the Meter Setup menu and click on the DNP Options tab. - Page 95 Chapter 4 PAS Application Software Configuring Communication Protocols Parameter Options Default Description Analog Input 32-bit -Time 16-bit +Time The default AI change event object Change Event 32-bit +Time variation for requests with qualifier code Object 16-bit -Time 06 when no specific variation is 16-bit +Time requested Binary Counters (BC)
- Page 96 Chapter 4 PAS Application Software Configuring Communication Protocols If the scaling unit is greater than 1, the counter value is reported being divided by the selected scaling unit from 10 to 1000. To get the actual value, multiply the counter reading by the scaling unit. Configuring DNP Class 0 The most common method of getting static object information from the meter via DNP is to issue a read Class 0 request.
- Page 97 Chapter 4 PAS Application Software Configuring Communication Protocols points, enable re-mapping event point indices via DNP Options setup (see above) so they would start with index 0. You should define a separate event setpoint for each static object point you wish to be monitored for change events.
- Page 98 Chapter 4 PAS Application Software Configuring Communication Protocols A hysteresis for the return threshold is 0.05 Hz for frequency and 2% of the operating threshold for all other points. Check the “Ev On” box for the points you wish to be included into event poll reports.
-
Page 99: Remote Device Control
Chapter 4 PAS Application Software Remote Device Control Remote Device Control This section describes online operations on the meter you can perform through PAS. To access device control options you should have your device online. Remote Relay Control PAS allows you to send a command to any relay in your device or release a latched relay, except of the relays that are linked to an internal pulse source. -
Page 100: Device Diagnostics
Chapter 4 PAS Application Software Remote Device Control Click on Send. Device Diagnostics Device diagnostic messages may appear as a result of the PM172 built-in diagnostic tests performed during a start-up and device operation. To enter the Device Diagnostics dialog, check the On-line button on the PAS toolbar, select Device Control from the Monitor menu, and then click on the Device Diagnostics tab. -
Page 101: Updating The Clock
Chapter 4 PAS Application Software Remote Device Control Refer to PM172 communication guides for the diagnostic register address and layout. See Device Diagnostic Codes in Appendix F for the list of diagnostic codes and their meanings. Frequent hardware failures may be the result of excessive electrical noise in the region of the device. -
Page 102: Administration
Chapter 4 PAS Application Software Administration To reset the desired accumulation registers or to clear a file: Click on the corresponding button, and then confirm your command. If a target has more than one component, you are allowed to select components to reset. - Page 103 Chapter 4 PAS Application Software Upgrading Device Firmware Upgrading firmware is only supported through the Modbus RTU and Modbus/TCP protocols, so your serial port or modem port should be put into Modbus RTU mode. If you are upgrading firmware through the Ethernet port and your device has a firmware build lower than 7, the device Ethernet port should also be configured to operate through the Modbus/TCP port 502.
- Page 104 Chapter 4 PAS Application Software Upgrading Device Firmware Wait until PAS completes upgrading your device. It takes about 3-4 minutes at 115,200 bps to download the file to the meter. After upgrading firmware is completed, the meter restarts, so if it is connected through the modem to your PC, communications can be temporarily lost.
-
Page 105: Monitoring Devices
Chapter 4 PAS Application Software Monitoring Devices Monitoring Devices Viewing Real-time Data Real-time data is continuously retrieved from your devices, updated on the screen at the rate you defined in the Instrument Setup, and can be recorded to a file. You can view acquired data in a tabular or in a graphical form as a data trend. -
Page 106: Viewing Harmonic Spectrum And Synthesized Waveforms
Chapter 4 PAS Application Software Viewing Recorded Files Use the blue arrowhead buttons for one-time or continuous waveform polling. Use the Stop button to stop continuous polling. Viewing Waveforms for information on using waveform views. Viewing Harmonic Spectrum and Synthesized Waveforms To retrieve the real-time harmonic spectrum, select the device site from the list box on the PAS toolbar, and then select RT Harmonic Monitor from the... -
Page 107: Viewing The Device Event Log
Chapter 4 PAS Application Software Viewing Recorded Files Viewing the Device Event Log Event log files are displayed in a tabular view. PAS loads the entire database table to a window, so that you can scroll through the entire log to view its contents. -
Page 108: Viewing The Data Log
Chapter 4 PAS Application Software Viewing Recorded Files Viewing the Data Log Data log files can be displayed in a tabular view or in a graphical view as a data trend graph. Viewing Data Trend To view data in a graphical form, click on the Data Trend button on the local toolbar. - Page 109 Chapter 4 PAS Application Software Viewing Recorded Files Click on the button on the local toolbar to view overlapped waveforms, and click on the button to view non-overlapped waveforms. Waveform data is recorded in series that may contain many cycles of the sampled waveform.
- Page 110 Chapter 4 PAS Application Software Viewing Recorded Files Selecting Waveform Channels To select the channels you want to view on the screen, click on the waveform window with the right mouse button, select “Channels...”, check the channels you want displayed, and then click OK. Using the Marker Lines Waveform and RMS panes have two blue dashed marker lines.
- Page 111 Chapter 4 PAS Application Software Viewing Recorded Files select the desired units for voltages and currents on the Channels tab, and then click OK. Using a Zoom Use the green arrowheads on the local toolbar to zoom in or out of the waveform graph.
- Page 112 Chapter 4 PAS Application Software Viewing Recorded Files PAS can give you indication on whether harmonic levels in the sampled waveforms exceed compliance limits defined by the power quality standards or local regulations. To review or change harmonic limits: Click on the spectrum window with the right mouse button and select “Limits…”.
-
Page 113: Viewing Synchronized Waveforms
Chapter 4 PAS Application Software Viewing Recorded Files Harmonics that exceed selected compliance levels are colored in red on the graph and in the tables. Viewing a Spectrum Table Click on the button on the local toolbar. The spectrum table displays voltage, current, active power and reactive power harmonic components both in percent of the fundamental and in natural units, and phase angles between the harmonic voltage and current. - Page 114 Chapter 4 PAS Application Software Viewing Recorded Files Check the sites your want to see displayed. Click on the “Channels” button and select channels for each site. Click OK. To change the channels, click on the waveform window with the right mouse button and select “Channels...”.
-
Page 115: Comtrade And Pqdif Converters
Chapter 4 PAS Application Software COMTRADE and PQDIF Converters COMTRADE and PQDIF Converters The COMTRADE and PQDIF file converters allow you to convert retrieved waveforms into COMTRADE or PQDIF file format, and data log tables – into PQDIF format. Manual Converting To manually convert your waveforms or a data log into COMTRADE or PQDIF format: Click on the Export... -
Page 116: Automatic Converting
Chapter 4 PAS Application Software COMTRADE and PQDIF Converters Automatic Converting PAS allows you to automatically convert waveform and data logs into COMTRADE or PQDIF format at the time you upload data from your devices via the Upload Scheduler. To automatically convert your waveform or data log tables into COMTRADE or PQDIF format: Open the Upload Scheduler. -
Page 117: Appendix A Technical Specifications
Appendix A Technical Specifications Appendix A Technical Specifications Environmental Conditions Operating temperature: -20°C to 60°C (-4°F to 140°F) Storage temperature: -25°C to 80°C (-13°F to 176°F) Humidity: 0 to 95% non-condensing Construction Dimensions see Figure 2-1 Weight: 1.23kg (2.7 lb.) Materials Case enclosure: plastic PC/ABS blend Display body: plastic PC/ABS blend... - Page 118 Appendix A Technical Specifications Overload withstand: 15A RMS continuous, 300A RMS for 1 second 1A secondary Operating range: continuous 2A RMS Burden: < 0.02 VA Overload withstand: 6A RMS continuous, 80A RMS for 1 second Relay Outputs 2 relays rated at 3A/250 VAC; 3A/30 VDC, 2 contacts (SPST Form A) Wire size: 14 AWG (up to 1.5 mm Galvanic isolation: Between contacts and coil: 2000 VAC 1 min...
- Page 119 Serial EIA RS-232 optically isolated port Isolation: 2,000 V RMS Connector type: DB9 female. Baud rate: up to 115.2 kbps. Supported protocols: Modbus RTU, DNP3, and SATEC ASCII. RS-422/RS-485 optically isolated port Isolation: 2,000 V RMS Connector type: DB9 female.
-
Page 120: Standards Compliance
Appendix A Technical Specifications Communication: EIA RS-485 port with 12V supply voltage Connector type: DB15, 15 pins Wires size: up to 14 AWG (up to 1.5 mm Distance: up to 1000 m (3200 feet) Supply Voltage: 12VDC +/- 10% Power consumption: 2W Standards Compliance Accuracy per ANSI C12.20 –1998 UL File no. - Page 121 Appendix A Technical Specifications Measurement Specifications Parameter Full Scale @ Input Accuracy Range Range % FS Conditions Reading Voltage 120VxPT @ 120V 0.01 10% to 120% FS 0 to 1,150,000 V 400VxPT @ 690V Starting voltage 1.5% FS Line current 0.02 1% to 200% FS 0 to 40,000 A...
-
Page 122: Appendix B Analog Output Parameters
Appendix B Analog Output Parameters Appendix B Analog Output Parameters The following table lists parameters that can be provided on the meter’s analog outputs and on the external analog expander outputs. Display Code Designation Description nonE NONE None (output disabled) 1-Cycle Phase Values rt.U1 V1/V12 Voltage... -
Page 123: Appendix C Setpoint Triggers And Actions
Appendix C Setpoint Triggers and Actions Appendix C Setpoint Triggers and Actions Setpoint Triggers Display Code Designation Description nonE NONE None (condition is not active) Status Inputs St1.On STAT INP #1 ON Status input #1 ON St2.On STAT INP #2 ON Status input #2 ON St1.OFF STAT INP #1 OFF... - Page 124 Appendix C Setpoint Triggers and Actions Display Code Designation Description ArHi.q.E HI kvar EXP AVR High total kvar export ArHi. S HI kVA AVR High total kVA ArPF.LG HI PF LAG AVR Low total PF Lag ArPF.Ld HI PF LEAD AVR Low total PF Lead 1-Sec Auxiliary Values ArnEU.C...
- Page 125 Appendix C Setpoint Triggers and Actions Display Code Designation Description MONTH Month M.dAY DAY OF MONTH Day of month hour HOURS Hours MINUTES Minutes SECONDS Seconds Inter. MINUTE INTERVAL Minute interval (1,2,3,4,5,10,15,20,30,60 min) Event Flags FG1.On EVENT FLAG 1 ON Event flag #1 ON …...
-
Page 126: Appendix D Parameters For Data Log And Monitoring
Appendix D Parameters for Data Log and Monitoring Appendix D Parameters for Data Log and Monitoring The following table lists parameters measured by the meter that are available for data logging and monitoring through communications. The left column shows data abbreviations used in PAS. Parameter groups are highlighted in bold. - Page 127 Appendix D Parameters for Data Log and Monitoring Designation Description PF LEAD Total PF lead kW IMP Total kW import kW EXP Total kW export kvar IMP Total kvar import kvar EXP Total kvar export V AVG 3-phase average L-N/L-L voltage V LL AVG 3-phase average L-L voltage I AVG...
- Page 128 Appendix D Parameters for Data Log and Monitoring Designation Description PHASORS Phasors V1 Mag V1/V12 Voltage magnitude V2 Mag V2/V23 Voltage magnitude V3 Mag V3/V31 Voltage magnitude I1 Mag I1 Current magnitude I2 Mag I2 Current magnitude I3 Mag I3 Current magnitude V1 Ang V1/V12 Voltage angle V2 Ang...
- Page 129 Appendix D Parameters for Data Log and Monitoring Designation Description SUM REG2 SW DMD Summary register #2 demand … … SUM REG8 SW DMD Summary register #8 demand ENERGY Total Energy kWh IMPORT kWh import kWh EXPORT kWh export kvarh IMPORT kvarh import kvarh EXPORT kvarh export...
- Page 130 Appendix D Parameters for Data Log and Monitoring Designation Description ANG V2 EH 2 V2/V23 Harmonic Angles V2 H01 ANG H01 Harmonic angle V2 H02 ANG H02 Harmonic angle … V2 H40 ANG H40 Harmonic angle ANG V3 EH 2 V3/V31 Harmonic Angles V3 H01 ANG H01 Harmonic angle...
- Page 131 Appendix D Parameters for Data Log and Monitoring Designation Description I2 THD MIN I2 Current THD I3 THD MIN I3 Current THD I1 KF MIN I1 K-Factor I2 KF MIN I2 K-Factor I3 KF MIN I3 K-Factor I1 TDD MIN I1 Current TDD I2 TDD MIN I2 Current TDD...
- Page 132 Appendix D Parameters for Data Log and Monitoring Designation Description I3 TDD DMD MAX I3 TDD demand MAX SUMMARY DMD Maximum Summary (TOU Total) Demands SUM REG1 DMD MAX Summary register #1 maximum demand SUM REG2 DMD MAX Summary register #2 maximum demand …...
- Page 133 Appendix D Parameters for Data Log and Monitoring Designation Description DMD1 TRF8 MAX Tariff #8 register TOU MAX DMD REG2 TOU Maximum Demand Register #2 DMD2 TRF1 MAX Tariff #1 register DMD2 TRF2 MAX Tariff #2 register … … DMD2 TRF8 MAX Tariff #8 register TOU MAX DMD REG3 TOU Maximum Demand Register #3...
-
Page 134: Appendix E Data Scales
Appendix E Data Scales Appendix E Data Scales The maximum values for volts, amps and power in the PM172 setup and in communications are limited by the voltage and current scale settings. See Device Options in Chapter 4 on how to change the voltage scale in your meter. -
Page 135: Appendix F Device Diagnostic Codes
Appendix F Device Diagnostic Codes Appendix F Device Diagnostic Codes Diagnostic Description Reason Code Memory/Data fault Hardware failure Hardware watchdog reset Hardware failure CPU exception Hardware failure Run-time software error Hardware failure Software watchdog Hardware failure timeout Power Down/Up Normal power-up sequence Warm restart External restart via communications or by firmware upgrade...
Need help?
Do you have a question about the PM172P and is the answer not in the manual?
Questions and answers