Satec expertmeter EM720 Operation Manual
Power quality and revenue meter
Hide thumbs
Also See for expertmeter EM720:
- Reference manual (149 pages) ,
- Installation manual (32 pages) ,
- Operation manual (216 pages)
Table of Contents
Advertisement
Quick Links
Advertisement
Table of Contents

Related Manuals for Satec expertmeter EM720


Summary of Contents for Satec expertmeter EM720
- Page 1 POWER QUALITY AND REVENUE METER EM720/EM720T Operation Manual BG0451 Rev. A3...
-
Page 2: Limited Warranty
LIMITED WARRANTY The manufacturer offers the customer a 24-month functional warranty on the instrument for faulty workmanship or parts from date of dispatch from the distributor. In all cases, this warranty is valid for 36 months from the date of production. - Page 3 Failure to observe precautions can result in serious or even fatal injury or damage to equipment. All trademarks are property of their respective owners January 2011 Copyright 2008-2011 © SATEC Ltd. EM720 Power Quality and Revenue Meter...
-
Page 4: Table Of Contents
T able of Contents Chapter 1 Introduction ............... 8 Chapter 2 Operating the EM720..........14 Controls and Indicators ................14 TEST Mode ....................15 Device Diagnostics................... 15 Meter Security..................16 Meter Clock and Time Synchronization ............ 17 Monitoring Meter Batteries ..............17 Billing and Energy Metering.............. - Page 5 Setting up Communications ..............52 Communicating through a Serial Port ............52 Communicating through the Internet ............53 Communicating through a GSM/GPRS Modem ........... 54 Communicating through a USB ..............56 Setting Up the Meter................57 Downloading Setups to the Meter ............58 Uploading Setups from the Meter.............
- Page 6 Clearing Device Diagnostics..............130 Resetting Accumulators and Log Files ........... 130 Remote Relay Control ................132 Operating Event Flags................133 Upgrading Meter Firmware ..............135 Chapter 7 Monitoring Meters ..........137 Viewing Real-time Data ................. 137 Viewing Real-time Min/Max Log............140 Viewing Real-time Harmonic Spectrum ..........
- Page 7 Appendix F Data Scales ............215 Appendix G Device Diagnostic Codes........216 Appendix H OBIS Identification Codes ........217 EM720 Power Quality and Revenue Meter...
-
Page 8: Chapter 1 Introduction
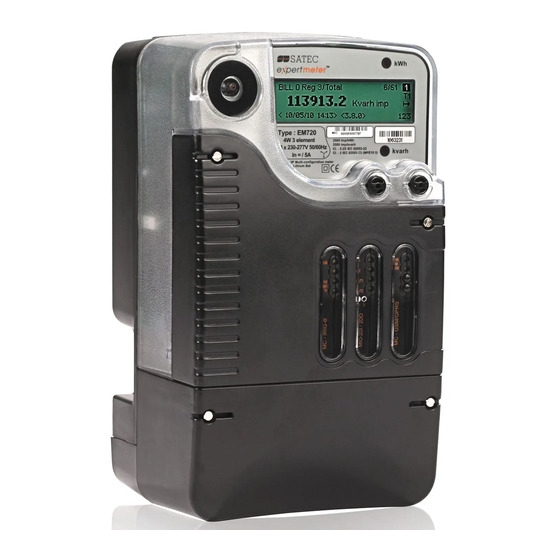
Chapter 1 Introduction Chapter 1 Introduction eXpertmeter™ EM720/EM720T The EM720 is especially designed for utility, industrial and commercial billing metering with high requirements to reliability of power quality monitoring and availability of the device. eXpertmeter™ EM720 electronic revenue- accuracy multi-rate polyphase static meter integrated with a multi-function powermeter, EN50160... -
Page 9: Meter Features
Chapter 1 Introduction Fast Transient Recorder An optional high-voltage fast transient recorder (EM720T) detects impulsive and low frequency oscillatory transient overvoltages with peaks up to 2kV and durations from 20 microseconds. Digital Fault Recorder An embedded fault recorder is capable of recording fault currents up to 50 amps. - Page 10 Chapter 1 Introduction • Harmonic Analyzer: up to 50th harmonic volts and amps; fundamental volts, amps, power and power factor, phasor, symmetrical components Power Quality • EN 50160 Power Quality (PQ) recorder: onboard power quality analyzer; programmable limits; EN 50160 power quality event log, EN 50160 compliance statistics;...
- Page 11 Chapter 1 Introduction • Synchronized waveforms from multiple devices in a single plot • Exporting waveforms in COMTRADE and PQDIF file formats Data Recorders • Sixteen Data recorders • Programmable data logs on a periodic basis and on any internal and external trigger; triggering from the Fault recorder, PQ recorder or control setpoints;...
- Page 12 New features can be easily added to your meter by simply replacing firmware through any communication port. Software Support • PAS – free meter configuration and data acquisition tool • eXpertPower – SATEC proprietary Internet services EM720 Power Quality and Revenue Meter...
- Page 13 Chapter 1 Introduction EM720 Models The EM720 meter series includes two models: • EM720 – basic model - offers all the EM720 billing, instrumentation, control, power quality and fault recording capabilities • EM720T – fast transient model - adds to above a fast transient recorder with a capability of detecting transient overvoltages with peaks up to 2kV and durations of less than 20 microseconds...
-
Page 14: Chapter 2 Operating The Em720
Chapter 2 Operating the EM720 Controls and Indicators Chapter 2 Operating the EM720 Controls and Indicators Push Buttons The EM720 provides two sealable push buttons that do not have labels. They allow you to scroll through the multi-page display screens for local meter reading, to inspect or change meter setup parameters, and to control display operations. -
Page 15: Test Mode
Chapter 2 Operating the EM720 TEST Mode Rated Voltage, Secondary Pulse Rate, Current, A imp/kWh 57-120 20,000 57-120 4,000 120-277 12,500 120-277 2,500 The LED pulse rate in TEST mode is user-programmable. The factory set defaults and available ranges are shown in the following table. -
Page 16: Meter Security
Chapter 2 Operating the EM720 Meter Security Indicators in Chapter 3 for information on diagnostics indicators. See Device Diagnostics Display in Chapter 3 on how to inspect the meter diagnostics messages from the display. The device diagnostics status is stored in a non-volatile register, which may be inspected and cleared from the meter display, via the supplemental PAS software, or from a user application. -
Page 17: Meter Clock And Time Synchronization
Chapter 2 Operating the EM720 Meter Clock and Time Synchronization Password Security Level Access Rights Password 2 Medium TEST mode. Reset of meter and battery operation time counters, failure counters and pulse counters. Communications setup. I/O operation setup and control. Memory and recorders setup. -
Page 18: Billing And Energy Metering
Chapter 2 Operating the EM720 Billing and Energy Metering You can monitor the status of batteries from the front display on the Device Info pages (see Device Info Display in Chapter 3) and via the device diagnostics. The auxiliary battery voltage is about 8.2 volts at full charge (for at least 20 hours). - Page 19 Chapter 2 Operating the EM720 Billing and Energy Metering Energy Counters The EM720 provides instrumentation energy and billing energy metering. Both use the same energy measurement circuitry as a source input for accumulation energies but operate independently. Energy counters have a nine-digit kWh resolution with one decimal place by default.
-
Page 20: Instrumentation Metering
Chapter 2 Operating the EM720 Instrumentation Metering The present tariff rate is indicated on the EM720 display. If required, tariff-switching pulses with programmable duration can be output via the meter relays. End of Billing The EM720 can be configured to trigger a reset of billing maximum demands and an end of billing period automatically on a monthly schedule, manually from the front display and remotely via communications. -
Page 21: Instrument Transformer Correction
Chapter 2 Operating the EM720 Instrument Transformer Correction Voltage and current harmonic measurements are based on 10-cycle/50Hz 12-cycle/60Hz waveforms (per 61000-4-7), sampled at a rate of 128 samples/cycle. The EM720 uses dynamic sampling techniques to maintain a steady sampling rate and avoid instrumentation errors when the line frequency changes. -
Page 22: Power Transformer/Line Loss Compensation
Chapter 2 Operating the EM720 Power Transformer/Line Loss Compensation NOTES 1. When transformer correction is enabled, it is applied to all instrumentation, billing and power quality calculations and waveforms. 2. Transformer correction does not affect test LED pulse outputs. 3. Transformer correction is not operational in test mode regardless of the option’s status. -
Page 23: Operating Relay Outputs
Chapter 2 Operating the EM720 Operating Relay Outputs Color Status Description IN1, IN2 Yellow Lights The digital input terminals are shorted OUT1, OUT2 Green Lights The normally open relay contacts are closed Fast internal digital inputs are sampled at a 1-ms rate, and expansion inputs are sampled at a 1/2-cycle rate. -
Page 24: Operating The Logical Controller
Chapter 2 Operating the EM720 Operating the Logical Controller Each relay can be operated either locally from a control setpoint in response to an internal or external event, or by a remote command sent through communications, or can be directly linked to an internal pulse source producing energy or interval pulses. -
Page 25: Operating The Fast Transient Recorder
Chapter 2 Operating the EM720 Operating the Fast Transient Recorder currents while the event continues, using a variable recording rate and variable averaging intervals. Configuring the EN50160 Recorders in Chapter 5 and EN50160 Evaluation and Recording in Appendix E for more information on configuring and operating the PQ recorder. -
Page 26: Serial Communications
Chapter 2 Operating the EM720 Communicating with the EM720 the full list of the available communication modules and communication options. Infrared Port The EM720 has an optical infrared port for local meter reading via a hand-held unit or a portable PC. The IR port can be equipped with an IEC- or ANSI-compatible optical head on your selection. -
Page 27: Ethernet Connection
Chapter 2 Operating the EM720 Communicating with the EM720 Ethernet Connection An optional 10/100Base-T Ethernet/USB module provides a direct connection of the EM720 to the Ethernet. The port has two indication LEDs that operate as follows: Color Status Description LINK Green Lights The good link is detected (slightly blinks... - Page 28 Chapter 2 Operating the EM720 Communicating with the EM720 GSM/GPRS Wireless Communication An optional GSM/GPRS modem can be provided with the EM720 for wireless communications via a cellular GPRS network. It is identified by the EM720 as port COM2. A GSM/GPRS module may only be installed into expansion slot 3.
-
Page 29: Auxiliary Ac/Dc Backup Power Supplies
Chapter 2 Operating the EM720 Auxiliary AC/DC Backup Power Supplies USB Communications An optional Ethernet/USB module provides a full speed 12- Mbit USB 1.1 port for local communications with the support PAS software. The USB module can be installed in the expansion slot 1 or 2. -
Page 30: Chapter 3 Using Front Display
Chapter 3 Using Front Display Display Operations Chapter 3 Using Front Display Display Operations The EM720 has a high-contrast graphical LCD display with backlight for local data read outs, meter setup and servicing. The display operates in two modes: • Multi-page data display mode with Auto-Scroll feature allows you to scroll through display screens and pages to view various billing, instrumentation and status... -
Page 31: Navigating In Data Display Mode
Chapter 3 Using Front Display Display Operations • In data display mode, it scrolls through the display pages. • In programming mode, it scrolls through the menu items and allows changing a selected digit when entering numbers. The SELECT/ENTER button normally operates once it’s released. -
Page 32: Status Indicators
Chapter 3 Using Front Display Display Operations Use a short press on the SELECT/ENTER button to scroll through displays. Use a short press on the SCROLL button to scroll through the pages. Status Indicators Graphical icons right give immediate meter status indication and show the present tariff rate. -
Page 33: Display Features
Chapter 3 Using Front Display Display Operations General diagnostic message indicator: indicates that there are diagnostic messages you can inspect via the DIAGNOSTICS display. The icon is shut down after you explicitly reset diagnostics messages either from the display or via communications (see Clearing Device Diagnostics). -
Page 34: Measurement Units
Chapter 3 Using Front Display Display Operations The backlight is not operational if voltages are missing on meter terminals while the meter is powered from the battery. Auto-Return If the Auto-Return feature is enabled and no button is pressed for the programmable Auto-Return interval (1 to 30 minutes for data displays;... -
Page 35: Data Displays
Chapter 3 Using Front Display Data Displays Data Displays The EM720 has 9 multi-page data displays listed in the following table. Display Number Display Label Display Contents BILL 0 Present (0) billing period data BILL 1 Last (-1) billing period data BILL 2 Second previous (-2) billing period data... - Page 36 Chapter 3 Using Front Display Data Displays (see Configuring Billing/Tariff Registers Configuring the Daily Tariff Schedule in Chapter 5). The order of pages is shown in the following table. Number of Pages Display Contents 1-10 Register 1…10 total energy readings Register 1 tariff 1…8 energy readings Register 2 tariff 1…8 energy readings …...
- Page 37 Chapter 3 Using Front Display Data Displays Total energy reading of register 2 – exported kWh. Total energy reading of register 3 – imported (inductive) kvarh. Total energy reading of register 4 – exported (capacitive) kvarh. Tariff 1 energy reading of register 1 – imported kWh.
- Page 38 Chapter 3 Using Front Display Data Displays Total cumulative maximum demand reading of register 4 – exported kvar. Tariff 1 cumulative maximum demand reading of register 1 – imported kW. … … Tariff 3 cumulative maximum demand reading of register 4 – exported kvar. Previous Billing Period Data The following example demonstrates billing displays for the three previous billing periods.
-
Page 39: Engineering Maximum Demand Data Display
Chapter 3 Using Front Display Data Displays Total maximum demand reading of register 1 – exported kW. … … Tariff 1 maximum demand reading of register 1 – imported kW. Tariff 2 maximum demand reading of register 1 – imported kW. …... - Page 40 Chapter 3 Using Front Display Data Displays kvar import (inductive) maximum demand kVA maximum demand kW export maximum demand kvar export (capacitive) maximum demand V1 maximum demand Indicate V12 voltage in line-to-line configurations. … … V3 maximum demand Indicate V31 voltage in line-to-line configurations I1 maximum demand …...
-
Page 41: Engineering Data Display
Chapter 3 Using Front Display Data Displays I3 THD maximum demand Engineering Data Display Engineering data represent general instrumentation data you can use while installation and inspecting the meter. Use phase angles displays to check the order of phases when connecting wires to the meter terminals. -
Page 42: Setup Data Display
Chapter 3 Using Front Display Data Displays Long-term flicker Voltage phase angles (relative to V1 voltage). Indicate phase-to-phase voltage angles in line-to- line configurations. Phase current phase angles (relative to V1 voltage) Auxiliary current phase angle (relative to V1 voltage) Setup Data Display The setup data display shows basic device settings that can be required for immediate inspecting while meter testing and... -
Page 43: Device Diagnostics Display
Chapter 3 Using Front Display Data Displays Meter identification info: serial number, production date and calibration date Meter operation time counters (since start of operation): Start of operation date Total operation time in hours Out of service time in hours Power failure counters (since start of operation): Total number of power failures Total number of 3-phase voltage interruptions... - Page 44 Chapter 3 Using Front Display Data Displays If there are more pages, use a short press on the SCROLL button to scroll through the entire list of messages. Extended press SCROLL + SELECT/ENTER is a shortcut for immediate entering the diagnostics reset menu.
-
Page 45: Programming Mode
Chapter 3 Using Front Display Programming Mode Programming Mode To enter programming mode from the data display, press and hold the SELECT/ENTER button for more than 5 seconds. Navigation Buttons The following table gives a summary of the button operations in programming mode. -
Page 46: Setup Menus And Access Rights
Chapter 3 Using Front Display Programming Mode Once the password is set to the desired value, press and hold the SELECT/ENTER button for more than 1 second. If the password you entered is correct, you move to the main device menu, otherwise you return back to the data display. Setup Menus and Access Rights The EM720 setup is menu-driven. - Page 47 Chapter 3 Using Front Display Programming Mode Once you entered a submenu, the left window is still showing the menu name, while the upper-right window represent a submenu options list, and the lower-right window indicates the present option value. To select an option you want to view or change: ENTER LONG PRESS Use the SCROLL button to scroll through the option list until...
-
Page 48: Chapter 4 Using Pas Software
Chapter 4 Using PAS Software Software Installation Chapter 4 Using PAS Software The support PAS software is a configuration and data acquisition tool that allows you to configure all of the EM720 features, monitor your meter on-line, retrieve recorded files and view reports. - Page 49 Chapter 4 Using PAS Software Software Installation Connect the EM720 to your PC’s USB port using the supplied USB cable. When the EM720 is powered up, Windows automatically detects the meter and launches the hardware installation wizard. The following example demonstrates an installation of the USB driver on Windows XP.
- Page 50 Chapter 4 Using PAS Software Software Installation 4. Point to the “USB” folder located in the PAS installation directory and click “OK” 5. Click “Next”. 6. Click "Finish" to complete installation. EM720 Power Quality and Revenue Meter...
-
Page 51: Creating A New Site For Your Meter
Chapter 4 Using PAS Software Creating a New Site for your Meter The next time you power up the EM720 or connect it to your PC with the USB cable, Windows automatically launches the driver for your meter. Creating a New Site for your Meter PAS keeps all communication and configuration data for your meter in a configuration database called a site database. -
Page 52: Setting Up Communications
Chapter 4 Using PAS Software Setting up Communications “Sites” directory. Type a site name for your device in the “File name” box, click New, and then click OK. 4. On the Instrument Setup tab, select “EM720” in the “Model” box. PAS automatically selects the appropriate instrument options for your meter. -
Page 53: Communicating Through The Internet
Chapter 4 Using PAS Software Setting up Communications Selecting the Communications Protocol 1. On the Connection tab, click Protocol. 2. In the “Protocol” box, select the same communications protocol as you have set in your device. 3. The remaining settings in this dialog do not normally need to be changed. -
Page 54: Communicating Through A Gsm/Gprs Modem
Chapter 4 Using PAS Software Setting up Communications 4. In the “Protocol” box, select the communications protocol port. meter provides Modbus/TCP connections port DNP3/TCP connections on port 20000. The host port is set automatically as you select the protocol. Select “Modbus RTU/TCP”... - Page 55 Chapter 4 Using PAS Software Setting up Communications 3. Click on the “IP address” and type in the IP address your meter from GPRS provider when registering on the GPRS network. You can find the meter GPRS IP address on the GPRS page in the Device Info display (see Device Info Display in Chapter...
-
Page 56: Communicating Through A Usb
Chapter 4 Using PAS Software Setting up Communications 2. Click Dial. Communicating through a USB On the Instrument Setup tab, click USB Port, and then click EM720 Power Quality and Revenue Meter... -
Page 57: Setting Up The Meter
Chapter 4 Using PAS Software Setting Up the Meter Setting Up the Meter PAS allows you to prepare setup data for your meter off-line without the need to have it connected to your PC. To prepare a setup for your meter: 1. -
Page 58: Downloading Setups To The Meter
Chapter 4 Using PAS Software Setting Up the Meter Downloading Setups to the Meter You can update each setup in your meter one at a time or download all setups together from the site database. Individual Download To update a particular setup in your meter: 1. -
Page 59: Authorization And Security
Chapter 4 Using PAS Software Authorization and Security 2. Select the device site from the list box on the toolbar. 3. Select Upload Setups from the Meter Setup menu. NOTE The passwords setup is never uploaded via the Batch Upload and may not be read from the meter. -
Page 60: Chapter 5 Configuring The Em720
Chapter 5 Configuring the EM720 Configuring Communications Chapter 5 Configuring the EM720 This chapter describes how to configure the EM720 for your particular environment and application from the front display and via PAS. To access your meter configuration options via PAS, you should create a site database for your device as shown in Chapter 4. - Page 61 Chapter 5 Configuring the EM720 Configuring Communications Display Parameter Options Default Description Label Protocol Communication Modbus RTU, IEC 62056-21 The communications protocol (COM1) protocol for the port Modbus ASCII, Modbus RTU DNP3, (COM 3) IEC 62056-21 Interface Port interface RS232, RS485, IR (COM1) Not changeable;...
-
Page 62: Setting Up The Ethernet
Chapter 5 Configuring the EM720 Configuring Communications Setting Up the Ethernet Using the Front Display Select Net from the main menu. See Viewing and Changing Setup Options in Chapter 3 for information on navigating in menus. See the table below for available network options. Using PAS Select Communications Setup from the Meter Setup menu, and then click on the Network Setup tab. -
Page 63: Setting-Up Dial-Up Gprs Network
Chapter 5 Configuring the EM720 Configuring Communications Setting-Up Dial-Up GPRS Network Select Communications Setup from the Meter Setup menu, and then click on the Dial-Up Networking Setup tab. The following table lists available connection options. Parameter Options Default Description Connection Options IP Address 192.168.10.203 The IP address on the dial-in... -
Page 64: Setting-Up Sntp Client
Chapter 5 Configuring the EM720 Configuring Communications Parameter Options Default Description ISP Account Phone Number *99# The telephone number of the ISP provider. The default number provides a connection to the GPRS network for your EM720 GSM/GPRS modem. Login Name Login name for logging onto the Internet (if required). -
Page 65: Setting-Up Expertpower Client
The EM720 has an embedded eXpertPower client that provides communications with the eXpertPower server – the SATEC proprietary Internet services. Connections to the eXpertPower server are handled on a periodic basis. The following table lists available options. Refer to your eXpertPower service provider for the correct eXpertPower settings. -
Page 66: Setting-Up Tcp Notification Client
Chapter 5 Configuring the EM720 Configuring Communications Parameter Options Default Description XPW Server IP Address 207.232.60.18 The IP address of the eXpertPower server XPW Server Port 0-65535 5001 The TCP service port of the eXpertPower server XPW Client Enabled NO, YES Enables operations of the eXpertPower client Time to Next Session,... - Page 67 Chapter 5 Configuring the EM720 Configuring Communications The following table lists available options. Parameter Options Default Description Client Enabled NO, YES Enables operations of the notification client Server IP Address 192.168.0.3 The IP address of the notification server Server Port 0-65535 The TCP service port of the notification server...
-
Page 68: General Meter Setup
Chapter 5 Configuring the EM720 General Meter Setup General Meter Setup Basic Meter Setup The Basic Setup provides the meter with basic information about your electrical network. Using the Front Display Select Basic from the main menu. See Viewing and Changing Setup Options in Chapter 3 for information on navigating in menus. - Page 69 Chapter 5 Configuring the EM720 General Meter Setup Display Label Parameter Options Default Description Nom. Voltage PT Secondary (L-L) 50-480 V 400 V The nominal secondary line-to- Voltage line voltage. Used as a reference voltage for the EN50160 evaluation. CT Primary 1-20,000 A The primary rating of the phase CT Primary Current...
-
Page 70: Device Options And Mode Control
Chapter 5 Configuring the EM720 General Meter Setup Device Options and Mode Control Using the Front Display To enter the common options setup menu, select Options from the main menu. To enter the TEST mode options setup, select Test from the main menu. - Page 71 Chapter 5 Configuring the EM720 General Meter Setup Display Parameter Options Default Description Label Power/Energy Options Power Mode Power S=f(P, Q) (reactive S=f(P, Q) The method used for calculating Calculation power mode), reactive and apparent powers (see Mode “Power Calculation Modes” below) Q=f(S, P) (non- active power mode)
- Page 72 Chapter 5 Configuring the EM720 General Meter Setup volts, and THD < 10% for currents. In networks with high harmonics, the following method is preferable. 3. When the non-active power calculation mode is selected, active power is measured directly, apparent power is taken as product S = V x I, where V and I are the RMS volts and amps, and reactive power (called non-active power) is calculated as:...
-
Page 73: Instrument Transformer Correction Setup
Chapter 5 Configuring the EM720 General Meter Setup Instrument Transformer Correction Setup Transformer correction allows you to compensate ratio and phase angle inaccuracies voltage current instrument transformers. Select General Setup from the Meter Setup menu, and then click on the Transformer Correction tab. The available options are listed in the following table. -
Page 74: Transformer/Line Loss Compensation Setup
Chapter 5 Configuring the EM720 General Meter Setup The order in which you define the test points does not matter. The meter will automatically arrange all data in a correct order. Check the Correction Enabled box to activate transformer correction in the meter. You can also enable and disable transformer correction from the front display (see Device Options and Mode... - Page 75 Chapter 5 Configuring the EM720 General Meter Setup Parameter Options Description Billing Point Location Supply side, far end, Defines the location of the billing point: Supply side, far end – near the supply source or near the load, transformer end, transformer end –...
-
Page 76: Local Settings
Chapter 5 Configuring the EM720 General Meter Setup Billing Point Supply side, Supply side, Load side, Load side, far end transformer end transformer end far end Metering Point Supply side, -Supply line losses -Supply line losses -Supply line losses far end -Transformer losses -Transformer losses -Load line losses... - Page 77 Chapter 5 Configuring the EM720 General Meter Setup The available options are listed in the following table. Display Label Parameter Options Default Description Country Country Default, or Default Indicates the location of the meter. country name The default setting stands for the U.S.A.
- Page 78 Chapter 5 Configuring the EM720 General Meter Setup Display Label Parameter Options Default Description End Day DST End Day Sunday- Sunday The day when DST ends. Saturday End Hour DST End Hour The hour when DST ends. Date Order Date Order MM/DD/YY DD/MM/YY The display date order DD/MM/YY...
- Page 79 Chapter 5 Configuring the EM720 General Meter Setup When the signal is restored, the meter automatically acquires the GPS time. Whenever the IRIG-B signal status or quality changes, the corresponding event is automatically recorded to the device Event log. You can check presence and quality of the IRIG-B signal via the device diagnostics display (see Device Diagnostics Display in Chapter 3) or via PAS (see...
-
Page 80: Display Setup
Chapter 5 Configuring the EM720 General Meter Setup Display Setup Using the Front Display Select Display from the main menu. See Viewing and Changing Setup Options in Chapter 3 for information on navigating in menus. See the table below for available display options. Using PAS Select General Setup from the Meter Setup menu, and then click on the Display Setup tab. - Page 81 Chapter 5 Configuring the EM720 General Meter Setup Display Parameter Options Default Description Label Auto-Scroll Auto-Scroll Disabled, Defines the display scroll Interval interval or disables auto- 2-10, 15, 20, 25, 30 scroll seconds Scroll Seq. Auto-Scroll 1-2, 1-3, 1-4, 1, 9 Selects the display Sequence sequence for auto-scrolling...
-
Page 82: Configuring Digital Inputs
Chapter 5 Configuring the EM720 General Meter Setup Configuring Digital Inputs The EM720 has four embedded digital inputs (DI1 to DI4) and supports up to two expansion 2DI/2DO modules with a total of 4 digital inputs (DI5 to DI8). I/O numbers are automatically assigned inputs in the... - Page 83 Chapter 5 Configuring the EM720 General Meter Setup Parameter Options Default Description Debounce time 1-1000 ms 10 ms The amount of time while the state of the digital input should not change to be recognized as a new state. Too low debounce time could produce multiple events on the input change.
-
Page 84: Configuring Relay Outputs
Chapter 5 Configuring the EM720 General Meter Setup Configuring Relay Outputs The EM720 supports up to two expansion 2DI/2DO modules with a total of 4 relays (RO1 through RO4). I/O numbers are automatically assigned to outputs in the order of connection. To configure the relay outputs in your meter, select General Setup from the Meter Setup menu, and then click on the Relay Outputs tab. - Page 85 Chapter 5 Configuring the EM720 General Meter Setup Parameter Options Default Description Polarity NORMAL (N.O.) NORMAL Normal polarity: the relay is normally de- energized in its non-active state and is INVERTING (N.C.) energized in its active (operated) state. Inverting polarity: the relay is normally energized in its non-active state and is de- energized in its active (operated) state.
-
Page 86: Using Counters
Chapter 5 Configuring the EM720 General Meter Setup Using Counters The EM720 provides 8 universal nine-digit counters that can count different events. Each counter can be independently linked to any digital input and count input pulses with a programmable scale factor. You can link a number of digital inputs to the same counter. -
Page 87: Using Periodic Timers
Chapter 5 Configuring the EM720 General Meter Setup Using Periodic Timers The EM720 has 4 programmable interval timers that are normally used for periodic recording and triggering operations on a time basis through the Control Setpoints. Whenever a programmed timer interval is expired, the timer generates an internal event that can trigger any setpoint (see Using Control Setpoints). -
Page 88: Using Control Setpoints
Chapter 5 Configuring the EM720 General Meter Setup Using Control Setpoints The EM720 has an embedded logical controller that runs different actions in response to user-defined internal and external events. Unlike a PLC, the EM720 uses a simplified programming technique based on setpoints that allows the user to define a logical expression based on measured analog and digital values that produces a required action. - Page 89 Chapter 5 Configuring the EM720 General Meter Setup Option Format/Range Description Operate limit The threshold (in primary units) at which the conditional expression would be evaluated to true. Not applicable for digital triggers. Release limit The threshold (in primary units) at which the conditional expression would be evaluated to false.
- Page 90 Chapter 5 Configuring the EM720 General Meter Setup Using Numeric Triggers For numeric (analog) triggers, a setpoint allows you to specify two thresholds for each trigger to provide hysteresis (dead band) for setpoint operations. The Operate Limit defines the operating threshold, and the second Release Limit defines the release threshold for the trigger.
- Page 91 Chapter 5 Configuring the EM720 General Meter Setup setpoint triggers. When the setpoint event is asserted, the timer is restarted, and then generates the next timer event when the timer interval expires. If you wish to record interval data at predefined intervals without linking to other events, just select a timer as a setpoint trigger and specify in the setpoint actions list a data log file you want to use for recording.
- Page 92 Chapter 5 Configuring the EM720 General Meter Setup same target. The exceptions are relay operations, data logging and waveform logging that are shared between all setpoints using an OR scheme for each separate target. A relay output is operated when one of the setpoints linked to the relay is activated and stays in the operated state until all of these setpoints are released (except for latched relays that require a separate release command to be deactivated).
-
Page 93: Configuring Billing/Tou
Chapter 5 Configuring the EM720 Configuring Billing/TOU Configuring Billing/TOU The EM720 provides 10 universal billing energy registers that can be linked to any internal energy source or to any external pulse source that delivers pulses through the device digital inputs. Any of energy registers can provide either a single-tariff energy accumulation or be individually linked to the TOU system providing both total and multi-tariff energy billing. -
Page 94: Configuring Billing/Tariff Registers
Chapter 5 Configuring the EM720 Configuring Billing/TOU Configuring Billing/Tariff Registers Select Energy/TOU from the Meter Setup menu. The available options are shown in the following table: Parameter Options Default Description Billing/TOU Registers Unchecked Unchecked Links multi-tariff registers to the selected energy source Checked Use Profile... -
Page 95: Configuring The Daily Tariff Schedule
Chapter 5 Configuring the EM720 Configuring Billing/TOU Parameter Options Default Description Channel No, Ch1-Ch6 None Defines a measurement channel for multi- meter energy metering. Not used for a single self-metering channel if there are no external sources. Set to Ch1 for internal energy sources, and to Ch2 through Ch6 for external sources in the event of multi- channel energy metering. -
Page 96: Configuring The Season Tariff And Dst Schedule
Chapter 5 Configuring the EM720 Configuring Billing/TOU The daily profile setup allows you to specify the daily tariff change points with a 15-minute resolution for 4 seasons using 4 different daily schedules for each season. To configure your daily profiles: 1. - Page 97 Chapter 5 Configuring the EM720 Configuring Billing/TOU order that is convenient for you, based on simple intuitive rules. There are no limitations on how to define your schedule. The meter is able to automatically recognize your settings and to select a proper daily tariff schedule for any day within a year.
-
Page 98: Configuring Recorders
Chapter 5 Configuring the EM720 Configuring Recorders Configuring Recorders The EM720 is provided with an 8-MByte or 16-MByte flash memory for data, event and waveform recording. The meter memory is fully configurable except of the files that keep monthly and daily billing profiles and energy load profile. - Page 99 Chapter 5 Configuring the EM720 Configuring Recorders Option Range Description Sections/Channels 0-20 The numbers of sections in a multi-section profile data log file, or the number of recording channels in a waveform log file Num. of Records 0-65535 Allocates the file memory for predefined number of records Record size The size of the file record for a single channel or a single section.
- Page 100 Chapter 5 Configuring the EM720 Configuring Recorders The following table can help you calculate an estimated file size for conventional log files when planning your memory allocation. The actual file size will normally be a bit bigger. File Record Size, Bytes File Size, Bytes Event Log Record size ×...
-
Page 101: Configuring The Event Recorder
Chapter 5 Configuring the EM720 Configuring Recorders Configuring the Event Recorder To configure the Event log file: 1. Double click on the Event Log file partition with the left mouse button. 2. Select a desired file type for your file. 3. - Page 102 Chapter 5 Configuring the EM720 Configuring Recorders 2. Select a partition type for your file. 3. Select the number of parameters you want to be recorded in the file records. 4. Select the maximum number of records you want to be recorded in the file.
- Page 103 Chapter 5 Configuring the EM720 Configuring Recorders 3. For your convenience, PAS follows your selection and helps you configure a series of the neighboring parameters: when you open the “Group” box for the next parameter, PAS highlights the same group as in your previous selection;...
- Page 104 Chapter 5 Configuring the EM720 Configuring Recorders Data Log #2 Parameter V1/V12 Demand V2/V23 Demand V3/V31 Demand I1 Demand I2 Demand I3 Demand kW Import Sliding Demand kvar Import Sliding Demand KVA Sliding Demand kWh Import kWh Export kvarh Import kvarh Export kVAh Frequency...
- Page 105 Chapter 5 Configuring the EM720 Configuring Recorders Data Log #14 Parameter Generic voltage V1/V12 Generic voltage V2/V23 Generic voltage V3/V31 Generic current I1 Generic current I2 Generic current I3 Generic current I4 Generic frequency EN50160 Statistics Data Logs Data log #9 and Data log #10 are pre-configured for recording EN50160 compliance statistics and harmonics survey data.
-
Page 106: Configuring The Waveform Recorder
Chapter 5 Configuring the EM720 Configuring Recorders Configuring the Waveform Recorder The EM720 can store waveforms in three log files. Configurable waveform log files #1 and #2 can record waveforms at four programmable sampling rates: 32, 64, 128 or 256 samples per cycle. A log file can store up to 7 channels simultaneously (three voltage channels and four current channels) with a programmable length and up to 20 pre-event cycles. - Page 107 Chapter 5 Configuring the EM720 Configuring Recorders 2. Select a file type for your file. 3. Select the number of channels for simultaneous recording in the file to define the file record size. 4. Select the maximum number of records you want to be recorded in the file.
- Page 108 Chapter 5 Configuring the EM720 Configuring Recorders The following table lists available waveform options. Parameter Options Description Recording Time Fixed Fixed – a waveform is recorded up to the maximum specified length Event-controlled Event-controlled – a waveform extends for as long as trigger conditions exist plus post-event time, or up to the maximum specified length Samples per Cycle...
- Page 109 Chapter 5 Configuring the EM720 Configuring Recorders 5. Save your waveform setup to the device database, and then send it to the meter. EM720 Power Quality and Revenue Meter...
-
Page 110: Configuring The Fault Recorder
Chapter 5 Configuring the EM720 Configuring Recorders Configuring the Fault Recorder The Fault recorder automatically records all fault events to the Fault log file. It can be triggered via the embedded fault detector, or externally through any of the 8 digital inputs. The Fault recorder can be globally disabled or enabled in your meter. - Page 111 Chapter 5 Configuring the EM720 Configuring Recorders Option Range Default Description Hysteresis, % 0-50.0% Defines the hysteresis for a fault trigger in percent of the threshold Trigger Checked Checked Links a fault trigger to the Fault Recorder. If the Enabled box is unchecked, the Fault Recorder does not Unchecked respond to the trigger.
- Page 112 Chapter 5 Configuring the EM720 Configuring Recorders adjust the thresholds according to your network conditions before enabling triggers. The Current Unbalance trigger has a different calculation algorithm than common current unbalance measurements. Since the unbalance readings give a relation of the maximum deviation from the average to the phase average current, the value could produce high readings for low currents.
-
Page 113: Configuring The En50160 Recorders
Chapter 5 Configuring the EM720 Configuring the EN50160 Recorders Configuring the EN50160 Recorders EN50160 Evaluation and Recording in Appendix E for information on EN50160 evaluation techniques. Basic Device Settings The following device settings affect the EN50160 evaluation and should be checked prior to running the EN50160 recorders. -
Page 114: En50160 Evaluation Limits And Options
Chapter 5 Configuring the EM720 Configuring the EN50160 Recorders can be selected independently from the EN50160 compliance evaluation. You can upload and view the harmonics survey data collected by your device via PAS reports or via common PAS data logs views. - Page 115 Chapter 5 Configuring the EM720 Configuring the EN50160 Recorders To configure the PQ recorder: 1. Select Memory/Log from the Meter Setup menu, and then click on the EN50160 PQ Recorder tab. 2. Adjust thresholds and hysteresis for PQ triggers if required.
- Page 116 Chapter 5 Configuring the EM720 Configuring the EN50160 Recorders Option Range Default Description PQ Log Threshold, % 0-200.0% Defines the operating threshold for a PQ trigger in percent of the nominal (reference) value Hysteresis, % 0-50.0% Defines the hysteresis for a PQ trigger in percent of the threshold Enabled Checked...
-
Page 117: En50160 Harmonics Limits Setup
Chapter 5 Configuring the EM720 Configuring the EN50160 Recorders the PQ recorder, then a second longer waveform will be also recorded, synchronized with the fast transient waveform. You can temporary disable the PQ recorder in your device. To enable or disable the PQ recorder: 1. -
Page 118: En50160 Advanced Setup
Chapter 5 Configuring the EM720 Configuring the EN50160 Recorders 3. Download your setup to the device. The default EN50160 compliance limits are shown in the picture above. You can change the number of the evaluated harmonics and interharmonics via the EN50160 Advanced Setup. -
Page 119: Clearing En50160 Evaluation Counters
Chapter 5 Configuring the EM720 Configuring the EN50160 Recorders Option Range Default Description Rapid Voltage Changes Repetition Rate 1-10 Defines the maximum repetition rate in variations per hour (equal or less than) for rapid voltage changes. Voltage changes at higher rates are not classified since they will be subject for flicker. -
Page 120: Configuring Communication Protocols
Chapter 5 Configuring the EM720 Configuring Communication Protocols Configuring Communication Protocols This section describes how to customize protocol options for use with your application software. Configuring Modbus Modbus Point Mapping The EM720 provides 120 user assignable registers in the address range of 0 to 119. You can re-map any register available in the device to any assignable register so that Modbus registers that reside at different locations may be simply accessed using a single request by re-mapping them... -
Page 121: Configuring Dnp3
Chapter 5 Configuring the EM720 Configuring Communication Protocols 4. Click Send to download your setup to the device. Configuring DNP3 DNP Options can be changed both via DNP3 and Modbus. Refer to the EM720 DNP3 Reference guide for information on the protocol implementation and a list of the available data points. - Page 122 Chapter 5 Configuring the EM720 Configuring Communication Protocols Parameter Options Default Description Analog Input Object 32-bit 16-bit -Flag The default AI object variation for requests with qualifier code 06 32-bit –Flag when no specific variation is 16-bit requested 16-bit –Flag Analog Input Change 32-bit -Time 16-bit +Time The default AI change event object...
- Page 123 Chapter 5 Configuring the EM720 Configuring Communication Protocols Scaling 16-bit AI objects Scaling 16-bit AI objects allows accommodating native 32-bit analog input readings to 16-bit object format; otherwise it may cause an over-range error if the full-range value exceeds a 16-bit point limit. Scaling is enabled by default.
- Page 124 Chapter 5 Configuring the EM720 Configuring Communication Protocols Configuring DNP Event Classes The EM720 generates object change events for any static analog input, binary input, and binary counter point when a corresponding point either exceeds a predefined threshold, or the point status changes. A total of 64 change event points are available for monitoring.
- Page 125 Chapter 5 Configuring the EM720 Configuring Communication Protocols The number of event setpoints for each static object type is specified via the DNP Options setup. NOTE The device clears all event buffers and links the default set of static points to each event object type every time you change the number of points for any of the objects.
- Page 126 Chapter 5 Configuring the EM720 Configuring Communication Protocols predefined return hysteresis – applicable for AI objects. Hysteresis for the return threshold is 0.05 Hz for frequency and 2% of the operating threshold for all other points. 4. Check the “Ev On” box for the points you wish to be included into event poll reports.
-
Page 127: Configuring Meter Passwords
Chapter 5 Configuring the EM720 Configuring Meter Passwords Configuring Meter Passwords Using the Front Display Select Access from the main menu. You should have administration rights to enter this menu. See Viewing and Changing Setup Options in Chapter 3 for information on navigating in menus. - Page 128 Chapter 5 Configuring the EM720 Configuring Meter Passwords To setup a password online: 1. From the Monitor menu, select Administration -> Change Password, and then click on the password you wish to change. 2. Enter the new password and repeat it in the following “Confirm new password”...
-
Page 129: Chapter 6 Device Control And Upgrading
Chapter 6 Device Control and Upgrading Updating the Meter Clock Chapter 6 Device Control and Upgrading This chapter describes how to perform control functions in your meter from the front panel display and via PAS. To access device control options from PAS, you should have your meter online and provide a correct password with respective permissions. -
Page 130: Clearing Device Diagnostics
Chapter 6 Device Control and Upgrading Clearing Device Diagnostics Clearing Device Diagnostics Using the Front Display See the following section Resetting Accumulators and Log Files on how to clear the device diagnostics from the front display. Using PAS PAS, both examine present device... - Page 131 Chapter 6 Device Control and Upgrading Resetting Accumulators and Log Files Access to the RESET menu entries is allowed depending on your security level as shown in the following table. Clearing files is not allowed from the front display. Reset Entry Menu Function Security Level...
-
Page 132: Remote Relay Control
Chapter 6 Device Control and Upgrading Remote Relay Control To reset the accumulation counters or to clear a file: 1. Click on the corresponding button. If a reset entry has more than one target, you are allowed to select targets from the dialog box. 2. -
Page 133: Operating Event Flags
Chapter 6 Device Control and Upgrading Operating Event Flags To enter the dialog box, select Device Control from the Monitor menu, and then click on the Remote Relay Control tab. To send a remote command to the relay: 1. From the “Relay Command” box for the relay, select the desired command. - Page 134 Chapter 6 Device Control and Upgrading Operating Event Flags EM720 Power Quality and Revenue Meter...
-
Page 135: Upgrading Meter Firmware
Chapter 6 Device Control and Upgrading Upgrading Meter Firmware Upgrading Meter Firmware You can upgrade device firmware through any communication port installed in your meter: a serial port, USB, wireless GSM/GPRS modem, or via the Internet. Downloading firmware is only supported through the Modbus RTU/ASCII and Modbus/TCP protocols. - Page 136 Chapter 6 Device Control and Upgrading Upgrading Meter Firmware 5. Wait about 10 seconds until the meter completes burning firmware into the flash and reboots before any further manipulating with the meter. NOTES 1. When the meter reboots, the Ethernet and GPRS networks are both restart, so communications may be temporarily lost.
-
Page 137: Chapter 7 Monitoring Meters
Chapter 7 Monitoring Meters Viewing Real-time Data Chapter 7 Monitoring Meters Viewing Real-time Data Real-time data is continuously retrieved from your devices and updated on the screen at the rate you defined in the Instrument Setup. To get real-time data from your device: 1. - Page 138 Viewing Real-time Data Chapter 7 Monitoring Meters Polling Devices To run data polling, click on either the Poll button Continuous Poll button on the local toolbar. Click on the Stop button to stop continuous polling. You can open as many monitor windows as you wish, either for different sites, or for the same site using different data sets.
- Page 139 Chapter 7 Monitoring Meters Viewing Real-time Data Viewing a Data Table Changing the Data View PAS displays data in either a single record or multi-record view. To change the view, click on the Data Monitor window with the right mouse button and select either Wrap to see a single record, or UnWrap to go to the multi-record view.
-
Page 140: Viewing Real-Time Min/Max Log
Viewing Real-time Min/Max Log Chapter 7 Monitoring Meters Printing Data To check the report, as it will look when printed, select Print Preview from the File menu. To print retrieved data, click on the button on the PAS toolbar, select a printer, and then click OK. Real-time Data Logging PAS allows you to store data records to a database automatically at the time it updates data on the screen. -
Page 141: Viewing Real-Time Harmonic Spectrum
Chapter 7 Monitoring Meters Viewing Real-time Harmonic Spectrum Viewing Real-time Harmonic Spectrum To retrieve real-time harmonic spectrum from your meter: 1. Check the On-line button on the PAS toolbar. 2. Select the device site from the list box on the toolbar. 3. -
Page 142: Chapter 8 Retrieving And Storing Files
Chapter 8 Retrieving and Storing Files Uploading Files on Demand Chapter 8 Retrieving and Storing Files Using PAS, you can retrieve recorded events, data and waveforms from your devices and save them to files on your PC in the Microsoft Access database format. Historical data can be uploaded on demand any time you need it, or periodically through the Upload Scheduler that retrieves data automatically on a predefined schedule, for... -
Page 143: Using The Upload Scheduler
Using the Upload Scheduler Chapter 8 Retrieving and Storing Files 6. If you wish to retrieve data starting with a known date, check the “From” box and select the start date for retrieving data. 7. If you wish to retrieve data recorded before a known date, check the “To”... - Page 144 Chapter 8 Retrieving and Storing Files Using the Upload Scheduler 3. Click Browse and select a database for storing retrieved data, or type the name for a new database, select a directory where you want to save it, and then click OK.
-
Page 145: Retrieving En50160 Statistics Files
Retrieving EN50160 Statistics Files Chapter 8 Retrieving and Storing Files Suspending the Scheduler To suspend the Upload Scheduler, check the Suspend Scheduler box at right. To activate the Upload Scheduler, leave this box unchecked. Running the Scheduler on Demand You can run the scheduler at any time outside the schedule by checking the Start Now box at right. -
Page 146: Viewing Files On-Line
Chapter 8 Retrieving and Storing Files Viewing Files On-line Viewing Files On-line Sometimes, it is useful to review a particular piece of historical data on-line at the time you expect new events to appear in the log. PAS allows you to retrieve historical data from a particular log without storing it to a file. - Page 147 Exporting Files Chapter 8 Retrieving and Storing Files 2. Select the database and a waveform or data log table you want to export, and then click Open. 3. Select a directory where you want to store your exported files, type a file name that identifies your files, select a desired file output format, and then click on the Save button.
-
Page 148: Exporting Files In Excel Format
Chapter 8 Retrieving and Storing Files Exporting Files To automatically convert your waveform or data log tables into COMTRADE or PQDIF format: 1. Open the Upload Scheduler. 2. Highlight a desired device site with the left mouse button, and then click on the Export button. 3. -
Page 149: Archiving Files
Archiving Files Chapter 8 Retrieving and Storing Files Each table row is provided with the device identifier that you can define in the meter database (see Creating a New Site for your Meter). Archiving Files Microsoft Access databases tend to grow fast. Databases above Gigabytes drastically... -
Page 150: Chapter 9 Viewing Files And Reports
Chapter 9 Viewing Files and Reports Operations with Files Chapter 9 Viewing Files and Reports Operations with Files Files you read from the meters are stored in one or in a number of tables in the meter database. Sections of multi- section files like waveforms, load profiles and PQ statistics files are stored in multiple tables –... -
Page 151: Working With Tables
Chapter 9 Viewing Files and Reports Viewing Options does not support this format, you may instruct PAS to drop milliseconds. To change the way PAS records and displays the timestamp: 1. Select Options from the Tools menu and click on the Preferences tab. -
Page 152: Working With Graphic Windows
Chapter 9 Viewing Files and Reports Viewing Options Working with Graphic Windows Selecting Channels To select the channels you want to view on the screen, click on the graph window with the right mouse button, select “Channels...”, check the channels you want displayed, and then click OK. - Page 153 Chapter 9 Viewing Files and Reports Viewing Options Set Marker, and then click on the point where you want to put the marker. You can also drag both markers with the mouse, or use the right and left arrow keys on your keyboard to change the marker position.
- Page 154 Chapter 9 Viewing Files and Reports Viewing Options To print a graph to a printer, click on the print button the toolbar, select a printer and click OK. EM720 Power Quality and Revenue Meter...
-
Page 155: Viewing The Event Log
Chapter 9 Viewing Files and Reports Viewing the Event Log Viewing the Event Log The Event log contains time-tagged events related to configuration changes, resets, device diagnostics, setpoint operations. The Event log is displayed in a tabular view, one event per row. - Page 156 Chapter 9 Viewing Files and Reports Viewing the Event Log Linking to Waveforms and Data Records If a setpoint is programmed for logging setpoint operation events and it could trigger waveform or data recording, PAS automatically establishes links between the event and other database records where it finds a relationship with the event.
-
Page 157: Viewing The Power Quality Event Log
Chapter 9 Viewing Files and Reports Viewing the Power Quality Event Log Viewing the Power Quality Event Log The EN 50160 PQ event log stores individual time-tagged power quality events. The PQ log file is displayed in a tabular view, one event per row. - Page 158 Chapter 9 Viewing Files and Reports Viewing the Power Quality Event Log Linking to Waveforms and Data Records PQ events for which PAS found related links are blue colored. Click on the colored ID to check a list of the event links. Click on a list item to move to the related waveform or data log records.
- Page 159 Chapter 9 Viewing Files and Reports Viewing the Power Quality Event Log Using a Zoom Changing Region Size for information on how to change the graph scale to separate closely located elements. EM720 Power Quality and Revenue Meter...
-
Page 160: Viewing The Fault Log
Chapter 9 Viewing Files and Reports Viewing the Fault Log Viewing the Fault Log The Fault recorder stores time-tagged fault events. Fault log files are displayed in a tabular view. Use the scroll bar to see the entire log contents. Working with Tables for more information on viewing options. - Page 161 Chapter 9 Viewing Files and Reports Viewing the Fault Log Linking to Waveforms and Data Records When displaying the fault report, PAS establishes links between the event and related waveforms and data log records. Fault events for which PAS finds related links are blue colored.
-
Page 162: Viewing The Data Log
Chapter 9 Viewing Files and Reports Viewing the Data Log Viewing the Data Log Data log files can be displayed in a tabular view, one data record per row, or in a graphical view as a data trend graph. Viewing Data Trend To view data in a graphical form, click on the Data Trend button on the local toolbar. -
Page 163: Viewing Waveforms
Chapter 9 Viewing Files and Reports Viewing Waveforms Viewing Waveforms Waveforms can be displayed in five different views: as overlapped waveforms on a common time axis, individual waveforms using separate time axes, as a cycle-by-cycle plot of RMS values, as a frequency chart for voltage channels, and as a harmonic spectrum in a graph or in a table view. -
Page 164: Viewing An Rms Plot
Chapter 9 Viewing Files and Reports Viewing Waveforms A waveform window displays up to 128 waveform cycles. If the waveform contains more cycles, the scroll bar appears under the waveform pane allowing you to scroll through the entire waveform. Scrolling through the Database The status bar at the bottom shows you how many records the database contains. -
Page 165: Viewing A Frequency Plot
Chapter 9 Viewing Files and Reports Viewing Waveforms Viewing a Frequency Plot Click on the button to view a cycle-by-cycle frequency plot for the sampled voltage waveforms. Viewing a Spectrum Chart Click on the button to view a spectrum chart for the selected waveform channel. - Page 166 Chapter 9 Viewing Files and Reports Viewing Waveforms EM720 Power Quality and Revenue Meter...
-
Page 167: Viewing A Spectrum Table
Chapter 9 Viewing Files and Reports Viewing Waveforms To review or change harmonic limits: 1. Click on the spectrum window with the right mouse button and select “Limits…”. 2. Select a harmonics standard, or select “Custom” and specify your own harmonic limits. 3. -
Page 168: Waveform Viewing Options
Chapter 9 Viewing Files and Reports Viewing Waveforms Waveform Viewing Options Working with Graphic Windows for more information on working with waveforms. Viewing Phasor Diagrams The phasor diagrams show you relative magnitudes and angles of the three-phase voltage and current fundamental component. -
Page 169: Viewing Synchronized Waveforms
Chapter 9 Viewing Files and Reports Viewing Waveforms currents, calculated for the point indicated by the left marker line. To enable or disable the symmetrical components, click on the waveform window with the right mouse button, select “Options...”, check or uncheck the “Symmetrical components” box on the “Channels”... - Page 170 Chapter 9 Viewing Files and Reports Viewing Waveforms 4. Click on the “Channels” button and select channels for each site. 5. Click OK. To change the channels, click on the waveform window with the right mouse button and select “Channels...”. EM720 Power Quality and Revenue Meter...
-
Page 171: Viewing En50160 Statistics Reports
Chapter 9 Viewing Files and Reports Viewing EN50160 Statistics Reports Viewing EN50160 Statistics Reports Viewing the EN50160 Compliance Report To get the EN50160 Compliance report, select “EN50160 Compliance Statistics” from the Reports menu, point to the database where you stored the retrieved statistics data, uncheck the voltage characteristics’... - Page 172 Chapter 9 Viewing Files and Reports Viewing EN50160 Statistics Reports Selecting the Time Range To change the time range or contents of the report, click on the report with the right mouse button, select “Options…”, select required time range, check voltage characteristics to be included in the report, and then click OK.
- Page 173 Chapter 9 Viewing Files and Reports Viewing EN50160 Statistics Reports Customizing Reports If you wish to add a logo image, header and footer to your reports: 1. Select “Report Setup…” from the Reports menu, or click on the report window with the right mouse button, and then select “Report Setup…”.
-
Page 174: Viewing The En50160 Online Statistics Report
Chapter 9 Viewing Files and Reports Viewing EN50160 Statistics Reports 5. Click OK. Both the header and the footer may contain more than one line of the text. Use the Enter button to move to the next line as usually. Viewing the EN50160 Online Statistics Report If you retrieved the EN50160 online statistics data, you can view the online report on the last retrieved statistics in the... -
Page 175: Appendix A Parameters For Monitoring And Logging
Appendix A Parameters for Monitoring and Logging Appendix A Parameters for Monitoring and Logging The following table lists all electricity and status parameters available for monitoring via communication ports, for data logging, and for triggering setpoints. Designation Description NONE None (stub, read as zero) SETPOINTS Setpoint Status SP1:16... - Page 176 Appendix A Parameters for Monitoring and Logging Designation Description MINUTES Minutes SECONDS Seconds MINUTE INTERVAL Minute interval: 1-5, 10, 15, 20, 30, 60 min SYMM COMP Symmetrical Components V PSEQ Positive-sequence voltage V NSEQ Negative-sequence voltage V ZSEQ Zero-sequence voltage V NSEQ UNB% Negative-sequence voltage unbalance V ZSEQ UNB%...
- Page 177 Appendix A Parameters for Monitoring and Logging Designation Description PF L3 Power factor L3 V1 THD V1/V12 voltage THD V2 THD V2/V23 voltage THD V3 THD V3/V31 voltage THD I1 THD I1 current THD I2 THD I2 current THD I3 THD I3 current THD I1 KF I1 K-Factor...
- Page 178 Appendix A Parameters for Monitoring and Logging Designation Description PF LEAD Total PF lead kW IMP Total kW import kW EXP Total kW export kvar IMP Total kvar import kvar EXP Total kvar export V AVG 3-phase average line-to-neutral/line-to-line voltage V LL AVG 3-phase average line-to-line voltage I AVG...
- Page 179 Appendix A Parameters for Monitoring and Logging Designation Description V2x phase-to-ground voltage V3x phase-to-ground voltage AVR LOW 1-Second Low Values on any Phase V LOW Low line-to-neutral/line-to-line voltage I LOW Low current kW LOW Low kW kvar LOW Low kvar kVA LOW Low kVA PF LAG LOW...
- Page 180 Appendix A Parameters for Monitoring and Logging Designation Description V UNB% Voltage unbalance I UNB% Current unbalance Auxiliary battery voltage V4x neutral-ground voltage Temp Internal temperature RMS (0.2 sec) 0.2-Second RMS Values V1/V12 voltage V2/V23 voltage V3/V31 voltage V12 voltage V23 voltage V31 voltage I1 current...
- Page 181 Appendix A Parameters for Monitoring and Logging Designation Description I1 current I2 current I3 current I4 current In current V ZERO-SEQ Zero-sequence voltage I ZERO-SEQ Zero-sequence current V UNB% Negative-sequence voltage unbalance I UNB% Negative-sequence current unbalance FREQ Frequency V PSEQ Positive-sequence voltage V ZSEQ UNB% Zero-sequence voltage unbalance...
- Page 182 Appendix A Parameters for Monitoring and Logging Designation Description I1 TDD I1 TDD I2 TDD I2 TDD I3 TDD I3 TDD I4 TDD I4 TDD I1 KF I1 K-Factor I2 KF I2 K-Factor I3 KF I3 K-Factor I4 KF I4 K-Factor HRM TOT (10 min) 10-Minute Total Harmonics V1 THD...
- Page 183 Appendix A Parameters for Monitoring and Logging Designation Description I1 DMD I1 Ampere demand I2 DMD I2 Ampere demand I3 DMD I3 Ampere demand kW IMP BD kW import block demand kvar IMP BD kvar import block demand kVA BD kVA block demand kW IMP SD kW import sliding window demand...
- Page 184 Appendix A Parameters for Monitoring and Logging Designation Description REG10 SD Register #10 sliding demand ENERGY Instrumentation Total Energy kWh IMPORT kWh import kWh EXPORT kWh export kWh NET kWh net kvarh IMPORT kvarh import kvarh EXPORT kvarh export kvarh NET kvarh net kvarh Q1 kvarh quadrant Q1...
- Page 185 Appendix A Parameters for Monitoring and Logging Designation Description %HD I4 I4 Harmonic Distortions I3 %HD01 H01 Harmonic distortion I3 %HD02 H02 Harmonic distortion … I3 %HD50 H50 Harmonic distortion ANG V1 V1/V12 Harmonic Angles V1 H01 ANG H01 Harmonic angle V1 H02 ANG H02 Harmonic angle …...
- Page 186 Appendix A Parameters for Monitoring and Logging Designation Description kvar L1 H01 kvar L1 kvar L2 H01 kvar L2 kvar L3 H01 kvar L3 kVA L1 H01 kVA L1 kVA L2 H01 kVA L2 kVA L3 H01 kVA L3 PF L1 H01 Power factor L1 PF L2 H01 Power factor L2...
- Page 187 Appendix A Parameters for Monitoring and Logging Designation Description I3 KF MIN I3 K-Factor I1 TDD MIN I1 current TDD I2 TDD MIN I2 current TDD I3 TDD MIN I3 current TDD V12 MIN V12 voltage V23 MIN V23 voltage V31 MIN V31 voltage MIN TOTAL...
- Page 188 Appendix A Parameters for Monitoring and Logging Designation Description I2 TDD MAX I2 current TDD I3 TDD MAX I3 current TDD V12 MAX V12 voltage V23 MAX V23 voltage V31 MAX V31 voltage MAX TOTAL Maximum 1-Cycle Total Values kW MAX Total kW kvar MAX Total kvar...
- Page 189 Appendix A Parameters for Monitoring and Logging Designation Description … … REG10 CMD Summary register #10 cumulative maximum demand TOU PRMS TOU Parameters ACTIVE TARIFF Active TOU tariff ACTIVE PROFILE Active TOU profile TOU REG1 Billing TOU Energy Register #1 REG1 TRF1 Tariff #1 register REG1 TRF2...
- Page 190 Appendix A Parameters for Monitoring and Logging Designation Description TOU REG10 Billing TOU Energy Register #10 REG10 TRF1 Tariff #1 register REG10 TRF2 Tariff #2 register … … REG10 TRF8 Tariff #8 register TOU MAX DMD REG1 Billing TOU Maximum Demand Register #1 REG1 TRF1 MD Tariff #1 maximum demand REG1 TRF2 MD...
- Page 191 Appendix A Parameters for Monitoring and Logging Designation Description TOU MAX DMD REG6 Billing TOU Maximum Demand Register #6 REG6 TRF1 MD Tariff #1 maximum demand REG6 TRF2 MD Tariff #2 maximum demand … … REG6 TRF8 MD Tariff #8 maximum demand REG6 TRF1 CMD Tariff #1 cumulative maximum demand REG6 TRF2 CMD...
- Page 192 Appendix A Parameters for Monitoring and Logging Designation Description V2 Chg% V2 Voltage change, %Un (last 1-hour value) V2 Chg Freq Repetition rate of V2 voltage changes, 1/min V3 Chg% V3 Voltage change, %Un (last 1-hour value) V3 Chg Freq Repetition rate of V3 voltage changes, 1/min V1 Pst V1 Voltage Pst...
- Page 193 Appendix A Parameters for Monitoring and Logging Short Data Long Data Name Description Name REG1 BD SUM REG1 BLK DMD Billing summary (total) register block demand REG1 SD SUM REG1 SW DMD Billing summary (total) register sliding demand REG1 SUM REG1 Billing summary (total) energy register REG1 MD SUM REG1 DMD MAX...
-
Page 194: Appendix B Setpoint Parameters
Appendix B Setpoint Parameters Appendix B Setpoint Parameters Setpoint Triggers setpoint triggers, Appendix A Parameters for Monitoring and Logging. Setpoint Actions The available setpoint actions are listed in the following table. Setpoint Actions Action Target Description NONE No action SET EVENT FLAG Set user event flag 1-8 CLEAR EVENT FLAG Clear user event flag 1-8... -
Page 195: Appendix C Billing And Load Profile Log Files
Appendix C Billing and Load Profile Log Files Appendix C Billing and Load Profile Log Files The following tables show the record structure for the monthly and daily billing data profile and energy load profile log files. The second column shows data abbreviations used in the PAS data log reports. - Page 196 Appendix C Billing and Load Profile Log Files Field No. Designation Description TIME0 Summary (total) max. demand timestamp REG1 CMD Summary (total) cumulative max. demand TRF1 MD Tariff #1 max. demand TIME1 Tariff #1 max. demand timestamp TRF1 CMD Tariff #1 cumulative max. demand TRF2 MD Tariff #2 max.
- Page 197 Appendix C Billing and Load Profile Log Files Field No. Designation Description TRF7 CMD Tariff #7 cumulative max. demand TRF8 MD Tariff #8 max. demand TIME8 Tariff #8 max. demand timestamp TRF8 CMD Tariff #8 cumulative max. demand The number of parameters in each section is automatically configured depending on the number of actual tariffs you defined in the TOU Daily Profiles Daily Billing Profile Data Log (Data Log #16)
- Page 198 Appendix C Billing and Load Profile Log Files Field No. Designation Description TRF7 MD Tariff #7 max. demand reading TRF8 MD Tariff #8 max. demand reading The number of parameters in each section is automatically configured depending on the number of actual tariffs you defined in the TOU Daily Profiles.
-
Page 199: Appendix Den50160 Statistics Log Files
Appendix D EN50160 Statistics Log Files Appendix D EN50160 Statistics Log Files The following tables list the EN50160 evaluation parameters recorded by the device to the EN50160 statistics data log files. The second column shows data abbreviations used in the PAS data log reports. Data log file sections are highlighted in bold. - Page 200 Appendix D EN50160 Statistics Log Files Field No. Designation Description V2 Plt Max Maximum Plt on phase V2 V3 N1 Number of incidents Plt > 1% on phase V3 V3 Plt Max Maximum Plt on phase V3 Voltage Dips (indicative statistics) N11 90%/100ms Number of polyphase incidents u<90%/t<100ms N12 85%/100ms...
- Page 201 Appendix D EN50160 Statistics Log Files Field No. Designation Description N21 110%/60s Number of polyphase incidents u>110%/t<60s N22 120%/60s Number of polyphase incidents u>120%/t<60s N23 140%/60s Number of polyphase incidents u>140%/t<60s N24 160%/60s Number of polyphase incidents u>160%/t<60s N25 200%/60s Number of polyphase incidents u>200%/t<60s N31 110%/>60s Number of polyphase incidents u>110%/t>60s...
- Page 202 Appendix D EN50160 Statistics Log Files Field No. Designation Description V2 N1 20% Number of incidents u>20% on phase V2 V2 N2 50% Number of incidents u>50% on phase V2 V2 N3 100% Number of incidents u>100% on phase V2 V2 N4 150% Number of incidents u>150% on phase V2 V2 N5 200%...
- Page 203 Appendix D EN50160 Statistics Log Files Field No. Designation Description V1 H# Worst-case interharmonic component number on phase V1 V1 THD Max Worst-case interharmonic voltage THD on phase V1 V2 N1 Number of interharmonic voltage incidents on phase V2 V2 N2 Number of interharmonic voltage THD incidents on phase V2 V2 HD% Max Worst-case interharmonic magnitude on phase V2, %Un...
- Page 204 Appendix D EN50160 Statistics Log Files Field No. Designation Description %HD02 MAX Maximum H02 harmonic voltage magnitude, %Un %HD03 MAX Maximum H03 harmonic voltage magnitude, %Un … … %HD50 MAX Maximum H50 harmonic voltage magnitude, %Un V3 Harmonic Voltage THD MAX Maximum THD THDO MAX Maximum odd harmonics THD...
-
Page 205: Appendix Een50160 Evaluation And Recording
Appendix E EN50160 Evaluation and Recording Appendix E EN50160 Evaluation and Recording EN50160 Background The EN50160 European standard “Voltage characteristics of electricity supplied by public distribution systems” issued by CENELEC defines the main physical characteristics of electric energy supplied medium voltage public distribution systems under normal operating conditions. -
Page 206: Evaluation Techniques
Appendix E EN50160 Evaluation and Recording values, which are intended to provide users with information on the order of magnitude which can be expected. The following table gives the characteristics for which indicative values have been specified by the standard. Voltage Characteristic Indicative values Observation... -
Page 207: Methods Of Evaluation
Appendix E EN50160 Evaluation and Recording clears the evaluation registers and counters so that each evaluation period’s statistics is stored in a separate record. You can upload and view the online statistics data via PAS reports, using data collected since the beginning of the present evaluation interval. - Page 208 Appendix E EN50160 Evaluation and Recording Supply Voltage Variations This characteristic defines slow variations of steady state supply voltage magnitude. Method of Evaluation The basic supply voltage magnitude measurement is the RMS value of the steady state voltage over a period of 10 minutes under normal operating conditions.
- Page 209 Appendix E EN50160 Evaluation and Recording the supply voltage. Flicker is indicated by the long-term flicker severity parameter Plt, which is evaluated every 2 hours. Method of Evaluation The basic measurement is the short-term flicker severity indicator Pst, evaluated each 10 minutes by instrumentation complying with IEC 61000-4-15.
- Page 210 Appendix E EN50160 Evaluation and Recording Indicative Values Under normal operating conditions the expected number of voltage dips in a year may be from up to a few tens to up to one thousand. The majority of voltage dips have a duration less than 1 s and a depth less than 60%.
- Page 211 Appendix E EN50160 Evaluation and Recording The overvoltage threshold can be changed in the meter via the EN50160 PQ Recorder setup. The basic voltage measurement is one-cycle RMS voltage updated each half-cycle. Statistical Survey The EM720 provides the statistical evaluation of temporary overvoltages using classification...
- Page 212 Appendix E EN50160 Evaluation and Recording component expressed in percent of the positive sequence component. Voltage unbalance is not evaluated if the supply voltage crosses a voltage tolerance limit (±15% Un). Target Values The range of voltage unbalance given in the EN50160 is: 2% ( 3% in some areas) for 95% of a week ≤...
- Page 213 Appendix E EN50160 Evaluation and Recording distortion factor (THD) over a period of 10 minutes under normal operating conditions. Interharmonic voltages are evaluated by instrumentation complying with IEC 61000-4-7. All calculations are made relative to the nominal voltage. highest harmonic order evaluating individual...
- Page 214 Appendix E EN50160 Evaluation and Recording Signaling voltages are not evaluated if the supply voltage crosses a voltage tolerance limit (±15% Un). Target Values The voltage levels given by the EN50160 in Figure 1 of Clause 2.13 are taken from the so-called “Meister-curve” which defines the maximum permissible ripple control voltages in LV networks.
- Page 215 Appendix F Data Scales Appendix F Data Scales The maximum values for volts, amps and powers in the EM720 setup and in communications are limited by the voltage and current scale settings. See Device Options and Mode Control in Chapter 5 on how to change the voltage and current scales in your meter.
- Page 216 Appendix G Device Diagnostic Codes Appendix G Device Diagnostic Codes Diagnostic Display Message Description Reason Code RAM/Data fault RAM/Data error Hardware failure Watchdog reset Hardware watchdog reset Hardware failure Sampling fault DSP/Sampling fault Hardware failure CPU exception CPU exception Hardware failure Run-time error Run-time error Hardware failure...
- Page 217 Appendix H OBIS Identification Codes Appendix H OBIS Identification Codes The OBIS (Object Identification System IEC 62056-61) codes are used to identify energy and maximum demand readings in the IEC 62056-21 protocol (see the EM720 IEC 62056-21 Reference Guide) and in the billing data displays on the EM720 front display.
- Page 218 Appendix H OBIS Identification Codes OBIS Code Unit Description 1.6.0 kW/MW kW import maximum demand, total 1.6.1-1.6.8 kW/MW kW import maximum demand, tariff 1-8 2.6.0 kW/MW kW export maximum demand, total 2.6.1-2.6.8 kW/MW kW export maximum demand, tariff 1-8 3.6.0 kvar/Mvar kvar import maximum demand, total 3.6.1-3.6.8...
Need help?
Do you have a question about the expertmeter EM720 and is the answer not in the manual?
Questions and answers