Table of Contents
Advertisement
Quick Links
Advertisement
Table of Contents

Related Manuals for Tektronix PRISM


Summary of Contents for Tektronix PRISM
- Page 1 PRISM Media Analysis Platform User Manual *P077129003* 077-1290-03...
- Page 3 PRISM Media Analysis Platform User Manual Revision A This document supports software version 1.5 and above. www.tek.com 077-1290-03...
- Page 4 Copyright © Tektronix. All rights reserved. Licensed software products are owned by Tektronix or its subsidiaries or suppliers, and are protected by national copyright laws and international treaty provisions. Tektronix products are covered by U.S. and foreign patents, issued and pending. Information in this publication supersedes that in all previously published material.
- Page 5 Tektronix, with shipping charges prepaid. Tektronix shall pay for the return of the product to Customer if the shipment is to a location within the country in which the Tektronix service center is located. Customer shall be responsible for paying all shipping charges, duties, taxes, and any other charges for products returned to any other locations.
- Page 6 2. Transfer the Program to any person or organization outside of Customer or the corporation of which Customer is a part without the prior written consent of Tektronix, except in connection with the transfer of the equipment within which the programs are encoded or incorporated;...
-
Page 7: Limited Warranty
The license granted herein is effective upon acceptance by Customer, and shall remain in effect until terminated as provided herein. The license may be terminated by Customer at any time upon written notice to Tektronix. The license may be terminated by Tektronix or any third party from whom Tektronix may have obtained a respective licensing right if Customer fails to comply with any term or condition and such failure is not remedied within thirty (30) days after notice hereof from Tektronix or such third party. - Page 8 Customer without the prior written consent of Tektronix. This Agreement and the license granted herein shall be governed by the laws of the state of Oregon. All questions regarding this Agreement or the license granted herein should be directed to the nearest Tektronix Sales Office.
-
Page 9: Table Of Contents
How to set the time and date ................How to upgrade the instrument firmware ..............How to upgrade the software license ............... How to verify the installed software and hardware versions..........Functions ......................Headphone/speaker volume and source adjustment ............PRISM Media Analysis Platform User Manual... - Page 10 PTP introduction .................... The five basic PTP timing messages..............Profiles and domains ..................One-step and two-step operation ................Multicast, Unicast, and Mixed Communication modes ..........BMCA operation.................... Compensating for causes of asymmetric delay ............Index PRISM Media Analysis Platform User Manual...
- Page 11 Figure 12: Connecting the instrument to a PC (MPI monitor shown) ........Figure 13: Setting network parameters ................. Figure 14: PRISM MPI rear panel................Figure 15: PRISM MPX rear panel ................Figure 16: Elements of the display (MPI monitor shown) ............ Figure 17: Messages icon with one message ..............
- Page 12 Figure 54: Upgrade Installation Complete message box............Figure 55: PRISM License Installation Web page – initial view..........Figure 56: PRISM License Installation Web page – license upgrade information review ....Figure 57: PRISM License Installation Web page – license install message .......
- Page 13 Figure 114: IP Graphs application – Video CRC Error and TS-DF graphs ....... Figure 115: IP Graphs application – Path1–Path2 Differential graph ........Figure 116: Seamless protection switching of SMPTE ST-2022-7 IP stream ......Figure 117: PIT Histogram application display .............. PRISM Media Analysis Platform User Manual...
- Page 14 Table of Contents Figure 118: PIT Histogram application banner .............. Figure 119: PTP Graphs application banner..............Figure 120: PTP Graphs application settings menu ............Figure 121: PTP Master-Slave Delay and Variation graphs ..........PRISM Media Analysis Platform User Manual...
- Page 15 Table 1: Clearance requirements for the dual rack cabinet ............ Table 2: Supplied hardware ..................Table 3: Keyboard controls for selecting SDI inputs and instrument presets ....... Table 4: Instrument settings that are reset by recalling the Factory preset ........PRISM Media Analysis Platform User Manual...
-
Page 16: Important Safety Information
Read the safety sections of the other component manuals for warnings and cautions related to operating the system. When incorporating this equipment into a system, the safety of that system is the responsibility of the assembler of the system. viii PRISM Media Analysis Platform User Manual... - Page 17 Do not operate in wet/damp conditions. Be aware that condensation may occur if a unit is moved from a cold to a warm environment. Do not operate in an explosive atmosphere. Keep product surfaces clean and dry. Remove the input signals before you clean the product. PRISM Media Analysis Platform User Manual...
-
Page 18: Service Safety Summary
Be sure your work area meets applicable ergonomic standards. Consult with an ergonomics professional to avoid stress injuries. Use only the Tektronix rackmount hardware specified for this product. Service safety summary The Service safety summary section contains additional information required to safely perform service on the product. -
Page 19: Terms In This Manual
find out the nature of the potential hazards and any actions which have to be taken to avoid them. (This symbol may also be used to refer the user to ratings in the manual.) The following symbol(s) may appear on the product: PRISM Media Analysis Platform User Manual... - Page 20 Important safety information PRISM Media Analysis Platform User Manual...
-
Page 21: Preface
Preface Preface This manual contains information to help you use the Tektronix PRISM Media Analysis Platform. This information includes the following: How to operate the instrument using the front panel, external mouse/keyboard/display, or remote connection. How to use the various displays for monitoring SDI or IP video signals. -
Page 22: Conventions Used In This Manual
Preface Conventions used in this manual The PRISM Media Analysis Platform is also referred to as the “PRISM monitor” throughout this manual. The terms "press and hold" are used throughout this document and applies to the touchscreen on the MPI or MPX instrument. If you are using a mouse and keyboard with the instrument you must click and hold the mouse buttons. -
Page 23: Getting Started
Getting started This section will help you set up and begin to use the PRISM Media Analysis Platform. It is divided into the following subsections: Product description describes your instrument and provides a list of key features. Controls and connectors shows you how to verify that you have received all of the parts of your instrument and provides a list of standard and optional accessories and a list of options that are available for your instrument. - Page 24 PRISM model form factors The PRISM Media Analysis Platform is available in two form factors: MPI. The PRISM MPI is 3RU half rack with integrated 9 inch HD display and touch panel. MPX. The PRISM MPX is 1RU full rack width. The MPX requires an external monitor.
- Page 25 Monitor PTP trend graphs to ensure proper IP system setup for robust sync system Tektronix patented Timing display showing the relative timing of the input signal and PTP reference that makes facility timing easy 1 PPS output when the instrument is locked to a PTP reference...
- Page 26 BT.709 vector locations and verify wide color gamut compatibility to BT.709 color gamut Flexible display configuration with Full / Quad / Vertical extended tile modes 12G-SDI physical layer measurements to check SDI signal quality and integrity PRISM Media Analysis Platform User Manual...
-
Page 27: Rackmount Installation
USB ports and a headphone jack for one MPI monitor. MPX monitor For the PRISM MPX monitor, there is an optional 1RU full-rack kit that can be used for either portable or rackmount applications. MPX RACK. Allows you to install one PRISM 1RU full width MPX RACK. -
Page 28: Table 2: Supplied Hardware
SCREW, MACHINE; 10-32X.750 OVAL HEAD, POZI 381-0251-01 NUT BAR; 10-32 X 3.0 X 0.375 X 0.120 407-3752-00 BRACKET, EXT; 2.5 X 8.06 X 0.06, STEEL; SAFETY CONTROLLED 407-6011-00 RACK MOUNT, INSTRUMENT MTG BRACKET, 5000 SERIES PRISM Media Analysis Platform User Manual... - Page 29 7. Repeat steps 5 and 6 to install the second guide bracket to the other side of the cabinet. 8. Tighten all of the attaching screws that were left loose in the previous steps. PRISM Media Analysis Platform User Manual...
-
Page 30: Figure 1: Installing One Mpi Monitor And One Wfm52X0 Waveform Monitor In The Mpi-Rack-Mw Dual
Getting started Figure 1: Installing one MPI monitor and one WFM52x0 waveform monitor in the MPI-RACK-MW dual rack cabinet PRISM Media Analysis Platform User Manual... -
Page 31: Figure 2: Installing One Mpi Monitor And One Wfm7200 Or Wfm8X00 Waveform Monitor In The Mpi-Rack-Mw Dual Rack Cabinet
Getting started Figure 2: Installing one MPI monitor and one WFM7200 or WFM8x00 waveform monitor in the MPI-RACK-MW dual rack cabinet PRISM Media Analysis Platform User Manual... -
Page 32: Figure 3: Installing Two Mpi Monitors In The Mpi-Rack-Mm Dual Rack Cabinet
Getting started Figure 3: Installing two MPI monitors in the MPI-RACK-MM dual rack cabinet PRISM Media Analysis Platform User Manual... -
Page 33: Figure 4: Connecting The Rack Cabinet Usb And Audio Cables To The Mpi Monitor
USB cables to either set of USB ports on the rear panel. d. Connect power, signal, and Ethernet cables to the instrument as needed. See the PRISM Installation and Safety Instructions manual for information about making signal connections to the instrument. -
Page 34: Mpi Power-On And Power-Off Procedures
3. For the MPI-RACK-MW cabinet only: a. Install a Tektronix WFM52x0, WFM7200, or WFM8x00 waveform monitor in the right slot of the dual rack cabinet. (See Figure 1.) (See Figure 2.) b. -
Page 35: Figure 5: Connecting Power To The Mpi Monitor
Getting started Figure 5: Connecting power to the MPI monitor PRISM Media Analysis Platform User Manual... -
Page 36: Figure 6: Disconnecting The Power Cord From The Mpi Monitor
2. Press the Power/Standby button on the instrument front panel to turn the instrument on. NOTE. The Power/Standby button illuminates during the power-on sequence and then turns off during normal instrument operation. PRISM Media Analysis Platform User Manual... -
Page 37: Figure 7: Mpi Power/Standby Button
AC adapter be disconnected from the AC power source before the adapter is disconnected from the instrument. 2. To completely remove power from the MPI monitor, disconnect the power cord from the instrument. (See page 14, MPI power cord removal.) PRISM Media Analysis Platform User Manual... -
Page 38: Mpx Power-On And Power-Off Procedures
flat portion of the power cord housing facing the left of the instrument (as viewed from the rear). When fully inserted, the power cord housing latches on the instrument power connector. Figure 8: Connecting power to the MPX monitor PRISM Media Analysis Platform User Manual... -
Page 39: Figure 9: Mpx Power/Standby Button
2. To completely remove power from the instrument, disconnect the power cord from the instrument. The power cord has a locking mechanism to keep it attached to the instrument. Push the button on the cord housing to release the locking mechanism. PRISM Media Analysis Platform User Manual... -
Page 40: Sfp+ Module Installation
SFP+ connector as shown above (optical SFP+ module shown). NOTE. An optical SFP+ module is shown below. Other types of SFP+ modules may have different latching mechanisms. Figure 10: Installing and removing an optical SFP+ module on an MPI monitor PRISM Media Analysis Platform User Manual... -
Page 41: Figure 11: Installing And Removing An Optical Sfp+ Module On An Mpx Monitor
SFP+ module in a anti-static bag or container. To prevent possible damage to the PRISM monitor and SFP+ modules, remove the SFP+ modules before transporting the PRISM monitor. PRISM Media Analysis Platform User Manual... -
Page 42: Network Installation
Getting started Network installation See the PRISM Installation and Safety Instructions manual that shipped with your instrument for basic installation instructions. After your instrument is physically installed, you might want to connect it directly to a PC or to a network. The following information can help you do that. -
Page 43: Figure 13: Setting Network Parameters
To connect your instrument to a network and access it with a remote PC, do the following: 1. On the PRISM monitor, touch the Settings icon to display the Settings menu. 2. Touch Network to open the Network submenu. 3. Touch CONTROL IP PORT to open the Control IP Port submenu. -
Page 44: Mpi Rear Panel Connectors
Getting started MPI rear panel connectors The following figure shows the external connections to the instrument. A description of each connector is provided in the following table. Figure 14: PRISM MPI rear panel Item number (See Figure 14.) Description SDI IN 1-2. Two BNC inputs that can operate in the following modes: Single SD/HD/3G/12G-SDI link (Option MP-FMT-4K is required for 12G support). - Page 45 firmware, or saving screen and stream captures. USB ports. USB 3.0 ports for connecting a mouse and keyboard, importing or exporting instrument presets, or for upgrading the instrument firmware. Audio input. This connector is for future use. PRISM Media Analysis Platform User Manual...
- Page 46 Getting started Item number (See Figure 14.) Description Audio output. 3.5 mm line out port for using headphones with the selected audio channel pair. Mic input. This connector is for future use. PRISM Media Analysis Platform User Manual...
-
Page 47: Mpx Rear Panel Connectors
A description of each connector is provided in the following table. See Front panel controls and connectors for information about the front panel connectors. (See page 33.) Figure 15: PRISM MPX rear panel Item number (See Figure 15.) Description AC power input. - Page 48 USB ports. Four USB 3.0 ports for connecting a mouse and keyboard, importing or exporting instrument presets, upgrading the instrument firmware, or saving screen and stream captures. DVI port. DVI port output for an external monitor. The output video format is 1920 x 1080. PRISM Media Analysis Platform User Manual...
-
Page 49: Display Elements
Application tabs. Some applications have selectable tabs (highlighted readouts) you can use to display additional information. Application tile 4. Application tile 2. The application panels can be shown in four-tile mode, side-by-side two-tile mode, or in full screen mode. PRISM Media Analysis Platform User Manual... -
Page 50: Diagnostics Report
2. Select Utilities to open the Utilities submenu. 3. Select Diagnostics to open the Diagnostics submenu. 4. Insert a USB device into one of the USB ports on the PRISM monitor. 5. Select Save Diagnostics to save the diagnostics report to the USB device. -
Page 51: Message Center
Figure 18: Message Center popup window 3. Select the Eject icon ( ) to unmount the USB stick from the instrument. 4. Select the Messages icon again to hide the Message Center popup window. PRISM Media Analysis Platform User Manual... - Page 52 Getting started PRISM Media Analysis Platform User Manual...
-
Page 53: Methods Of Operation
Remote control via VNC Remote control via API commands MPI touchscreen operation The following figure shows the instrument display with an open menu for one of the applications. Figure 19: Four-tile display with menu selection PRISM Media Analysis Platform User Manual... -
Page 54: Figure 20: Selecting An Application To Display
You may need to scroll down through the list to access all of the applications. Figure 20: Selecting an application to display 3. Swipe the application list up or down to locate the desired application. 4. Touch the name of the desired application to display that application. PRISM Media Analysis Platform User Manual... -
Page 55: Mpx Front Panel Controls
When you use the PRESET and INPUT buttons, the associated menus appear on the display. The menus close after a short time-out period. Similarly, when you use the VOLUME control, the volume slider and mute controls appear on the display and close after a short time-out period. PRISM Media Analysis Platform User Manual... - Page 56 How to select an input to monitor (MPX). Perform the following steps to recall instrument presets using the front panel: 1. Press the INPUT button to prepare the instrument for an input selection. 2. Press the SELECTIONS numbered button corresponding to the input you want to monitor. PRISM Media Analysis Platform User Manual...
-
Page 57: Keyboard And Mouse Operation
Selects Input 4 or selects Preset 4 from the selected preset group. Select 5 Selects Input 5 or selects Preset 5 from the selected preset group. Select 6 Selects Input 6 or selects Preset 6 from the selected preset group. PRISM Media Analysis Platform User Manual... -
Page 58: External Touchscreen Display Operation
PRISM monitor. Remote control via VNC operation When the PRISM monitor is connected to an Ethernet network, you can use a computer connected to the same network to remotely control the instrument in a web browser or in a VNC client such as VNC Viewer. Use the following steps to connect to the PRISM monitor via VNC: NOTE. - Page 59 3. This opens a login Web page as shown below. 4. In the Control bar, click the Settings icon to open the Settings dialog. 5. In the Settings dialog, use the Scaling Mode drop-down list to select Local Scaling, and then click Apply. PRISM Media Analysis Platform User Manual...
- Page 60 Methods of operation 6. In the Control bar, click the Connect icon to open the Connect dialog. 7. In the Settings dialog, enter the default password PRISM (case sensitive), and then click Connect. NOTE. You can use the WEB REMOTE tab of the PRISM Settings > Network menu to change the default password for the remote Web connection.
-
Page 61: Remote Control Via Api Commands
Use the following steps to access the API documentation: 1. On the PRISM monitor, open the Settings > Network page to view the Control IP Port address of the instrument to which you are going to connect. -
Page 62: How To Configure The Instrument
How to configure and select signal inputs The PRISM monitor allows you to configure multiple signal inputs. Use the Settings > Inputs menu to: Configure SDI inputs Configure IP stream inputs, including ST2022-6, ST2110-20/30, and ASPEN... -
Page 63: Figure 23: Settings Menu
In the following figure are six virtual inputs to choose from. Inputs can be given any meaningful name, (See page 47, To rename a signal input.) Figure 24: Settings inputs submenu 3. Select an SDI input. PRISM Media Analysis Platform User Manual... -
Page 64: Figure 25: Single Sdi Signal Configuration
4. Select Single for the Input Configuration and select one of the four physical SDI inputs to monitor. The example shows the SDI 1 input being selected. Figure 25: Single SDI signal configuration 5. Select Save and close the menu. PRISM Media Analysis Platform User Manual... -
Page 65: Figure 26: Quad Link Sdi Signal Configuration
2. Select Quad Link for the Input Configuration. SDI 1-4 (Link A-D) is selected by default. Figure 26: Quad Link SDI signal configuration NOTE. The Quad Link and UHD/4K Mode buttons are only available when software option MP-FMT-4K is present. PRISM Media Analysis Platform User Manual... - Page 66 SMPTE 292.1, SMPTE 372, SMPTE 425.1, or a quad-HD signal is present and VPID is missing. VPID in the signal is required for this option to operate properly. 4. Select Save and close the menu. PRISM Media Analysis Platform User Manual...
- Page 67 2. Select the color space of the video signal using the Color Gamut drop-down menu. Rec. 709. Standard for HD. Rec. 2020. Standard for 4K. NOTE. Rec. 601 gamut is automatically selected when the SD format is detected / selected in the video signal. PRISM Media Analysis Platform User Manual...
-
Page 68: Figure 27: Sdi Signal Settings
How to configure the instrument Figure 27: SDI signal settings 3. Select Save and close the menu. PRISM Media Analysis Platform User Manual... -
Page 69: Figure 28: Renaming A Signal Input
Use the 123 and abc keys to toggle between accessing letters and numbers/symbols. 3. When you are done editing the input name, touch the Enter key. 4. When you are done editing the input, touch Save to save your changes. PRISM Media Analysis Platform User Manual... -
Page 70: Figure 29: Ip Input Protocols And St2022-7 Seamless Switching
SPF port that is used to input the 10GbE signal. Path 1 and Path 2 are the signal paths to be used for seamless switching. This differentiation is being made since it is possible for both Path 1 and Path 2 to use a single Port. PRISM Media Analysis Platform User Manual... -
Page 71: Figure 30: Editing Parameter Fields
7. Scroll down to enter the Source and Destination information for Path 2. NOTE. If ST2022-7 Seamless Switching is set to Disabled only Path 1 is available, Path 2 will be grayed out. 8. Select Save and close the menu. PRISM Media Analysis Platform User Manual... -
Page 72: Figure 31: Configure Aspen Stream
Encapsulation) streams, follow the instructions (See page 52, Input selection.) and then: Figure 31: Configure ASPEN stream 1. Select ASPEN. 2. Enter the Source and Destination information. 3. Enter the Video PID, the default is 361. 4. Select Save and close the menu. PRISM Media Analysis Platform User Manual... - Page 73 2. Select the color space of the video signal using the Color Gamut drop-down menu. Rec. 709. Standard for HD. Rec. 2020. Standard for 4K. NOTE. Rec. 601 gamut is automatically selected when the SD format is detected / selected in the video signal. PRISM Media Analysis Platform User Manual...
-
Page 74: Figure 32: Ip Signal Settings
Input selection To select a configured input, perform these steps: 1. Touch the Input icon ( ) from the Status bar at the bottom of the PRISM monitor. 2. Select a configured input from list in the bottom bar. Figure 33: List of the configured inputs 3. -
Page 75: How To Configure The Instrument For Hdr / Wcg Monitoring
How to configure the instrument How to configure the instrument for HDR / WCG monitoring PRISM provides HDR / WCG monitoring features that set up and balance cameras in HDR / WCG during content creation. Before using these features, configure the signal input (See page 40, How to configure and select signal inputs.) Use... -
Page 76: Figure 35: Stop Display With Stop Scale
Display Light show a Nits graticule in the vertical axis and is fixed regardless Gamma selected. It is used for mastering the content for a targeted HDR system. Figure 35: Stop Display with Stop scale PRISM Media Analysis Platform User Manual... -
Page 77: Figure 36: Vector Display With (Right) And Without (Left) 3D Lut Enabled, 100% Color Bar In
BT. 709 Gamma / Gamut displays. The conversion between input video and linear light is processed in Scene light. Figure 36: Vector display with (right) and without (left) 3D LUT enabled, 100% color bar in PQ/BT.2020 PRISM Media Analysis Platform User Manual... -
Page 78: How To Configure Ptp Reference Settings
Multicast and Unicast. NOTE. On the SMPTE profile mixed mode, the PTP Announce and Sync messages are sent as Multicast. However, the Delay request and Delay Response messages are sent as Unicast. PRISM Media Analysis Platform User Manual... -
Page 79: Figure 38: Editing The Ptp Domain Setting
Use the backspace key to delete characters by backspacing over them. 8. When you are done editing the domain number, touch the Enter key. 9. Repeat steps 4 to 6 for each PTP profile. PRISM Media Analysis Platform User Manual... -
Page 80: How To Set And Recall Instrument Presets
IP configuration, and network address. The following is an overview of the settings saved in a Preset. Some settings are option dependant. Application assigned to each tile Application specific settings Input selection and configuration PTP reference settings PRISM Media Analysis Platform User Manual... -
Page 81: Figure 39: Preset Selection Controls (Group B Shown)
The selected preset button will highlight and a confirmation box will appear. In the example shown below, the Group B preset B6 is being saved. PRISM Media Analysis Platform User Manual... -
Page 82: Figure 40: Assigning A Preset
Preset<number>, where the number is the preset position within the preset group. (See Figure 43.) Touch the Home icon ( ) or touch anywhere within an application tile to close the Preset selection controls. PRISM Media Analysis Platform User Manual... -
Page 83: Figure 41: Presets Rename Submenu
Select Rename to open the Presets Rename submenu shown below. Figure 41: Presets Rename submenu d. Select the Preset group at the top of the submenu that corresponds to the preset you just saved. The example above shows Group B being selected. PRISM Media Analysis Platform User Manual... -
Page 84: Figure 42: Editing A Preset Name
When you are done editing the preset name, touch the Enter key. NOTE. You can also assign a user-defined name to the selected preset group by touching inside the Group Name box. PRISM Media Analysis Platform User Manual... -
Page 85: Figure 43: Preset Selection Controls (Group B Shown)
The selected preset button will highlight and the instrument settings will change to those assigned to the selected preset. 4. Touch the Home icon ( ) or touch anywhere within an application tile to close the Preset selection controls. PRISM Media Analysis Platform User Manual... -
Page 86: Table 4: Instrument Settings That Are Reset By Recalling The Factory Preset
Tile 3 application Picture Tile 4 application Audio SDI-In 1 input configuration SDI-In 1 Input name Input type SDI 1 Input connector SDI-In 2 input configuration SDI-In 2 Input name Input type SDI 2 Input connector PRISM Media Analysis Platform User Manual... - Page 87 Input connector SDI-SFP+ 2 input configuration SDI-SFP+ 2 Input name Input type None selected Input connector PTP reference configuration Enabled PTP Logging to the Event Log ST2059 Selected Profile ST2059 domain Multicast ST2059 communication mode PRISM Media Analysis Platform User Manual...
-
Page 88: How To Manage Tile Display
Press and hold a tile to open the application banner and use the following icons to re-size the application. Use the minimize icon ( ) to exit full screen mode. Use the collapse icon ( ) to collapse the tile vertically. Figure 45: Four quarter screen tiles PRISM Media Analysis Platform User Manual... -
Page 89: Figure 46: One Half Screen Tile And Two Quarter Screen Tiles
Press and hold on a tile to open the application banner and use the expand icon ( ) to expand the tiles vertically. Figure 46: One half screen tile and two quarter screen tiles Figure 47: Two half screen tiles showing vector and waveform displays. PRISM Media Analysis Platform User Manual... -
Page 90: Figure 48: Full Screen Tile
Double tap on the application to toggle it between full screen and quarter/half screen mode. Alternately, press and hold one tile to open the application banner and use the maximize icon ( ) to expand the tile to the full screen. Figure 48: Full screen tile PRISM Media Analysis Platform User Manual... -
Page 91: How To Set The Time And Date
6. In the TIME AND DATE tab, adjust the time and date using the up and down arrows to adjust each parameter as needed. The time setting uses a 24 hour clock, so no AM/PM setting is required. PRISM Media Analysis Platform User Manual... -
Page 92: Figure 50: Time And Date Submenu
Perform one of the following actions: Touch OK to reboot the instrument immediately and implement the changes. Touch Cancel to cancel the operation. Figure 51: Time and date change reboot message PRISM Media Analysis Platform User Manual... -
Page 93: How To Upgrade The Instrument Firmware
Instrument Firmware version number 3. Verify the latest version of firmware at the Tektronix Web site: a. Use the Web browser on a PC to navigate to the following Tektronix Web site: http://www.tektronix.com/downloads b. On the Downloads Finder Web page, search by model number (such as PRISM) and filter by software and software type to locate the... -
Page 94: Figure 52: Selecting The Firmware Upgrade File
Once the instrument has started the upgrade process, DO NOT remove power from the instrument. If you do so, the instrument flash will be corrupted. The instrument will have to be sent to a Tektronix factory service center to have the system firmware restored. -
Page 95: Figure 53: Upgrade Installation In Process Message Box
Figure 53: Upgrade Installation In Process message box 8. When the upgrade is complete, the following message box appears. Perform one of the following actions: Touch Reboot Now to reboot the PRISM monitor and complete the installation of the upgrade. NOTE. -
Page 96: How To Upgrade The Software License
MP-IP-CAP-UP. Requires Option MP-IP-MEAS. Adds node locked license for IP stream capture. MP-PROD-UP. Adds node locked license for Production Tools (Stop display, 3D LUT function). MP-FMT-4K-UP. Enables 12G-SDI. Adds node locked license for 4K formats. PRISM Media Analysis Platform User Manual... - Page 97 Perform the following procedure to obtain a software license upgrade file from Tektronix: upgrade file 1. On the PRISM monitor you want to upgrade, make a note of the instrument serial number. The serial number is located on the instrument rear panel. NOTE.
-
Page 98: Figure 55: Prism License Installation Web Page – Initial View
Perform the following procedure to install the software license upgrade: upgrade 1. On the PRISM monitor, open the Settings > Network menu page to view the Control IP Port address of the instrument which you are going to upgrade. 2. Copy the software license upgrade file you downloaded to a location on the hard drive of your computer. -
Page 99: Figure 56: Prism License Installation Web Page – License Upgrade Information Review
Review license information box. The example below shows an instrument that is being upgraded with two software options: MP-IP-STD and MP-IP-MEAS. Figure 56: PRISM License Installation Web page – license upgrade information review 8. If the license information is correct, click Install to start the license installation. -
Page 100: Figure 57: Prism License Installation Web Page – License Install Message
How to configure the instrument Figure 57: PRISM License Installation Web page – license install message 10. After the upgrade is installed, close the PRISM License Installation Web page. PRISM Media Analysis Platform User Manual... -
Page 101: Figure 58: Verifying The Software License Upgrade
2. Touch Utilities icon to open the Utilities submenu. 3. Touch Options to open the Options display. 4. Verify that the displayed option(s) match the option(s) you installed. Figure 58: Verifying the software license upgrade PRISM Media Analysis Platform User Manual... -
Page 102: How To Verify The Installed Software And Hardware Versions
How to configure the instrument How to verify the installed software and hardware versions The PRISM monitor allows you to view all the installed software and hardware versions on the instrument. Use the following steps to access this information: NOTE. -
Page 103: Functions
Headphone/speaker volume and source adjustment Stream Capture Headphone/speaker volume and source adjustment Headphones or speakers can be connected to the PRISM MPI Monitor or the MPX. To access the volume control and source: 1. Select the volume icon. 2. Select the source from the list of available channel pairs. -
Page 104: Capture
Requirements to use the Capture feature: MP-IP-CAP option must be installed for stream captures. USB 3.0 stick connected to the rear panel of the PRISM monitor. NOTE. A USB 3.0 stick, plugged into one of the USB 3.0 ports is strongly recommended when using the Stream Capture feature. -
Page 105: Figure 62: Application Bar Capture
3. On the application bar select the Capture icon. A screenshot is saved to the device. Figure 62: Application bar Capture How to take a stream 1. Verify there is a USB stick connected to the PRISM monitor. capture 2. Select the Settings icon. -
Page 106: Figure 64: Stream Size Settings
NOTE. Select the Capture icon again to stop the stream capture early. The Capture icon is the only element you can interact with on the PRISM monitor while the capture and save are taking place. 9. A screenshot and .pcap file are saved to an attached USB device. The monitor will display the name of the file and the path to the file on the USB device... -
Page 107: Application Information
Application information Application information This section describes each of the available applications on the PRISM monitor. All applications can be viewed in four-tile mode and full-screen mode. Double tap in an application to toggle between these two modes. NOTE. Some displays require a specific option to be installed. For example, the IP Status display is not accessible unless you have Option MP-IP-STD. - Page 108 Diamond application. Use this application to reliably detect invalid colors. (See page 96, Diamond display application .) Convert to Rec. 709. Use this setting to allow the trace displays to convert camera logs to Rec. 709. PRISM Media Analysis Platform User Manual...
- Page 109 : Indicates that the signal parameter was in an error condition but the error has now cleared. : Indicates that the signal parameter is currently in an error condition. : Indicates that the signal parameter is not being monitored for an error condition. PRISM Media Analysis Platform User Manual...
-
Page 110: Waveform Display Application
The following options adjust how the waveform is displayed: The maximize icon ( ) expands the Waveform application tile to the full screen. The minimize icon ( ) collapse the tile back to its original size. PRISM Media Analysis Platform User Manual... -
Page 111: Figure 68: Waveform Application Settings Menu
Sweep. Use the drop-down menu to select the waveforms to view between the lines or fields and/or make timing measurements on them. The available sweep options depend on which display style is active. PRISM Media Analysis Platform User Manual... - Page 112 HDR / WCG monitoring.) Show Active Area Only. Use the button to turn Show Active Area Only On or Off. When the option is On it removes the trace of vertical / horizontal blanking data. PRISM Media Analysis Platform User Manual...
-
Page 113: Stop Display Application
The following options adjust the Stop Display application: The maximize icon ( ) expands the Stop Display application tile to the full screen. The minimize icon ( ) collapse the tile back to its original size. PRISM Media Analysis Platform User Manual... -
Page 114: Figure 71: Stop Display Application Settings Menu
When the Parade display style is active you can select from 1 line or 1 field. When Overlay display style is active you can select from 1 line, 2 line, 1 field, or 2 field. PRISM Media Analysis Platform User Manual... - Page 115 Show Active Area Only. Use the button to turn Show Active Area Only On or Off. When the option is On it removes the trace of vertical / horizontal blanking data. Reference. Use the reference buttons to choose between Scene Light (Stops) and Display Light (Nits). PRISM Media Analysis Platform User Manual...
-
Page 116: Vector Application
The following options adjust how the Vector application is displayed: The maximize icon ( ) expands the Vector application tile to the full screen. The minimize icon ( ) collapse the tile back to its original size. PRISM Media Analysis Platform User Manual... -
Page 117: Figure 74: Vector Application Settings Menu
Convert to Rec. 709 auto converts to BT.709, otherwise the graticule selection must be manually changed (See page 53, How to configure the instrument for HDR / WCG monitoring.) IQ Axis. Use the button to turn the IQ Axis On or Off. PRISM Media Analysis Platform User Manual... -
Page 118: Diamond Display Application
The following options adjust how the Diamond application is displayed: The maximize icon ( ) expands the Diamond application tile to the full screen. The minimize icon ( ) collapse the tile back to its original size. PRISM Media Analysis Platform User Manual... -
Page 119: Figure 77: Diamond Application Settings Menu
Gamma and Color Gamut settings for the signal to SDR Narrow and BT. 709 (requires Option MP-PROD). NOTE. Convert to Rec. 709 auto converts to BT.709, otherwise the graticule selection must be manually changed (See page 53, How to configure the instrument for HDR / WCG monitoring.) PRISM Media Analysis Platform User Manual... -
Page 120: Figure 78: Diamond Display Plot
Compare the signal to the display to determine out-of-gamut components. Note the following: The intensity of a vector indicates its duration. A momentary out-of-gamut condition appears as a faint trace. Long duration violations show as a bright trace. PRISM Media Analysis Platform User Manual... -
Page 121: Figure 79: Out-Of-Gamut Examples
Monochrome signals appear as vertical lines. Nonlinear component processing, such as from a gamma corrector that alters white balance, can cause deviations along the vertical axis. PRISM Media Analysis Platform User Manual... -
Page 122: Eye Display Application
Figure 80: Eye Display application display Eye Display application The following figure shows the available options after pressing and holding anywhere on the Eye Display application tile. banner Figure 81: Eye Display application banner PRISM Media Analysis Platform User Manual... -
Page 123: Figure 82: Eye Display Application Settings Menu
( ) is displayed. Press this icon to move the settings menu horizontally. Eye Display application The following figure shows the different choices in the Eye Display application settings menu. settings menu Figure 82: Eye Display application settings menu PRISM Media Analysis Platform User Manual... - Page 124 Eye Measurements. Use the button to Hide or Show the eye measurements over the top of the eye pattern. NOTE. Eye measurements will only be displayed when the Eye Display application is in full screen mode. PRISM Media Analysis Platform User Manual...
-
Page 125: Jitter Display Application
Figure 83: Jitter Display application display Jitter Display application The following figure shows the available options after pressing and holding anywhere on the Jitter Display application tile. banner Figure 84: Jitter Display application banner PRISM Media Analysis Platform User Manual... -
Page 126: Figure 85: Jitter Display Application Settings Menu
Sweep Mode. Use the drop-down menu to select 1 Line, 2 Line, 1 Field, or 2 Field Jitter Meter. Use the button to Hide or Show the jitter meter at the top of the display. PRISM Media Analysis Platform User Manual... - Page 127 Eye Measurements. Use the button to Hide or Show the eye measurements over the top of the pattern. NOTE. Eye measurements will only be displayed when the Jitter Display application is in full screen mode. PRISM Media Analysis Platform User Manual...
-
Page 128: Picture Application
NOTE. In full screen mode, there is no cropping. Pictures are decimated horizontally or vertically to obtain the correct aspect ratio. This decimation may cause some artifacts. PRISM Media Analysis Platform User Manual... -
Page 129: Audio Application
Use the collapse icon ( ) to bring the tile back to its original size. PRISM Media Analysis Platform User Manual... - Page 130 Sometimes the CRC code is set to zero, indicating that the signal is missing; when this is the case, this message is not displayed. MUTE. The number of consecutive all-zero samples equals or exceeds the # Samples for Mute setting. PRISM Media Analysis Platform User Manual...
- Page 131 NOT PRESENT. Indicates that an audio bar is not present in the current audio input. This can be present if a Dolby Digital input has a coding mode indicating a reduced number of channels. PRISM Media Analysis Platform User Manual...
-
Page 132: Video Session Application
Use the collapse icon ( ) to bring the tile back to its original size. PRISM Media Analysis Platform User Manual... - Page 133 SAV Place Err: Indicates whether a Start-of-Active-Video Placement Error has occurred. EAV: Indicates whether an End-of-Active-Video Placement Error has occurred. Field Length Err: Indicates whether a Field Length Error has occurred. Line Length Err: Indicates whether a Line Length Error has occurred. PRISM Media Analysis Platform User Manual...
-
Page 134: Figure 92: Video Session Application – Vpid 352 Tab Display For 3G-Sdi Level B Signal
Link A1 and lists the VPID values in hex. Link A2: Appears only for 3G-SDI Level B signals. Indicates the presence and status of a SMPTE 352M payload on Link A2 and lists the VPID values in hex. PRISM Media Analysis Platform User Manual... -
Page 135: Figure 93: Video Session Application – Bit Level Tab Display
C Stuck Bits: Displays which of the chrominance video bits are stuck. If the readout is "- - - - - - - - ", then none of the bits are stuck. PRISM Media Analysis Platform User Manual... -
Page 136: Figure 94: Video Session Application – Crc Status Tab Display
CRC status can be used to verify integrity through a system. An error means that the C Channel embedded CRC value does not match the calculated CRC value, which indicates that a transmission error has occurred. PRISM Media Analysis Platform User Manual... - Page 137 Err Secs: The number of seconds, since the last reset, that contained at least one error. % Err Fields: Shows a calculated number showing the percentage of all fields since the last reset that contained at least one error. PRISM Media Analysis Platform User Manual...
-
Page 138: Event Log Application
Use the collapse icon ( ) to bring the tile back to its original size. PRISM Media Analysis Platform User Manual... -
Page 139: Figure 97: Event Application Go To Bottom Icon
100 events will be displayed. When the slider control is displayed, touch and swipe the up arrow at the bottom of the slider to close the control. PRISM Media Analysis Platform User Manual... - Page 140 Date: Shows the date and time, according to the internal clock, that the error occurred in the form YYYY-MM-DD. Time: Shows the time, according to the internal clock, that the error occurred in the form HH:MM:SS. PRISM Media Analysis Platform User Manual...
-
Page 141: Timing Application
Use the collapse icon ( ) to bring the tile back to its original size. PRISM Media Analysis Platform User Manual... - Page 142 PTP epoch. Finally the offset between the ST 2022-6 signal and the ideal alignment is displayed. The display shows both absolute time and the time parsed into lines or horizontal delay as time and pixels. PRISM Media Analysis Platform User Manual...
- Page 143 Another use case is to measure multiple signals and compare the relative timing. This was commonly done in SDI and Composite environments to enable timing adjustment of the various black signals to align the inputs to the production switcher. PRISM Media Analysis Platform User Manual...
-
Page 144: Ip Status Application
The following options adjust the IP Status application: The maximize icon ( ) expands the IP Status application tile to the full screen. The minimize icon ( ) collapse the tile back to its original size. PRISM Media Analysis Platform User Manual... -
Page 145: Figure 103: Ip Status Port Settings
When the row has a yellow gradient it indicates a signal that was present and is now gone. Press the reset button at the right side of the banner (at top) to clear the signals that are no longer there. PRISM Media Analysis Platform User Manual... -
Page 146: Figure 104: Ip Status Application With Yellow And Green Gradients
Yellow gradient: When an item in the list has a yellow gradient it indicates the item was previously detected in the stream but is no longer present. The yellow gradient can also indicate messages, which occur only for a few PRISM Media Analysis Platform User Manual... - Page 147 Source IP: Shows the source IP address and port number of the monitored stream in the form <source IP address>:<port number>. Dest IP: Shows the destination IP address and port number of the monitored stream in the form <destination IP address>:<port number>. PRISM Media Analysis Platform User Manual...
-
Page 148: Ip Session Application
Figure 105: IP Session application display IP Session application The following figure shows the available options after pressing and holding anywhere on the IP Session application tile. banner Figure 106: IP Session application banner PRISM Media Analysis Platform User Manual... - Page 149 Running / Stopped icons. When the monitoring session is running (collecting error data), use the icon to stop the session. When the session is stopped (no error data collection and no display updates), use the icon to restart the session. PRISM Media Analysis Platform User Manual...
-
Page 150: Figure 107: Ip Session Application – Layer 1/2 Tab Display
SFP vendor. Such an indication typically points to non-installed cables, broken cables, or a disabled, failing or a powered off transmitter at the far end of the cable. PRISM Media Analysis Platform User Manual... - Page 151 Tx Bytes: A count of the number of bytes transmitted. Tx Frames Ok : A count of the number of Ethernet frames transmitted without error. Tx Frames Errored: A count of the number of Ethernet frames transmitted with errors detected. PRISM Media Analysis Platform User Manual...
-
Page 152: Figure 108: Ip Session Application – Video Tab Display
Destination Addr: Lists the destination addresses for the L3 IP layer. L4 UDP Source Port: Lists the source ports for the L4 UDP layer. Destination Port: Lists the destination ports for the L4 UDP layer. PRISM Media Analysis Platform User Manual... - Page 153 SSRC: Identifies the Synchronization Source ID and is set in compliance with RFC3550. This identifier is chosen randomly and should be unique so that no two SSRC have the same value with an RTP session. PRISM Media Analysis Platform User Manual...
- Page 154 Video Payload Scrambling: Identifies the payload scrambling status: Unscrambled (0x0): Indicates the payload is not scrambled. Reserved (n): When n is a number other than 0, indicates a reserved value is being used. PRISM Media Analysis Platform User Manual...
- Page 155 This timestamp is fixed at the transmitter to the first information contained in the datagram. Header Extension: Indicates the number of 4-octet Header Extension words which follow the HBRMT payload. PRISM Media Analysis Platform User Manual...
-
Page 156: Figure 109: Ip Session Application – Ptp Tab Display
Grandmaster ID: Shows the MAC Address of PTP Master with the bytes "ff:fe" inserted in the middle. This ID is also used in the BMCA as a tiebreaker when all of the parameters match down through priority 2. PRISM Media Analysis Platform User Manual... - Page 157 NOTE. The PRISM monitor currently supports Multicast communication mode and SMPTE mixed mode without negotiation. In later firmware releases, other communication modes will be supported.
- Page 158 Delay Mechanism: Shows the delay mechanism mode being used: NOTE. The PRISM monitor currently supports only the End-to-End delay mechanism. End-to-End: In this mode, the sync, follow up, delay request and delay response messages go through the network all the way between the master and slave.
- Page 159 Sync message rate. NOTE. For SMPTE mixed mode, PRISM sets the delay Request rate equal to the Sync message rate received from the master. Delay Response: Displays the rate of the Delay Response messages received from the master.
-
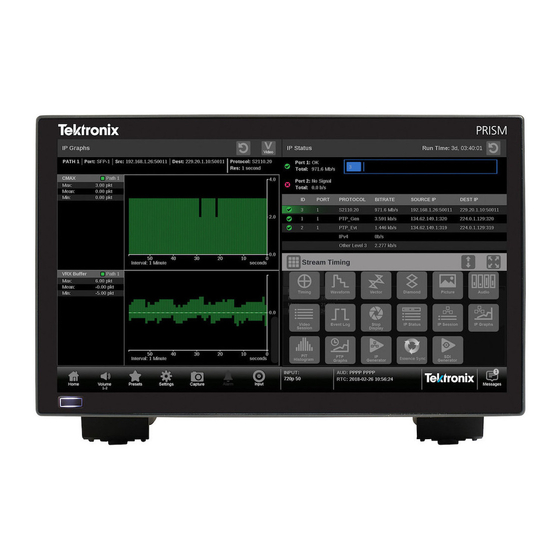
Page 160: Ip Graphs Application
The gear icon ( ) opens the IP Graphs application settings menu. Use this menu to adjust Trend Interval. NOTE. After the IP Graphs application settings menu is opened, a move icon ( ) is displayed. Press this icon to move the settings menu horizontally. PRISM Media Analysis Platform User Manual... -
Page 161: Figure 111: Ip Graphs Application Settings Menu
Protocol: Lists the protocol being used by the monitored stream. Res: Lists the resolution of the graph display. Path button: Use the Path button to switch between Path 1, Path 2, or both Path 1 and Path 2. PRISM Media Analysis Platform User Manual... -
Page 162: Figure 112: Ip Graphs Application Display
Mean: Shows the mean bandwidth used during the time window. Min: Shows the minimum bandwidth used during the time window. Free Min/Max: Shows the minimum and maximum available bandwidth that is not being consumed. PRISM Media Analysis Platform User Manual... -
Page 163: Figure 113: Ip Graphs Application – Pit And Rtp Sequence Error Graphs
The number of reconstructed path errors also applies to situations when ST2022-7 is turned off. Packets could pass uncorrected if they are dropped or if reordering results in an input buffer overflow. (See Figure 113.) PRISM Media Analysis Platform User Manual... -
Page 164: Figure 114: Ip Graphs Application – Video Crc Error And Ts-Df Graphs
RTP Sequence Errors. TS-DF graph The TS-DF graph shows the Time Stamped Delay Factor, as defined in EBU Tech 3337, which is a method for measuring network jitter in RTP streams. (See Figure 114.) PRISM Media Analysis Platform User Manual... -
Page 165: Figure 115: Ip Graphs Application – Path1–Path2 Differential Graph
Path1-Path2 Differential graph shows the signed value of Path 1 minus Path 2. A positive value means that Path 2 is lagging Path 1. Figure 115: IP Graphs application – Path1–Path2 Differential graph Figure 116: Seamless protection switching of SMPTE ST-2022-7 IP stream PRISM Media Analysis Platform User Manual... -
Page 166: Pit Histogram Application
Figure 117: PIT Histogram application display PIT Histogram application The following figure shows the available options after pressing and holding anywhere on the PIT Histogram application tile. banner Figure 118: PIT Histogram application banner PRISM Media Analysis Platform User Manual... - Page 167 Elements of the PIT Source/Dest: Lists the source and destination addresses of the IP stream. Histogram application Protocol: Lists the protocol being used by the monitored stream. PRISM Media Analysis Platform User Manual...
-
Page 168: Ptp Graphs Application
( ) is displayed. Press this icon to move the settings menu horizontally. Setting the PTP interval 1. Open the PTP Graphs settings menu by pressing and holding in the tile and select the icon. PRISM Media Analysis Platform User Manual... -
Page 169: Figure 120: Ptp Graphs Application Settings Menu
Non-PTP aware switches may have significant PTP delay variations, while transparent and boundary clocks will have much less variation and total delay. Figure 121: PTP Master-Slave Delay and Variation graphs PRISM Media Analysis Platform User Manual... - Page 170 A low value will indicate that a PTP slave will have an easy time locking, a large value will indicate it may be challenging for a PTP slave to get a good lock. PRISM Media Analysis Platform User Manual...
- Page 171 A low value will indicate that a PTP slave will have an easy time locking, a large value will indicate it may be challenging for a PTP slave to get a good lock. PRISM Media Analysis Platform User Manual...
-
Page 172: Ptp Operational Overview
Priority 1 and Priority 2 parameters are set by the user to influence the choice of a master: NOTE. The PRISM monitor has no role in setting the priority parameters or in providing information to the BMCA. Priority 1. This parameter defines which clocks are allowed to be considered as masters. -
Page 173: The Five Basic Ptp Timing Messages
Once the slave receives the delay response, it has the second pair of timestamps needed to calculate the second delay measurement of the slave to master delay. PRISM Media Analysis Platform User Manual... - Page 174 PTP operational overview Message timing The following figure show the relationships between the five PTP timing messages. PRISM Media Analysis Platform User Manual...
-
Page 175: Profiles And Domains
The profile defines the default and range of each parameter, and defines with options are required, allowed or prohibited. In the Prism monitor, the user should select the PTP profile (General, ST2059, or AES67). The user can then modify the profile parameters and save as part of an instrument preset. -
Page 176: Multicast, Unicast, And Mixed Communication Modes
Ideally, the slave will use that value to set the delay request rate although some slave set this rate independently. The delay request rate is typically the same as the sync rate, but may be higher or lower. PRISM Media Analysis Platform User Manual... - Page 177 For SMPTE mixed mode, the Announce, Sync, and Follow up messages are configured as Multicast, whereas the delay requests can be Multicast, Unicast, or Unicast without negotiation. To use this combination with a Tektronix SPG8000A master clock generator, set the master and slave to any of the modes: Multicast, Mixed, or Mixed without negotiation.
-
Page 178: Bmca Operation
Conversely for a 1 Gb/s input and 100 Mb/s output, the entire packet is quickly read in at the faster rate, so then the output can start sooner, albeit at a lower rate. PRISM Media Analysis Platform User Manual... - Page 179 The PTP system is incapable of removing this effect, so the best way to prevent this is to use high-quality cable with a minimum variation in the physical propagation delay. PRISM Media Analysis Platform User Manual...
- Page 180 PTP operational overview PRISM Media Analysis Platform User Manual...
- Page 181 PIT graph, 141 RTP Sequence Error graph, 141 Session Bit Rate graph, 141 gamut Total Bit Rate graph, 140 diamond display, 98 TS-DF graph, 142 Gamut display Video CRC Error graph, 142 checking RGB gamut, 98 PRISM Media Analysis Platform User Manual...
- Page 182 Seamless switching, enabling, 48 SFP+ module installation, 19 Waveform Select application, 88 configured inputs, 52 Selecting an application, 32 Network Status indicators, 87 Connect to, 21 Stop Display application, 91 IP settings, 21 Stream Capture, 83 PRISM Media Analysis Platform User Manual...
Need help?
Do you have a question about the PRISM and is the answer not in the manual?
Questions and answers