Larson Davis SoundAdvisor 831C Reference Manual
Sound level meter
Hide thumbs
Also See for SoundAdvisor 831C:
- Reference manual (254 pages) ,
- Reference manual (210 pages) ,
- Reference manual (214 pages)
Table of Contents
Advertisement
Quick Links
Advertisement
Chapters
Table of Contents

Related Manuals for Larson Davis SoundAdvisor 831C


Summary of Contents for Larson Davis SoundAdvisor 831C
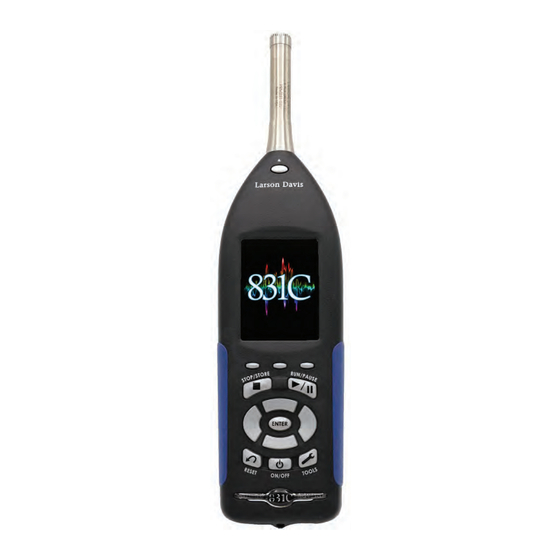
- Page 1 SoundAdvisor Model 831C Sound Level Meter...
- Page 2 Larson Davis SoundAdvisor Model 831C Sound Level Meter Reference Manual...
- Page 3 Changes and improvements to the information described in this manual may be made at any time. Safety If the equipment is used in a manner not specified by Larson Davis, the protection provided by the equipment may be impaired. Record of Serial Number and Purchase Date...
- Page 4 Download G4 LD Utility G4 LD Utility (G4) software enhances the features, flexibility, and ease-of-use of Larson Davis instruments by providing setup utilities, instrument calibration, computer-based control of the instrument, data download and manipulation, printing, and export of data to third-party software for post processing and analysis.
- Page 5 Using A Digital Reference Manual Larson Davis is committed to the green practices of limited paper waste. In this effort, we only offer reference manuals in a digital PDF format. Digital notes and comments can be made in certain readers, and you are encouraged to print any procedures or sections for quick references that fit your needs.
-
Page 6: Table Of Contents
Table of Contents Module 1 SoundAdvisor Features 1.1 Overview ............................1-1 1.2 Basic Operations ..........................1-1 1.3 Applications .............................1-2 1.4 Hardware Features ..........................1-2 1.5 Performance Features ........................1-3 1.6 Available Options ..........................1-3 1.7 Accessories ............................1-4 Module 2 Instrument Overview 2.1 Overview ............................2-1 2.2 Instrument ............................2-2 2.3 Keypad ..............................2-4 2.4 Microphones and Preamplifiers ......................2-6 2.5 Displays and Icons ...........................2-6... - Page 7 Module 8 Measurement Data Files 8.1 Overview ............................8-1 8.2 Data Storage Preferences ........................8-2 8.3 Data File Manager ..........................8-3 8.4 USB Drive Storage ..........................8-5 8.5 File Naming System .........................8-7 8.6 Out Of Memory ..........................8-8 Module 9 System Properties 9.1 Overview ............................9-1 9.2 Device ...............................9-1 9.3 Time ..............................9-2 9.4 NTP ..............................9-2...
- Page 8 16.3Enabling Time History ........................16-3 16.4Setting up the Measurement ......................16-3 16.5Making a Time History Measurement ...................16-4 16.6Markers ............................16-5 16.7Viewing Time History Data ......................16-7 16.8Storing Time History ........................16-9 Module 17 Event History 17-1 17.1Overview ............................17-1 17.2Enabling Event History ........................17-1 17.3Setting up the Measurement ......................17-1 17.4Making an Event History Measurement ..................17-5 17.5Viewing Event History Data ......................17-5 17.6Storing Event History ........................17-7...
-
Page 9: Module 1 Soundadvisor Features
Module 1 SoundAdvisor Features Overview ..........................1-1 Basic Operations .........................1-1 Applications .........................1-2 Hardware Features ......................1-2 Performance Features ......................1-3 Available Options ........................1-3 1.6.1 Purchase-Required Options .................1-3 Accessories ..........................1-4 1.7.1 Optional Accessories ....................1-4 1.1 Overview The “C” in 831C he SoundAdvisor Model 831C (the SoundAdvisor, 831C, or meter) is a TAKE NOTE stands for color. -
Page 10: Applications
• 2 GB internal industrial grade data memory TAKE NOTE memory can be purchased • 240 x 320 full-color graphic LCD display with touchscreen user from Larson Davis as an interface option. • Quiet Touch elastomeric keypad • 4-AA batteries provide upwards of 8 hours operating time, usable with NiMH, photo-lithium, lithium-Ion, and alkaline cells •... -
Page 11: Performance Features
Davis” on page ii-2. which have been purchased are enabled. Any of the other firmware options can be enabled at a later date, following purchase, using a file delivered from Larson Davis. 1.6.1 Purchase-Required Options 831C-LOG Time History data logging with periods from 2.5 ms to 24 hours. -
Page 12: Accessories
1.7 Accessories Some of these Unless otherwise noted, the SoundAdvisor is delivered with these TAKE NOTE options may not be provided standard accessories: with systems designed for specific applications. Microphone Preamplifier PRM831 PRM2103 Microphone 377B02 1/2” free-field prepolarized microphone, 50 mV/Pa, providing performance conforming to Class 1 sound level meter standards 377C20 1/2”... - Page 13 • PRM2103 Outdoor Microphone Preamplifier • PRM426A12 Outdoor Microphone Preamplifier Environmental Protection EPS2116 Environmental Shell Protects microphone and preamplifier from rain and wind with mounting options for pipes, poles, and most tripods EPS030-831 Weather-proof enclosure for remote noise monitoring; includes battery NMS/EPS043 Weather proof enclosure for remote noise monitoring NMS/EPS044...
- Page 14 Cables for Environmental Monitoring • CBL152 Cable; 426A12 to 831 Signal, 20’ • CBL153 Cable; 426A12 to 831-INT Control, 20’ • CBL154 Cable; 426A12 to 831C Control, 20’ • CBL203 Cable; PRM2103 to 831Control, 20’ • CBL208 Cable; PRM2103 to 831-INT Control, 20’ Cable for use with PSA027 Universal Input Power Supply AC Power Adaptor •...
-
Page 15: Module 2
Module 2 Instrument Overview Overview ..........................2-1 Instrument ...........................2-2 Keypad ..........................2-4 2.3.1 Navigating and Selecting ..................2-4 2.3.2 Basic Run Function ....................2-5 2.3.3 Entering Text ......................2-5 Microphones and Preamplifiers ..................2-6 Displays and Icons .......................2-6 2.5.1 Measurement Data Tabs ..................2-7 2.5.2 Pages ........................2-8 2.5.3 Status Bar Icons ....................2-8 2.5.4... -
Page 16: Instrument
2.2 Instrument SoundAdvisor Instrument Overview (front) FIGURE 2-1 Standard 1/2” free field or random incidence PRM831 microphone Preamplifier Release button to disconnect the preamp from the meter 240 x 320 full-color graphic LCD display with touchscreen user interface (shown with Dark color theme) Display navigation softkeys... - Page 17 FIGURE 2-2 Instrument Overview (bottom) 1. AUX connector intended for use with USB mass storage, cellular modem, GPS, headphones, speakers, and future devices. DO NOT use the hard- 2. Hardware Power Switch when set to “ 0 ” completely powers down CAUTION ware power switch to turn the the SoundAdvisor for storage.
-
Page 18: Keypad
2.3 Keypad The SoundAdvisor has 13 buttons that are used to start, stop, or pause measurement, navigate display, and safely power the meter off. FIGURE 2-3 SoundAdvisor Keypad Softkeys: Left, Center, Right Stop or Store a Run or Pause a measurement Arrow Keys Up, Down, Right, Left... -
Page 19: Basic Run Function
Table 2.1 Navigating and Selecting Action Key(s) Description Access content specific menu There are times when a content specific menu appear on the screen. The associated top soft key will access that menu. Exit a menu The top middle soft key can be used to close or save. -
Page 20: Microphones And Preamplifiers
2.4 Microphones and Preamplifiers The following microphone preamplifier is used with the SoundAdvisor: For information • PRM831 1/2” Microphone Preamplifier LEARN MORE on using the SoundAdvisor with the PRM2103 The following microphone are the most commonly used with the preamplifier, see the SoundAdvisor: PRM2103 Manual. -
Page 21: Measurement Data Tabs
2.5.1 Measurement Data Tabs There are seven (7) Measurement data is presented on three (3) main screens called “tabs” TAKE NOTE tabs of measurement data. that can be navigated using the top left/right softkeys: Live, Overall, and Session Log Live are default. -
Page 22: Status Bar Icons
SoundAdvisor. Additional shows all the pages available for these tabs. pages of measurement data can be purchased through Larson Davis. “Contact Larson Davis” on page i-2. FIGURE 2-6 Live and Overall Pages Overall Tab’s Pages Live Tab’s Pages 2.5.3 Status Bar Icons The top status bar will alert the user the status of the meter, measurement, connection, and battery. - Page 23 symbol appears over the battery icon if the battery is currently charging. FIGURE 2-8 Battery States External Power The external power connection icon appears when the SoundAdvisor is powered from an external power supply or via the USB port. FIGURE 2-9 External Power Icon Battery Status Pending While the SoundAdvisor is checking the battery status, this pending...
- Page 24 When using a microphone having a sensitivity of 50 mV/Pa, the input overload will occur approximately as shown in Table 2.3. Table 2.3 Input Overload Levels Input Gain, dB Overload Level, dB Peak Under Range Icon When the signal from the preamplifier drops to the point where the noise level of the instrument and the preamplifier influence the measurement, an under range condition exists.
- Page 25 When the OBA Range property is set to Low, the OBA Overload Icon will activate at a level 33 dB lower than it would had the OBA Range been set to Normal. When using a microphone having a sensitivity of 50 mV/Pa, the input overload will occur approximately as shown in Table 2.4.
- Page 26 FIGURE 2-16 Measurement Status Icons A measurement is currently running. Stop A measurement is stopped. Reset A measurement reset has occurred. Pause The present run is paused. Run Pending The meter is waiting for filters and detector initialization to complete and will automatically start the run when the system is stable (typically less than...
-
Page 27: Display Menus
Sleep Icon To learn more When the SoundAdvisor is not connected to a PC, it can be put in a LEARN MORE about power saving options, power saving mode that shuts down the analog circuitry, including the see “Power” on page 9-3. preamplifier, to save battery power. - Page 28 • Setup WiFi (if available) Power Control Accessed by pressing the 0 once • Battery Information • Display • • Reboot Any Level Menu To select which sound level parameter is to be used for the 2nd numerical value displayed, press the 5 to open the menu. Any Level Menu FIGURE 2-19 Setup Manager...
- Page 29 Enabling some TAKE NOTE settings will open more pages Define the Ln statistics. under the tabs in the data Control display. Define the way a measurement is performed, the timing, and the storage of measurement history records. For more Time History LEARN MORE information on the Enable the time history and select the metrics that are stored in the...
- Page 30 Network View the 831 INT-ET IP address and the external Ethernet IP and MAC addresses. Enable Watchdog is also on this page. Email Indicate recipients for email alerts. Other Set the Logic In, Logic Out, and heater. Reference Spectra Set values for the reference spectrum. Device Enter 30 characters per field of device information that will appear on the About page under the Tools menu.
-
Page 31: Module 3 Getting Started
TAKE NOTE or shortage immediately to package contains the items listed below. Retain the packaging for safe PCB Piezotronics, Inc. See shipment for calibration service. “Contact Larson Davis” on page i-2. The SoundAdvisor should include: Table 3.1 SoundAdvisor Package SoundAdvisor... -
Page 32: Unpacking & Inspecting
The 831C-FF and 831C-RI should include all from Table 3.1 and Table 3.2: Table 3.2 831C-FF Package 831C-CCS Hard Shell Case PSA029 Universal AC Power Adaptor WS001 3 1/2 inch Windscreen Lanyard 4 - AA NiMH batteries G4 LD Utility Software SoundAdvisor Model 831C Unpacking &... -
Page 33: Connect The Microphone & Preamplifier
Table 3.2 831C-FF Package Calibration Certification 3.1.1 Serial Numbers Record the purchase The SoundAdvisor model and serial numbers are printed on the label TRY THIS date, model and serial on the instrument’s back panel. The microphone model and serial numbers for your instrument, numbers are engraved on the outside of the microphone. -
Page 34: Connect The Preamplifier To Meter
3.3 Connect the Preamplifier to Meter Do not attempt to The bottom of the preamplifier has a 5 pin connector that fits snugly CAUTION screw the preamplifier onto into the top of the SoundAdvisor. The connectors are keyed for correct the SoundAdvisor. - Page 35 A Session Log entry “Charging Stopped” can be resolved by CAUTION checking the batteries and ensuring the correct battery type is selected. Battery may be too old to charge. Battery may be read as incorrect battery type, which may happen to fully discharged NiMH bat- teries.
- Page 36 FIGURE 3-4 Insert Batteries Charging Batteries using the SoundAdvisor When using NiMH batteries and powering the SoundAdvisor from either the computer (via USB port) or from the PSA029 power supply, or from another external source, the batteries can be charged inside the instrument.
-
Page 37: External Power
Step 2 Select battery type as NiMH. Step 3 Charge will automatically set to On. If you do not want your power source to charge your battery, set to Off. Step 4 Select Save. A dialogue box will appear, select Yes. Charge Status LED The charge status indicated by an LED on 0 are as follows: LED 0 continuously lit: Charging... -
Page 38: Turn The Soundadvisor On
when powering is lost do to low solar situation or after an extended power outage. Sudden Loss of External Voltage If the external voltage is suddenly lost, for example when the external supply is disconnected or when mains power fails and there is no external battery, the SoundAdvisor will continue to run on internal batteries if they are present and in good condition. -
Page 39: Accessibility And Control
Power Control Page While the SoundAdvisor is powered on, the Power Control page can be accessed by pressing the 0 power button once. This is the best way to turn the meter off. Select Off to safely turn the meter off. Alternatively, press and hold the 0 power button for three seconds and it will power down safely. -
Page 40: Control Using G4 Ld Utility
3.7.1 Control using G4 LD Utility To connect and manage the SoundAdvisor using G4, refer to “Connecting SoundAdvisor to G4” on page i-3. 3.7.2 Control Using Web Browser To connect to the SoundAdvisor on a web browser (on a mobile device or PC) follow these steps: Step 1 With the SoundAdvisor, make a secure connection to the internet either through an Ethernet port of WiFi, see... -
Page 41: Long Term Storage Of Soundadvisor
3.8 Long Term Storage of SoundAdvisor DO NOT use the hard- The Hardware Power Switch on the bottom of the SoundAdvisor CAUTION ware power switch to turn the disconnects the batteries from the SoundAdvisor hardware. The real- SoundAdvisor OFF. Perma- time clock will maintain its value while the switch is off. -
Page 42: Module 4 Data Display
Module 4 Data Display Overview ..........................4-1 Data Labels ..........................4-2 Live Displays ........................4-2 4.3.1 SLM Page .......................4-2 4.3.2 Big Digit Sound Level ....................4-3 4.3.3 Octave Band Analyzer ...................4-4 4.3.4 Normalized Octave Band ..................4-4 4.3.5 Triggering ......................4-5 4.3.6 Preamplifier Interface Page .................4-5 4.3.7 Power Page ......................4-6 Overall Displays ........................4-8... -
Page 43: Data Labels
4.2 Data Labels The labels for sound metrics in the SoundAdvisor are designated by international standards. For many displayed values, the frequency and time weighting are indicated in the name of the metric. For example, L is the A-weighted sound pressure level measured using the Slow detector. -
Page 44: Big Digit Sound Level
possibly the detector, will correspond to those selected in setup for the RMS value. While on this page, The 2nd numerical level display, L in this example, corresponds to a TRY THIS press the key, select a new user-selected parameter. The default value is L . -
Page 45: Octave Band Analyzer
4.3.3 Octave Band Analyzer This feature There are four pages that relate to octave bands. The bands on the 1/1 TAKE NOTE requires the 831C-OB3 option. Octave pages represent the bandwidth of one full octave, and the height of each band is amplitude of sound at that frequency. The 1/3 Octave band pages are similar, but each band represents a bandwidth of 1/3 octave. -
Page 46: Triggering
4.3.5 Triggering After indicating the decibel of a trigger on a setup, view this page to show when the trigger has been exceeded. FIGURE 4-6 Triggering Page Current live sound The L of the Zpeak measurement. When the SPL1 & SPL2 triggers are exceeded they will change from white to... -
Page 47: Power Page
4.3.7 Power Page The power page on the Live tab shows time and date, power information, memory, and battery information. FIGURE 4-8 Power Page on the Live Tab The current date and Checking the internal time can easily be seen temperature of the on this page. - Page 48 Table 4.1 Run Timer Behavior Measurement Mode Run Timer Single Block Timer Counts down to the end of the block once the measurement begins. Take note that the run timer will be counting even when the measurement is stopped if the time is within a block.
-
Page 49: Overall Displays
To inquire about data will continue to collect until the measurement is stopped and more functionality, “Contact saved, or a reset has occurred. Larson Davis” on page i-2. 4.4.1 SLM Display FIGURE 4-9 Overall Tab: SLM Page Run time of current The left side is the start of measurement. - Page 50 4.4.3 L FIGURE 4-11 Overall Tab: Leq Page and the L of the overall measurement The L (Z frequency Zpeak These three SPL weighting) is the overall detectors give the date reading of the peak and time during the detector during the measurement that the measurement.
-
Page 51: Leq
FIGURE 4-12 Overall Tab 1/1 Octave Band Page Table 4.2 Overall Octave Band Colors “Leq” is the average sound level of the highlighted frequency band for the duration of the measurement. is the maximum sound level of the highlighted frequency band. The maximum spectrum is determined by the Max Spec setting. -
Page 52: Normalized Octave Band
4.4.5 Normalized Octave Band Similar to the Octave Bands pages in display, normalized band numerical values of the highlighted band. The data is then normalized using a Spectral Ln indicated in a setup. FIGURE 4-13 Overall Tab: Normalized Octave Bands Highlight the bands to The user defined change the selected... -
Page 53: Ln Percentiles
4.4.6 Ln Percentiles The Ln percentile TAKE NOTE levels can be adjusted on the Ln page of the setup. Setup Manager Ln Percentiles. FIGURE 4-14 Overall Tab: Ln Percentiles Page = 39.9 dB An Ln is a statistical measurement of the level that is exceeded “n” LEARN MORE NF50 means that the Fast (F) time... -
Page 54: 1/3 Spectral Ln
4.4.7 1/3 Spectral Ln FIGURE 4-15 Overall Tab: 1/3 Spectral Ln Ln as a function of frequency for the six user-selected values of n Frequency at highlighted band Ln values at highlighted band Using the TRY THIS keys, move the highlighted band to show the values for a different octave. -
Page 55: Overloads
4.4.9 Overloads The Overloads page shows the number of times, the percent of time, and the amount of time that the Sound Level Meter and the OBA have been overloaded. FIGURE 4-17 Overall Tab: Overloads Page 4.4.10 Community Noise The metric CNEL is The Community Noise page displays the values LDN and LDEN which TAKE NOTE equivalent to LDEN. -
Page 56: C Minus A Impulsivity Page
2002 relating to the assessment and management of environmental noise. It is important to verify prior to measurement that the values have been properly defined for your purposes. The values can be adjusted on the setup, navigate Setup Manager Day/Night. 4.4.11 C Minus A Impulsivity Page The “C minus A”... -
Page 57: Ta-Lärm
4.4.12 TA-Lärm This metric is primarily used in Germany. To turn off this display, or any other display that is not related to your measurement, see “Displays” on page 9-9. FIGURE 4-20 TA-Larm 4.4.13 Sound Exposure Level Page FIGURE 4-21 Sound Exposure Level Page SoundAdvisor Model 831C Overall Displays... -
Page 58: Metrics Matrix Page
4.4.14 Metrics Matrix Page The metrics matrix page shows all the data the meter is always measuring in one page. You can use the 5 key to move the cursor and enable more information to appear, like to see when a peak was measured. -
Page 59: Session Log Tab
4.5 Session Log Tab The Session Log is a record of data accumulation actions and indications of errors. Resetting and storing data will clear the session record. A time-stamped record is made for every Calibrate, Run, Pause, Resume, Stop, Voice Message and Sound Recording etc. action. The source responsible for each action is also recorded. -
Page 60: Adjust Graph Scale
FIGURE 4-24 Session Log There was a time sync Back-erase occurred Each highlighted entry will indicate if it The measurement was a key press, IO was paused command, battery information, etc. A run was initiated A calibration occurred 4.6 Adjust Graph Scale The default amplitude (dB) setting for the graphic display of sound pressure level versus time and frequency spectra are as indicated in the table:... -
Page 61: Module 5 Calibration
Module 5 Calibration Calibration Overview ......................5-1 5.1.1 Sensitivity Determination ..................5-1 5.1.2 Overload/Under Range Conditions ..............5-1 5.1.3 Calibration Stability ....................5-1 Calibration Displays ......................5-2 5.2.1 Calibrate Page .......................5-2 5.2.2 Calibration Settings ....................5-3 5.2.3 Calibration History ....................5-3 5.2.4 Calibration Certification ..................5-4 Choosing a Calibrator ......................5-5 Performing a Calibration ....................5-6 5.1 Calibration Overview 5.1.1 Sensitivity Determination... -
Page 62: Calibration Displays
During calibration, an automatic comparison is made between the sensitivity determined by the calibration and the previous value. A warning will appear when the difference between these two values exceeds 3 dB. 5.2 Calibration Displays Calibration The Calibrate function has four pages: Calibrate, Calibration Settings, LEARN MORE Histories can be viewed in Calibration History, and Calibration Certification. - Page 63 automatically in the SoundAdvisor with the following preamplifiers and their commonly paired microphones: • PRM831 • PRM2103 • 426A12 • ICP with ADP074 When a calibration has been performed using any of preamplifiers listed above, that calibration information is saved for that preamplifier. If the preamplifier is switched out and replaced with a different type of preamplifier, then the calibration information already saved for that new preamplifier type is used.
- Page 64 Select a log entry and a calibration spectra box will appear. FIGURE 5-4 Calibration Spectrum 5.2.4 Calibration Certification A certification interval of one year is recommended, but this can be lengthened, shortened, or disabled depending on the applicable requirements. FIGURE 5-5 Calibration Certification The date of the last certification and the...
-
Page 65: Choosing A Calibrator
Larson Davis recommends the following calibrator for the TAKE NOTE microphone an adaptor SoundAdvisor: ADP024 is required. • Larson Davis Model CAL200: 94/114 dB @ 1 kHz The following instances will require a correction: • Using Free Field Microphone • Check calibration data shipped with calibrator •... -
Page 66: Performing A Calibration
5.4 Performing a Calibration Step 1 Navigate Tools Menu Calibrate. Refer to the LEARN MORE calibrators operating instruction for more Step 2 Select calibrator from drop down menu that matches your information. own. The Other option can be configured in the “Calibration Settings”... -
Page 67: Module 6 Measurement Setup
Module 6 Measurement Setup Overview ..........................6-1 Setup Manager ........................6-2 6.2.1 General ........................6-3 6.2.2 SLM ........................6-4 6.2.3 OBA ........................6-5 6.2.4 Ln Percentiles ......................6-5 6.2.5 Control ........................6-6 6.2.6 Triggers ........................6-7 6.2.7 Day/Night ......................6-8 Default to LD Default Setup ....................6-9 User Defined Setup ......................6-9 Exiting the Setup Manager ....................6-10 6.1 Overview he SoundAdvisor makes measurements based on values indicated... -
Page 68: Setup Manager
6.2 Setup Manager If the SoundAdvisor All the measurement settings can be found in the Setup Manager. It can TAKE NOTE is connected to G4, when you be accessed by going to any menu and then selecting Setup Manager. load the Setup Manager, a The first page displays the Setup Files (setups) currently saved on the dialogue box may appear meter. -
Page 69: General
FIGURE 6-2 Setup Manager Menu By selecting any of the You cannot delete or setup files, a Menu will rename Active or Default. appear. You can set any setup Any changes that are made file to active, or to but not shown may be a restore to default symptom of a sync issue, settings, set the Default... -
Page 70: Slm
6.2.2 SLM FIGURE 6-4 Setup Manager: SLM Settings The weighting for the The default peak measurement can be weighting is Z, but can be made in A (default), C, changed to A or C. or Z. Detectors affect how 20 dB Gain can be quickly the sound is checked when being measured. -
Page 71: Oba
6.2.3 OBA FIGURE 6-5 Setup Manager: OBA Settings Normal (120 dB full Choose the weighting for scale) and High (140 dB the 1/1 Octave and/or 1/3 full scale) Octave bandwidth frequency analysis: A, C, Z. Spectral Ln values can be Select 1/1 Octave measured using 1/1 or 1/ bandwidth, 1/3 Octave... -
Page 72: Control
FIGURE 6-6 Setup Manager: Ln Percentiles Settings Default values of Ln You can edit the TAKE NOTE values of Ln during a measurement and view it without stopping or pausing the run. 6.2.5 Control The SoundAdvisor has six run modes to control the time duration of a measurement. -
Page 73: Triggers
Manual Run/Stop The measurement is initiated and stopped manually. Timed Stop The measurement is initiated manually, and will stop automatically after a user-defined period of time. Stop When Stable Set a dB and time for a stability parameter and if detected, the measurement will stop. -
Page 74: Day/Night
FIGURE 6-9 Triggers Graph 6.2.7 Day/Night Although the standard ISO 1996-2:2007 specifies default values used in the calculation of LDEN, in practice the time values defining the day, evening and night periods may be changed. This is permitted by Directive 2002/49/EC of the European Parliament and of the Council of 25 June 2002 relating to the assessment and management of environmental noise. -
Page 75: Default To Ld Default Setup
6.3 Default to LD Default Setup The Default setup is the factory measurement settings for the SoundAdvisor. It is read-only and cannot be deleted. If set to Active, it will restore the settings to the factory default values. To set to active, navigate to the Setup Manager through either the Tools Menu or Main Menu and then select the Default setup by pressing enter. -
Page 76: Exiting The Setup Manager
FIGURE 6-11 Settings: Setup Name 6.5 Exiting the Setup Manager To exit Setup Manager, select Close. If settings have A dialogue box will appear. Selecting Yes will save and close. Selecting TAKE NOTE been changed that you want No will not save, and return you to the main Setup Manager screen, to save, you will need to where you can then choose Close. -
Page 77: Module 7 Making A Measurement
Module 7 Making a Measurement Overview ..........................7-1 Before You Start ........................7-2 7.2.1 Position the SoundAdvisor ...................7-2 7.2.2 Area Sound Field Check ..................7-3 Performing the Measurement .....................7-5 7.3.1 Pausing the Measurement ..................7-6 7.3.2 Resetting a Measurement ..................7-7 7.3.3 Stopping the Measurement ..................7-8 Storing the Measurement ....................7-8 Low Level Sound Fields .......................7-8 7.1 Overview... -
Page 78: Before You Start
7.2 Before You Start Before performing a measurement, follow these steps to ensure the measurement is performed properly: Each step has a Step 1 Connect preamplifier microphone LEARN MORE link to the first 6 Modules in SoundAdvisor. the manual, and if read For complete instructions, see “Connect the Preamplifier through, will lead to optimal to Meter”... -
Page 79: Area Sound Field Check
As a result, when performing measurements in the presence of low level airflows, it is recommended that a windscreen be placed over the microphone. Larson Davis provides the WS001 windscreen, a 3 1/2” diameter ball made of open cell foam which can be placed over the microphone and preamplifier. - Page 80 • The time reads 00:00:00.0 on both the Live and Overall displays. (Otherwise the previous measurement was not stored or reset.) • The measurement status icon is set to Stop. For more information, see “SLM Page” on page 4-2. FIGURE 7-3 Standard Area Sound Field Before Measurement SoundAdvisor Model 831C Before You Start...
-
Page 81: Performing The Measurement
7.3 Performing the Measurement To learn more At this point you are ready to begin a measurement. LEARN MORE about the displays and icons, Navigate to Overall on the SoundAdvisor and press RUN 9. see “Displays and Icons” on page 2-6. Keypad LED Indicators When performing a measurement, the state of the SoundAdvisor is indicated in several ways: measurement state icon, Overall display... -
Page 82: Pausing The Measurement
7.3.1 Pausing the Measurement A measurement At any time the measurement of overall data can be temporarily TAKE NOTE may be paused and resumed paused. During a pause, the run clock will not stop and instantaneous multiple times. data will continue to be displayed on the Live display. After a pause, press the 9 RUN/PAUSE key to resume the measurement. -
Page 83: Resetting A Measurement
FIGURE 7-5 Back Erase in the Session Log Back erase icon will appear when a part of the measurement was erased during a pause. The amount of time that was erased will be shown in the information box. Time History Records The time history starts from the time the data was restored. -
Page 84: Storing The Measurement
7.3.3 Stopping the Measurement The SoundAdvisor can be stopped during a run or a pause, and will stop the run clock. Resuming a run will continue the overall measurement which has been stopped. The run clock will also begin again from the time indicated when the stop occurred. 7.4 Storing the Measurement A measurement To store a measurement, follow these steps:... -
Page 85: Module 8 Measurement Data Files
Module 8 Measurement Data Files Overview ..........................8-1 Data Storage Preferences ....................8-2 8.2.1 SFTP and Cloud Storage ..................8-2 Data File Manager ........................8-3 8.3.1 View Measurement Data File ................8-4 8.3.2 Load Settings ......................8-4 8.3.3 Create Average ......................8-4 USB Drive Storage .......................8-5 8.4.1 Save File to USB Drive ...................8-6 File Naming System ......................8-7... -
Page 86: Data Storage Preferences
8.2 Data Storage Preferences To indicate where measurement files are stored by default, navigate Tools System PropertiesPreferences. FIGURE 8-2 Preferences Page Every stop will store a measurement if Auto- store is set. You can be prompted to confirm the store, or it can be automatic. -
Page 87: Data File Manager
8.3 Data File Manager Data File Manager is a directory of all saved measurement data files. FIGURE 8-3 Data File Manager A USB drive is inserted, so the USB icon is displayed. The current measurement can be running, paused, or This is the available stopped while viewing storage, unless the USB... -
Page 88: View Measurement Data File
8.3.1 View Measurement Data File Navigate Menu Data File Manager Highlight desired data file Menu View. A read-only display of the Overall and Session Log tabs will show the data from that measurement. To indicate that you are seeing a measurement data file and not the live data, the data file icon will appear next to the data file name. -
Page 89: Usb Drive Storage
Step 2 Highlight desired data file. Step 3 Select Menu. Step 4 Select Create Average. Step 5 Highlight a different data file. Step 6 Select Menu. Step 7 Select Add to Average. Step 8 Repeat Steps 4-6 until all data files you want to average have been added. -
Page 90: Save File To Usb Drive
FIGURE 8-8 Data File Manager USB Menu If your settings indicate that the measurements be stored on a USB drive and no USB drive is inserted, this icon will appear. Files will save to the meter until you insert a USB drive. If the USB drive is removed during a measurement, the icon below will appear and the measurement will end and data with that measurement will not be visible on the meter. -
Page 91: File Naming System
Step 2 Navigate to Menu Data File Manager. Step 3 Highlight desired data file. Step 4 Select Menu. Step 5 Select desired action: • Copy File to USB The data file will be copied onto the USB drive. The origi- nal file will remain saved on the SoundAdvisor. -
Page 92: Out Of Memory
8.6 Out Of Memory In order to ensure that all measured data can be stored, the SoundAdvisor will stop automatically when the amount of available memory drops to 10 MB. If the unsaved data is less than 800 kB, you can save it after the forced stop. -
Page 93: Module 9 System Properties
Module 9 System Properties Overview ..........................9-1 Device ...........................9-1 Time .............................9-2 NTP ............................9-2 Power ...........................9-3 Preferences ..........................9-5 Localization .........................9-8 Displays ..........................9-9 Options ..........................9-10 9.10 Network ..........................9-10 9.11 Email ..........................9-11 9.12 Cloud Storage ........................9-13 9.13 Other ..........................9-15 9.14 Set Reference Spectra .......................9-16 9.1 Overview ystem Properties are control functions of the SoundAdvisor and not related to sound measurement or calculations, but rather instrument... -
Page 94: Time
9.3 Time There are several ways that you can update the time on the meter: GPS, NTP servers, PC clock, or manually set the time. This page is designed for the manual set, but is still automatic for daylight savings, just as long as your timezone is set accurately. -
Page 95: Power
When your time has successfully been synced with NTP servers, the NTP icon will appear next to your time. See Figure 9-4 NTP Icon. FIGURE 9-4 NTP Icon If the time is synced with NTP and internet connection is then loss, the SoundAdvisor will attempt to reconnect the servers for up to 2 1/2 hours. - Page 96 • Running a measurement • USB communications Pressing the 0 (ON / OFF) key will return the instrument and the display to the state it was in when the Auto-Off time expired. FIGURE 9-6 Auto-Off 9.5.4 Analog Power-Save FIGURE 9-7 Sleep Icon In the power save mode, battery power will significantly reduce by shutting down the analog circuitry and the signal processing...
-
Page 97: Preferences
9.5.6 Keypad Backlight By toggling keypad backlights to Off, the blue LED under all the keys will turn off. The Red LED on STOP/STORE, and the green LEDs under the RUN/PAUSE and ON/OFF will remain on. LCD Brightness Using the backlight You can set the intensity of the backlight of the LCD screen to 100%, TAKE NOTE on bright setting will... - Page 98 9.6.2 Auto-Store The Auto-store feature applies to all measurements taken on the device. None All storage must be done manually, unless in the continuous daily auto- store mode indicated in a setup. When a store Prompt TAKE NOTE When the 7 Stop button is pressed, or a stop occurs, you will be occurs, whether prompt or auto, the measurement is prompted to save the measurement data file.
- Page 99 9.6.3 AC Output The AC output is a full dynamic range AC/DC output. It does not drive a headset or headphones. Refer to If the signal is set to Off, then the AC/DC output is not powered. LEARN MORE “SoundAdvisor Model 831C Instrument Platform”...
-
Page 100: Localization
9.6.7 Color Theme The SoundAdvisor LCD screen has six options for color themes: three light and three dark. The light screens are encouraged to be used when sunlight or outdoor settings are mostly present when operating the meter, and the dark themes are better for indoor or low light use. FIGURE 9-13 Color Themes 9.7 Localization... -
Page 101: Displays
• Español • Svenska • Türkçe FIGURE 9-14 Language Selection Decimal Symbol Depending on your preference, the decimal symbol on the units of measurement can be a period or a comma. Select the radio button of the desired symbol, and save to make changes. Date Format The SoundAdvisor has two date formats day-month-year and year- month-day. -
Page 102: Options
FIGURE 9-15 Display Options 9.9 Options Default options will You can enable or disable options installed on the SoundAdvisor. TAKE NOTE not appear in the list as they Disabling an option does not delete the option, and it can be enabled cannot be disabled. -
Page 103: Email
9.11 Email Email alerts can be The SoundAdvisor with a network connection can be setup to send TAKE NOTE enabled on a Event History email and/or text alerts for sound events and other features. When SPL setup, see “Setting up the 2 trigger is exceeded during a measurement, as well as noise that Measurement”... - Page 104 Step 2 Indicate your SPL 2 Trigger Level. This decibel, when exceeded during a run, will trigger an email alert. See “Triggers” on page 6-7. Step 3 To send a sound recording of the exceedance, see “Event Sound Recording” on page 18-4. Select Save Event Sound. A .wav file will be created when an event occurs.
-
Page 105: Cloud Storage
9.12 Cloud Storage After a measurement data file is created, it can save on the meter, USB drive, and also upload directly to a remote storage service. Cloud storage is managed in System Properties Cloud Storage. However, not all connections can access this page. Only through G4 LD Utility on the Setup Manager tab can this functionality be managed. - Page 106 Step 5 Select Auto Push to Cloud to activate this feature. You will need Step 6 Choose the service you want to use: SFTP or Dropbox. TAKE NOTE access to a Secure FTP (SFTP) server or a Dropbox account. Step 7 Dropbox: Indicate the file path you want your data files to Standard, unsecured FTP is save.
-
Page 107: Other
9.13 Other 9.13.1 Logic I/O FIGURE 9-22 Logic In Logic Out Logic In The CBL170 I/O The Logic Input line receives a signal from an external device, which TAKE NOTE Interface Cable can be used to can initiate one of these actions by an external trigger: make an electrical connection Run/Stop to external devices. -
Page 108: Set Reference Spectra
9.13.2 Heater If a heater is detected as part of a preamp, this drop down will be enabled, and you can choose to have the heater turn on automatically, always be on, or always be off. 9.14 Set Reference Spectra When you view the normalize octave band data, you can choose a negative or positive A or C weighting, or you can define up to four unique reference spectra. -
Page 109: Module
• Firmware Version • Preamplifier inserted • Standards To purchase more • ANSI TAKE NOTE options on the SoundAdvisor, • “Contact Larson Davis” on page i-2. • Installed Options FIGURE 10-1 Tools Menu FIGURE 10-2 About SoundAdvisor Model 831C 10-1... -
Page 110: Module11 Lock
Module11 Lock 11.1 Overview ..........................11-1 11.2 Lock Meter .........................11-1 11.3 Lock Modes ........................11-2 11.4 Allow Calibration When Locked ..................11-3 11.5 Constraints ........................11-4 11.6 Unlock ..........................11-4 11.1 Overview o prevent unauthorized use or tampering with measurements and data, you can lock the SoundAdvisor. There are three options of tamper-proof security provided by this feature. -
Page 111: Lock Modes
means that a code indicated as “0123” will be saved to the meter as “123”. Step 4 Check or uncheck Allow Calibration when Locked. Step 5 Close and Save. 11.3 Lock Modes FIGURE 11-2 Lock Mode Menu There are three lock modes each with different degrees of security: Refer to Table 11.1 on page 4 for constraints on the various lock modes. -
Page 112: Allow Calibration When Locked
FIGURE 11-3 Locked with Auto/Manual Store Fully Locked A fully locked screen shows only the padlock image. In this lock mode you can run a measurement, but cannot pause, stop, or reset. You can fully lock the screen while a measurement is running. If you have indicated an auto-store mode in your current setup file, it will run and store as indicated in the setup. -
Page 113: Constraints
Press the center softkey to navigate to the Calibrate display. For information on how to calibrate, see “Calibration” on page 5-1. 11.5 Constraints Table 11.1 Allowed Operations During Lock Lock Mode Pause Stop Reset Calibration Lock with Auto Store Yes (when stopped) Lock with Manual Store Yes (when stopped) Fully Locked... - Page 114 Step 2 On Meter Manager navigate to the Maintenance tab. Step 3 Select Lock/Unlock. Step 4 Change lock mode to Unlock. Or use the code visible to enter into the unlock code dialogue on the meter. Step 5 Select Upload. FIGURE 11-6 G4 LD Utility Lock/Unlock SoundAdvisor Model 831C...
-
Page 115: Module
Module12 System Utilities he System Utilities repairs or recovers any file system problems.These functions are similar to what would be used to manage any hard drive. FIGURE 12-1 System Utilities Checking the file system will detect and repair problems. Format the data storage of the area indicated: USB or Internal. -
Page 116: Module 13 Communications & Wifi
Module 13 Communications & WiFi 13.1 Communication .........................13-1 13.1.1 Network .......................13-1 13.2 Connecting to an Ethernet Port ..................13-2 13.3 WiFi .............................13-3 13.3.1 Connecting to WiFi Network ................13-3 13.3.2 Access Point ......................13-4 13.1 Communication he Communication information, which comprises of network password, IP address, and MAC address, can be found in two ways: the ToolsCommunication or System PropertiesNetwork. -
Page 117: Connecting To An Ethernet Port
13.2 Connecting to an Ethernet Port To connect the SoundAdvisor to an Ethernet port, follow these steps: Ethernet Step 1 Verify you have the following equipment: TAKE NOTE connections consume a high amount of power. It is • SoundAdvisor Model 831C recommended to use a USB or •... -
Page 118: Wifi
13.3 WiFi The SoundAdvisor has a built in USB port where the WiFi dongle can be inserted, alternatively a USB hub can be used so multiple USB devices can be mounted at the same time. When the WiFi dongle is inserted, the WiFi status icon will appear on the top display on the meter. - Page 119 To connect to a Step 4 Enter the network password, if required, and click Add. TRY THIS hidden network, click Menu Add Network and provide Step 5 Verify your network connection details by clicking the network name newly added network from the list. FIGURE 13-7 WiFi Setup Use the refresh button...
-
Page 120: Module14 Upgrade Firmware
PC. how to do this, see “Download G4 LD Utility” on Access the Larson Davis website to see if you are using the most recent page i-3. version. If not, download the latest version from the website. -
Page 121: Upgrading Soundadvisor Firmware
14.2 Upgrading SoundAdvisor Firmware G4 is used to implement the firmware upgrade and perform the following steps: The SoundAdvisor Step 1 Turn the SoundAdvisor on. TAKE NOTE can be connected via USB or via TCP/IP address, if the Step 2 Connect the meter to the PC (or laptop) via the USB cable meter is connected to the CBL138, which is part of the PSA029 power supply. - Page 122 Step 11 A progress bar will appear under the Upload Firmware button followed by progress screens. FIGURE 14-3 Upgrade Firmware/Options Progress Step 12 After the upgrade is complete, connect the SoundAdvisor to G4 by selecting Connect, see “Connecting SoundAdvisor to G4” on page i-3. FIGURE 14-4 G4 Connect Button SoundAdvisor Model 831C...
-
Page 123: Upgrading Options
14.3 Upgrading Options 14.3.1 Saving an Option Upgrade File You will receive your .opt file from Larson Davis via email. Save this file on your PC to your desktop (or save in another location and make note of it). 14.3.2 Upgrading With Optional Firmware After saving the file to your PC, follow these steps: Step 1 Follow steps 1-6 of “Upgrading SoundAdvisor Firmware”... - Page 124 FIGURE 14-6 Options Enabled Hide/Unhide Option Step 2 Navigate ToolsSystem PropertiesOptions. FIGURE 14-7 User-defined Options Enabled While making Step 3 Check the options you wish to be available on the meter. TAKE NOTE changes to the Preferences, if Uncheck any options you want hidden. you have any unsaved data or are currently running a measurement, you will be...
- Page 125 Hide/Unhide Displays Step 4 Use the right soft key to navigate to Displays. Step 5 Under Tabs select tab of your option. Check all that you want visible. FIGURE 14-8 Displays Step 6 Close and save. SoundAdvisor Model 831C Enabling/Disabling Optional Firmware 14-6...
-
Page 126: Module15 Measurement History
Module15 Measurement History 15.1 Overview ..........................15-1 15.2 Enabling Measurement History ..................15-1 15.3 Setting up the Measurement ....................15-1 15.3.1 Create Measurement History Setup File ............15-1 15.4 Making a Measurement .....................15-4 15.5 Viewing Measurement Data ....................15-4 15.5.1 Current Data Display ...................15-4 15.5.2 Measurement History Data Display ..............15-5 15.5.3 Data File .......................15-6... -
Page 127: Setting Up The Measurement
FIGURE 15-1 Setup File Save As Step 2 Name file a unique name. This example will use “mHistoryEx” as the setup file name. Save. FIGURE 15-2 Name File Specify Run Mode Review Step 3 With your setup highlighted, use the top right softkey to TRY THIS “Measurement Setup”... -
Page 128: Setting Up The Measurement
• Interval Time • This is the time each measurement interval will be. The minimum permitted Interval Time is one minute; if a zero value is entered, it will default to one minute. • Interval Time Sync • This feature ensures that all measurement records, after the first, will begin at a time of day equal to a multiple of the measurement time selected. -
Page 129: Making A Measurement
Manual and Stop When Stable Mode For these run modes, when Measurement History is enabled, at the conclusion of a measurement, the data must be manually saved. Checking the “Enable Measurement History” check box does not add additional parameter fields to the display as it does with Continuous, Single Block Timer and Daily Timer modes. -
Page 130: Measurement History Data Display
FIGURE 15-5 Current Data Display 15.5.2 Measurement History Data Display The Measurement tab can display data for any one of the previously completed measurements. These measurement records are numbered in sequence from the first to the last. FIGURE 15-6 Measurement History Selected record number/ Number of measurements Graph of Leq values... -
Page 131: Storing Measurement History
Frequency Spectra Displays When a frequency spectrum is displayed, the 4 and 6 keys are used to highlight to the left or right so that the levels can be displayed for different frequency bands. To change the displayed record, shift to a non-spectrum display to make the change then return to the frequency spectrum display. -
Page 132: Module16 Time History
Module16 Time History 16.1 Overview ..........................16-1 16.2 Metrics Logged ........................16-1 16.3 Enabling Time History .......................16-3 16.4 Setting up the Measurement ....................16-3 16.4.1 Create Time History Setup File ................16-3 16.5 Making a Time History Measurement ................16-4 16.6 Markers ..........................16-5 16.7 Viewing Time History Data ....................16-7 16.7.1 Time History Data Display ..................16-7 16.8 Storing Time History ......................16-9... - Page 133 Table 16.1 Time History Available Metrics Time Interval 2.5, 5, 10 ms 20 & 50ms 100 & 200 ms 500 ms, 1 s, 2 s 5 s -24 h Time History ωeq ωpeak ...
-
Page 134: Enabling Time History
16.3 Enabling Time History To ensure that the Time History option is successfully enabled and visible, see “Enabling/Disabling Optional Firmware” on page 14-4. 16.4 Setting up the Measurement While measurement parameters can be indicated directly in the Active setup, it is good practice to first create a user-defined setup file for any specific measurement you perform. -
Page 135: Making A Time History Measurement
Specify Time History Options Review Step 3 With your setup highlighted, use the top right softkey to TRY THIS “Measurement Setup” on navigate to Time History. Check Enable Time History. page 6-1 and indicate all the parameters for each setup Step 4 Indicate the desired time period. -
Page 136: Markers
16.6 Markers Markers can also The SoundAdvisor Time History option also includes markers; With TAKE NOTE initiate a sound recording, see markers you can mark a sound type. While the measurement is “Manual Sound Recording” running, for example, if a motorcycle enters the area, you can mark on page 18-2. - Page 137 Make a Measurement Step 6 Run a measurement. Navigate to Time History or Live. Step 7 Navigate MenuMark Sound Type. FIGURE 16-5 Mark Sound Type Menu Step 8 A partial menu will appear over your Time History tab. Use can select any of the markers to mark that sound type, deselect when you want to end the mark.
-
Page 138: Viewing Time History Data
16.7 Viewing Time History Data 16.7.1 Time History Data Display Single Value Metrics After the first time interval has passed, the data will display on the Time History tab in single values. Time History can display data pages just like Live or Overall, depending on the firmware options enabled and the setup used. - Page 139 FIGURE 16-9 Locate Record Menu Enter the desired record number and that record will highlight. You can use the top left and right softkeys to jump to the first or last record. Notice that there are 101 records in this example, and if you choose a number higher than 101, it will default to 101, overriding your request.
-
Page 140: Storing Time History
16.8 Storing Time History Although the time history data can be displayed during a measurement and after it has been stopped, the data has not been stored to memory. To store the data, press the 7 (Stop/Store) key. SoundAdvisor Model 831C Storing Time History 16-9... -
Page 141: Module17 Event History
Module17 Event History 17.1 Overview ..........................17-1 17.1.1 Level Based Events .....................17-1 17.2 Enabling Event History ......................17-1 17.3 Setting up the Measurement ....................17-1 17.3.1 Create Event History Setup File ................17-2 17.4 Making an Event History Measurement ................17-5 17.5 Viewing Event History Data ....................17-5 17.5.1 Exceedance Icon ....................17-6 17.5.2... -
Page 142: Setting Up The Measurement
17.3.1 Create Event History Setup File To create a new setup file, follow these steps Name the Setup Step 1 Navigate to Tools or Menu Setup Manager. Arrow down to Default and press ENTER. A Menu will appear. Select Save As. FIGURE 17-1 Setup File Save As Step 2 Name the file a unique name. - Page 143 Specify Trigger Options Review Step 3 With your setup highlighted, use the top right softkey to TRY THIS “Measurement Setup” on navigate to Triggers. Keep triggers at default or indicate page 6-1 and indicate all the new values depending on your measurement. parameters for each setup page that you need for your measurement.
- Page 144 Step 6 Indicate the Trigger Method. See “Triggering Method” on page 17-7. Email Alerts Step 7 Indicate if you want an email or text to alert you when the SPL 2 or PEAK 3 has been triggered. This feature can send real-time email and texts with sound files (compressed .ogg, email only) over a network connection as well.
-
Page 145: Making An Event History Measurement
17.4 Making an Event History Measurement To begin your measurement, press 9 (RUN/PAUSE) on the meter. For a basic measurement run overview, see “Making a Measurement” on page 7-1. 17.5 Viewing Event History Data Single Value Metrics After the first time interval has passed, the data will display on the Event History tab in single values. -
Page 146: Exceedance Icon
17.5.1 Exceedance Icon FIGURE 17-6 Exceedance Icon Ready Trigger Valid Continue? All the pre- The sound The sound level The sound level is samples have level exceeds has exceeded below the trigger been recorded the trigger the trigger level level and is in the and it is waiting level. -
Page 147: Storing Event History
Use the button on Octave Displays TRY THIS The 4 and 6 keys are used to step the selected event number to the each visible Event History page to test which values you right or left, respectively. can change on each page. To change the octave view, use the 5 to jump your cursor from record number to frequency, and use the 4 and 6 keys to highlight to the left or right so that the levels can be displayed for different frequency... -
Page 148: Dynamic Triggering
FIGURE 17-9 Event History with Level Triggering, events The bars represent the events (exceedances) logged during the measurement. At a minimum of 3 seconds, there are ~150. 0:00:00 1:56:39 3:53:19 5:49:59 7:46:39 9:48:18 11:44:58 13:41:38 15:38:18 17:34:58 19:31:38 21:28:18 23:24:58 Level Trigger Level Event 17.7.2 Dynamic Triggering... - Page 149 FIGURE 17-11 Event History with Dynamic Triggering, events With dynamic triggering, the exceedances The bars represent the events will only occur if the level exceeds the (exceedances) logged during the background level plus the offset. Here the measurement. At a minimum of 3 offset is 20 dB.
-
Page 150: Module18 Sound Recording
Module18 Sound Recording 18.1 Overview ..........................18-1 18.2 Enabling Sound Recording Option ...................18-1 18.3 Create Setup File .......................18-1 18.4 Manual Sound Recording ....................18-2 18.5 Marker Sound Recording ....................18-3 18.6 Event Sound Recording .....................18-4 18.6.1 Measurement History Sound Recording ............18-7 18.7 Sound Recording Range ....................18-8 18.7.1 Sound Recording Range Calculation ..............18-9 18.7.2... -
Page 151: Manual Sound Recording
Name the Setup Step 1 Navigate to Tools or Menu Setup Manager. Arrow down to Default and press ENTER. A Menu will appear. Select Save As. FIGURE 18-1 Setup File Save As Step 2 Name the file a unique name. This example will use “soundEx”... -
Page 152: Marker Sound Recording
Step 3 This menu is used to assign markers to the sound, however it is also used to manually record. Use the left softkey to initiate a sound record. Step 4 To stop recording, select Stop, Close, or stop the measurement. -
Page 153: Event Sound Recording
Step 4 Save. Make Setup Active Step 5 In the Setup Manager, click the soundEx setup and select Set To Active. Close. Step 6 Run a measurement. Step 7 While on Live (Profile) or Time History, navigate Menu Mark Sound Type. FIGURE 18-5 Mark Sound Type Step 8 A small overlay will appear on the bottom half of the... - Page 154 Step 2 Navigate Setup Manager Highlight your setup file Event History. FIGURE 18-7 Event History Step 3 Enable Event History. Step 4 Navigate to Sound. Enable Save Event Sound. FIGURE 18-8 Sound Event See “Sound Recording Range” Pre-trigger time on page 18-8.
- Page 155 If Event History is Step 5 Save. Select setup, Set to Active. Close. TAKE NOTE not enabled, but Event Sound is, a sound recording is still Step 6 Run a measurement. made on an exceedance as an exceedance sound recording. If a second event is Step 7 In this example, when the measured sound is above 65 db TAKE NOTE...
-
Page 156: Measurement History Sound Recording
18.6.1 Measurement History Sound Recording To learn more You can initiate a sound recording with each new measurement using LEARN MORE about Measurement History, the Measurement History option. At the beginning of each new see “Measurement History” measurement, a snapshot will record. To create a measurement using on page 15-1. -
Page 157: Sound Recording Range
While you can Step 6 Save. Select setup, Set to Active. Close. TAKE NOTE indicate the sound record up to 9999 s, the actual time may Step 7 Run a measurement. The first 5 seconds, in this example, be limited by the sample rate will be recorded. -
Page 158: Sound Recording Range Calculation
18.7.1 Sound Recording Range Calculation When the peak overload, range, and gain have been set for the SoundAdvisor, the sound recording range can be calculated using the table below: Table 18.2 Sound Recording Range Calculator Range High Normal Instrument Gain 0 dB +20 dB 0 dB... -
Page 159: Sound Recording Playback
18.8 Sound Recording Playback G4 LD Utility on a Sound recordings are saved as .wav (uncompressed) and .ogg TAKE NOTE PC will playback all audio files (compressed) files and can be played back on the SoundAdvisor if a recorded or saved. USB compatible device is inserted, or on a PC using G4 LD Utility. -
Page 160: Sound Recording File Size
tabs (depending on your measurement setup). A player will appear if you select the sound record. FIGURE 18-16 File Player 18.9.1 Sound Recording File Size To determine the file size of a sound recording, refer to the following table which describes an approximate file size for a sixty second sound recording: The .wav file sizes TAKE NOTE... -
Page 161: Appendix A Technical Specifications
Appendix Technical Specifications Overview ..........................A-1 SoundAdvisor Model 831C Instrument Platform ...............A-1 SoundAdvisor Model 831C Base Software .................A-5 SoundAdvisor Model 831C Octave Band Analysis Software – Option 831C-OB3 .....A-8 SoundAdvisor Model 831C Event Logging Software – Option 831C-ELA ......A-14 SoundAdvisor Model 831C Time History Software – Option 831C-LOG ......A-15 Frequency Response ......................A-16 A.7.1 Plane Parallel To Display Screen ...............A-16... - Page 162 SLM Performance • White backlight with adjustable brightness and on–time PRM831 with Direct Input • Touch screen to assist in data navigation 377B02 (dBµV) and measurement control Microphone (dB) • Multiple color themes for various lighting Gain 0 dB +20 dB 0 dB +20 dB conditions...
- Page 163 • Wireless LTE Gateway, Sierra Wireless Preamplifier Control: Digital control lines for AirLink RV-50, PN COM-RV50-DC-E or COM- preamplifier calibration check and overload RV50-DC-U detection Windspeed Pulse Input: Input accepts 0 to +3 AC/DC Output pulses from anemometer (+5V tolerant), 100kΩ Connector: 2.5mm (3/16”) Sub-Miniature Phone load, setting selects function Jack, AC Output on RING, DC Output on TIP...
-
Page 164: External Dc Power Supply
DVX014 WiFi Adapter: +0.7 W Pin # Description Signal Type Table A.2 Low Power At Boot-Up Vwthr1, Analog to Digital Input, 0 to +2.048 V, 100k load, scale Converter Input, Wind Power Power Direction with series resistor Parameters Icon Action Level Source... -
Page 165: Soundadvisor Model 831C Base Software
Table A.3 Power On After External Power Electrostatic Discharge The instrument is not adversely affected by Fail Schedule (Continued) electrostatic discharges. Time Since Last Powers On Environmental Conditions Power Fail Operating Temperature: –30 to +50°C (–22 to 6th Attempt 12 hours 122°F) 7th - 16th Attempt 24 hours... -
Page 166: Measurement System
Table A.4 SLM with PRM831 and 377B02 Microphone 0° Free Field 0° Free Field Expanded 0° Free Field 0° Free Field Corrections with Corrections with uncertainty of Frequency Corrections Corrections Corrections dB re 1 kHz dB re 1 kHz dB re 1 kHz dB re 1 kHz 31.62 -0.14... - Page 167 Exceedance Metrics, exceedance levels (L1, L2, P1, Slow ASmax CSmax ZSmax P2 and P3) selectable in dB from 0.0 to 200.0, Minimum counts each time the level rises above the Fast AFmin CFmin ZFmin threshold and measure the duration while above Minimum the level minus 2dB.
-
Page 168: Soundadvisor Model 831C Octave Band Analysis Software - Option 831C-Ob3
Location, GPS (internal or external GPS, records available, special restart after low battery features last fix of measurement): enabled • Latitude: dg m.m Single Block Timer: Runs from a set date and time • Longitude: dg m.m to another date and time •... - Page 169 Filter Linearity Table A.5 Octave Band Analysis 1/1 Octave Linearity Range Nominal Nominal Frequency High OBA Range Normal OBA Range Frequency High OBA Range Normal OBA Range (Hz) (Hz) 0 dB +20 dB 0 dB +20 dB 0 dB +20 dB +20 dB 0 dB Gain...
- Page 170 Table A.6 Octave Band Analysis 1/3 Octave Linearity Range Nominal Nominal Frequency High OBA Range Normal OBA Range Frequency High OBA Range Normal OBA Range (Hz) (Hz) 0 dB +20 dB 0 dB +20 dB 0 dB +20 dB 0 dB +20 dB Gain Gain...
- Page 171 Table A.7 Octave Band Analysis 1/3 Octave Linearity Range Nominal Nominal Frequency High OBA Range Normal OBA Range Frequency High OBA Range Normal OBA Range (Hz) (Hz) 0 dB +20 dB 0 dB +20 dB 0 dB +20 dB 0 dB +20 dB Gain Gain...
- Page 172 FIGURE A-2 Self-generated noise levels for 1/1 octave filters with PRM831 PRM831 1/1 OBA Noise Floor 50.0 40.0 30.0 20.0 High +0dB High +20dB 10.0 Normal +0dB Normal +20dB -10.0 -20.0 -30.0 1000 10000 FIGURE A-3 Self-generated noise levels for 1/1 octave filters with direct input Direct 1/1 OBA Noise Floor 50.0 40.0...
- Page 173 FIGURE A-4 Self-generated noise levels for 1/3 octave filters with PRM831 PRM831 1/3 OBA Noise Floor 50.0 40.0 30.0 20.0 High +0dB High +20dB 10.0 Normal +0dB Normal +20dB -10.0 -20.0 -30.0 1000 10000 FIGURE A-5 Self-generated noise levels for 1/3 octave filters with direct input Direct 1/3 OBA Noise Floor 50.0 40.0...
-
Page 174: Soundadvisor Model 831C Event Logging Software - Option 831C-Ela
OBA Measurement System OBA Overall Minimum Ƭmin(f) ωƬmin(f) Integration Method: Follows setting for SLM Level Spectrum Frequency Weightings: Independent of setting for SLM, selected frequency weighting (A, C or Z) Percentile Spectrum Levels, uses same indicated by percentages n1 through n6 selected in SLM, 0.01 to Time Weightings/Detectors: Follows setting for 99.99% SLM, time weighting (S, F or I) indicated by ... -
Page 175: Soundadvisor Model 831C Time History Software - Option 831C-Log
Exponent Units Linear Units Maximum Level ωƬmax Equivalent Level ωeq ωƬeq Lρ Maximum Peak peak Sound Exposure Level ωE ωƬE Level Pa2s Sound Exposure ωE ωƬE Exponent Linear Units OBA Live ωeq(f) ωƬeq(f) Equivalent Level Spectrum Event Time History ωeq ωƬeq (requires 831C- Equivalent Level... -
Page 176: Frequency Response
A.7 Frequency Response The following data was taken using the Larson with 0° and rotating to 250°. The frequency was Davis Model 831 Sound Level Meter with a PRM831 measured in Hertz and ranged from ~200 Hz to 20K preamplifier at degrees increasing by 10, starting A.7.1 Plane Parallel To Display Screen FIGURE A-6 Model 831 with 377B02 Microphone... - Page 177 FIGURE A-7 Model 831 with 377B02 Microphone Mic at n° 40° 80° 120° 160° Frequency (Hz) FIGURE A-8 Model 831 with 377B02 Microphone Mic at n° 10° 50° 90° 130° 170° Frequency (Hz) SoundAdvisor Model 831C A-17...
- Page 178 FIGURE A-9 Model 831 with 377B02 Microphone Mic at n° 0° 30° 70° 110° 150° Frequency (Hz) FIGURE A-10 Directional Characteristics 0° 350° 10° 340° 20° 330° 30° 320° 40° 310° 50° 300° 60° 290° 70° 280° 80° 1000 Hz 270°...
- Page 179 FIGURE A-11 Model 831 with 377B02 Microphone 0° 350° 10° Frequency (Hz) 340° 20° 281.84 330° 30° 320° 40° 354.81 446.68 310° 50° 562.34 300° 60° 707.95 290° 70° 891.25 1122.02 280° 80° 1412.54 1778.28 270° 90° 2238.72 260° 100° 2818.38 3548.13 250°...
- Page 180 FIGURE A-13 Model 831 with 377B02 Microphone 0° 350° 10° Frequency (Hz) 340° 20° 298.54 330° 30° 375.84 320° 40° 473.15 310° 50° 595.66 300° 60° 749.89 944.06 290° 70° 1188.5 1496.24 280° 80° 1883.65 2371.37 270° 90° 2985.38 260° 100°...
- Page 181 FIGURE A-15 Model 831 with 377C20 Microphone Mic at n° 20° 60° 100° 140° 180° Frequency (Hz) Model 831 with 377C20 Microphone FIGURE A-16 Mic at n° 40° 80° 120° 160° Frequency (Hz) SoundAdvisor Model 831C A-21...
- Page 182 FIGURE A-17 Model 831 with 377C20 Microphone Mic at n° 10° 50° 90° 130° 170° Frequency (Hz) FIGURE A-18 Model 831 with 377C20 Microphone Mic at n° 0° 30° 70° 110° 150° Frequency (Hz) SoundAdvisor Model 831C A-22...
- Page 183 FIGURE A-19 Model 831 with 377C20 Microphone 0° 350° 10° Frequency (Hz) 340° 20° 281.84 330° 30° 320° 40° 354.81 446.68 310° 50° 562.34 300° 60° 707.95 290° 70° 891.25 1122.02 280° 80° 1412.54 1778.28 270° 90° 2238.72 260° 100° 2818.38 3548.13 250°...
- Page 184 FIGURE A-21 Model 831 with 377C20 Microphone 0° 350° 10° Frequency (Hz) 340° 20° 298.54 330° 30° 375.84 320° 40° 473.15 310° 50° 595.66 300° 60° 749.89 944.06 290° 70° 1188.5 1496.24 280° 80° 1883.65 2371.37 270° 90° 2985.38 260° 100°...
-
Page 185: Perpendicular To Plane Of Display Screen
A.7.2 Perpendicular to Plane of Display Screen FIGURE A-23 Model 831 with 377B02 Microphone Mic at n° 20° 340° 60° 300° 100° 260° 140° 220° 180° Frequency (Hz) SoundAdvisor Model 831C A-25... - Page 186 FIGURE A-24 Model 831 with 377B02 Microphone Mic at n° 40° 320° 80° 280° 120° 240° 160° 200° Frequency (Hz) FIGURE A-25 Model 831 with 377B02 Microphone Mic at n° 0° 30° 330° 70° 290° 110° 250° 150° 210° Frequency (Hz) SoundAdvisor Model 831C A-26...
- Page 187 FIGURE A-26 Model 831 with 377B02 Microphone Mic at n° 10° 350° 50° 310° 90° 270° 130° 230° 170° 190° Frequency (Hz) FIGURE A-27 Model 831 with 377B02 Microphone 0° 350° 10° 340° 20° Frequency Hz 330° 30° 320° 40° 310°...
- Page 188 FIGURE A-28 Model 831 with 377B02 Microphone 0° 350° 10° Frequency (Hz) 340° 20° 330° 30° 320° 40° 310° 50° 300° 60° 290° 70° 1122 1413 280° 80° 1778 270° 90° 2239 2818 260° 100° 3548 4467 250° 110° 5623 7079 240°...
- Page 189 FIGURE A-30 Model 831 with 377B02 Microphone 0° 350° 10° 340° 20° Frequency (Hz) 330° 30° 320° 40° 310° 50° 300° 60° 290° 70° 1000 280° 80° 1259 1585 270° 90° 1995 2512 260° 100° 3162 3981 250° 110° 5012 6310 240°...
- Page 190 FIGURE A-32 Model 831 with 377C20 Microphone Mic at n° 40° 320° 80° 280° 120° 240° 160° 200° Frequency (Hz) FIGURE A-33 Model 831 with 377C20 Microphone Mic at n° 0° 30° 330° 70° 290° 110° 250° 150° 210° Frequency (Hz) SoundAdvisor Model 831C A-30...
- Page 191 FIGURE A-34 Model 831 with 377C20 Microphone Mic at n° 10° 350° 50° 310° 90° 270° 130° 230° 170° 190° Frequency (Hz) FIGURE A-35 Model 831 with 377C20 Microphone 0° 350° 10° 340° 20° Frequency Hz 330° 30° 320° 40° 310°...
- Page 192 FIGURE A-36 Model 831 with 377C20 Microphone 0° 350° 10° Frequency (Hz) 340° 20° 330° 30° 320° 40° 310° 50° 300° 60° 290° 70° 1122 1413 280° 80° 1778 270° 90° 2239 2818 260° 100° 3548 4467 250° 110° 5623 7079 240°...
-
Page 193: Random Incidence
FIGURE A-38 Model 831 with 377C20 Microphone 0° 350° 10° 340° 20° Frequency (Hz) 330° 30° 320° 40° 310° 50° 300° 60° 290° 70° 1000 280° 80° 1259 1585 270° 90° 1995 2512 260° 100° 3162 3981 250° 110° 5012 6310 240°... -
Page 194: Typical Z-Weight Frequency Response
A.7.4 Typical Z-Weight Frequency Response For frequency responses of the Model with the PRM2103 Outdoor Microphone Preamplifier PRM2103 preamplifier, see the Larson Davis Manual. FIGURE A-40 Z Frequency Weighting, Direct Input Z Frequency Weighting, Direct Input Z Frequ -10.0 -20.0 -30.0... -
Page 195: Declaration Of Conformity
A.8 Declaration of Conformity SoundAdvisor Model 831C A-35... -
Page 196: Appendix B Measuring Iec61672-1
Appendix Measuring IEC61672-1 B.1 Overview This appendix presents information for measuring the sound level meter functionality of the Larson Davis SoundAdvisor Model 831C Sound Level Meter according to IEC61672-1 Edition 2.0 2013-09. B.2 Section 9.3 a) Reference Sound Pressure Level The reference sound pressure level is 114 dB re 20 µPa. - Page 197 Table B.1 831C with PRM831 and 377B02 Microphone average frequency responses and corrections Required by IEC 61672-1 1258.93 -0.39 0.39 0.31 -0.08 0.08 0.25 1333.52 -0.29 0.29 0.21 -0.08 0.08 0.25 1412.54 -0.27 0.27 0.20 -0.07 0.07 0.25 1496.24 -0.13 0.13 0.07 -0.06...
- Page 198 Table B.1 831C with PRM831 and 377B02 Microphone average frequency responses and corrections Required by IEC 61672-1 9440.61 0.01 -0.01 -0.03 -0.02 0.02 0.55 10000.00 0.01 -0.01 0.21 0.22 -0.22 0.55 10592.54 0.07 -0.07 0.09 0.16 -0.16 0.55 11220.18 0.05 -0.05 -0.05 0.00...
- Page 199 Table B.2 Directional Response of 3 1/2” Windscreen 0.10 0.10 0.13 0.07 0.03 0.00 0.03 0.03 0.07 0.00 0.03 0.10 0.00 668.34 0.10 0.10 0.13 0.07 0.03 0.07 0.10 0.07 0.03 0.10 0.03 0.10 0.00 707.95 0.10 0.10 0.13 0.07 0.00 -0.03 0.10...
- Page 200 Table B.2 Directional Response of 3 1/2” Windscreen 0.13 0.10 0.20 0.07 -0.03 -0.03 -0.13 -0.17 -0.27 -0.33 -0.40 -0.40 -0.20 6683.44 0.03 0.07 0.07 0.07 0.03 0.00 -0.10 -0.13 -0.17 -0.27 -0.27 -0.23 -0.13 7079.46 -0.10 -0.10 -0.07 -0.03 -0.07 -0.03 -0.20...
- Page 201 The electrical design of the input device to insert electrical signals into the preamplifier is a series 12pF ± 5% capacitor. The Larson Davis ADP090 is used for this purpose. The ADP090 is also use for noise floor measurements by attaching the included BNC short on the front of the ADP090.
- Page 202 k) Battery Power Voltage Range The battery power supply voltage range for which the 831C conforms to this standard: 16.8 Volts maximum The 831C will shut down if the battery is below 4.0 Volts when used with alkaline batteries. Therefore from 4.0 to 16.8 Volts is the usable range of battery voltage.
-
Page 203: Appendix C Glossary
This appendix contains technical definitions of key acoustical and vibration terms commonly used with Larson Davis instruments. The reader is referred to American National Standards Institute document S1.1-1994 (R2004) for additional definitions. Specific use of the terms defined are in the main body of the text. - Page 204 L p t q -- - qLog Community Noise A rating of community noise exposure to all sources of sound that differentiates Equivalent Level between daytime, evening and nighttime noise exposure.
- Page 205 Day-Night Average A rating of community noise exposure to all sources of sound that differentiates Sound Level (DNL, between daytime and nighttime noise exposure. The equation for it is 0700 2200 2400 10 ...
- Page 206 Note: The latter is frequency and level dependent, but the value “10 dB” is a good rule of thumb, especially around 1 kHz. Table C.1 shows the actual value of a specific item, such as sound power, for which the sound level is calculated. First, the sound power value is divided with the reference used and then the ten-based logarithm is applied.
- Page 207 20Pa ------- - ----- - 10Log 20Log Table C.1 illustrates how a a tenfold increase of the sound pressure will result in an increase in 20 dB steps, while sound power increases in 10 dB steps. See the linear form (Table C.1) and compare with equation above. In conclusion, dB values are always the same, independent of using sound power or sound pressure as the base unit.
- Page 208 t t d ------------------------- - 10Log where p is the sound pressure and the Measurement Duration (specific time period) T=T2-T1. See “Sound Pressure Level (SPL, Lp)” on page C-13.. Exchange Rate (Q), It is defined in ANSI S1.25 as “the change in sound level corresponding to a Exchange Rate doubling or halving of the duration of a sound level while a constant percentage Factor (q),...
- Page 209 unit symbol Hz (Hertz) added and the letter f is used for a universal descriptor. It can also be expressed in radians per second, which has no symbol, and the greek letter w is used for a universal descriptor. The two expressions are related ...
- Page 210 Table C.4 Frequency Filter Response Weighting Network Frequency Center Frequencies, Hz Response 1/3 Octave 1 Octave -50.4 -24.2 -6.2 -44.7 -20.4 -4.4 31.5 31.5 -39.4 -17.1 -3.0 -34.6 -14.2 -2.0 -30.2 -11.6 -1.3 -26.2 -9.3 -0.8 -22.5 -7.4 -0.5 -19.1 -5.6 -0.3 -16.1...
- Page 211 Standard: ANSI S12.19 Microphone Microphone - Types: A device for detecting the presence of sound. Most often it Guidelines converts the changing pressure associated with sound into an electrical voltage that duplicates the changes. It can be composed of one of the following types: Capacitor (Condenser): A microphone that uses the motion of a thin diaphragm caused by the sound to change the capacitance of an electrical circuit and thereby to create a signal.
- Page 212 is applied on one-half the diaphragm and an equal positive pressure is applied to the other half, the net force is zero and essentially no motion of the diaphragm occurs. This occurs at high frequencies and for specific orientations of the microphone.
- Page 213 Geometric Near Field: The distance from a source of sound is less than the largest dimension of the sound source. In the near field, effect of source geometry is significant. Sound sources often have a variety of specific sources within them, such as exhaust and intake noise.
- Page 214 Projected Noise It is the Noise Dose expected if the current rate of noise exposure continues for Dose the full Criterion Duration period. Single Event Noise The total sound energy over a specific period. It is a special form of the Sound Exposure Level Exposure Level where the time period is defined as the start and end times of a (SENEL, LAX)
- Page 215 Pascal squared- hours. P is the reference pressure of 20 µPa and T is the reference time of 1 second. It is then put into logarithmic form. It is important to note that it is not an average since the reference time is not the same as the integration time.
- Page 216 Instantaneous: The time varying reading on a meter face on in a meter output due to changes in the sound pressure. The reading will depend on the time- weighting applied. The fundamental relationship between the two is logarithmic L p 20 p rms ------------ 20log...
- Page 217 Sound Power Level The logarithmic form of sound power. It is also expressed by attachment of the (PWL, Lw) word decibel to the number. The logarithm is taken of the ratio of the actual sound power to a reference sound power, which is 1 pico-watt. Sound power level cannot be measured directly, but can only be deduced through measurements of sound intensity or sound pressure around the source.
- Page 218 Time Weighted It is the level of a constant sound over the Criterion Duration, that would expose a Average Sound person to the same Noise Dose as the actual (unsteady) sound over the same Level (TWA, period. If the Exchange Rate is 3 dB then the TWA is equal to the Leq. LTWA(TC)) ...
Need help?
Do you have a question about the SoundAdvisor 831C and is the answer not in the manual?
Questions and answers