Larson Davis System 824 Reference Manual
Sound level meter
Hide thumbs
Also See for System 824:
- Training manual (143 pages) ,
- Technical reference manual (673 pages) ,
- Training manual (66 pages)
Table of Contents
Advertisement
Quick Links
Download this manual
See also:
Training Manual
Advertisement
Table of Contents

Subscribe to Our Youtube Channel
Related Manuals for Larson Davis System 824


Summary of Contents for Larson Davis System 824
- Page 1 System 824 Reference Manual Larson Davis Inc. 1681 West 820 North Provo, UT 84601-1341 Phone: (801) 375-0177 FAX: (801) 375-0182 www.larsondavis.com I824.01 Rev. g...
- Page 2 Representation and warranties made by any person, including its authorized dealers, representatives, and employees of Larson Davis which alter or are in addition to the terms of this warranty shall not be binding upon Larson Davis unless in writing and signed by one of its officers.
- Page 3 824 Reference Manual Please examine your instrument and record the following information below. You may be asked to give this information in any future communications you have with Larson Davis, Inc. Record of Serial Number and Purchase Date System 824 Serial #: _____________________ PRM902 Pre-amp.
- Page 4 824 Reference Manual...
-
Page 5: Table Of Contents
Using the NiMH Battery Pack ..............1-14 Using Alkaline Batteries ................1-14 Using the AC Power Adapter..............1-15 Chapter 2 Overview System 824 Setups or Instrument Definitions ............2-1 Instrument Definition (ID) Types ................2-2 SLM&RTA (SSA) .....................2-2 SLM (ISM) ......................2-4 Logging (LOG) ....................2-4 Selecting a Measurement Setup................2-5 Performing a Measurement;... - Page 6 824 Reference Manual Storing Data....................2-13 Recalling Data .....................2-13 Calibration ......................2-14 Chapter 3 Front Panel Keys; their Functions and Menus Power Key ......................3-3 Power-up the Instrument / Viewing PWR Display ..........3-4 Power Settings....................3-6 Extra Notes on Power Conservation ..............3-8 Run/Stop Key ....................3-9 Reset Key ......................3-9 Pause Key......................3-10 Pause......................3-10...
- Page 7 824 Reference Manual Chapter 4 Quick Start Turning On and Calibrating the System 824 ............4-1 Taking Measurements and Storing Data..............4-3 SLM&RTA Measurements ................4-3 Viewing RTA Displays during a Measurement ..........4-6 Recalling Stored Data .....................4-8 Selecting and Modifying Instrument Definitions (IDs) ........4-10 The Setup Menu ....................4-11...
- Page 8 824 Reference Manual Any Impulse Format..................6-8 Any Time Format ..................6-8 SSA Specific Views....................6-9 SSA Displays ....................6-11 RTA Displays....................6-11 Tabular RTA Views ..................6-11 Time History Displays ................6-12 SSA Time History ..................6-16 Run Log.......................6-19 Ln Centiles ....................6-19 Logging SLM Specific Views ................6-23 Current SLM and Overall SLM Views ............6-25 Current SLM/Overall SLM Display-a (SPL) ..........6-26 Current/Overall SLM Display-b (Times) ............6-28...
- Page 9 824 Reference Manual Excd-b Display....................6-50 Excd Time History Display.................6-51 Daily Views......................6-53 Daily-a Display ...................6-53 Daily-b Display ...................6-55 Hourly Leq Display..................6-56 Metrics ......................6-57 Metrics-a Display ..................6-57 Metrics-b Display..................6-58 PassBy ......................6-59 Chapter 7 Using ID Setting Files Recalling ID Setting Files..................7-1 Customizing Settings ....................7-2 Settings Example - SLM&RTA (SSA) ..............7-2 Settings Descriptions ....................7-4 Common SLM Settings..................7-5...
- Page 10 824 Reference Manual Ovll Threshold - (LOG) ................7-16 Ovll Criterion - (LOG) ................7-16 Criterion Time - (LOG)................7-17 Crnt Exchange - (SSA, ISM, LOG) ............7-17 Crnt Threshold (SSA, ISM, LOG) ..............7-18 Crnt Criterion (LOG) ..................7-18 LOG and SSA Ln Settings ................7-18 Enable Ln ....................7-19 Start Level ....................7-19 Ln’s ......................7-20...
- Page 11 824 Reference Manual Excd Time Hist - (LOG) ................7-33 T.H. Period - (LOG) ..................7-33 Excd Trigger - (LOG) .................7-33 Excd Time - (LOG) ..................7-33 Logging SLM Daily History Settings ..............7-34 Daily Enable - (LOG)..................7-34 Daily Ln’s - (LOG) ..................7-34 Logging SLM Define Report Settings .............7-34 Data Report - (LOG, SSA)................7-35 Setup Report - (LOG, SSA) ................7-35 SPL Histogram - (LOG) ................7-36...
- Page 12 824 Reference Manual Run Log Check Menu .................7-68 Time History Check Menu................7-69 Intervals Check Menu .................7-69 Excd History Check Menu ................7-70 Daily History Check Menu .................7-71 Chapter 8 Printing a Report Connecting the 824 to a Serial Printer ..............8-1 Printing Reports ......................8-2 Defining and Printing Tailored Reports..............8-5 Using the Recall Format (SSA and LOG instruments only)......8-7 Default Settings Values for the Recall Format Reports ........8-8...
- Page 13 824 Reference Manual Printing a Translated File .................9-29 Viewing a Translated File Within a Spreadsheet Program ......9-31 Additional Features....................9-32 Chapter 10 RTA (optional) 10-1 Settings Menu .......................10-2 Settings Descriptions ....................10-5 RTA Settings Menu ..................10-5 Autostore Settings Menu..................10-7 Arm Settings Menu ..................10-8 Trigger Settings Menu ...................10-10 End Settings Menu ..................10-11 Then Settings Menu ..................10-12...
- Page 14 824 Reference Manual THD Check Menu ..................11-10 Snapshot......................11-11 Snapshot Check Menu ...................11-11 Entering Linear Units..................11-12 Chapter 12 AUD (Optional) 12-1 Selecting the 824-AUD Operation Mode .............12-2 SLM+RTA Mode....................12-3 SLM+RTA Live screen..................12-3 Any Level-a Screen..................12-4 FFT Mode ......................12-5 FFT Screen .......................12-5 THD (Total Harmonic Distortion) ..............12-6 Linearity ......................12-9 Pulse/FM Mode....................12-11...
- Page 15 824 Reference Manual Numeric Settings ..................B-28 Character String Settings................B-28 Template Settings..................B-28 Setting List ......................B-29 Histogram Reports ..................B-36 Tailored Report ..................B-37 Miscellaneous..................... B-37 Error Checking I/O ..................B-40 RTA Settings Commands................B-42 History Records....................B-45 Types of History..................
- Page 16 824 Reference Manual Appendix D Glossary Allowed Exposure Time (Ti) ...............D-1 Average Sound Level (Lavg) ...............D-1 Calibration....................D-2 Community Noise Equivalent Level (CNEL, Lden)........D-2 Criterion Duration (Tc) ................D-2 Criterion Sound Exposure (CSE) ..............D-3 Criterion Sound Level (Lc) ................D-3 Daily Personal Noise Exposure (LEP,d) ............D-3 Day-Night Average Sound Level (DNL, Ldn)..........D-3 Decibel (dB) ....................D-4 Department of Defense Level (LDOD)............D-5...
- Page 17 824 Reference Manual Sound Pressure Level (SPL, Lp) ..............D-16 Sound Power(W) ..................D-18 Sound Power Level (PWL, Lw) ..............D-18 Sound Speed, (c,) ..................D-18 Spectrum (Frequency Spectrum)..............D-18 Threshold Sound Level (Lt) ...............D-18 Time Weighted Average Sound Level (TWA, LTWA(TC)) .....D-19 Time Weighting..................D-19 Vibration.....................D-19 Wavelength (l)....................D-19 Wavenumber (k)..................D-20...
- Page 18 824 Reference Manual...
-
Page 19: Chapter 1 Introduction
Chapters Chapter 1 - Introduction: Orients the user to the con- • tents of this user manual and the System 824’s features, functions and measurement capabilities. It also includes instructions on unpacking the System 824. Chapter 2 - Overview: Provides an overview of the •... - Page 20 • Chapter 5 - System 824 Instrument Modes : Provides descriptions of the System 824’s standard instrument ID’s. • Chapter 6 - System 824 Views: Gives you a detailed description of the different display views available and how to access them.
-
Page 21: About This Chapter
This introductory chapter covers the following topics: Formatting Conventions: Provides an explanation of • the fonts and other formatting conventions used in this manual. Features: Gives an overview of the System 824 keypad, • functions and measurement capabilities. Getting Started: Provides instructions for unpacking, •... -
Page 22: Features
Keys to press on the System 824 are shown with the icon representing the appropriate key. For example: Press the Items that appear in various on-screen menus (such as set- tings) are shown in bold and italicized style. For example:... - Page 23 AUD: Gives the 824 the ability to certify audiom- eters; used in conjunction with the AUDit soft- ware (optional) TAL: Measures tonality according to DIN 45681 and appraisal of low frequencies according to DIN 45680 (optional) • Type 1 precision integrating sound level meter (satisfies IEC 60651-1993, IEC 60804-1993, and ANSI S1.4 1985) •...
- Page 24 • Standard memory (2 MB) sufficient to store one of the following: - 30,000 point 1/3 octave SSA Leq time history - 20,000 intervals with 1/3 octave Leq spectrum - 12,300 SSA intervals with Leq & Max 1/3 octave spectra - 60,000 LOG intervals without Ln - 35,000 LOG intervals with Ln - 1,000,000 point time history...
-
Page 25: System 824 Components
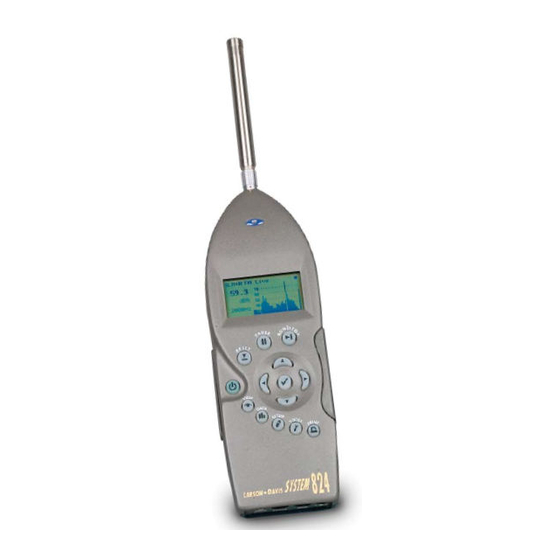
9 cm (3.5”) Figure 1- 1 The System 824 is a convenient hand-held sound level meter with a simple user interface. The standard System 824 shown in Figure 1-1 includes the following: • 1/2” diameter condenser microphone • Backlit graphic 64 x 128 pixel LCD display •... - Page 26 Serial Interface Connector External DC Power Connector Figure 1-2 The System 824 has a series of connectors located at the bottom of the device consisting of an AC and DC output connection, control connector, serial interface connector, and external DC power connector.
- Page 27 Both outputs have a 600 ohm series The AC/DC output connector is used to output the signal resistance. from the System 824 microphone to external devices such as DAT recorders, real-time analyzers, other sound/vibration measurement equipment, voltmeters, chart recorders, etc.
-
Page 28: System Diagram
System Diagram Figure 1-6, illustrates the acoustic-to-digital signal path in the System 824. As you can see, incoming sound is first con- verted to an electrical signal by the microphone. This electri- cal signal is filtered and sampled by an analog-to-digital converter (ADC). - Page 29 Figure 1-6 System Diagram Sysjklsfdakjl;fasdjl;kasdflj;ksdfal;jkklj;kl Figdfdsafdsa 11/8/00 Introduction 1-11...
-
Page 30: Unpacking And Inspection
You will then be ready to use the System 824 for actual mea- surements. Unpacking and Inspection Your System 824 has been shipped in protective packaging. Please verify the package contains the items listed below. Retain the packaging for safe shipment for calibration ser- vice. -
Page 31: Connecting Internal Or External Power
CBL079 to attach to the 824. Connecting Internal or External Power The 824 is shipped with a NiMH bat- The System 824 can be powered using a NiMH battery pack, alkaline batteries, or an AC power supply adapter. Below we tery pack preinstalled. -
Page 32: Using The Nimh Battery Pack
Using the NiMH Battery Pack To use a NiMH battery pack with the System 824, unscrew the battery cover at the back of the System 824 by hand or For additional battery information, using a flat blade screwdriver. If alkaline batteries were pre- refer to the sections entitled “... -
Page 33: Using The Ac Power Adapter
If the System 824 is not being used for long periods of time (1 month or more), it is recommended that the batteries be removed to avoid damage to the instrument. Figure 1- 8 Battery Terminal Assembly orientation. NOTE: Two Terminal assemblies are provided though only one is used. - Page 34 1-16 824 Reference Manual 11/8/00...
-
Page 35: Chapter 2 Overview
System 824 Setups or Instrument Definitions The power and flexibility of the System 824 gives you a variety of measurement possibilities. The System 824 has a number of distinct setups or Instrument Definitions (ID) from which you can select the one best suited for a particular application. -
Page 36: Instrument Definition (Id) Types
“SSA” represents Sound Spectrum Analyzer. Sound levels during the measurement period are displayed and can be stored for later recall. In addition to a live spectrum display, the System 824 can display an equivalent level (L ) spec- trum, a minimum bin by bin level (L... - Page 37 80 dBA. The design of the System 824 permits the simultaneous mea- surement of the following sound level parameters, a feature we call “Any Data”:...
-
Page 38: Slm (Ism)
For German users, as a no-cost option, the following addi- tional parameters are provided: with the following combinations of frequency Taktmaximal weighting and time weighting: Taktmaximal 3 Taktmaximal 5 Slow Fast Slow Fast Flat SLM (ISM) The SLM (ISM) is the simplest to operate, providing the functions of a “point-and-shoot”... -
Page 39: Selecting A Measurement Setup
• , SEL, and L (q=3) or Time Weighted Aver- age (q=4, 5, or 6) levels for a selected detector (Slow, Fast, or Impulse) and a selected frequency weighting (A, C, or Flat) • level corresponding to the frequency weighting peak selected for L (see charts above) and a second L... -
Page 40: Performing A Measurement; Slm&Rta (Ssa) Example
• Cannot store data • Cannot perform any I/O commands • Only 20 demos are permitted • Memory must be purged prior to activating these IDs The following is an overview of how to select a measure- ment setup. Step 1 To display the available instrument setups, press Setup key. -
Page 41: Stop, Pause And Back Erase Functions
Step 1 Let’s look at the SLM&RTA (SSA) ID Access the Setup Menu by pressing and use the a nd keys to highlight the SLM&RTA ID, as shown below: Step 1 With SLM&RTA highlighted, press to select it as the current ID. Step 2 Press the RUN/STOP key to begin a measure- ment and obtain a display resembling the follow-... -
Page 42: Back Erasing
While paused, the a nd k eys can be used to move a cursor across the time history and display the SPL and sec- ondary parameters as measured at any particular time during the measurement period. Back Erasing Should an unwanted sound occur during the measurement, such as a door slam, you can pause the instrument, cursor to the left with the k ey to a time prior to the unwanted... -
Page 43: Changing The Frequency Weighting Of The Displayed Spl Value
Changing the frequency weighting of the displayed SPL value Step 1 To select the frequency weighting parameter, press keys to highlight the A-weighting as shown: Step 2 Use the a rrow keys to display the C- weighted or Flat-weighted SPL corresponding to the Slow detector. -
Page 44: Changing The Frequency Weighting Of The Displayed Lpeak Value
Changing the frequency weighting of the displayed Lpeak value Step 1 With the Peak label selected, press the k eys to highlight the Peak weighting. Use the a rrow keys to display the A, C or Flat weighted Lpeak values. Changing the amplitude range, or input Gain When using the SSA ID, as in this example, the measure- ment range is 80 dB, unlike the ISM and LOG IDs for which... -
Page 45: Views
Views For each instrument type (e.g. ISM, LOG or SSA), a unique set of data displays or VIEWS are available. Selecting a VIEW There are eight different VIEW choices available in the SSA instrument. Step 1 To display the set of available data presentations, or VIEWS, press the View key (use the keys to scroll through the entire range of... - Page 46 The VIEW choices for the SSA instrument type are as fol- lows: Sound Level Meter parameters, graphic and digital display Any Data Tabular presentation of sound level meter parameters RTA Live Live display of real-time frequency spectrum RTA Leq Display of Leq spectrum over elapsed mea- surement period RTA Max Display of the live spectrum corresponding...
-
Page 47: Data Storage And Recall
As part of this exercise, select each of these various VIEWs and use the a nd k eys to see how a variety of differ- ent parameters are displayed within each function. We have sought only to explain the general concept of the VIEW function at this time. -
Page 48: Calibration
Step 2 Press the up a nd down a rrow keys until the desired file is indicated. Press the check key, select “Recall” from the menu and press the check key again. Calibration Calibration is one of the functions available from the Tools Menu. - Page 49 Step 3 To setup the calibration process, press the k ey to move into the Calibration Menu. Step 4 To set the calibration level, press the keys to highlight “Cal Level”, Step 5 To set the value of the sound level provided by the calibrator, press the k ey.
- Page 50 Step 8 To verify that the instrument is properly cali- brated, use the k ey to highlight “Check”. Step 9 Place the calibrator over the microphone, switch the calibrator ON, and press to activate the cal- ibration Check process. The display will show the measured level and the difference from the calibrator level entered and the measured level as shown.
-
Page 51: Chapter 3 Front Panel Keys; Their Functions And Menus
System 824 keypad (see Figure 3-1 below): Figure 3- 1 System 824 Keypad. The 14 keys on the System 824 keypad are organized into these four sections: Power, Measurement, Navigation, and Control. These keys are covered in the following order in this chapter: 11/8/00 Front Panel Keys;... - Page 52 Power Key Turns on / off the System 824; accesses bat- tery power monitoring and LCD utilities, POWER and is used to close menus. Measurement Keys Begins and ends measurements. RUN/STOP Pauses readings while running, Previews current SPL when stopped. Activates PAUSE Back Erase function.
-
Page 53: Power Key
The purpose of the POWER key on the System 824 is to turn the power on or off, close menus, and display the remaining battery life. Once the System 824 is turned on, pressing the key again will activate a PWR display where you can change screen contrast, turn the backlight on or off, and adjust power options. -
Page 54: Power-Up The Instrument / Viewing Pwr Display
Step 3 As soon as the hour glass icon disappears, the Sys- tem 824 is ready to acquire data. As soon as the System 824 is turned on, you can view the battery life and display settings through the PWR display. To... - Page 55 Check menus allow you easy access The settings menu allows you to adjust the contrast (or view- to system or instrument settings. ing angle), turn the backlight on or off, and adjust settings that control the power-conservation features. These power- arrow keys, allow conservation features allow you to set the instrument to do you to select the desired menu item...
-
Page 56: Power Settings
Power Settings Use the keys to move The Power menu provides the following menu items: from one setting to the next. Then use key to change the selected setting. The key is used to return to previous menus. Menu Items Description Display’s the Power Monitor display that shows the Status... - Page 57 Time (in minutes) when Standby Time power save Standby Time 0 - 99 minutes is activated. When activated, the System 824 screen blanks and the serial port turns off. If any key is pressed or if incoming serial activity is detected, the instrument will exit Standby Time and become active again.
-
Page 58: Extra Notes On Power Conservation
LCD Contrast 0 - 99% Adjusts the contrast or viewing angle of the LCD (The default contrast display. This is done by pressing either the up or u u u u setting is 66%) down arrow key. The key increases the contrast percentage, darkens the display and makes it visible from a higher angle (when viewing from the bottom d d d d... -
Page 59: Run/Stop Key
This will reset all the data including the accumulated measurement values such as L The SSA, ISM, and LOG instruments For the other instrument types, the System 824 gives addi- within the System 824, contain two tional flexibility when resetting the data. If you press the... -
Page 60: Pause Key
Pause Key PAUSE key has 3 basic functions in the ISM and SSA instruments: To Pause a measurement to avoid unwanted noise from entering into the measurement data. To erase unwanted data from the measurement and to preview the data coming into the instrument without registering the data. -
Page 61: Preview
Preview Pressing the PAUSE key when an instrument is “stopped” brings up a Preview display which allows you to view the SPL without affecting measured data. Pressing the PAUSE key again will exit this screen or simply press RUN/STOP key to exit this screen and start taking a measurement. -
Page 62: Check Key
View Key The display of data on screen of the System 824 is controlled by the VIEW key. Each instrument type (e.g. SSA, ISM, or LOG) has its own set of available data displays which are selected using this key. -
Page 63: Data Key
To access the Data Files menu press the DATA key. A screen similar to the following appears: A new System 824 will not contain data files for recall. From this menu you can store data or view and recall stored data. -
Page 64: Setup Key
Pressing the key from the Data When recalling a data file, the System 824 will switch to the Files display, brings up a menu that instrument definitions (ID) that the data file was stored as allows you to recall data, jump to (i.e. - Page 65 System 824. However, once these modifications have been made, the new ID is named and stored as described in the following section.
-
Page 66: Save Id
Title Description of ID ID Name Name of ID Save ID The Save ID menu item saves or creates an ID. Use the keys to highlight Save ID, then press . You will then be prompted to verify the name for the ID. (See ID Name below) Title You can attach a description to your ID with the Title menu... -
Page 67: Tools Key
Press the TOOLS key, and the following screen appears: Permanent IDs (marked with a ‘p’ in To write protect (or lock) an ID, use the k eys to the Setup menu) cannot be write pro- highlight Write Protect, and then press the key. - Page 68 The Tools menu provides the following seven options, NOTE: From any of the following dis- plays, the arrow keys will which are afterwards described in greater detail: step to the next or previous display in the list. Menu Item Available Settings Options Setting Screens r r r r k ey from Tools menu)
-
Page 69: About
0. Phone # Monitor Number Modem Init About To access information about the System 824 use the key to select About from the Tools menu, then press the key. The following screen appears: Instrument model number Instrument serial number... - Page 70 (Customized by user) The About-b display shows the instrument’s custom name and title fields printed on System 824 reports. The fields are generally set to the owner’s name and address. The name is displayed at “power on” and printed on reports to customize them to your business.
- Page 71 Only 20 demos are allowed. When “demos used” equals 20, unpurchased options are no longer available for use. If you have found them useful, they can be installed permanently without restrictions. Call Larson Davis for details. 11/8/00 Front Panel Keys; their Functions and Menus...
-
Page 72: Calibration
Calibration To calibrate the System 824, or to view previous calibration information, use the key to select Calibration from the Tools menu, then press the key. The following screen appears: Date and time of the last calibration The level detected during the last check... -
Page 73: Clock/Timer
Clock/Timer To display the time and date, or to view the timer settings, use the key to select Clock/Timer from the Tools menu, then press the key. The following appears: Current time Current day of the week and date The time of the next timer function The Time-a or clock display shows the current time, day of the week, date and the time of the next timer action. - Page 74 k ey. A screen similar to the following will appear: With the Clock / Timer menu you set the instrument's clock/ calendar and timer. The first three menu items allow you to set the current time, date, and day respectively, while the remaining items (Run/Stop Date, Run/Stop Time 1, Run/ Stop Time 2) allow you to control the timer function.
- Page 75 Timer Mode - The timer is used when you want to have the 824 automatically turn on, gather data, and stop at pre-deter- mined date(s) and time(s). The System 824 has four timer modes automating the start and end of measurements: Off - The timer is disabled.
- Page 76 Run Date - Specifies the starting date to take measurements. Stop Date - Specifies the date to end the measurement and disable the timer mode. Run Time 1 / Stop Time 1 - These settings allow you to specify the beginning and ending times of a measurement. Block, NOTE: If you have selected the 1/Day...
-
Page 77: Memory
Memory To access the Memory display, use the key to select Memory from the Tools menu, then press the key. The following appears: Available memory (as a percentage of total data memory) Available memory (in bytes) N u m b e r o f v ario u s ty p es o f h isto ry re co rd s fo r a given ID (SSA in this example) The Memory-a display shows the amount of memory avail- able for storing data. -
Page 78: Deleting Stored Data
play. In addition, the Memory-b display shows the number of data files in memory; number of setup registers allocated; and the total amount of memory, including that memory allocated for setup registers. Memory Settings can also be To modify the Memory settings use the key to accessed by pressing the key from... -
Page 79: 824 Memory Structure
data to memory. Essentially the record is unstored from memory. 824 Memory Structure The memory structure of the 824 is a forward and reverse linked list. This means that for each type of data there is a pointer to the first record and a pointer to the last record and that each record points to the next record and the previous record. - Page 80 This display shows the last record that was stored along with the date and time of the data, the instrument type it is recorded for, the bytes used by that record and how much- memory is available. Step 4 Press the Check key to delete this file.
-
Page 81: Deleting Individual Records
Deleting Individual Records After selecting “Open” in Step 5 above, the file record is deleted and now you are allowed to look at each individual record and decide whether to delete or store it with new data appended to it. Follow these steps to delete individual records: Step 1 The last display that was viewed will appear after selecting “Open”. -
Page 82: Power Monitor
The records will appear one at a time. Below are examples of some of the records. To delete them press the Check key. The following will appear: With “Delete” highlighted, press the Check key again to delete the record. The next record will appear. Continue this process until you have deleted all of records that you don’t want. -
Page 83: Communication
I/O command problems. The printer has its own baud rate for Baud Rate - Speed at which the System 824 communicates printing reports and is not affected with controlling devices (computer, modem, etc.) through by this setting. - Page 84 Default is set to the value of the last Serial Address - Address of instrument. This setting identi- 2 digits of the serial number and can fies the instrument within a network of instruments by be set within the range of 1 to 100. assigning it a network or serial address.
- Page 85 See page B-64 in Appendix B for Modem Mode - Turns the modem mode on or off to allow more detailed information about the communication to a telephone modem. Modem Mode. Dial Out Mode - The 824 will dial out on an Exceedance or an Alarm or both.
-
Page 86: Print Key
Monitor Number - The monitor number is used to identify which 824 is being queried and is sent with the 824’s initial announcement. Modem Init - The modem initialization string is entered here. Initialize - The modem initialization string is sent out the RS232 port. - Page 87 can create high-resolution presentation-quality reports when printing to a laser printer because of the instrument’s PDL-3 (Page Description Language) capabilities. Draft-quality tab- ular data reports can also be printed on virtually any serial printer. The Print menu provides the ability to output reports con- taining all the data gathered for the measurement to an attached printer.
- Page 88 3-38 824 Reference Manual 11/8/00...
-
Page 89: Chapter 4 Quick Start
Taking an actual measure- ment with the System 824 is as easy as pressing the (RUN/STOP) key. This chapter helps users begin using the System 824 imme- diately. - Page 90 Step 1 Turn on the System 824. To do this, press the This screen displays three lines of user information which may be key (located on the left side of the key pad). By defined as name and address set- pressing this key, the Larson Davis logo appears tings.
-
Page 91: Taking Measurements And Storing Data
Step 4 Using the k ey, highlight the Calibration menu item, then press the key. The following screen appears: If you decide to calibrate the High Step 5 Place the calibrator over the microphone. Using range as well as the Normal range, key again, highlight the Change menu there will be a forty second delay item. - Page 92 Step 2 Press the When changing from one ID to a rrow keys to highlight the another you will be prompted to save SLM&RTA SSA item and press the key to your data if you have not already select it. The last used SLM+RTA display appears: saved it.
- Page 93 Step 5 Press the RUN/STOP key to stop the measure- ment. The screen shows a black box symbol in the upper right hand corner indicating that the instrument is stopped and not taking a measurement. NOTE: A solid black box indicates that the 824 is stopped with data, and a hol- low box indicates that the 824 is stopped with no data present.
-
Page 94: Viewing Rta Displays During A Measurement
Viewing RTA Displays during a Measurement While taking measurements you can view the instrument’s different displays. This section provides examples of view- ing the SSA instrument’s four RTA displays which include: • RTA Live • RTA L • RTA Max •... - Page 95 The RTA Live screen shows a graph- ical display of the sound readings over a range of frequencies. The SPL for the selected frequency is dis- played in the upper left corner. The frequency, as selected by the vertical cursor, is displayed in the lower left corner.
-
Page 96: Recalling Stored Data
The RTA Max view shows a graphi- cal display of the Live spectrum of the maximum broadband level since the last current reset. Step 8 Use the a nd a rrow keys to change the fre- quency level being displayed. Step 9 Press the a rrow key to change to the RTA Min view. - Page 97 When recalling a data file, the Sys- Step 2 Use the u p and d own arrow keys to high- tem 824 will automatically switch to light “Recall Files” and press the check key. the instrument that the data file was The following appears: stored as (i.e.
-
Page 98: Selecting And Modifying Instrument Definitions (Ids)
Selecting and Modifying Instrument Definitions (IDs) As explained in Chapter 2, “Overview”, the way to prepare the System 824 for a measurement is to select an existing Setup or Instrument Definition (ID) from the list which appears on the display after pressing the Setup Key either use it as-is or modify it to suit the requirements of the measurement to be performed. -
Page 99: The Setup Menu
The Setup Menu Pressing the Setup key will produce a display similar to the following: The Active ID The first item in the list is the Active ID, which will be high- lighted. If the user exits from the Setup Menu by pressing either (a second time) or , the instrument is ready to... -
Page 100: Menu Scrolling
Asterisk to indicate that active ID has changed. There is one other possibility which should be mentioned. When a stored data file is recalled, then the ID stored with that file becomes the Active ID. Since the ID which was used to perform the measurement at that time may have since been modified or even deleted, a tilde “~”... -
Page 101: Permanent Ids
Bar that indicates that there are more lines in this menu. Permanent IDs In the list of available IDs, those with a “P” to the left of the name are permanent IDs provided upon delivery. These can be selected, modified and used for a measurement, but the name must be changed when the modified ID is stored so that it does not conflict with the names of any permanent IDs. -
Page 102: Preparing For A Measurement
Setup key or to exit from the Setup menu. The System 824 is now ready to perform a measurement according to the Setup represented by the Active ID. If the Active ID is not satisfactory for the measurement, the following options are available: •... - Page 103 Settings menu and sub- menus. Please follow this on your instrument. Since all ver- sions of the System 824 include the SSA Instrument Type, we want to select the permanent ID SLM&RTA (SSA) as the Active ID.
-
Page 104: Accessing The Settings Menu To Initiate Editing Or Modification
Accessing the Settings Menu to Initiate Editing or Modification As mentioned above, the first item on the list, highlighted, is the Active ID. The message “Edit Settings”, along with the symbol “>” to the right, indicates that one should press i n order to view or edit the Active ID. - Page 105 Step 3 Use t o highlight Weighting (note that the present selection is “A”) Step 4 Press to open SLM Weighting Selections menu Step 5 Use t o highlight “FLT” Step 6 Press to select FLT as the new SLM Weighting If data has been taken, the prompt will be shown.
- Page 106 Once one or more modifications have been made, the user can follow one of three procedures: • Setup will close the menu, remembering its location the next time it is opened. • Use the right a rrow key to step out one menu at a time.
-
Page 107: Setting Control In The Slm View
Setting Control in the SLM View SLM settings can be adjusted from the SLM View screen. To activate the SLM view screen, turn on the System 824, press View key, highlight SLM, then press the Check key. - Page 108 play). The following table describes the keys that are used to change settings: Action Moves to the next setting Moves to the previous setting Adjusts the current setting Enters the setting The following is an example of how to select the RMS Detector within the SLM view: Step 1 Press the keys to highlight the current...
-
Page 109: Chapter 5 System 824 Virtual Instruments
System 824 Virtual Instruments System 824 Virtual Instruments The System 824 presents a number of distinct “virtual instruments” enabling you to select the mode best suited to a particular application. You can, of course, create new setups for particular applications and add your own IDs to the Sys- tem 824. - Page 110 Instrument 824S 824L 824A ISM - Integrating SLM measures LEQ, SEL, Min, Max, Peak, with all weights (A, C, Flat) and with all detectors √ √ √ √ (slow, fast, and impulse) simultaneously. Includes a high and low measuring range. SSA - Sound spectrum analyzer measures LEQ, SEL, Min, Max, Peak, with all weights (A, C, Flat) and with all √...
-
Page 111: Selecting An Instrument Id
Selecting an Instrument ID To select one of the System 824 instrument setups or IDs, do the following: There will be a ‘>’ to the left of the Step 1 Press the SETUP key. A menu similar to the currently enabled instrument ID. The... -
Page 112: Ssa Measuring Ranges
SSA Measuring Ranges By using a 24-bit DSP processor, the digital filters of the System 824 meets the specifications of IEC 61260 - Class 1 and ANSI S1.11-1986 Type 1-D over a linearity range exceeding 80 dB. The dynamic range of the analysis func- tion, from noise floor to overload, is 85 dB (typical). -
Page 113: Ac/Dc Output
For example, if one were using an SSA instrument with 20dB of gain, the AC output would also have 20 dB of gain from the input. 9/12/00 System 824 Virtual Instruments... -
Page 114: Logging Slm
The output signals will vary based on which instrument type is used. For LOG and ISM instruments, the following table defines the output signals. p Õ } ! k š × Ð ² z • • ž š š k X Î ž Â 1 Š ¯ ‘ @ X ° Ð... -
Page 115: Time History
Setup menu. This section covers some of the data acquisition features of the LOG instrument. Time History The System 824 Time History logs L readings and addi- tional parameters which may be either Lmax, Pk-I, or Pk-II. -
Page 116: Ln Percentiles (Broadband)
Percentiles (Broadband) The System 824 L Centiles feature provides a set of six per- centile values to be measured and shown in the “ L C e n - t i l e s ” display. Using these six settings, you can select any six percentile values. -
Page 117: Sound Exposure
Sound Exposure The System 824 lets you set the criteria level and criterion time for Dosimetry measurements. A 100% dose occurs if a person is exposed to a constant sound field with a SPL equal to the criterion level, for the criterion time or full dose hours. - Page 118 5-10 824 Reference Manual 9/12/00...
-
Page 119: Chapter 6 System 824 Views
C H A P T E R System 824 Views This chapter introduces you to the various ways of viewing measured data for a particular setup or ID of the System 824. Specifically, this chapter covers the following topics: •... -
Page 120: Status Icons And Indicators
Status Icons and Indicators When using the System 824 you will encounter a number of different display views. Each display contains an instrument status icon in the upper right hand corner of the display. This icon changes according to the current state of the instrument. - Page 121 O.L. - The instrument has been overloaded; measurement may not be accurate due to an overload condition having occurred some time during the measurement. Animated Clock - Indicates that the automatic run/stop timer is active. Currently overloaded 11/8/00 System 824 Views...
-
Page 122: General Views
Detailed descriptions of the available settings contained within any of the System 824 views can be found in Chapter 7, “Using ID Setting Files”. After you have selected the SLM&RTA operating mode or instrument ID, do the following to select the desired view. - Page 123 (e.g. Fast, Slow, Impl) is to be displayed. Current SPL reading - Displays the current SPL reading (as does the level of the moving bar on the far right of the SPL history graph). The frequency weighting for SPL can be 11/8/00 System 824 Views...
- Page 124 selected: A, C, or FLAT. The detector can be selected from: Slow, Fast and Impl. All combinations of detector and Selectable reading - This is used to view a second level weighting are measured simulta- which can be Leq, SEL, Min, Max, or Peak. neously.
-
Page 125: Any Data View
Any Data formats’ available displays. Any Level Format In this view, five different tables present SPL (Fast and Slow), L (Fast and Slow), L (Fast and Slow), L 11/8/00 System 824 Views... -
Page 126: Any Impulse Format
SEL, and L measured with A, C and Flat weighting as peak follows: Any Impulse Format In this view, three different tables present Impulse weighted parameters alongside similar Fast weighted parameters mea- sured with A, C and Flat weighting as follows: Additional views if TAKT functionality is enabled. -
Page 127: Ssa Specific Views
(Fast, Slow, and Impulse) and Lpeak measured with A, C and Flat weighting as follows: SSA Specific Views The System 824 has various displays for the SSA instru- ment. Understanding these displays lets you take full advan- tage of this instrument. - Page 128 The following briefly describes the main views available to the SSA instrument. Menu Purpose Items SLM data with graphic display of Time History. Any Data Tabular display of SLM data RTA Live Real-time frequency analysis display RTA Leq Leq frequency analysis display since the last reset RTA Max Frequency spectrum associated with the...
-
Page 129: Ssa Displays
To access the tabu- pressing the arrow key, and then selecting Tabular from the sub- lar displays do the following: menu that appears. 11/8/00 System 824 Views 6-11... -
Page 130: Time History Displays
Step 1 Press the Check key while in the RTA Live, RTA Leq, or RTA Max graphical views. The fol- lowing menu appears: While in the main tabular view, the Step 2 Highlight Tabular using the arrow a nd arrows keys cycle you keys then press the check key. - Page 131 Time of interval period broadband level during selected the interval period The up and down The Leq display shows arrow keys change the average level for the frequency each filter during the displayed interval period 11/8/00 System 824 Views 6-13...
- Page 132 In the Leq, Max, and Min interval displays the cursor posi- tion (the vertical bar in the graph) corresponds to the SPL level and frequency values on the left side of the display. The up a nd down a rrow keys change the record you are viewing.
- Page 133 To view the Spectral 1 through Spectral 6 displays (the 6 Ln values) use the up a nd down a rrow keys. Below is an example of one of these displays: See page 6-22 for a detailed descrip- tion of this display. 11/8/00 System 824 Views 6-15...
-
Page 134: Ssa Time History
SSA Time History The SSA Time History display consists of six major compo- nents: • Display label • Record number • SPL reading at cursor • Other level • Status • SPL history graph 6-16 824 Reference Manual 11/8/00... - Page 135 The SLM Time History display is shown below: Display label Record number Time cursor Leq reading at cursor/ Detector setting SPL history graph Value of other level Other level selected in TH setup Status indicator Identifies the marker 11/8/00 System 824 Views 6-17...
- Page 136 The following discusses each of these display components: Display label - This shows the current display (in this exam- ple, “SSA Time History”). Leq reading at cursor - Displays the current Leq of the time history period. This level is also shown graphically. Time cursor/Record number - The Time cursor (the verti- cal bar) allows you to scroll graphically through the history of the displayed measurement readings using the arrow keys.
-
Page 137: Run Log
“Spectral Ln” setting. These data and displays are only available when set to “Overall”. See Ln settings on page 7-19. Highlight “Broadband” and press the check key to view the SSA-Ln-a display. Display label Percentile values & levels 11/8/00 System 824 Views 6-19... - Page 138 The following is a brief description of each of the compo- nents of this display: • Display label - The Display label identifies the display which is the SSA-Ln-a display showing six Ln percent- ages for an overall measurement. • Percentile values & levels - The Ln (percentile levels) Lns are reset with an Overall Reset level is that level which is exceeded ‘n’...
- Page 139 Use the right a nd left a rrow • Selected frequency - Shows the values for the frequency keys to move to each 1/3 octave fre- shown on the display quency. 11/8/00 System 824 Views 6-21...
- Page 140 • Percentile values & levels - The Ln (percentile levels) level is that level which is exceeded ‘n’ percent of the measurement time for the frequency band. By modifying the six settings, you can select any six percentile values to be displayed. The settings may be changed at any time;...
-
Page 141: Logging Slm Specific Views
Logging SLM Specific Views The System 824 provides a number of different displays for the Logging SLM (LOG) instrument. Understanding these displays allows you to take full advantage of this instrument. All of these views can be accessed by pressing the View key when using the Logging SLM (LOG) instrument. - Page 142 Overall An accumulation of data over the entire measurement period and is reset when the entire measurement is reset. Exposure The Exposure displays show dose and projected dose, the sound exposure (E) and C-A. Ln Centiles Display shows six selected L values, a graph of L to L...
-
Page 143: Current Slm And Overall Slm Views
This function is not currently enabled. Current SLM and Overall SLM Views Current SLM clears and starts over The System 824 contains two independent data buffers that when the Reset button is pressed can accumulate data separately. In essence, the instrument while running. -
Page 144: Current Slm/Overall Slm Display-A (Spl)
The different views can also be These displays can be accessed directly from the View menu accessed by simply selecting either screen by doing the following: Current or Overall SLM with the Step 1 Press the View key to enter the View menu. Check key from within the main View menu then cycling through the views with the... - Page 145 SPL history graph - Shows a recent history of one second Leq readings. The far right bar displays the current SPL reading. As readings are taken, they are placed onto the scrolling graph from right to left once per second. 11/8/00 System 824 Views 6-27...
-
Page 146: Current/Overall Slm Display-B (Times)
Current/Overall SLM Display-b The Current / Overall-b SLM or Times display consists of (Times) four major components: • Display label • Start date / time • Elapsed time • End date / time The SLM Current-b or Times display is shown below: Display label Start date/time End date / time... -
Page 147: Current/Overall Slm Display-C (Min/Max)
Current/Overall SLM Display-d The Current / Overall-d SLM or Peaks Display consists of (Peaks) three major components: • Display label • Current / Overall Flat Weighted Peak • Current / Overall C - Weighted Peak 11/8/00 System 824 Views 6-29... -
Page 148: Current/Overall Slm Display-E (Twa)
Current/Overall C - Weighted Peak reading - Shows the C weighted value from the System 824’s peak detector along with the date and time that the peak event occurred. -
Page 149: Exposure Views
View menu then cycling through Centiles, and Stats views. the views with the a nd a rrow keys until the desired display appears. Exposure Display-a The Exposure-a display consists of seven major compo nents: • Display label 11/8/00 System 824 Views 6-31... - Page 150 • Dose • Projected dose • Time Weighted Average • Sound Exposure Level • Elapsed Time The Exposure-a display is shown below: Display label Dose Projected Dose Time weighted average Sound exposure level Elapsed Time The following explains each of the display’s components: Display label - This shows the current display (for example, “SLM Exposure-a”).
-
Page 151: Exposure-B Display
“TOOLS” menu on page 3-18) Time weight average - This display shows the Time Weighted Average (TWA) measured in dB. Sound exposure level - Shows the Sound Exposure Level (SEL) measured in dB. 11/8/00 System 824 Views 6-33... -
Page 152: Exposure-C Display
Elapsed time - Shows the elapsed run time accumulated since the last overall reset. This is the time over which the overall TWA is averaged. If German functionality has been enabled, the Exposure-b display will look as shown below: D isp lay L ab el S o u n d E x p o su re Ta k t3 Ta k t5... -
Page 153: Ln Centiles Views
Ln-a Display The Ln-a display consists of two major components: • Display label • Percentile values & levels The Ln Centiles-a display is shown below for the LOG instrument: Display label Percentile values & levels 11/8/00 System 824 Views 6-35... -
Page 154: Ln-B Display
The following explains each of the display’s components: Display label - Shows the current display (for example, “Ln-a”). Percentage settings are entered with Percentile values & levels - The L (percentile levels) level a 1/100th dB resolution, but are dis- is that level which is exceeded ‘n’... -
Page 155: Stats Views
Current SLM, Overall • Display label SLM, Exposure, Ln Centiles, and Stats views. • Trigger level 1 and event counter • Trigger level 2 and event counter The Stats-a display is shown below: 11/8/00 System 824 Views 6-37... -
Page 156: Stats-B Display
Display label Trigger level 1 and event counter Trigger level 2 and event counter The following explains each of the display’s components: Display label - This shows the current display (for example, “SLM Stats-a”). Trigger level 1 and event counter - This presents a sum- mary of the number of times during the overall measurement that the SPL exceeded the pre-programmed trigger level 1. -
Page 157: Stats-C Display
Peak-II’s trigger level is set to 140dBA and the Peak-II level exceeded this threshold 0 times. These may be considered as individual events. Stats-c Display The Stats-c display consists of two major components: • Display label • Overload message The Stats-c display is shown below: 11/8/00 System 824 Views 6-39... -
Page 158: Run Log (Log & Ssa)
Run Log (LOG & SSA) The Run Log displays the start and stop times/dates of the active measurement in the System 824’s memory. You use a nd a rrow keys to scroll through the log records. The “Run Log” display can be accessed by simply selecting... -
Page 159: Time History
Stop log entry. Time History With the Time History View you can graphically scroll through and view the SPL readings at different points of time in the measurement readings currently active in mem- 11/8/00 System 824 Views 6-41... - Page 160 ory. You can access the Time History display by selecting Time History with the Check key from within the main View menu. Example Time History displays are shown below: Display Label Time Cursor Status Indicator Other level Marker set at this point in the time history ddfadf Iddddddd Identifies the Marker...
-
Page 161: Intervals
Check key from within the main View menu. Intervals-a Display The Interval-a display consists of six major components: • Display label • Interval Number • Interval Date / Time • Leq Reading • SEL Reading • Interval Duration 11/8/00 System 824 Views 6-43... -
Page 162: Intervals-B Display
The Interval-a display is shown below for the LOG and SSA instruments: Display label Interval Number Interval Date/Time Leq Reading SEL Reading Interval Duration The following explains each of the display’s components: Display label - This shows the current display (for example, “Interval-a”). - Page 163 Lmin Reading - The Lmin Reading shows the Lmin for the currently displayed interval. Lmax Reading - The Lmax Reading shows the Lmax for the currently displayed interval. Interval Duration - The Interval Duration shows the length of time of the currently displayed interval. 11/8/00 System 824 Views 6-45...
-
Page 164: Intervals-C Display
Intervals-c Display The Interval-c display consists of six major components: • Display label • Interval Number • Interval Date / Time • Lpeak - I Reading • Lpeak - II Reading • Interval Duration The Interval-c display is shown below for the LOG and SSA instruments: Display label Interval Number... -
Page 165: Intervals-D Display
“Interval-d”). Interval Number- The Interval Number display shows each measurement interval in the order that it occurred. The Inter- val Number indicates the order of the displayed interval in relation to the other interval records. 11/8/00 System 824 Views 6-47... -
Page 166: Intervals-E Display
SPL Exceedances - SPL Exceedances shows how many times during this interval that the instrument’s SPL Exceed- ance Level was surpassed. Peak-I Exceedances - Peak-I Exceedances shows how many times during this interval that the instrument’s Peak - I Exceedance Level was surpassed. Peak-II Exceedances - Peak-II Exceedances shows how many times during this interval that the instrument’s Peak-II Exceedance Level was surpassed. -
Page 167: Exceedance History
• Exceedance Number • Exceedance Date / Time • Leq Reading • SEL Reading • Exceedance Duration The Excd-a display is shown below: Display label Excd Number Exceedance Date/Time Leq Reading SEL Reading Exceedance Duration 11/8/00 System 824 Views 6-49... -
Page 168: Excd-B Display
The following explains each of the display’s components: Display label - This shows the current display (for example, “Excd-a”) Exceedance Number - The “Exceedance” display shows each exceedance record in the order that it occurred. The exceedance number indicates the order of the displayed exceedance in relation to the other exceedance records. -
Page 169: Excd Time History Display
“Excd Time-Hist” to “Yes” under the “Excd History” settings via the SETUP key. An exceedance time history will only be recorded when all of the criteria have been met such as: • SPL Exceedance Level I • Minimum Duration 11/8/00 System 824 Views 6-51... - Page 170 The Excd Time History display consists of seven major NOTE: See page 7-32 through 7-33 for a detailed description of the Excd Time components: History settings. • Display Label • Current Record • Level at cursor • Time at cursor •...
-
Page 171: Daily Views
Daily-a or Daily-b displays. Daily-a Display The Daily-a display consists of 11 major components: • Display label • Record Number • Elasped Time • Date • Leq Reading • LDN and CNEL Readings • Maximum and Minimum levels 11/8/00 System 824 Views 6-53... - Page 172 • Peak level The Daily-a display is shown below: Display label Record Number Elapsed time (A new record is Date created each Leq Reading new day) LDN and CNEL Readings Max and Min levels Peak levels The following explains each of the display’s components: Display label - This shows the current display (for example, “Daily-a”).
-
Page 173: Daily-B Display
The record number indicates the order of the displayed Daily record in relation to the other records. A new daily record is created each new day. A day is defined as 12:00 midnight to 12:00 midnight. 11/8/00 System 824 Views 6-55... -
Page 174: Hourly Leq Display
Date - Day, Date, month and year of the record Ln Percentiles - The L (percentile levels) level is that level which is exceeded ‘n’ percent of the measurement time. You can select any six percentile values to be calculated and stored with the daily record. -
Page 175: Metrics
Metrics-a Display The Metrics-a display consists of five major components: • Display label • Reading • DNL Reading • CNEL Reading • Elapsed Time The Metrics-a display is shown below: 11/8/00 System 824 Views 6-57... -
Page 176: Metrics-B Display
Display label Elapsed Time Leq Reading DNL Reading CNEL Reading The following explains each of the display’s components: Display label - This shows the current display (for example, “Metrics-a”). Leq Reading- This display shows the average level over the elasped time. DNL Reading - The DNL (Day-Night Average Sound Level) display shows the equivalent sound level for the entire measurement period with a +10dB weighting applied... -
Page 177: Passby
Metrics, single 10dB passby event detected. The display can be PassBy, and Wind / Tach views. accessed by simply selecting PassBy with the Check key from within the main View menu. 11/8/00 System 824 Views 6-59... - Page 178 The PassBy display consists of six major components: • Display label • L Reading • SEL Reading • Max Reading • Date/Time • Elapsed Time The PassBy display is shown below: Display label Date/Time Elapsed Time Leq Reading SEL Reading Max Reading The following explains each of the display’s components: Display label - This shows the current display (for example,...
- Page 179 Elapsed Time - This shows the elapsed time between the 10dB down points prior to and following the maximum level measured. NOTE: The Passby triggering system can be used to create an exceedance record of each passby; set “Excd Trig- ger” to [Passby]. 11/8/00 System 824 Views 6-61...
- Page 180 6-62 824 Reference Manual 11/8/00...
-
Page 181: Chapter 7 Using Id Setting Files
C H A P T E R Using ID Setting Files The System 824 makes it easy to make the measurements you need through stored instrument definitions (ID). You can select one of the permanent ID’s or you can create your own library using the 824’s keypad or the 824 Utility soft-... -
Page 182: Customizing Settings
nent ID’s are a good starting point for creating your own custom ID. If you have taken data that has not To activate an ID, press the down o r up a rrow been stored or if the instrument is keys to highlight it and press the CHECK key. - Page 183 Check key. The SLM+RTA screen appears: The System 824 is now set to the SLM&RTA (SSA) instru- ment. Step 3 To access the Settings menu, press the Setup key.
-
Page 184: Settings Descriptions
SLM+RTA view. Settings Descriptions Within the Edit Settings menu, use Descriptions of the System 824 instrument’s various settings keys to move are provided in this section. The following will be covered: from one setting to the next. Use •... -
Page 185: Common Slm Settings
• “LOG and SSA Time History Settings” • “Logging SLM Interval Settings” • “Logging SLM Exceedance History Settings” • “Logging SLM Daily History Settings” • “Logging SLM Define Report Settings” In the following sections, headings for each setting or dis- play mode will identify in parentheses the particular System 824 instruments to which they pertain, as shown in the fol- lowing example. -
Page 186: Weighting Setting - (Ssa, Log, Ism)
There are certain features (such as Impl An impulse detector which has a very fast event counting) that function only for rise time (a 35 mS time constant) but a very slow one detector and one weight. decay time. Weighting Setting - (SSA, LOG, Weighting - selects the desired frequency weighting for the ISM) RMS and secondary peak detectors. -
Page 187: Transducer Setting - (Ssa, Log, Ism)
“High” option requires a stabilization period. Further- more, the System 824’s large dynamic range (110dB) often makes dynamic range switching unnecessary. The Range setting merely allows you to move the... -
Page 188: Random Incidence Microphone Correction
Random Incidence Microphone The Random Corr setting gives you the option of turning on Correction - (Available to all a digital filter to provide the correction necessary to provide Instrument types) a random incidence response when measuring with a 2540 or 2541 free-field microphone. -
Page 189: Rta Weighting - (Ssa)
Common Control Settings Control settings are also available The Control settings are available on most System 824 from some check menus as discussed instruments. The Control settings can be accessed through the “Edit Settings” menu as the last selectable menu item. - Page 190 The following is the menu layout for the control settings: Menu Items Available Settings Options Use the keys to move AC/DC Output AC-1 AC-2 from one setting to the next. Then use AC-1 key to change the selected AC-2 setting. The key is used to return AC-2 AC-1...
-
Page 191: Ac/Dc Output Settings - (Ssa, Log, Ism)
AC/DC Output Settings - (SSA, The AC/DC Output on the 824 allows the user to select what LOG, ISM) type of signal will be sent out the 3.5mm connector at the base of the instrument. See page 5-4 for more details. Logic Input Setting - (SSA, LOG, ISM) The SSA instrument can access the... - Page 192 heater output (pin 8, pulled to ground). You can use these Logic Outputs to actuate external devices during certain events or combinations of events that occur in the instru- ment. The option you select determines which types of events will trigger a logic output line. The Logic Output setting provides the following options: NOTE: In many of the options below, notice the use of a shorthand identifier...
-
Page 193: Logic Output Time Setting - (Ssa, Log, Ism)
R+A - The Logic Output turns on when an RMS exceedance event occurs or when an event occurs on one of the A:D channels. P+A - The Logic Output turns on when a Peak exceedance event occurs or when an event occurs on one of the A:D channels. -
Page 194: Logic Output #2
NOTE: If set below 5 seconds, the output will remain “ON” as long as the condi- tions are true, and turn “OFF” x sec- onds (0 to 5) after the condition; if set to 6 seconds or greater, the output will stay “ON”... -
Page 195: Logging Slm Twa Settings
Crnt Criterion 0 - 255 dB Ovll Exchange - (LOG) This setting affects the System 824’s The Overall Exchange rate setting sets the exchange rate primary or overall memory buffer. (sometimes called the “doubling rate”) that is used to calcu- late the overall TWA. -
Page 196: Ovll Threshold - (Log)
RMS noise level. Ovll Threshold - (LOG) This setting affects the System 824’s The Ovll Threshold setting sets the threshold for computing primary or overall buffer. the overall time weighted average (TWA). -
Page 197: Criterion Time - (Log)
5dB may be added to the permissible exposure level every time the exposure duration is cut in half. This setting provides the following four options: This setting affects the System 824’s secondary or current buffer. 3dB - The Crnt Exchange defaults to the 3dB option. -
Page 198: Crnt Threshold (Ssa, Ism, Log)
Threshold setting is a submenu to the current time weighted average (TWA). SLM menu selection. This setting affects the System 824’s In compliance with the requirements of various regulatory secondary or current buffer. agencies, only those sound levels which are above a certain threshold level are used when computing the TWA. -
Page 199: Enable Ln
Use the keys to move The following is a table of the L settings: from one setting to the next. Then use key to change the selected Menu Items Available Settings Options setting. The key is used to return to previous menus. Enable Ln (SSA only) Start Level... -
Page 200: Spectral Ln's (Ssa Only)
Ln’s The L Centiles set the six percentile values to be measured, logged (if selected) and shown in the Ln displays. Using these six settings, you can select any six percentile values. As shown above, these settings can each take on any value within the following range: 0.00 to 99.99% Whenever you change any percentile value, the instrument... -
Page 201: Log And Ssa Triggering Settings
LOG and SSA Triggering Settings For the SSA instrument, these trig- Trigger levels can be set as follows: two for the SPL (RMS ger settings are used used to control value) and one each for Peak I and Peak II. These levels are the logic output line. -
Page 202: Pk Excd Lvl 1 - (Log, Ssa)
ment is reset. A special flag is set with all exceedance records whose L is greater that this level. This setting can take on any integer value within the follow- ing range: 0 to 255 dB PK Excd Lvl 1 - (LOG, SSA) The Pk Excd Lvl 1 sets the trigger level for the primary peak detector (Pk-I). -
Page 203: Log And Ssa Time History Settings
Begin Trigger Hysteresis Time This setting can include any integer value within the follow- ing range: 0 to 9dB LOG and SSA Time History Settings Time History Settings are available The time history recording stores an L , and if desired, one to both the Logging SLM (LOG) and or more additional user-selected measurements, such as Lpk SLM&RTA (SSA) instruments. - Page 204 Period Units 1/32s 1.0s 10.0s 60.0s Other Level None Pk-II Pk-I Lmax Advc (See Adv TH) Resolution 0.1 dB 1.0 dB Adv TH Activates a set of 3 displays used to configure what time history data will be stored. See page 7-26. Marker Text Marker 1 (Aircraft)
-
Page 205: Hist Enable - (Log, Ssa)
Resolution 0.1 dB 1.0 dB TH Setup Activates a set of 3 displays used to configure what time history data will be stored. See page 7-27. Marker Text Marker 1 (Aircraft) Marker 2 (Automble) Marker 3 (Truck) Marker 4 (Train) Marker 5 (Animal) Hist Enable - (LOG, SSA) -
Page 206: Other Level - (Log Only)
Example: To measure 2 samples per second, set Hist Period to 16 and Period Units to 1/32s (16/32=1/2). This setting provides the following four options: When German functionality 1/32s - This sets the History Period Unit to 1/32 sec- enabled, the history period will be ond intervals. -
Page 207: Resolution - (Log, Ssa)
Lmax - The second level the instrument stores is the maximum level (L ) that has occurred during the time history period. Advc - Stores up to 38 different parameters with each The “Any Data” information stored time history period which are user selectable, such as: with the Time History is accessed Leq, Peak, Max, Min, Takt maximal, battery voltage through the Time History menu... -
Page 208: Marker Text - (Log, Ssa)
Marker display. LOG and SSA Interval Settings Interval Settings are available on the The Intervals menu sets the System 824 to automatically LOG and SSA instruments. store at regular time periods, Leq, SEL, Lmax, Lmin, L , and the six Ln levels. -
Page 209: Intv Enable - (Log, Ssa)
keys move from The following table shows the available Intervals settings. one setting to the next. The Each setting is described later in greater detail. changes the selected setting. The key is used to return to previous Menu Items Available Settings Options menus. -
Page 210: Intv Time Sync - (Log, Ssa)
either until the instrument is stopped or runs out of memory. You can set this to any time value in the following range: 00:00:01 to 99:59:59 (i.e. one second to 99 hours, NOTE: If set to 00:00:00 then the period is 0.125 seconds for SSA and infinite for 59 minutes and 59 seconds) LOG. -
Page 211: Intv Threshold - (Log, Ssa)
series of manual measurements. To start a new measurement after an automatic stop, just press the Run/Stop key. This setting provides the following two options: No - Disables the automatic stop feature . Yes - Enables the automatic stop feature. Intv Threshold - (LOG, SSA) Intv Threshold sets the threshold for computing the interval time weighted average (TWA). -
Page 212: Intv Spectrum - (Ssa Only)
6dB - The 6dB option results in the L time weighted average which is merely a convenient rep- resentation of the long-term average noise level as opposed to the RMS noise level. Intv Spectrum - (SSA only) The Intv Spectrum allows you the choice of storing spectral data with the interval. -
Page 213: Excd Time Hist - (Log)
logged. This setting can take on any time value in the fol- lowing range: 0-255 seconds Excd Time Hist - (LOG) The Excd Time Hist setting enables you to indicate whether or not to have an Exceedance Time History saved as part of the exceedance. -
Page 214: Logging Slm Daily History Settings
Logging SLM Daily History Settings Daily History Settings are only The Model 824 automatically calculates daily sound statis- available to the Logging SLM (LOG) tics including: L 24, L , CNEL, L , Ln’s, L peak uwpk instrument. and L ;... -
Page 215: Data Report - (Log, Ssa)
Use the keys to move The following is a table of the Define Report settings. Each from one setting to the next. Then use setting is described later in greater detail. key to change the selected setting. The key is used to Menu Items Available Settings Options return to previous menus. -
Page 216: Spl Histogram - (Log)
SPL Histogram - (LOG) SPL Histogram either enables or disables the printing of the SPL histogram report. The histogram report contains a histo- gram of the SPL levels that have occurred during the overall and current measurements. The report also prints a table of all (1 to 99%) L percentiles. -
Page 217: Hist Report - (Log, Ssa)
Long - The “long” interval report (including L , SEL, L , Pk-I, Pk-II, overloads, exceedances, and six Ln Percentiles) will print. Hist Report - (LOG, SSA) The Hist Report either enables or disables the printing of the Time history report. The history report contains the L , and optionally one selectable level (Lpk-I, Lpk-II, or Lmax) basic measurement parameter for each time history period. - Page 218 Random Corr Pk Weighting RTA Detector Slow Fast RTA Weighting Bandwidth Intervals Intv Enable Intv Period hh:mm:ss Intv Time Sync Intv Save Ln’s Intv Auto Stop Intv Threshold 0 - 255 dB Intv Exchange Intv Spectrum None @Max 7-38 824 Reference Manual 11/8/00...
- Page 219 Time His- Hist Enable tory Hist Period 0 - 255 (default: 60) Period Units 1/32s 1.0s 10.0s 60.0s Resolution 0.1db 1.0db TH Setup Activates a set of 3 dis- plays used to configure what time history data will be stored. See page 7-27.
- Page 220 Enable Start Level 0-99dB (default 15dB) Ln 1 Percent Selectable (default: 1.67%) Ln 2 Percent Selectable (default: 8.33%) Ln 3 Percent Selectable (default: 33.33%) Ln 4 Percent Selectable (default: 50%) Ln 5 Percent Selectable (default: 66.67%) Ln 6 Percent Selectable (default: 90%) NOTE: If Spectral Ln is set to [Interval] Spectral LN...
- Page 221 Define Data Report Report Setup Report Intv Report Short Long Hist Report Controls AC/DC Output AC-1 AC-2 AC-1 DC AC-2 DC AC-2 AC-1 Logic-In Mode None Pause Toggle Level Alarm Logic-Out Peak Intv R+P+I R+P+A R+I+A P+I+A R+P+I+A Excd Logic-Out Time 0 ~ 255 sec 11/8/00 Using ID Setting Files...
- Page 222 Controls Logic-Out #2 (contin- ued) Peak Intv R+P+I R+P+A R+I+A P+I+A R+P+I+A Excd Logic-Out #2 0 ~ 255 sec Time Heater On E. A. Cal Tone 7-42 824 Reference Manual 11/8/00...
-
Page 223: Menu Layout Of Integrating Slm (Ism) Settings
Menu Layout of Integrating SLM (ISM) Settings The Integrating SLM (ISM) Edit Settings menu has 16 con- figurable items. Provided in this section is a table depicting the menu layout of the ISM instrument’s Standard Settings. ISM Setting Menu Submenu Available Settings Items Options... - Page 224 Controls AC/DC Output AC-1 AC-2 AC-1 DC AC-2 DC AC-2 AC-1 Logic-In Mode None Pause Toggle Level Alarm 7-44 824 Reference Manual 11/8/00...
- Page 225 Controls Logic-Out (contin- ued) Peak Intv R+P+I R+P+A R+I+A P+I+A R+P+I+A Excd Logic-Out Time 0 - 255 sec Logic-Output #2 Peak Intv R+P+I R+P+A R+I+A P+I+A R+P+I+A Excd Logic-Output #2 0 - 255 sec Time 11/8/00 Using ID Setting Files 7-45...
-
Page 226: Menu Layout Of Logging Slm Settings
Controls Heater On (contin- ued) E. A. Cal Tone Menu Layout of Logging SLM Settings The Logging SLM (LOG) Edit Settings menu has 66 config- urable items. Provided in this section is a table depicting the menu layout of the LOG instrument’s Standard Settings. LOG Settings Menu Items Submenu... - Page 227 Ovll Exchange Ovll Threshold 0 - 255 dB (default: 80dB) Ovll Criterion 0 - 255 dB (default: 90dB) Criterion Time 0 - 99 hours (default: 8 hours) Crnt Exchange Crnt Threshold 0 - 255 dB (default: 80dB) Crnt Criterion 0 - 255 dB (default: 90dB) Start Level 0 - 99dB (default 15dB) Ln 1 Percent...
- Page 228 Time History Hist Enable Yes (default) Hist Period 0 - 255 (default: 60) Period Units 1/32s 1s (default) Other Level None (default) Pk-II Pk-I Lmax Advc Resolution 0.1dB (default) 1.0dB Adv TH Activates a set of 3 displays used to configure what type of time history data will be stored.
- Page 229 Intervals Intv Enable Yes (default) Intv Period 0-24:0-60:0-60 (hh:mm:ss) Intv Time Sync Yes (default) Intv Save Ln’s Yes (default) Intv Auto Stop No (default) Intv Threshold 0 - 255 dB Intv Exchange 3dB (default) Excd History Triggering SPL Excd Lvl 1 SPL Excd Lvl 2 PK-1 Excd Lvl PK-2 Excd Lvl...
- Page 230 Daily His- Daily Enable tory No (default) Daily Ln’s No (default) Define Data Report Yes (default) Report Setup Report Yes (default) SPL Histogram No (default) Pk-1 Histogram No (default) Pk-2 Histogram No (default) Intv Report Short (default) Long Hist Report Yes (default) Excd Report Short...
- Page 231 Controls Logic-In Mode None (continued) Pause Toggle Level Alarm Logic-Out Peak Intv R+P+I R+P+A R+I+A P+I+A R+P+I+A Excd Logic-Out Time 0 - 255 sec 11/8/00 Using ID Setting Files 7-51...
-
Page 232: Check Menus
Check menu which is specific to the current dis- play function. The Check menu is accessed simply by press- ing the Check key from within the System 824’s different views. The available Check menu options vary between an instru- ment ID’s different views. -
Page 233: Check Menu Example
displays. In some cases the check menu allows you to toggle between a views tabular mode or graphical spectrum mode. This section will present the following: • Check Menu Example • SLM Check Menu Options • Other SSA Check Menus •... - Page 234 Step 2 Use the arrow keys to highlight Set- tings, then press the Check key or the arrow key. A menu similar to the following appears: Step 3 Use the arrow keys to highlight SLM, then press the Check key or the arrow key.
-
Page 235: Slm Check Menu Options (Ssa And Log)
SLM Check Menu Options (SSA and LOG) The Check menu’s Controls and Set- The SLM display check menus for the SSA and LOG instru- tings items correspond to those ment are identical. Following is a chart of the Check Menu described earlier in the Settings settings. - Page 236 The “Mark” display shows the current SPL level and a time history of the SPL level is shown graphically. This enables you to set a marker in the time history. To set a marker in the time history, press the Check key.
-
Page 237: Graph Menu
Graph Menu There are two Graph settings available: Menu Items Available Settings Options Graph Level -39 to 799 Graph Scale 2, 1, 1/2, 1/4, 1/8 Graph Level may also be changed The Graph Level setting allow you to change the base level interactively with the Adjust Graph of the SPL history graph. -
Page 238: Controls Settings Menu
Settings The Settings menu allows you access to the SLM settings area that is usually accessed from the SETUP key. (This is a shortcut to the SLM settings so you can modify the items in the SLM menu) NOTE: Refer to the Settings Description section and the individual instrument’s Settings Menu Layout sections for details on the configuration options for this... -
Page 239: Rta Check Menu
Following is a chart of the check menu with a description of each menu item: Menu Items Purpose Mark Puts a marker in the time history. Settings Modifies the SLM settings for the selected instrument. RTA Check Menu The following Check menus are accessible from the RTA Live, RTA Leq, RTA Max and RTA Min views: Following is a chart of the check menu with a description of each menu item:... -
Page 240: Intervals Check Menu
Changes the scaling of the instru- Graph ment’s SLM history graph Selects either 1/1 or 1/3 octave fil- Bandwidth ters. Intervals Check Menu The intervals displays have three different check menus depending upon which display you are viewing. When viewing the displays Interval-a through Interval-e the following menu appears after pressing the Check key: Following is a chart of the check menu with a description of... -
Page 241: Time History Check Menu
Following is a chart of the “Leq Spectrum” check menu with a description of each menu item: Menu Items Purpose ByTime Allows you to view the Leq for each interval over time Intv Data Allows you to view the Interval-a through Interval-e displays Max/Min Spectra Allows you to view the Max or Min... -
Page 242: Run Log Check Menu
Following is a chart of the Time History check menu with a description of each menu item: Menu Items Purpose Broadband/Spec- Allows you to view the broadband trum history graph or the spectral data Locate Locates a specific time history record Settings Modifies the time history settings... -
Page 243: Ln Centiles Check Menus
Following is a chart of the Run Log check menu with a description of each menu item: Menu Items Purpose First Locates the first Run Log record Last Locates the last Run Log record Find Finds the specified Run Log record Locate T.H. - Page 244 Following is a chart of the Ln Centiles broadband check menu with a description of each menu item: Menu Items Purpose Enable Ln Enables or disables Ln data Start Level Sets the minimum dB level to be calculated in the Ln data Ln 1 Percent Changes the percentage for Ln 1 Ln 2 Percent...
- Page 245 Following is a chart of the Ln Centiles spectral check menu with a description of each menu item: Menu Items Purpose Start Level Sets the minimum dB level to be calculated in the Ln data Ln 1 Percent Changes the percentage for Ln 1 Ln 2 Percent Changes the percentage for Ln 2 Ln 3 Percent...
-
Page 246: Other Logging (Log) Check Menus
Other Logging (LOG) Check Menus See page 7-55 for a description of This section presents the LOG instrument’s available Check the (LOG) SLM check menu. menus that are in addition to the SLM Check menu previ- ously described in this chapter. Any Data Check Menu See page 7-58 for a description of the “Any Data”... -
Page 247: Ln Centiles Check Menu
Menu Items Purpose Ovll Exchange Sets the exchange rate that is used to calculate the overall TWA. Ovll Threshold Sets the threshold for computing the overall time weighted average (TWA) Ovll Criterion Sets the TWA level which consti- tutes 100% dose for the overall mea- surement. -
Page 248: Stats Check Menu
Menu Items Purpose Settings Modifies the Ln percentiles settings for the selected instrument. Graph Changes the scaling of the instru- ment’s Ln-b Centiles graph Stats Check Menu The Stats view has access to the following Check menu: Menu Items Purpose SPL Excd Lvl 1 Sets the lowest SPL trigger level. -
Page 249: Time History Check Menu
Time History Check Menu The Time History view has access to the following Check menu: Menu Items Purpose Mark Puts a marker in the time history record Locate Allows you to locate a time history record Settings Modifies the Time History Settings. Graph Adjusts the scaling of the Time His- tory graph... -
Page 250: Excd History Check Menu
Excd History Check Menu The Excd History displays have two different check menus depending upon which display you are viewing. When viewing the displays Excd-a through Excd-b the fol- lowing menu appears after pressing the Check key: Following is a chart of the check menu with a description of each menu item: Menu Items Purpose... -
Page 251: Daily History Check Menu
Following is a chart of the “Excd Time History” check menu with a description of each menu item: Menu Items Purpose Excd Data View Excd-a and Excd-b displays Locate Locates a specific Exceedance record Settings Modifies the Exceedance settings Graph Adjusts the scaling of the Excd Time History graph Daily History Check Menu... - Page 252 In the “Hourly ” display press the Check key and the fol- lowing menu appears: Following is a chart of the “Hourly History” check menu with a description of each menu item: Menu Items Purpose Daily Data Displays Daily data First Displays the first hourly record Last...
-
Page 253: Chapter 8 Printing A Report
C H A P T E R Printing a Report The System 824 allows you to print a report from data col- lected during a measurement. This chapter will discuss the following aspects of printing reports: • Connecting the 824 to a Serial Printer •... -
Page 254: Printing Reports
Step 3 Turn on your printer and the System 824. Printing Reports Step 1 Press the Data key and use the Recall Files- menu to recall the measurement record that you want to print. You may not need to recall a file if you want to print something in memory that has not been stored. - Page 255 Recall Format Summary SSA, LOG Tailored All, short All, long None enabled Customize [allows you to select the print SSA, LOG, RTA options for an instrument ID and customize your reports - see the sec- tion on “Printing a Custom Report”] Print [prints the report] SSA, ISM, LOG,...
- Page 256 Step 4 Use the arrow key to return to the main Print menu. You will notice that there is a paper page icon next to the “Summary” menu item. This means that a report will be printed by highlighting “Summary” and pressing the Check key.
-
Page 257: Defining And Printing Tailored Reports
Defining and Printing Tailored Reports In the System 824, Tailored Reports With the System 824, a tailored report setting for each SSA are available to the SSA and LOG or LOG instrument ID can be created (i.e. each user can set instruments. - Page 258 Step 1 Press the Setup key to bring up the Setup menu. Highlight the Edit Settings menu item and press arrow key or the Check key to select Step 2 Using the a nd a rrow keys, highlight the Define Report item, then select it using the arrow key or the Check key.
-
Page 259: Using The Recall Format (Ssa And Log Instruments Only)
Step 5 Using the For your report to print properly, a nd a rrow keys highlight the your printer must be connected and Tailored item, then select it using the a rrow configured as discussed in the “Con- key or the Check key and your “Tailored”... -
Page 260: Default Settings Values For The Recall Format Reports
Step 1 To print from the Recall Format menu press the PRINT key. The following screen appears: Step 2 Use the arrow keys to highlight the Recall Format menu. Press the key and the fol- lowing screen appears: Step 3 Use the arrow keys and select the report that you want to print (Summary, Tailored, All,Short, All,Long, or None Enabled. - Page 261 Summary Report Template (SSA instrument) Lower Level Report Settings Report Settings Description Unformated [No] A dump of all Read, Query and Interval remote commands. Multiple values are comma delimited. Data Report [Yes] This shows general information such as Leq, SEL, Dose, Projected Dose, Lmin, Lmax, Peak, Ln’s, exceedance, and calibration logs.
- Page 262 Summary Report Template (SSA instrument) Histograms Highest Level (120) Selects the highest Peak2 histogram level to be printed. Resolution (5.0) Selects the Peak2 histogram resolution Summary Report Template (LOG instrument) Lower Level Report Settings Report Settings Description Unformated [No] A dump of all Read, Query and Interval remote commands. Multiple values are comma delimited.
- Page 263 Summary Report Template (LOG instrument) Print Range Excd Report [No] You can customize the interval report by choosing the long or short report. Lowest Record (00000) Selects the lowest exceedance record to be printed. Highest Record (65535) Selects the highest exceedance record to be printed. Intv Report [No] You can customize the interval report by choosing the long or short report.
- Page 264 you to create a custom report for any SSA or LOG instru- ment ID. The Tailored Report includes the Data Report, Log Report, Setup Report, Interval Report (Short), Exceedance Report, and the Daily Report. After selecting the template you can modify it as explained in “Printing a Custom Report”...
- Page 265 Tailored Report Template (SSA instrument) Histograms Lowest Level (110) Selects the lowest Peak1 histogram level to be printed. Highest Level (140) Selects the highest Peak1 histogram level to be printed. Resolution (5.0) Selects the Peak1 histogram resolution Pk-2 Histogram [No] You can customize the Peak2 Histogram report by choosing the long or short report.
- Page 266 Tailored Report Template (LOG instrument) Print Range Intv Report [Short] You can customize the interval report by choosing the long or short report. Lowest Record (00000) Selects the lowest interval record to be printed. Highest Record (65535) Selects the highest interval record to be printed. Hist Report [Yes] You can customize the time history report by choosing the long or short report.
- Page 267 All, Short Report Template (SSA instrument) Lower Level Report Settings Report Settings Description Unformated [No] A dump of all Read, Query and Interval remote commands. Multiple values are comma delimited. Data Report [Yes] This shows general information such as Leq, SEL, Dose, Projected Dose, Lmin, Lmax, Peak, Ln’s, exceedance, and calibration logs.
- Page 268 All, Short Report Template (SSA instrument) Histograms Highest Level (120) Selects the highest Peak2 histogram level to be printed. Resolution (5.0) Selects the Peak2 histogram resolution All, Short Report Template (LOG instrument) Lower Level Report Settings Report Settings Description Unformated [No] A dump of all Read, Query and Interval remote commands.
- Page 269 All, Short Report Template (LOG instrument) Histograms SPL Histogram [Yes] You can customize the SPL Histogram report by choosing the long or short report. Lowest Level (045) Selects the lowest SPL histogram level to be printed. Highest Level (095) Selects the highest SPL histogram level to be printed. Resolution (5.0) Selects the SPL histogram resolution Pk-1 Histogram [Yes]...
- Page 270 All, Long Report Template (SSA instrument) Intv Report [Long] Leq, SEL, Lmin, Lmax, Peak, Uwpk, exceednaces, time, date, and dura- tion in the short report. The Long reports adds the Ln values and Spectral LNs for the Interval period. Hist Report [Yes] Leq for each time history period.
- Page 271 All, Long Report Template (LOG instrument) Data Report [Yes] This shows general information such as Leq, SEL, Dose, Projected Dose, Lmin, Lmax, Peak, Ln’s, exceedance, and calibration logs. Log Report [Yes] The run/stop log and with the date and time of each run/stop. Setup Report [Yes] Print the settings and their values for the LOG instrument.
- Page 272 None Enabled Report When “None Enable” is selected from the Recall Format menu then all of the reports are disabled and will not be printed. This allows you greater ease in printing only a selected number of reports. After selecting this template you can modify it as explained in “Printing a Custom Report”.
- Page 273 None Enabled Report Template (SSA instrument) Histograms SPL Histogram [No] Prints SPL histogram and overall Spectral LN report. Lowest Level (045) Selects the lowest SPL histogram level to be printed. Highest Level (095) Selects the highest SPL histogram level to be printed. Resolution (5.0) Selects the SPL histogram resolution Pk-1 Histogram [No]...
-
Page 274: Printing A Custom Report
None Enabled Report (LOG instrument) Print Range Intv Report [No] You can customize the interval report by choosing the long or short report. Lowest Record (00000) Selects the lowest interval record to be printed. Highest Record (65535) Selects the highest interval record to be printed. Hist Report [No] You can customize the time history report by choosing the long or short report. - Page 275 Step 1 Press key to bring up the Print menu. Step 2 Use the a nd a rrow keys to highlight the Customize item, then select it using the arrow key or the Check key. The following screen appears: Step 3 Use the arrow keys to scroll through the available report settings.
- Page 276 Hist Report Print Range Intv Report (No, Short, Long) -Lowest Record -Highest Record Hist Report (No, Yes) -Lowest Record -Highest Record Histograms SPL Histogram (No, Yes) Lowest Level Highest Level Resolution Pk-1 Histogram (No, Yes) Lowest Level Highest Level Resolution Pk-2 Histogram (No, Yes) Lowest Level Highest Level...
- Page 277 SPL Histogram Excd Report Short Long Intv Report Short Long Hist Report Daily Report Print Range Excd Report (No, Short, Long) -Lowest Record -Highest Record Intv Report (No, Short, Long) -Lowest Record -Highest Record Hist Report (No, Yes) -Lowest Record -Highest Record Histograms SPL Histogram (No, Yes)
- Page 278 The following table shows the available options under the NOTE: See the Summary and Tailored Templates on pages 9-9 to 9-12 for a Customize menu for the RTA instrument: description of each report for the SSA and LOG instruments. (RTA instrument) Report Options Description...
-
Page 279: Chapter 9 Using The 824 Utility Software
824 Utility Software Overview The 824 Utility software is a powerful tool for use with the System 824 from Larson Davis. This software will allow you to control, setup, download and translate your 824 mea- surement data quickly and easily. -
Page 280: Starting The 824 Utility Software
To start the 824 Utility software in Windows 95, press START and then select the Programs/Larson Davis/824Util submenu item. Connecting the 824 to Your Computer To connect the 824 to a computer, use the CBL006 cable included with your System 824. The round 8-pin connector 824 Reference Manual 11/8/00... - Page 281 plugs into the Serial port of the 824 and the 9-pin connector plugs into a serial port on your computer. You do not need to be connected to Before any functions can be performed on the 824, you must the 824 in order to translate files connect the 824 to the 824 Utility software.
-
Page 282: 824 Utility Tool Bar
Step 6 Select the comport that your 824 is connected to, NOTE: See Chapter 3 of this manual for details on changing the communication select the baud rate, and press the connect button. parameters on the 824. After a successful connection, the setup window will appear with a system setup in the setup list box. - Page 283 Connect button. This button is used to estab- lish a connection to the 824. Pressing this but- ton will bring up the connect dialog box where the connection parameters can be defined. Retrieve Setups from 824. This button will retrieve all current setups in the 824. Create new setup button.
-
Page 284: 824 Utility Setup Window
Download window button. This button will open the download section of the 824 Utility program. Translate window button. This button will open the translate section of the program. It will provide a file tree where the contents of the downloaded measurement files can be viewed. -
Page 285: Retrieving Setups From The 824
824 or a disk file. The settings dialog section will allow you to manipulate the setup. Setup List Box Settings Tab Dialog Retrieving setups from the 824 Setups stored in the 824 can be retrieved by clicking on the Get Setup button on the tool bar or by selecting Get Setups From 824 from the File Menu. - Page 286 The name of the ID is listed in the right hand column. For the permanent ID’s, this will be the Larson Davis instrument type. For a user defined ID, this can be any- thing that the user defines.
-
Page 287: Modifying And Storing Setups To The 824
824. The selections here include, Title, instrument and can’t be changed. To Options*, Calibration, Power, Date and Time, Controls and purchase an option, contact your Larson Davis represenative. 11/8/00 Using the 824 Utility Software... -
Page 288: Manipulating A Setup
Modem. To change one of these settings, click on the appro- priate tab, and enter the changes. Manipulating a Setup To change any of the variables for a particular user defined setup, select the setup. The appropriate setup tab dialog will appear at the right of the setup list box. - Page 289 You can also access several setup functions by right clicking on the Setup in the Setup list box. The following functions can be accessed by pressing the right mouse button while within the Setup list box. The Setup Menu items will appear enabled or disabled depend- ing on the setup selected.
-
Page 290: Saving Setups To Disk Files
Saving Setups to Disk Files Once you have created or modified a setup, you can store the setup to a file. Select the Save Setup to a File menu item from the File menu or click on the Save to File button on the tool bar. - Page 291 A standard windows Open File box will appear. Select the file folder that contains the file and select the setup file you want. The setup appears in the Select Setup list box. You can then select (highlight) the desired setup in the list. The high- lighted setup can then be sent to the 824 by selecting the Save Setup to 824 menu item from the File menu.
-
Page 292: Creating A New Setup
Creating a New Setup You create new setups by selecting the New Setup menu item from the File menu or by selecting the New Setup but- ton on the tool bar. From the displayed dialog box, select the type of new setup. Press the OK button and you will now see the new setup in the Setup List box. -
Page 293: Renaming An Existing Setup
If a message window occurs after pressing the OK button like that shown below, you will have to create a default setup file by following this procedure: • Select the permanent setup for the desired instrument type. • Under the File menu select “Save setup to a file”. •... -
Page 294: Deleting An Existing Setup
A dialog box will be displayed to allow you to change the name of the selected setup. Enter the new name for the setup, and press the OK button. After renaming a setup, you can store it to a disk file, or send NOTE: The permanent setup ID’s in the 824 cannot be renamed. -
Page 295: Locking And Unlocking Setups
Locking and Unlocking Setups To prevent accidently deleting a user defined setup, right click on the desired setup and select Lock Setup from the popup menu. Note that if you have just created a new setup, the setup must first be stored to the 824 before it can be locked. -
Page 296: Specifying A Destination File
Davis instrument type. For a user defined ID, this can be anything that the user defines. The three letter Larson Davis assigned name is listed in the blue Ovals. This indicates the type of instrument ID for which the setup was created. - Page 297 window, press the File folder button, next to the Directory entry. A standard Windows file selection dialog box will appear. NOTE: The 824 Utility program will download the files with the date the file Select the destination directory you wish. was created as the file name as a default.
-
Page 298: Changing The Download File Name
Changing the Download File Name To change the name of the downloaded file, enter a new name in the “File name” area. Press the Save button to return to the download section of the 824 Utility software. Our new file name and the path to the speci- fied directory now show on the download... -
Page 299: Adding Notes To A Download File
Adding Notes to a download file Information can be entered into the note fields provided for each measurement. The information will be tagged onto the translated reports for each measurements. Selecting Active Measurements or Data Files There are two types of measurements that can be down- loaded. -
Page 300: Downloading The Measurement
Downloading the measurement The 824 Utility software has multi- To download a measurement, first select the file type from ple file download capability by the pull down menu. You may choose to view all of them selecting “ALL <binary>” from the simultaneously by selecting “ALL <binary>”... - Page 301 Checking this box saves the binary file in the 824 Utility directory or the designated directory. Checking this box will launch a program associated with a .csv file or .txt file based on the radio box selection. For multiple file download, the first file will be loaded into the viewing program.
-
Page 302: Explanation Of Files In The 824 Utility Directory
The download status window will appear and report the sta- tus of the download. The next file can now be selected, the destination folder specified, the file name entered, and the data downloaded. A downloaded file will be stored with If you only selected “Save Binary Data”... -
Page 303: Translating Measurement Data From A Downloaded Binary File
The binary files for each virtual instrument (ISM, SSA, LOG, RTA, FFT, AUD, TAL) have the following default file designations: 28Jun15i.slmd Designates which instrument type was used for the measurement. The default file name uses the date • 28Jun15i.slmdl (ISM) on which the data was taken. - Page 304 Locate the folder that contains the downloaded file you wish to translate. In this case we have found the down- loaded file in the default location, C:\Program Files\Larson Davis\824 Utility. 9-26 824 Reference Manual 11/8/00...
-
Page 305: Selecting A Data Set To View
Each downloaded file will contain several records, depend- ing on the type of setup used, and the data stored. Downloaded measure- ment file. Data translated from the Downloaded file. Selecting a Data set to view After the downloaded file is located, click on the data you wish to view. - Page 306 The data is displayed on the right side of the screen. If the data record is too large to be effectively displayed in that area, a message will appear at the top of the displayed record indicating that it is available for export only. 9-28 824 Reference Manual 11/8/00...
-
Page 307: Printing A Translated File
Printing a Translated File To print the translated data, select the file that you wish to print from the translate window . Display the file as described earlier. Select Print from the File menu. 11/8/00 Using the 824 Utility Software 9-29... - Page 308 The default Windows printer dialog box will be displayed. The report will be printed in a text format similar to that shown below. 9-30 824 Reference Manual 11/8/00...
-
Page 309: Viewing A Translated File Within A Spreadsheet Program
Viewing a Translated File Within a Spreadsheet Program To view the translated data with a spreadsheet program, select the View Data in Spreadsheet menu item from the File menu or the Launch Spreadsheet button on the tool bar. When you select the View Data in Spreadsheet menu item, the 824 utility program will attempt to launch the program associated with the “.csv”... -
Page 310: Additional Features
Once the data is in the spread sheet program it can be manip- ulated, stored, and graphed using the standard spreadsheet functions. You can also export and/or save the translated data to a text file, by selecting the Export Data menu item from the File menu. - Page 311 Histogram Options Window These settings only affect how the The histogram options window allows more flexibility in data is displayed and not how they viewing the histograms. are stored. Here you can set the parameters to fit your particular needs. To access the histogram options window, go under the “View”...
- Page 312 RT60 Select Options The 824 Utility software can calculate an RT60 for each 1/3 octave frequency from the autostore ByTime data taken by the RTA instrument. The software gives you the flexibility to set the options for the calculation and display of the RT60 values. You must first take an autostore ByTime measurement.
- Page 313 RT60 Measurements Both the 824 instrument and the 824 Utility software round the RT60 values to two decimal places. However, because the 824 uses logrithmic arithmetic to calculate the RT60 value and the 824 Utility software uses double precision to calculate the value, there may be small differences in the values as reported by the 824 instrument and by the 824 Utility software.
- Page 314 9-36 824 Reference Manual 11/8/00...
-
Page 315: Chapter 10 Rta (Optional)
C H A P T E R RTA (optional) Welcome to the System 824 Real-Time Analysis Firmware Option. This option adds high speed spectral data gathering to the System 824 and will enable you to perform the follow- ing measurements: • Architectural Acoustics •... -
Page 316: Settings Menu
Settings Menu ROOMS.RTA is setup to be a 1/1 The Settings menu for the RTA instrument is accessed from octave analyzer that takes 10 second SETUP key. There are three permanent RTA instru- measurements for NCB and RC ment definitions (ID) available: ROOMS.RTA, RT60- analysis. - Page 317 The menu layout of the RTA settings is shown in the table below: Menu Items Submenu Available Settings Options Available Settings Options Title User customized text entry Gain (dB) Bandwidth Detector Lin Detc Time 0.0025 to 99.9975 sec 1/32 1/16 Exp Detc Time (seconds) 1/2 second...
- Page 318 Menu Items Submenu Available Settings Options Available Settings Options L < Arm Mode L > Input Time Count Arm Level 0.0 - 255.9 dB Arm Time 00.0000 to 99.9975 sec Arm Samples 0 - 65535 Arm Logic In High L < Trigger Mode L >...
-
Page 319: Settings Descriptions
Menu Items Submenu Available Settings Options Available Settings Options Run Logic In High Trigger Setup (continued) Logic Out 0 - 65535 RT60 dB Down Auto RT60 Note 8 Characters Settings Descriptions Title Setting Use the title setting to create a title or heading for printed reports. - Page 320 • Exponential Linear Detector Time The Linear Detector Time will be Allows the user to select the averaging time when the linear adjusted to an integer multiple of detector is used. Also sets the storage rate for the Autostore 0.0025 seconds (2.5mS). ByTime records.
-
Page 321: Autostore Settings Menu
Random Correction The Random Corr setting gives you the option of turning on a digital filter to provide the correction necessary to provide a random incidence response when measuring with a 2540 or 2541 free-field microphone. See Appendix C for the random inci- No - Random incidence correction is turned off. -
Page 322: Arm Settings Menu
off and the Autostore function turned on, the 824 will only By default, the RT60-A and RT60-B store Leq, Max, and Min spectra. instruments have Autostore and ByTime enabled. Triggering Turns triggering on or off. There are four parts to triggering: Arm, Trigger, End, and Then. - Page 323 • Count - The 824 arms after “Arm Count” samples of data have been received. Arm Level Arm Time is used in conjunction with This trigger level is used when the “Arm Mode” is set to a Arm Level as a qualifier for the level level state (L<, L=, L>).
-
Page 324: Trigger Settings Menu
Trigger Settings Menu Trigger Mode The 824 triggers and starts recording an Autostore record- when Armed and the following conditions are met: • Now - The 824 starts recording an Autostore immedi- ately. • L < - When the level is less than the “Trigger Level” for “Trigger Time”, then, the 824 begins recording an Autostore. -
Page 325: End Settings Menu
time is non-zero, then the level condition must be met for the specified time before the trigger will occur. • 00.0000 to 99.9975 seconds Trig Samples When the “Trigger Mode” is set to Count; “Trig Samples” is the number of samples that will be taken before the 824 starts recording an Autostore record. -
Page 326: Then Settings Menu
• Time - The 824 stops recording an Autostore after “End- Time”. • Count - The 824 stops recording an Autostore after “End Samples” of data have been received. End Level This level is used when the “End Mode” is set to Level (L<, L=, L>). -
Page 327: Trigger Settings Menu (Continued)
• Stop - The measurement ends. • Repeat - The measurement repeats when the Arm and Trigger settings have been satisfied. A new Autostore record is created for each repeated measurement. Repeat Averaging requires the End • Average - The measurement repeats (like repeat above) Mode to be set to Time or Count so except that the spectra are averaged with the preceding that all records are the same length. - Page 328 Logic Out The Logic Out bit value determines which lines (heater, cal, or logic) will be used on the control connector to indicate each of the five states. • 0 - 65535 These lines can be used to control The setting for the Output Logic state selection is combined lights in a remote control device to into one 15-bit setting that has 3 bits (one for each output- indicate the current state.
-
Page 329: Rta Settings
RT60-A and RT60-B Instrument Definition The System 824 contains two special RTA IDs on the setup menu which will simplify making an RT60 measurement. Both of these setups load the RTA instrument but with the triggering, arm, and end menus configured for two types of measurements. - Page 330 The RT60-A and RT60-B RTA instruments are accessed from the SETUP key. RT60-A Although the settings are predefined The RT60-A setup is designed to gather data to measure an in RT60-A and RT60-B, they can be RT60 by exciting a room with a steady state noise. It is con- changed at any time and used as cus- figured in the following way: tomized setups for a personalized...
-
Page 331: Rooms Rta Instrument Definition
• Then: Stop Rooms RTA Instrument Definition The System 824 has an Instrument Definition that makes it easy to measure room criteria, NCB and RC, using the RTA in 1/1 octave bandwidth. The setup is configured to take data for 10 seconds at each location in a room. Each measure- ment is automatically stored in the Autostore ByTime his- tory. -
Page 332: Rta Views
• Detector: Linear • Linear Detector Time: 00.1000 seconds • Autostore: Yes • ByTime: No • Triggering: ON • Trigger Mode: Now • End Mode: Time • End Time: 10.0000 seconds • End Then: Stop Display Views This next section will explain the various displays available under the View key. - Page 333 Use the u p and d own arrow keys to highlight the desired display. The RTA display view menu offers 5 choices: Live, Leq, Max, Min, and Times. Use the check key to select the Live display. Live If the sample time is greater than The RTA Live display shows the live spectrum and is the 0.25 seconds a display spectrum is current sampled data with a sample time based upon the...
- Page 334 Press the V iew key again to dis- The Leq display shows the equivalent level of all the sam- play the “View RTA” menu. Press ples. A current or overall reset will reset the Leq. u p and d own arrow keys to highlight the desired display and press the check key to select...
- Page 335 Once in a display view, you can sim- The Min spectrum shows the minimum level obtained by ply use the u p and d own each filter along with the minimum broadband (Flat) level. arrow keys to move between the This is a bin-by-bin minimum level.
-
Page 336: Trigger Views
Trigger Views The Trigger Display Views are accessed through the View key. To select the Trigger Display Views press the V iew key. The following menu will appear: Use the u p and d own arrow keys to highlight “Trig- ger”. - Page 337 Display label Trigger State Filter level in dB Selected filter frequency Trigger source frequency Repeat count No. of pretrigger or triggered ByTime samples Setup Use the d own arrow key to move The Trigger Setup display shows the trigger settings in an to the Setup display or press the interpretive way.
-
Page 338: Autostore Views
• The measurement will repeat 2 more times before stop- ping for a total of 3 measurements. As the settings are changed the Trigger Setup display will show the relevent settings in an easy to read form. Autostore Views If triggering is enabled, the record is An Autostore is a historical record of triggered data that is stored when the End conditon is met stored automatically when the Autostore setting is set to Yes. - Page 339 Press the r ight arrow key to select the available Autostore summary data views which are Leq, Max, and Min. Use the up and down arrow keys to highlight the desired display. Press the check key to view the Leq display. The autostore Leq display shows a bin by bin equivalent level of all samples while the Autostore is triggered..
- Page 340 The Autostore Max display shows the maximum level obtained by each filter and the broadband maximum level of all samples while the Autostore is triggered. Autostore occurance date and time Display label Record number/total records Filter level in dB Bandwidth (1/1 or 1/3 oct.) Selected filter frequency Autostore duration Number of autostore records...
- Page 341 Press the View key to return to the “View Autostore”sub- menu. Press the l eft arrow key to back out to the main “View Autostore” menu showing Autostore, ByTime, and RT-60 menu items. Use the down arrow key to highlight the “ByTime” menu item and press the r ight arrow key to access the “ByTime”...
-
Page 342: Autostore Bytime Spectral History
Autostore ByTime Spectral History The Autostore ByTime spectral history has two displays for viewing the time history data. The first is called the ByTime Spectrum and the second is called the ByTime Graph. ByTime Spectrum The Autostore ByTime Spectrum display shows just one sample in time and the entire frequency spectrum with fre- quency on the horizontal axis. -
Page 343: Bytime Spectrum Check Menu
ByTime Graph The Autostore ByTime Graph display is a time graph of just one filter frequency, plotted with time as the horizontal axis. This graph is useful in seeing the level “rise or fall” charac- teristics of each individual filter. Autostore record number Display label Current ByTime sample number... -
Page 344: Bytime Graph Check Menu
The check menu offers the following options: • ByTime Graph - View the time graph of one filter • Autostore - View the Autostore Leq, Max, and Min spectra The Locate menu helps you find the • Locate - Locate an Autostore/ByTime record record you would like to view. - Page 345 The check menu gives you the following options: • ByTime Spctrm - View the Bytime spectrum • Autostore - View the Autostore Leq, Max, and Min spectrum Locate - Locate an Autostore ByTime record The Locate menu helps you find the •...
- Page 346 The horizontal graph adjustment, • Graph-H - Adjusts the horizontal graph scale (Graph-H), provides a useful feature that allows you to view a large amount of time data in the ByTime Graph view. A scale factor of 1 to 1024 can be selected . A scale factor of greater then 1 will cause multiple pieces of time data to be graphed to 1 bar.
-
Page 347: Rt-60
Highlight “RT-60” and press the check key. RT60 The RT-60 analysis display uses the ByTime history to cal- culate a room decay time. This time is calculated from the cursor position to a point a number of dB down as set by the “RT60 dB Down”... -
Page 348: Rt60 Check Menu
RT60 Check Menu Pressing the check key when viewing the RT60 display puts you in the RT60 check menu. The check menu is shown below: The check menu offers the following options: • RT60 dB Down - dB down setting for RT-60 calculation •... - Page 349 Now press the r ight arrow key to bring up the “View Avg” display view menu. The “View Avg” display view menu offers 2 choices: Spatial Avg and Avg History. Use the check key to select the Spatial Avg display. Spatial Avg The “Spatial Avg”...
-
Page 350: Spatial Avg Check Menu
Any display which shows a spectrum Each display that can show a spectrum has a check menu can be averaged using the “+Aver- item, “+Average”, that, when selected, will prompt the user age” item on its check menu. “Add to Average?”. It then offers the following choices: •... -
Page 351: Avg History Check Menu
• View Back - Return to the previous display • Graph - Adjusts the vertical graph scale and offset Avg History If the data being viewed has come The Avg History display shows a history of the spatial aver- from a stored file, the +average ages which have been stored using the “Store”... -
Page 352: Rooms Views
The check menu offers the following options: • Edit Note - Edit the note of this stored record. • Locate - Locate a Spatial Avg history record - First - The first Spatial Avg history record - Last - The last Spatial Average history record - Find - Finds the specified Spatial Average his- tory record If you are viewing an “Avg History”... - Page 353 RC, NCB and HTL are accessed in the “Rooms” display from any spectrum’s check menu. NCB and RC are only displayed Rooms NCB when using 1/1 octave filters. The Rooms NCB display calculates the noise criterion for the spectrum being displayed when “Rooms” is chosen from any spectrum check menu.
- Page 354 Rooms RC Use the u p and d own arrow The Rooms RC display calculates the noise criterion for the keys to move between the RC and spectrum being displayed when “Rooms” is chosen from a NCB displays. check menu. Display label Level in dB of selected filter Selected filter frequency...
- Page 355 Rooms HTL The “Rooms HTL” display is only The Rooms HTL display calculates the Hearing Threshold available when 1/3 octave filters are Level for the spectrum being displayed when “Rooms” is selected. chosen from any spectrum’s check menu. Display label Level in dB of selected filter Selected filter frequency HTL status...
- Page 356 10-42 824 Reference Manual 11/8/00...
-
Page 357: Chapter 11 Fft (Optional)
C H A P T E R FFT (Optional) The FFT option gives the 824 the ability to do fast fourier analysis. This chapter describes the features and functions of this option. Features The FFT option has the following features: •... - Page 358 To select the FFT instrument, press the SETUP key, scroll down to the FFT instrument and press the Check key. The FFT display will appear. Press the SETUP again to return to the SETUP menu. At the top of the Setup menu “Edit Settings”...
-
Page 359: Settings Descriptions
Settings Descriptions Title Setting Use the title setting to create a title or heading for printed reports. This title will be placed at the top of each FFT report you print. You are allotted 30 characters. Printing of FFT reports is not currently available. Gain Setting -20 &... - Page 360 • 1 to 16384 FFT Repeat Once the average count is completed you can choose to con- tinue repeating the FFT or have the FFT stop. • No - Stops the count when the average count has been reached. • Yes - Repeats the count continuously. Window The Hanning window is typically The time weighting window can be the following:...
- Page 361 • Electret - This indicates that the microphone being used is an “Electret” (pre-polarized) microphone. The 824 will not generate any polarization voltage. Gains of -20 and -10 dB are only • Direct - This indicates that no microphone is being used available condenser micro-...
-
Page 362: Fft Display
FFT Display The FFT data displays are accessed through the View key. To select the FFT displays press the View key. The following menu will appear: “FFT” accesses the live FFT spec- With “FFT” highlighted, press the Check key to enter the trum and “Snapshot”... - Page 363 FFT Zoom You can view approximately 80 bars The FFT zoom on the 824 allows you to view a representa- of the FFT at once. When you are tion of all 400 lines or a portion of the 400 lines on the dis- zoomed out you will notice that each play.
-
Page 364: Fft Check Menu
FFT Check Menu Pressing the Check key while in the “FFT” display puts you in the check menu shown below: The check menu offers the following options: • Store Snapshot - Stores the current FFT spectrum at that moment in time. The THD as calculated in the 824 •... - Page 365 Fundamental frequency THD+n percentile THD+n dB down Harmonic dB down Harmonic percentiles 4th & higher harmonic 4th & higher harmonic percentile THD information is only available Results are reported in dB down difference and units of per- on screen at the time of the measure- centile.
-
Page 366: Thd Check Menu
sum calculation will include only the 3 and/or 4 bins but not the 1 or 2 bin. In any case the noise energy sum calculation will never include the first four bins. • The fundamental must be higher than any of the first four bins. -
Page 367: Snapshot Check Menu
Snapshot Once you have stored an FFT snapshot by accessing “Store Snapshot” from the FFT check menu, you can view the snap- shot data by pressing the View key. The following menu appears: Highlight “Snapshot” and press the Check key to access the snapshot data. -
Page 368: Entering Linear Units
The check menu offers the following options: • Locate - Locate Snapshot record - First - The first Snapshot record - Last - The last Snapshot record - Find - Finds the specified Snapshot record • Graph - Adjusts the graph scale and offset (See 824 Ref- erence Manual) - Graph Level - Allows numerical entry of graph level in dB. - Page 369 To convert sensitivity to decibels use the following formula: When the linear scale is set to zero Linear Scale (dB) = 20Log (1 volt / sensitivity) the 824 will read the input voltage. For example: The sensitivity of an accelerometer is 50mV/g. The Linear Scale would be calculated using the following formula: +26.0 dB = 20Log [1 volt / 0.05V] Enter +26.0 dB into the menu item “Linear Scale”...
- Page 370 Below is an example of the FFT live display with linear units: Read out at cursor Linear Units Frequency shown by cursor The following explains each of the display’s components: In this case it shows 20.12 mili-g Read out at cursor - This is the linear units level at the cur- acceleration.
- Page 371 11/2/00 FFT (Optional) 11-15...
- Page 372 11-16 824 Reference Manual 11/2/00...
-
Page 373: Chapter 12 Aud (Optional)
C H A P T E R AUD (Optional) The System 824 precision sound level meter with the 824- AUD firmware option is the heart of the Larson-Davis audi- ometer calibration system. This instrument and its firmware maintain and exceed the performance of previous Model 800B-based systems when used with the AUDit™... -
Page 374: Selecting The 824-Aud Operation Mode
Selecting the 824-AUD Operation Mode To enable the 824 audiometer testing firmware option, turn on the 824. After the start screen is appears, press SETUP and use the arrow keys up/down arrows to highlight the AUDTest.AUD setup. Press the check key to retrieve the current setup and enter the audiometer calibration mode. -
Page 375: Slm+Rta Mode
SLM+RTA Mode In the SLM+RTA mode, the 824 can be used for the follow- ing measurements: • frequency • linearity • crosstalk This mode consists of two screens: the SLM+RTA Live screen and the Any Level-a screen. SLM+RTA Live screen This is the default screen for the AudTest.AUD setup. -
Page 376: Any Level-A Screen
Linearity measurements can also be Linearity evaluation can easily be performed by placing the performed using the linearity dis- cursor on the audiometric presentation frequency, then vary- play, (page 11-9). ing the hearing level output and monitoring the measured level on the 824. Similarly, cross talk measurements are performed with the non-test earphone being measured, then comparing the test earphone level to that measurement. -
Page 377: Fft Mode
FFT Mode In the FFT mode, the 824 can be used for the following mea- surements: • harmonic distortion • narrow and broad band noise • frequency • linearity • crosstalk This mode consists of three screens: FFT, THD, and Linear- ity. -
Page 378: Thd (Total Harmonic Distortion)
The FFT measurement can be tailored with a number of vari- ables. To enter the menu where these are selected, press the check key You can now use the arrow and check keys to change the FFT gain (-20 to +50 in 10 dB steps), bandwidth (200, 500, 1K, 2K, 5K, 10K, and 20K hertz), and window (Hanning, rectangular or flat top). - Page 379 Use the the up/down arrows t o highlight “THD” and press the check key The THD display shows the results of the THD calculations. Fundamental frequency THD+n percentile THD+n dB down Harmonic dB down Harmonic percentiles 4th & higher harmonic 4th &...
- Page 380 • The fundamental must be above the 4 bin or 10 Hz, whichever is higher. In the case where the fundamental frequency is near the 5 bin and it’s skirt extends into some or all of the first four bins, the fundamental energy sum calculation will include only the 3 and/or 4 bins...
-
Page 381: Linearity
200Hz, 500Hz, 1kHz, 2kHz, 5kHz, 10kHz, 20kHz Linearity The linearity screen is useful when measuring the frequency response or the amplitude linearity of a system such as an audiometer. To access the linearity screen, press the VIEW key , high- light “FFT”... - Page 382 Fundamental-reference Fundamental frequency Fundamental level Reference level In order to measure the amplitude linearity of your system, input a signal as a reference amplitude and frequency. You will see the actual level minus the reference level displayed in the upper left of your screen as the Fundamental - refer- ence.
-
Page 383: Pulse/Fm Mode
You will notice that the Fundamental - reference level is now zero as the reference level was set to equal the funda- mental Level. The Fundamental level still shows the dB level of the incoming signal. Linearity information is only avail- By varying the amplitude level you will see the Fundamen- able on screen at the time of the tal - reference level change. - Page 384 This very simple display shows all the required values for the calibration of the pulsed tone capabilities of an audiome- ter. Present the pulsed tone at a proper level and press the RUN/STOP key . The stability of the measurement can be evaluated visually.
- Page 385 • Plateau or Pulse Width (C-E) - duration in milliseconds of the plateau during which the signal is within -1 dB of its nominal value • Overshoot (L ) - the level in dB that the signal rises above the normal “ON” level (SPL on). 11/8/00 AUD (Optional) 12-13...
-
Page 386: Pulse/Fm-B Screen
Pulse/FM-b Screen To access the Pulse/FM-b screen, press the VIEW key then select Pulse/FM with the up/down arrows and press the check key This will display the Pulse/FM-a screen. Press the left or right arrow to view the Pulse/FM-b screen. This screen displays required values for the calibration of the frequency modulated tone capabilities of an audiometer. -
Page 387: Pulse/Fm Check Menu
Pulse/FM Check Menu While in either the Pulse/FM-a screen or Pulse/FM-b screen the check menu can be accessed by pressing the check key The check menu is shown below: The check menu allows you to change the gain. The gain choices available are: •... - Page 388 12-16 824 Reference Manual 11/8/00...
-
Page 389: Appendix A Integrated Level Calculations
C H A P T E R Integrated Level Calculations Basic Integrated Level Calculations The Larson•Davis System 824 calculates all of its integrated levels based on equations from IEC standard 804. IEC-804 Section 3.3 defines L eq as follows: Equivalent continuous A-weighted sound pressure level... - Page 390 If no frequency weighting is used, the quantity is simply called equivalent continuous sound pressure level. The Larson•Davis System 824 calculates many time-inte- grated levels or time-weighted averages (TWA) based on different parameters and time intervals. They are all...
- Page 391 For example, the System 824’s Logging SLM Overall-a dis- play shows the current SPL (Sound Pressure Level) in 1/ 10 th decibel (dB) resolution. The actual real-time resolution is 1/32 nd dB. The displayed SPL is followed by the text “dB”...
- Page 392 The limit of s is 4,294,967,295 samples and is stored in a 32 bit integer variable within the System 824. This limit is greater than 1553 days or greater than 4 years and 4 months.
- Page 393 The following data indicates which settings are associated with which TWA data variables: 9/12/00 A -5...
- Page 394 Variable Name Location Settings OverAll Lint or TWA (Lint = SLM-a, SLM-b, DOSE-a (TWA) #48, Overall Exchange Rate Data Report: Overall #49, Overall Threshold Integrated Level) IO Command: R9 Overall Runtime: R5 Title Text: R10 Overall TWA is reset only by a RES-ALL key or the S1,1 IO Command. Current Lint or TWA SLM-a, SLM-b, DOSE-a (SLM win- #45, Current Exchange Rate...
- Page 395 Variable Name Location Settings Logged into time history record at end of measurement interval (can be programmed for periods from 1/32 nd of a second to 255 minutes). a. The display title within parenthesis () indicates the Model 820 display location.
- Page 396 T is the measurement duration in hours t is the time in hours L is the SLOW, (or FAST) A-weighted sound level, a func- tion of time, when the sound level is greater than or equal to L, or equals -× when the A-weighted sound level is less than is the threshold sound level specified by the manufacturer is the criterion sound level specified by the manufacturer Q is the exchange rate in dB, and q = the parameter that...
- Page 397 32 samples per second, is the criterion sound duration as set by the System 824’s “Criterion Time Hours” setting which by default is set to 8...
- Page 398 A-10 824 Reference Manual 9/12/00...
-
Page 399: Appendix B Serial Port Interface Remote Control
C H A P T E R Serial Port Interface Remote Control The System 824 is fully controllable remotely via the Serial Port interface. Settings and the operational mode can be changed by sending commands through the serial port. Data can also be downloaded to and settings queried and set by the controlling computer. -
Page 400: Interface Cables
Interface Cables Serial Port communications are made through the 8-pin con- nector at the base of the Model 824. The instrument’s signals conform to the RS-422 standard and are compatible with RS-232C. The connectors use the same pin out and cables as Apple®... -
Page 401: Daisy Chain Addressing
Daisy Chain Addressing The following instruments are com- A network of instruments may be interconnected to one patible on a common network: Mod- computer using the appropriate cabling, and each may be els 712, 720, 812, 814, 824, 870, and controlled individually. - Page 402 Command Description Address 0 ($80), Broadcast, will enable addressing of all 824s on the net in a broadcast receive mode. Only the 824 with address 1 will respond; all will receive the command. Address 127 ($FF), Address All, will enable all 824s to receive and respond to commands;...
-
Page 403: Commands
Commands The commands are a series of ASCII characters with an alpha command and one or two numeric operands followed by a carriage return, ASCII 13. The commands may be spelled out though only the first character is significant. i.e. READ 123 may be abbreviated to R123. -
Page 404: Remote Control Commands (Detailed
Remote Control Commands (Detailed) Mode Commands Format for the Mode Commands is: Command Description Power On (clear error message list and reset display functions to “–a” windows) Power Off (cease sending further commands or the 824 will power back on) Run (begin accumulating data) Stop (stop accumulating data) M4,1... -
Page 405: Read" Commands (Reads Out Data Variables
M 9,1 Enable High Resolution Levels (nnn.nn for all sound level data (to I/O channel only)) M 10 Lock 824 (leaves 824’s power on) M 11 Lock 824 and Power Off (cease sending further commands) M 12 Disconnect Modem (terminate connection and hang up) M 13 Extend Modem Connect Time-out (can be set up to 255 seconds and allows time for modem diagnostics) - Page 406 R1, 1 Option feature identification. (8 characters) F3 E0 M3 Used to determine optional features of the system. The returned string will show the availability of a filter card, the ENV firmware option and the memory options. The filter has 3 options: None (F0), 1/1 octave filters (F1) and 1/1 plus 1/3 octave filters (F3).
- Page 407 R1,170 10101010 1,3,5 NOTE: the 7th bit of ConfigFlag cannot be tested. Syntax Instrument Description Response Type Current Date and Time ddd ddmmmyyyy hh:mm:ss Status Run mode, Lock, Logic In, Alarm, Archive 0 R3,1 Short status string cccccc R3,2 Short status string and reset alarm cccccc tripped status A short status string for R3,1 and R3,2 has a 6 character...
- Page 408 R3,3 Status of Active ID Archive Status, “A” indicates that it has been modified since being uploaded. Changed Status, “C” indicates that it has been changed and not saved back to it’s ID from file, “F” indicates that it has been recalled from a data file.
- Page 409 R18,x SSA, ISM, Current Lmin Date and Time ddmmmyy hh:mm:ss R19,x OverAll Maximum Level nnn.n dB R20,x OverAll Lmax Date and Time ddmmmyy hh:mm:ss R21,x SSA, ISM, Current Maximum Level nnn.n dB R22,x SSA, ISM, Current Lmax Date and Time ddmmmyy hh:mm:ss R23,w OverAll Peak Level...
- Page 410 LOG, SSA Ln 1 nnn.n dB LOG, SSA Ln 2 nnn.n dB R 40 LOG, SSA Ln 3 nnn.n dB R 41 LOG, SSA Ln 4 nnn.n dB LOG, SSA Ln 5 nnn.n dB LOG, SSA Ln 6 nnn.n dB Overall Dose nnnnn.n% SSA, ISM,...
- Page 411 Total EXCD Leq nnn.n dB Total EXCD Time hhhhh:mm:ss.s NOTE: The exceedance Leq, R68, and exceedance time, R69, include data from qualified events that are stored in the EXCD History. If an event is discarded because it was shorter than the minimum duration then it will not be included in these values.
- Page 412 R100 Logic Output 2 State [On/Off} R101 Report Number nnnnn R102 Page Number nnnnn R103 Printer Line Number R104 Calibration Date/Time ddmmmyy hh:mm:ss R105 Cal Check Date/Time ddmmmyy hh:mm:ss R106 Cal Offset nnn.n R107 Cal check Level nnn.n + OFFSET R108 SSA, ISM, LOG RMS Exceedance Flag 1...
- Page 413 R138 SSA, LOG Interval Date and Time of Occur- ddmmmyy hh:mm:ss rence R139 SSA, LOG Interval Duration hh:mm:ss / mm:ss.ss R140 SSA, LOG Interval Lint nnn.n dB R141 SSA, LOG Interval SEL nnn.n dB R142 SSA, LOG Interval Lmin nnn.n dB R143 SSA, LOG Interval Lmax...
- Page 414 R154 Internal UwPk detector level nnn.nn dB R155 Number of Bytes in Keyboard Stack This is used with keyboard simulation to prevent the loss of keys. R156 Background Leq Time hhhhh:mm:ss.ss R157 Calibration Status Done, Wait, Waiting, Stable, Unstable, Too High, Too Low.
- Page 415 R167 PassBy Lmax nnn.n R168 PassBy Leq nnn.n R169 PassBy SEL nnn.n R170 External Battery Level in Volts nn.n V R171,f SSA, AUD, RTA filter - LIVE Level nnn.n dB *f is ANSI filter R172,f SSA, TAL RTA filter - CURRENT Leq nnn.n dB *f is ANSI filter R173,f...
- Page 416 R191 Audiometric Test, Rise Time nnnnn.nn R192 Audiometric Test, Fall Time nnnnn.nn R193 Audiometric Test, On Time nnnnn.nn R194 Audiometric Test, Off Time nnnnn.nn R195 Audiometric Test, Plateau Time nnnnn.nn R196 Audiometric Test, Overshoot Level nnn.n R197 Audiometric Test, Level nnn.n R198 Audiometric Test, FFT Frequency...
- Page 417 R211 Leq Spectrum’s Duration hhhhh:mm | hh:mm:ss | mm:ss.ss | ss.ssss R212 Leq Spectrum’s Overload Status ‘Ovld” R213,f Lmax Spectrum ,n (n=ANSI filter nnn.n number or -1 for Flat) R214,f Lmin Spectrum (f=ANSI filter num- nnn.n ber or -1 for Flat) R215 Trigger State ‘Stop, Ready, Armed, Trigd,...
- Page 418 R226,n Display the Last history record type 0 - Last record type string ccccccccc 1 - Date/Time of last record ddmmmyyyy, hh:mm:ss 2 - Duration/Runtime of last rec. hhhhh:mm, hh:mm:ss, mm:ss.ss 3 - Record Size (bytes) nnnnnnn 4 - Instrument type of record R227 Tonal Frequency in Hz nnnnn...
-
Page 419: Any Data" Read Commands
*If f=0 then all 33 filter levels will be output in a comma delimited string. **If n=0 then all 6 percentages will be output in a comma “ANY DATA” READ COMMANDS The 824 measures SPL data with three frequency weightings and with three time weighting detectors simultaneously, as well as peak and integrated levels with three frequency weightings. - Page 420 R 21,x SSA, ISM, LOG Current Maximum (Any Wght/ nnn.n dB Level Dect) R 22,x SSA, ISM, LOG Current Lmax Date (Any Wght/ ddmmmyy hh:mm:ss and Time Dect) R 23,w SSA, ISM, LOG OverAll Pk Level (Any Wght) nnn.n dB R 24,w SSA, ISM, LOG OverAll Lpk Date...
-
Page 421: Other Read Commands
Where “w” indicates a number to represent the weighting NOTE: Impulse detector is not applica- ble for Takt levels which has these values (Detector is not applicable for these measurements): A weight C weight Flat weight If “w” is not provided or it is zero then the value indicated by the Wght settings is given. -
Page 422: Setting Commands
macro is executed with the G0 or O[ther] 3 commands which returns the list of defined read variables. Use the following command syntax to program each desired read variable and its position in the macro. Syntax Response G[roup]n, var_no <cr><lf> Example: G1, 4 <cr>... -
Page 423: Querying Settings
Brackets [ ] indicate optional characters or operands. <cr> = carriage return; <lf> = line feed; _ = space Querying Settings The current setting is retrieved with the Query (Q) com- mand. syntax query command Q[uery ]setting_number[,options] where setting_number is the number of the desired setting and options is a number to select the appearance of the response. -
Page 424: Ln Query Commands (Ssa
4.Q74, 32 5.Q74, 3 Excd History Enable=[_No] Responses are denoted by (x) if Yes/No or (n) if numerical. Ln Query Commands (SSA) Commands Instru- Description Comments ment Type Q 63 Ln 1 Percent nn.nn Q 64 Ln 2 Percent nn.nn Q 65 Ln 3 Percent nn.nn... - Page 425 Option settings can be set in two ways: a. option number and b. actual option settings text. a.Option Number Syntax Response S[et]item_number,option_number <cr><lf> Example: S9, 3 sets setting 9:Baud Rate to option 3 which sets the baud rate to 9600 Example: S674, 1 sets Excd History Enable to Yes.
-
Page 426: Character String Settings
Numeric Settings Syntax Response S[et]item_number, setting_value <cr><lf> Example: S62, 120 sets RMS Excd Level 2 to 120. Character String Settings To include leading spaces in a character string setting, pre- cede the character string with a “`” (leading single quote or grave accent, ASCII 96 or hexadecimal 60). -
Page 427: Setting List
Setting List Com- Instrument Description Comment mand Type S1,x RESET-ALL S2,c HEADING LINE #1 S3,c HEADING LINE #2 S4,c HEADING LINE #3 S5,c MEASUREMENT TITLE S6,t CURRENT TIME S7,t CURRENT DATE S8,x DAY OF WEEK S9,x Serial Communications Baud Rate S10,n Serial Communications Address S11,x... - Page 428 Where c = character, t = template, n = numeric, and x = option index. External Power Type [AC Pwr|Battery] Protects External Battery External Power-Off Voltage POWER SAVE OPTIONS [Blank LCD / Auto Off / Manual Off] Standby Time (LCD Blank & Comm 0 to 99 minutes Off) (nn) Auto-Off Time (nn)
- Page 429 LOCK I/O CAL LEVEL CALIBRATOR S/N AUTO-CALIBRATION MODE AUTO CAL TIME SSA, ISM, DETECTOR LOG, AUD SSA, ISM, FREQUENCY WEIGHTING LOG, AUD AC/DC Output Control [AC-1 AC-2 | AC-1 DC | AC-2 DC | AC-2 AC-1] SSA, ISM, Pk Detector Weighting [A | C | Flat] LOG, AUD SSA, ISM, RANGE [Normal | Low | High]...
- Page 430 RTAf EXPONENTIAL DETECTOR [1/64, 1/32, 1/16, 1/8, 1/4, TIME 1/2, 1, 2, 4, 8, 16, 32, 64] SECONDS OVERALL THRESHOLD RTAf EXPONENTIAL DETECTOR [1/2, 1/8] SECONDS STORAGE RATE OVERALL CRITERION RTAf RTAf AUTOMATIC RESET AT [NO, YES] TRIGGER CRITERION TIME (HOURS) RTAf AUTOMATICALLY STORE [YES, NO] EVENT RECORDS...
- Page 431 Lnn 4 PERCENT RTAf ARM TIME (SS.SSSS) SECONDS (FOR LEVEL AND TIME ARM MODE CONDI- TIONS) Lnn 5 PERCENT RTAf ARM SAMPLES (NNNN) Lnn 6 PERCENT RTAf ARM LOGIC INPUT TRUE [LOW, HIGH] LEVEL SSA, ISM, SPL Exceedance Level 1 RTAf TRIGGER MODE [NOW, L<, L=, L>, INPUT, TIME, COUNT]...
- Page 432 EXCD EXCHANGE RATE RTAf LOGIC OUTPUTS CONTROL (BIT MAPPED WORD: 3 SETTING OUTPUTS BY 5 STATES) EXCD MINIMUM DURATION RTAf END MODE [NEVER, L<, L=, L>, INPUT, TIME, COUNT] EXCD TIME-HIST ENABLE RTAf END LEVEL (NNN.N) dB EXCD TIME-HIST PERIOD RTAf END TIME (SS.SSSS) SECONDS RTAf END SAMPLES...
- Page 433 RTAf RT-60 CALCULATION dB [5, 10, 20, 30] DOWN SETTING SSA, LOG INTV PERIOD HORIZONTAL GRAPH SCALING [1, 2, 3, 4, 6, 8, 11, 16, 23, 32, 45, 64, 90, 128, 181, 256, 362, 512, 724, 1024] SSA, LOG INTV TIME SYNC INTV SAVE Ln’S SSA, LOG INTV AUTO STOP...
-
Page 434: Histogram Reports
Histogram Reports The RMS, Peak and UWPk histogram reports have been implemented with this revision. The unformatted reports have also been developed and the format is the level of the first bin followed by the number of samples in each bin (in hex, 0-9 &... -
Page 435: Tailored Report
Tailored Report S116 EXCD REPORT S117 SSA, ISM, INTV REPORT S118 HIST REPORT S119 DAILY NOISE REPORT S120-142 Reserved settings Miscellaneous S143 Audiometric Calibrator Mode [SLM/ RTA | FFT | Pulse/FM] S144 FFT Lines [100 | 200 | 400] S145 AUD, FFT FFT Bandwidth [200 to 20KHz] S146... - Page 436 S154 MODEM MODE S155 MODEM DIAL OUT MODE S156 MODEM PHONE NUMBER S157 Monitor Number S158 MODEM INIT STRING Special Functions - Advanced use only. Remaining commands are not available on SETUP menu. S159-166 Reserved settings S167 RELATIVE LEVEL REFERENCE S174 UNFORMATTED REPORTS S175 Reserved setting...
- Page 437 S186 PEAK-II HISTOGRAM TABLE HIGHEST VALUE S187 PEAK-II HISTOGRAM TABLE RESOL S188 PEAK-I HISTOGRAM TABLE S188 RTAf PRINT LIVE SUMMARY OR [NO, YES] EVENT DATA S189 PEAK-I HISTOGRAM TABLE LOW VALUE S189 RTAf PRINT LEQ SUMMARY OR [NO, YES] EVENT DATA S190 PEAK-I HISTOGRAM TABLE HI VALUE...
-
Page 438: Error Checking I/O
S197 SSA, ISM, INTV REPORT HIGHEST RECORD S198 HIST REPORT S199 HIST REPORT LOWEST RECORD S199 EVENT BYTIME REPORT LOW- [0 . . . 65535] EST RECORD S200 HIST REPORT HIGHEST RECORD S200 EVENT BYTIME REPORT HIGH- EST RECORD S201 DAILY NOISE REPORT S201 TEMPORARY NOTE FIELD FOR... - Page 439 “Near Noise Floor” messages when within 10dB of the noise floor. It is also used with NF Com- pensate, Q208, which will place the System 824 in an extended Linearity Range Mode. The true noise floor of the entire system must be measured and entered in Q207.
-
Page 440: Rta Settings Commands
S217 HISTOGRAM TABLE LEVEL S218 Data File Record Number S219 Graph Vertical Scale, dB per pixel S220 Graph Base Level (range from -99 to +999) S221 Request to send Output Control Mode S224 LOG, RTA Start Level (nn) for Ln and ExTH S227 OVERALL CALIBRATION OFFSET (uses 225.48 lock) - Page 441 Exponential Detector Sample Rate [1/2 | 1/8] Auto-Store Records [No | Yes] Event By-Time Pretrigger Samples (nnn) Event Triggering Enable [No | Yes] Trigger Source Level [12.5 | 16.0 |... | 16.0K | 20.0K | Flat] Hz Store By-Time Samples of Event [No | Yes] Arm Mode [...
- Page 442 Logic Outputs Control Setting (bit mapped word: 3 outputs X 5 states) End Mode [Never| L < | L = | Input | Time | Count] End Level (nnn.n) dB End Time (ss.ssss) Sec End Samples (nnnnn) End Logic Input TRUE Level [Low | High] End Then, Repeat Mode [Stop | Repeat | Average]...
-
Page 443: History Records
Find commands (see below) or the Setting S211 through S217. The various histories of the System 824 are each accessed in a similar fashion. The Find command is the primary method of locating a history record for random (nonsequential) access. -
Page 444: Types Of History
that record number; it is a signed 8-bit value, i.e. 1 to 127 is positive 1 to 127 while 128 to 255 is -128 to -1 respectively. Refer to settings 211 through 217 to query the current record number. Setting these to a desired record number is an alter- nate form of the Find command. -
Page 445: Find
B[ackup][num_record][, history_number] <cr><lf> Example: B Backup current history by 1 record Example: B5 Backup current history by 5 records Example: B9,5 Backup the calibration history by 9 records from the current calibration history Find Find record number directly. Syntax Response F[ind]num_record[, history_number] <cr><lf>... - Page 446 Commands Instrument Description Commnet Type LOG RTA Date and Time of Occurrence ddmmmyy hh:mm:ss LOG, RTA Duration hh:mm:ss / mm:ss.ss nnn.n dB E3,f Leq Filter nnn.n dB E4,f Max filter Lmax nnn.n dB E5,f Min Filter Lpeak nnn.n dB Overload UnWeighted Peak nnn.n dB Pretrigger Samples...
-
Page 447: Interval History Variables ("I" Commands
Commands Instrument Description Commnet Type E14,n By Time Sample Duration E15,n By Time Overload RT60 calculation at current filter. Filter set by E 3, E 4, E 5, or E 12. Excd Time-Hist Samples E17,n Extracts ByTime History and returns nothing E18[n] Excd Time-History nnn.n dB... - Page 448 Brackets in the syntax indicate optional characters and oper- ands. Syntax Response I[nterval]var_no Intv_var Examples: 01Jan1997 01:25:00 I 1,-5 01Jan1997 01:20:00 (from 5 previous) I1,5 01Jan1997 01:30:00 (from 5 after) The time syncing feature can be used to synchronize the interval history records to the instruments real-time clock.
- Page 449 Commands Instrument Description Comments Type I0, I101 or variable greater that 4 will run macro by default. SSA, LOG, Date and Time of Occurance ddmmmyy hh:mm:ss RTA, FFT, SSA, LOG, Duration hh:mm:ss / mm:ss.ss Number of Samples Averaged nnnn Count SSA, LOG nnn.n dB Spectral or Flat Level (n=ANSI...
- Page 450 Commands Instrument Description Comments Type SSA, LOG UnWeighted Peak nnn.n dB SSA, LOG RMS Exceedance Count SSA, LOG Peak Exceedance Count SSA, LOG UnWeighted Peak Excd Count I 12 SSA, LOG Overload Counts Intv Ln 1 Percent Intv Ln 1 Level (dB) nnn.n Intv Ln 2 Percent Intv Ln 2 Level (dB)
- Page 451 “I” Commands for Basic SLM Mode: Commands Instrument Description Comments Type I5,n SSA, LOG Any SPL; n=1 to 9 nnn.n I6,n SSA, LOG Any Max; n=1 to 9 nnn.n I7,n SSA, LOG Any Leq; n=1 to 9 nnn.n SSA, LOG LAFTM5 (Takt5 A Fast) nnn.n SSA, LOG...
-
Page 452: Daily History Variables - (D1-D102
“I” Commands for Tonal Mode: Commands Instrument Description Comments Type Ftone nnnnn Hz nnnnn Hz Ltone nnn.n dB Lgroup nnn.n dB Ltone-Lgroup nnn.n dB Daily History Variables - (D1-D102) Brackets in the syntax indicate optional characters and oper- ands. Syntax Response D[aily]var_no[,hour] daily_var... - Page 453 Daily Lmin nnn.n dB Daily Lmax nnn.n dB Daily Lpeak nnn.n dB D 10 Daily Luwpk nnn.n dB D 11 Daily Run Time hh:mm:ss | mm:ss.ss D 19 Daily Ln Table in hexadecimal hhhhhh, hhhhhh,...hhhhhh <ih> D 20 Intv Ln 1 Percent D 21 Intv Ln 1 Level (dB) nnn.n...
-
Page 454: Run Log Variables (Ssa, Ism, Log, Tal
Run Log Variables (SSA, ISM, LOG, TAL) Brackets in the syntax indicate optional characters and oper- ands. Syntax Response L[og]var_nolog_var Example: L1 Run/Stop number Run/Stop Number nnnnn Run/Stop Type (RUN/STOP/CONT/PAUSE/MARK) Cause (TIMER/KEY/A:D-n/HALT/INTV/ BATT) Day, Date and Time ddd ddmmmyyyy hh:mm:ss L 101 Run-Log Macro Variables L1-L5 Macro... -
Page 455: Time History Variables (Ssa, Log, Tal
Cal Status [OK/Bad] C 101 Cal Variables 1-4 Macro Time History Variables (SSA, LOG, TAL) Brackets in the syntax indicate optional characters and oper- ands. SSA, LOG, Leq (RMS Level) nnn.n dB Other level (Pk-I, Pk-II, or Lmax) nnn.n If Other Level is set to Advc then “___”... -
Page 456: Histogram Table Variables
SSA, LOG, Same as doing an H 1 + H 5, 0 SSA, LOG, Same as doing an H 1 and H 6, 0 For the LOG instrument type H5 and H6 are for when “Other Level” setting is set to [Advc] to enable the advanced time history. -
Page 457: Print Commands
Default is last used table or RMS. Syntax Response T[able]var_no[, table] table_var Example: T1,1 -75.0 (RMS current bin level) T 1 [n Level of current bin nnn.n dB T 2 [n] Count of samples nnnnnc (c= K or M for Kilo or Mega) T 3 [n] Percent of total... - Page 458 Example: P1 Data Report is printed to computer. (1) sets all report enables in setup to [No] S177,1 (2) sets the Data report, Run-log, and EXCD report enables S178,1 (short) to [Yes] and S192,1 P100 (3) begins printing to the computer Syn- Instrument Description...
-
Page 459: Error Messages And Warnings
X 100 XMODEM Begin Printing (same as P100 except through the XMODEM communication protocol) Use with UnFormatted Reports to download a file to be viewed in a spreadsheet program. Also use this to download reports for printing on a computer’s printer, rather than directly from the 824;... - Page 460 Warning Message Code “Out of Memory” “Divide by Zero” “Battery Low” “POWER FAILURE” “External Power Failure” “Power Off” “Time Not Set!” “Timer Pending” “Printer is Busy” “DPC Format” “Key No Effect” “Stop Required” “Setting Wrong” “Overall Reset Required” “OPEN #” “Already Open”...
- Page 461 “Memory was Lost” “Unimplemented” “System Locked” “A:D Stack Full” “A:D Over-Run” “Serial Port Framing” “Serial Port Line Noisy” “Serial Port Over-Run” “Unknown I/O Command” “Operand 1 Range” “Operand 2 Range” “I/O Overflow” “Can’t Calibrate” “Calibration Invalid” “Analog Calibration Bad” “ID is Active” “ID is in ROM’”...
-
Page 462: Modem Control Mode (All Instruments
“Demo Mode” “Setting Conflict” Modem Control Mode (All Instruments) The modem control mode enables the Model 824 to auto- matically dial out upon an exceedance or a low memory con- dition. This mode also enables the Model 824 to answer the phone so that instructions can be received. -
Page 463: Monitor Number
will pause dialing for 2 s space or - used to make the number more read- able. T9W 1-412-555- indicates to use tone dialing, dial 9 1212 for an outside line, wait until the dial tone is detected, and then dial the number. -
Page 464: Model 824 Answering Procedure
Computer sends: Step 5 The Model 824 awaits a response code, which 824A0123:11111111 should be: “824A0123:11111111” (enter), where (0123) is the Model 824’s serial number and (11111111) is the Lock Combination (setting 28) which is required whether or not the Model 824 is currently locked. -
Page 465: Unsupported Miscellaneous Commands
(11111111) is the Lock Combination (setting 28) which is required whether or not the Model 824 is currently locked. If the response is incorrect, the announcement is resent. Four chances are given to respond correctly. A “3 cr” sequence will cause the Model 824 to hang up. -
Page 466: Data File Commands
>a,b Read 824's memory from address (a) and bank (b) Read Excd T.H. Buffer. This command is used to create an SPL vs. Time plot that is time cohesive. Resolution is, by default, 1 dB with one byte/sample being sent. Each byte has 32 added to it to avoid confusion with ASCII control codes, subtract 32 to use. -
Page 467: Keyboard Simulation
&F102 Recall a FILE into active memory &F103 Store the current data (in active memory) to a FILE Keyboard Simulation The keys on the 824’s keyboard may be simulated with the ‘K’ I/O command. Each key is given an ASCII character as shown in the table below. -
Page 468: Operation Notes
FUNCTION KEY #2 (DATA) FUNCTION KEY #3 (SETUP) < FUNCTION KEY #4 (TOOLS) FUNCTION KEY #5 (PRINT) Operation Notes When using the Logic Input line in the ‘LEVEL’ mode both I/O and keyboard Runs and Stops are inhibited. If the line is High the 824 takes data and if the line is Low no data is taken. -
Page 469: Appendix C Technical Specifications
The specifications contained in this chapter are subject to change without notice. Please refer to calibration and test results for data on a specific unit. These specifications are valid for all System 824’s using the following options: • PRM902 preamp •... -
Page 470: Declaration Of Conformity
Declaration of Conformity Larson Davis Inc. declares that: • Model 824 Sound Level Meter and Realtime analyzer having been tested in representative configuration with: PRM902 preamplifier, 2541 microphone and the following cables: EXA010 microphone extension cable, CBL042 AC/ DC output cable, CBL002 serial interface cable is in accordance with the following directives: •... -
Page 471: General Specifications
System 824 Main Characteristics: NOTE: The 824 does not meet IEC 60604 or ANSI S1.4 specifications when • Type 1 Precision Integrating Sound Level Meter with real- used with a high sensitivity microphone time 1/3 Octave Filters (2541 or 2560) and a 20 volt bias. The •... - Page 472 ≤ ≤ ≤ ≤ ± 0.5 dB error Humidty: between 30 and 90% relative humidity at 40°C Equivalent mic imped- 18 pF for Larson•Davis ance: ½” microphone Range level error: < ±0.1 dB relative to the reference range Calibration procedure: Using a Larson-Davis CAL200 or equivalent calibrator, insert the microphone fully into the cali- brator.
- Page 473 Power Supply Batteries: 3 AA alkaline cells or NiMH battery pack Internal charge approx. 6 hours time: Operating time 3 to 4 hours (depends on instrument selected) DC power input 6-15 Volts at 1 amp, max. Typical DC power 150 mA @ 12 Volts DC power connec- 5.5mm x 2.5mm coaxial power plug Physical Characteristics...
- Page 474 Cable Drive Capability (with PRM902 preamp) Frequencies to 20 kHz: 700 feet 213 meters Frequencies to 10 kHz: 1000 feet 305 meters Maximum RMS Voltage Input Gain VRMS Vp-p dBuV 0 dB 4.24 6.00 135.6 10 dB 1.34 125.6 20 dB 0.42 0.60 115.6...
- Page 475 Frequency Weightings Nominal Exact Flat A Weight C Weight Electrical Mic. Freq. Freq. Tolerance Tolerance 10.00 -6.0 -70.4 -14.3 ±1.8 ±2.2 12.5 12.59 -4.2 -63.4 -11.2 ±1.5 ±2.0 15.85 -2.9 -56.7 -8.5 ±1.2 ±1.8 19.95 -1.9 -50.5 -6.2 ±1.0 ±1.5 25.12 -1.3 -44.7...
- Page 476 Pulse range: > 108 dBA RMS noise floor: < 16 dBA typical (with PRM902 and 2541 mic) Reference range: Normal range (0 dB gain) Exchange rates: 3, 4, 5, or 6 dB Sample rate: 48,000 Hz AC/DC Output (LOG and ISM modes only) 824 Menu 3.5mm Connector Tip 3.5 mm Connector Ring...
- Page 477 NOTE: Ranges are in dBSPL using a typical 2541 microphone with a sensitiv- ity of 44.5 mV/Pa. A 2540 low sensitivity Peak Measurement Range (LOG and ISM modes only) microphone produces high limit values approximately 10.0 dB higher. Low Limit High Limit Range A-WT (high)
- Page 478 ≤ ±0.3 dB error for all Real-time operation: filters tested with a swept sinusoidal input. ≥ 75 dB Anti-aliasing: ≤ ≤ ≤ ≤ ± 1.0 dB (±0.4 dB Summation of output signals: typical) Flat frequency range: 10 Hz - 20 kHz, rela- tive attenuation <...
- Page 479 Measurement Range (SSA mode only) 0dB Gain 10dB Gain 20db Gain 30dB Gain 40dB Gain 50dB Gain Rang Rang Rang Rang Rang Rang Start Start Start End Start End Start Start 16.0 31.5 63.0 1000 2000 4000 8000 *NF is noise floor. NOTE: A-weighting, C-weighting, and Flat are measured to ANSI S1.4 and IEC 60651 standards for SLM linearity.
- Page 480 Overshoot computation: Overshoot is calculated as the maximum sam- ple level minus the averaged “ON” level Measurement condi- Conditions that must be tions: met to produce output: • ON/OFF modulation must be greater than 20 dB (90%). • The “ON” state must be stable within ±0.5dB for at least 20 •...
- Page 481 Linearity range: >85 dB with Hanning window, 20 kHz bandwith, and PRM902 Dynamic range: >100 dB Flat SPL linearity range: >75 dB Typical response of AUD A-weight and C-weight high pass filters Frequency Weightings Nominal Exact Flat A Weight C Weight Freq.
- Page 482 RTA Mode Specifications Filter types: 1/3 or 1/1 octave filters with Flat SPL Averaging Exponential: 1/32, 1/16, 1/8, 1/4, 1/2, 1, 2, 4, 8, 16, 32, 64 seconds Linear: 0.0025 to 99.995 sec- onds Overall time: > 1 year Linearity range: >...
- Page 483 AC/DC output: AC out 1 is flat weighted and follows the gain (tip); AC out 2 is C-weighted with 0 dB gain (ring) Measurement range: Flat is measured to ANSI S1.4 and IEC 60651 standards for SLM linearity. 1/3 and 1/ 1 octave filters are mea- sured to IEC 1260 stan- dard for Class 0...
- Page 484 Pressure (Variation over Pressure) Response of Free- Field Microphones Pressure 650 mB 750 mB 850 mB 925 mB 1013 mB 1100 mB 2520 .3831 dB .2049 dB .1371 dB .0688 dB 0.000 -.0462 dB 2540 .3396 dB .2391 dB .1488 dB .0804 dB 0.000 -.0753 dB...
- Page 485 Windscreen Corrections 9/13/00 C -17...
- Page 486 Random Incidence Microphone Correction When random incidence correction is turned on in the 824, a digital filter is added which gives the necessary correction to provide random incidence response when measuring with a free-field microphone. NOTE: Tested with the preamplifier The graphs below show the response of the free-field micro- and microphone attached directly to phones before and after the random incidence correction has...
- Page 487 Graph 2 - The 824 in normal range with the 2540 free-field microphone showing the corrected random response. Graph 3 - The 824 in normal range with the 2541 free-field microphone showing the uncorrected random response. 9/13/00 C -19...
- Page 488 Graph 4 - The 824 in normal range with the 2541 free-field microphone showing the corrected random response. C-20 824 Reference Manual 9/13/00...
- Page 489 Microphone Response Tests with 824 The 824 was oriented with the LCD The following graphs show the effects on the performance facing up for these tests. of the 824 caused by the following: • Windscreen • Instrument Case • High Range NOTE: The graphs below show typical results.
- Page 490 Graph 2 - The 824 in normal range with the 2540 micro- phone and windscreen Graph 3 - The 824 in high range with the 2540 microphone C-22 824 Reference Manual 9/13/00...
- Page 491 Graph 4 - The 824 in high range with the 2540 microphone and windscreen Graph 5 - The 824 in normal range with the 2541 micro- hpone 9/13/00 C -23...
- Page 492 Graph 6 - The 824 in normal range with the 2541 micro- phone and windscreen Graph 7 - The 824 in high range with the 2541 microphone and windscreen C-24 824 Reference Manual 9/13/00...
- Page 493 Directional Characteristics of the 824 with the 2540 and 2541 free field microphones Test Setup • The 824 was tested in two different configurations as fol- lows: - 824 oriented with the LCD facing up - 824 oriented on it’s side Definitions •...
- Page 494 Graph 2 - 824 in the XY plane fitted with the 2540 micro- phone @ 2kHz Graph 3 - 824 in the XY plane fitted with the 2540 micro- phone @ 4 kHz C-26 824 Reference Manual 9/13/00...
- Page 495 Graph 4 - 824 in the XY plane fitted with the 2540 micro- phone @ 8 kHz Graph 5 - 824 in the XY plane fitted with the 2540 micro- phone @ 12.5 kHz 9/13/00 C -27...
- Page 496 Graph 6 - 824 in the YZ plane fitted with the 2540 micro- phone @ 1 kHz Graph 7 - 824 in the YZ plane fitted with the 2540 micro- phone @ 2 kHz C-28 824 Reference Manual 9/13/00...
- Page 497 Graph 8 - 824 in the YZ plane fitted with the 2540 micro- phone @ 4 kHz Graph 9 - 824 in the YZ plane fitted with the 2540 micro- phone @ 8 kHz 9/13/00 C -29...
- Page 498 Graph 10 - 824 in the YZ plane fitted with the 2540 micro- phone @ 12.5 kHz Graph 11 - 824 in the XY plane fitted with the 2541 micro- phone @ 1 kHz C-30 824 Reference Manual 9/13/00...
- Page 499 Graph 12 - 824 in the XY plane fitted with the 2541 micro- phone @ 2 kHz Graph 13 - 824 in the XY plane fitted with the 2541 micro- phone @ 4 kHz 9/13/00 C -31...
- Page 500 Graph 14 - 824 in the XY plane fitted with the 2541 micro- phone @ 8 kHz Graph 15 - 824 in the XY plane fitted with the 2541 micro- phone @ 12.5 kHz C-32 824 Reference Manual 9/13/00...
- Page 501 Graph 16 - 824 in the YZ plane fitted with the 2541 micro- phone @ 1 kHz Graph 17 - 824 in the YZ plane fitted with the 2541 micro- phone @ 2 kHz 9/13/00 C -33...
- Page 502 Graph 18 - 824 in the YZ plane fitted with the 2541 micro- phone @ 4 kHz Graph 19 - 824 in the YZ plane fitted with the 2541 micro- phone @ 8 kHz C-34 824 Reference Manual 9/13/00...
- Page 503 Graph 20 - 824 in the YZ plane fitted with the 2541 micro- phone @ 12.5 kHz 9/13/00 C -35...
- Page 504 C-36 824 Reference Manual 9/13/00...
-
Page 505: Appendix D Glossary
C H A P T E R Glossary This appendix contains technical definitions of key acousti- cal and vibration terms commonly used with Larson Davis instruments. The reader is referred to American National Standards Institute document S1.1-1994 for additional defi- nitions. -
Page 506: Community Noise Equivalent Level (Cnel, Lden
(unsteady) sound levels. If the Measurement Duration is the same as the Criterion Duration, then L TWA(LC) ∫ t ( ) ) q ⁄ -- - 10 qLog where the Measurement Duration (specified time period) is and q is the Exchange Rate Factor. -
Page 507: Criterion Sound Level (Lc
where q is the Exchange Rate Factor. See Exchange Rate. q ⁄ Standard: ANSI S1.25 Criterion Sound Level (L It is the sound level which if continually applied for the Cri- terion Duration will produce a Noise Dose of 100%. The current OSHA Criterion Level is 90 dB. - Page 508 opposed to using the basic unit Pascal for e.g. acoustic mea- surements. It is not possible to directly add or subtract physical quanti- ties when expressed in decibel form since the addition of logarithmic values correspond to multiplication of the origi- nal quantitiy.
- Page 509 the sound power value is divided with the reference used and then the ten-based logarithm is applied. This value is then multiplied by 10 to create the decibel value (see equation D- 1 below). For every 10 decibels, a unit called Bel is created. The deci- bel stands for: deci for “one tenth”...
- Page 510 pressure levels instead (usually denoted P in acoustics), the equation will be the same, since the “two” in the squared units will move from within the bracket and become a 20 log instead of a 10 log and thus compensate for using linear or quadratic units.
-
Page 511: Department Of Defense Level (Ldod
Department of Defense Level The Average Sound Level calculated in accordance with Department of Defense Exchange Rate and Threshold Level. See Average Sound Level Dose (See Noise Dose) Detector The part of a sound level meter that converts the actual fluc- tuating sound or vibration signal from the microphone to one that indicates its amplitude. -
Page 512: Far Field
the table below. Standard: ANSI S12.19 Exchange Rate, Q Exchange Rate Exposure Factor, k Factor, q 3.01 13.333 16.667 6.02 Far Field There are two types of far fields: the acoustic far field and the geometric far field. Acoustic Far Field: The distance from a source of sound is greater than an acoustic wavelength. -
Page 513: Frequency Band Pass Filter
in cycles per second and the value has the unit symbol Hz (Hertz) added and the letter f is used for a universal descrip- tor. It can also be expressed in radians per second, which has no symbol, and the greek letter ω is used for a universal descriptor. - Page 514 unlike band pass filters. It can be composed of one or more of the following types: A-Weighting: A filter that adjusts the levels of a frequency spectrum in the same way the human ear does when exposed to low levels of sound. This weighting is most often used for evaluation of environmental sounds.
-
Page 515: Measurement Duration (T
Center Frequencies, Hz Weighting Network Frequency Response 1/3 Octave 1 Octave -8.6 -1.3 -6.6 -0.8 -4.8 -0.5 -3.2 -0.3 -1.9 -0.1 -0.8 1000 1000 1250 1600 -0.1 2000 2000 -0.1 -0.2 2500 -0.2 -0.3 3150 -0.4 -0.5 4000 4000 -0.7 -0.8 5000 -1.2... - Page 516 Capacitor (Condenser): A microphone that uses the motion of a thin diaphragm caused by the sound to change the capacitance of an electrical circuit and thereby to create a signal. For high sensitivity, this device has a voltage applied across the diaphragm from an internal source. Electret: A microphone that uses the motion of a thin dia- phragm caused by the sound to change the capacitance of an electrical circuit and thereby to create a signal.
- Page 517 the diaphragm. 4. Keep microphones away from strong electrical fields. A microphone measures forces not pressures. We would like the microphone to measure sound pressure (force per unit area) instead of sound force. If the pressure is applied uni- formly over the microphone diaphragm a simple constant (the diaphragm area) relates the two, but if the pressure var- ies across the diaphragm the relationship is more complex.
-
Page 518: Near Field
ested in and hold the meter as far from your body as possi- ble. Use a tripod whenever possible. 2. Measure the influence of other sources by measuring the background sound level without the source of interest. You may have to correct for the background. Near Field There are two types of near fields: the acoustic near field and the geometric near field. -
Page 519: Noise Dose (D
Background: The all encompassing sound at a given location caused by all sources of sound, but excluding the source to be measured. It is essentially the sound that interferes with a measurement. Pink: It is a random sound that maintains constant energy per octave. -
Page 520: Sound
defined as the start and end times of a noise event such as an aircraft or automobile passby. Sound The rapid oscillatory compressional changes in a medium (solid, liquid or gas) that propagate to distant points. It is characterized by changes in density, pressure, motion, and temperature as well as other physical quantities. -
Page 521: Sound Exposure Level (Sel, Let
Sound Exposure Level (SEL, The total sound energy in a specific time period. The equa- tion for it is ∫ t ( ) t d ------------------------ - 10Log The sound pressure is squared and integrated over a specific period of time (T ) this is called the sound exposure and has the units Pascal squared- seconds or Pascal squared- hours. -
Page 522: Sound Pressure Level (Spl, Lp
and so becomes less important. The rate at which older data are made less influential is expressed by the constant T. The larger is it the slower the decay factor reduces and the slower the response of the system to rapid changes. These are stan- dardized into three values called Time Weighting. -
Page 523: Sound Power(W
where p is the reference sound pressure of 20 µPa. The square of the sound pressure is a power-like quantity that can be expressed in the original form of the level definition ⁄ --------- - 10log Sound Pressure Level can be converted to sound pressure as follows. -
Page 524: Sound Power Level (Pwl, Lw
Sound Power Level (PWL, L The logarithmic form of sound power. It is also expressed by attachment of the word decibel to the number. The logarithm is taken of the ratio of the actual sound power to a reference sound power, which is 1 pico-watt. Sound power level can- not be measured directly, but can only be deduced through measurements of sound intensity or sound pressure around the source. -
Page 525: Time Weighting
the actual (unsteady) sound over the same period. If the Exchange Rate is 3 dB then the TWA is equal to the L t ( ) ⁄ ∫ -- - 10 Klog TWA TC ... - Page 526 length or the time delay in sound propagation. It is related to wavelength through the following equation ω 2π 2πf ----- - ------- - --- - λ where λ is the wavelength, c is the sound speed, f is the fre- quency in Hz, and ω...
- Page 527 824 Reference Manual Index Numerics Arm Settings Menu ........ 10-8 Arm Time ..........10-9 Accessories and Optional Equipment 1-12 Arrow Keys ..........3-11 Components ........1-7 Autostore ..........10-7 Features ........... 1-4 10-5 optional equipment ......1-13 Autostore ByTime Graph ....... 10-29 System Diagram ......
- Page 528 824 Reference Manual Formatting ........1-3 Creating a New Setup ......9-14 Criterion ..........D-2 sound level ........D-3 Calibrating ..........4-1 Criterion Time ........7-17 Calibration ..........2-14 Current ............ 7-66 3-22 Current Criterion ........7-18 glossary ..........D-2 Current Exchange ........
- Page 529 824 Reference Manual Dialing Procedure ........B-65 Exceedances ........... 5-7 Displays Logging SLM Exchange Rate Current / Overall - e SLM Displays 6-30 glossary ........... D-6 Current / Overall -b SLM Displays . 6-28 Exchange Rate Factor Current / Overall -d SLM Displays . 6-29 glossary ...........
- Page 530 824 Reference Manual General Views ........6-4 Intervals Check Menu ......7-60 Getting Started ........1-10 Intervals Displays ........6-43 Graph Menu ..........7-57 ISM Measuring Ranges ......5-9 Group Read Programming ...... B-23 ISM Settings ........... 7-43 Heater Control output ......7-14 HiRange ..........
- Page 531 824 Reference Manual Logic Out ..........10-14 Logic Output Setting ......7-11 Navigation keys ........3-2 Logic Output Time Setting ..... 7-13 Near Field acoustic ..........D-12 geometric ......... D-12 Manipulating a Setup ......9-10 glossary ........... D-12 Mark Display .......... 7-55 Network, Addressing ......
- Page 532 824 Reference Manual overshoot ..........12-13 Preparing for a Measurement ....4-14 Pretrigger ..........10-7 Preview ........... 3-11 Print Parameter ..........B-28 commands ........B-59 character .......... B-28 Print Commands ........B-59 character strings ....... B-24 Print Key ..........3-36 indexed ..........
- Page 533 824 Reference Manual Renaming an Existing Setup ....9-15 Selecting a Data set to view ....9-27 Repeat Count .......... 10-13 Selecting a Measurement Setup ..... 2-5 Reset Key ..........3-9 Selecting a VIEW ........2-11 Resolution ..........7-27 Selecting IDs .......... 4-10 Retrieving setups from the 824 ....
- Page 534 Storing Setups to the 824 ......9-9 Trigger Settings Menu ......10-10 System ............ 1-7 Trigger Setup .......... 10-24 1-11 Trigger Source ........10-8 System 824 ..........1-7 Trigger Status ......... 10-23 System Diagram ........1-10 Trigger Time .......... 10-10 1-11 Trigger Views ......... 10-22 System Settings ........
- Page 535 824 Reference Manual 10-8 time ..........D-19 Weighting Setting ........7-6 time weighted average ..... D-19 Windows printer ........9-30 Types of History ........B-46 Write Enable ........... 3-16 Write Protect .......... 3-16 Write-protected IDs ........ 4-13 Understanding SLM Displays ....6-4 Unpacking and Inspection ......
- Page 536 824 Reference Manual...
Need help?
Do you have a question about the System 824 and is the answer not in the manual?
Questions and answers