Keysight N9912A User Manual
Fieldfox analyzer
Hide thumbs
Also See for N9912A:
- Service manual (135 pages) ,
- User manual (344 pages) ,
- Service manual (147 pages)
Table of Contents
Advertisement
Quick Links
Advertisement
Chapters
Table of Contents

Related Manuals for Keysight N9912A


Summary of Contents for Keysight N9912A
- Page 1 User’s Guide Keysight N9912A FieldFox Analyzer...
- Page 2 Keysight shall not be liable for errors or for incidental or consequential damages in connection with the furnishing, use, or performance of this document or any information contained herein.
- Page 3 Elements of this product's Software use SharpZipLib as an "as provided" stand alone capability. Copyright 2004 John Reilly This program is free software; you can redistribute it and/or modify it under the terms of the GNU General Public License as published by the Free Software Foundation;...
-
Page 4: Table Of Contents
A.07.75 Firmware Release Updates ..........7 Overview ..................8 Options and Features ............... 8 Accessories ..................9 FieldFox Manuals, Software, and Supplemental Help ..... 10 Preparing for Initial Use of Your New FieldFox ......11 Check the Shipment ............... 11 Meeting Power Requirements for the AC/DC Adapter ... 11 Install the Lithium-Ion Battery ............. - Page 5 SA (Spectrum Analyzer) Mode ..........67 SA Mode Settings ................68 Channel Measurements ..............93 Interference Analyzer (SA Mode) - Option 236 ..... 102 Spectrogram and Waterfall Displays......... 102 Record Playback ................106 Channel Power Meter Mode - Option 311......114 CPM Settings ................
- Page 6 Volume Control ................172 Display Settings ................172 Preferences..................174 System Configuration ..............177 Service Diagnostics ..............183 Working with the Lithium-Ion Battery ........185 Viewing Battery Charge Status ..........185 Charging the Battery ..............186 Reconditioning the Battery ............188 Battery Care ...................
-
Page 7: A.07.75 Firmware Release Updates
A.07.75 Firmware Release Updates For customers upgrading FieldFox firmware, the following is a list of changes from the previous release: NA Mode Big Marker Display States ........50 VVM Mode VVM 180° Short Phase Offset ......144 All Modes (System) Update/Set Time using Internet ...... -
Page 8: Overview
No Power Meter required Power Meter Mode (Option 302) Power Meter Mode on page 114 Use with Keysight External USB Power Sensors Network Analyzer (NA) Mode (Option 303) NA Mode on page 38 ▪ 2 MHz to 4 GHz (Option 104) ▪... -
Page 9: Accessories
▪ Easily manage files and compile reports ▪ Reads data from the FieldFox and plots traces ▪ Help file included with the software installation ▪ Download the latest version of the software at http://www.keysight.com/find/fieldfox Additional Features Languages on page 174 ▪ Menus localized to 7 languages Accessories The following accessories are included with every FieldFox. -
Page 10: Fieldfox Manuals, Software, And Supplemental Help
To see a complete list of accessories that are available for the FieldFox, please visit: http://www.keysight.com/find/fieldfox FieldFox Manuals, Software, and Supplemental Help The following manuals and software are available for the FieldFox. For the very latest versions, please visit the FieldFox support website www.keysight.com/find/fieldfoxsupport. -
Page 11: Preparing For Initial Use Of Your New Fieldfox
2. Carefully remove the contents from the shipping container, and verify that the standard accessories and your ordered options are included in the shipment according to the Box Contents List. 3. For any question or problems, refer to Contacting Keysight on page 2. Meeting Power Requirements for the AC/DC Adapter Voltage:... -
Page 12: Install The Lithium-Ion Battery
Install the Lithium-Ion Battery Step Notes 1. Open the battery door. Push the button on the battery compartment door while sliding the door outward. 2. Insert the battery. The terminals end of the battery is inserted into the compartment. 3. Close the battery door. Slide the battery compartment door upwards until it latches. -
Page 13: Fieldfox On/Off Settings
To conserve battery power: Use Run/Hold to single-trigger a measurement when needed. is shown on Hold the display. Press System then then Brightness. Use the ▲|▼ arrows, the rotary Display knob, or numeric keypad to adjust the brightness to dim the FieldFox display as much as possible. -
Page 14: Avoid Overpowering The Fieldfox
NOTE Do NOT store the FieldFox in the softcase while powered ON or in Stand By mode. How to monitor the internal FieldFox temperature: Press System, then Service Diagnostics. Then Internal Temperatures. The temperature at which the following events occur is the average of the RF1, RF2, SB1, SB2 temperatures. -
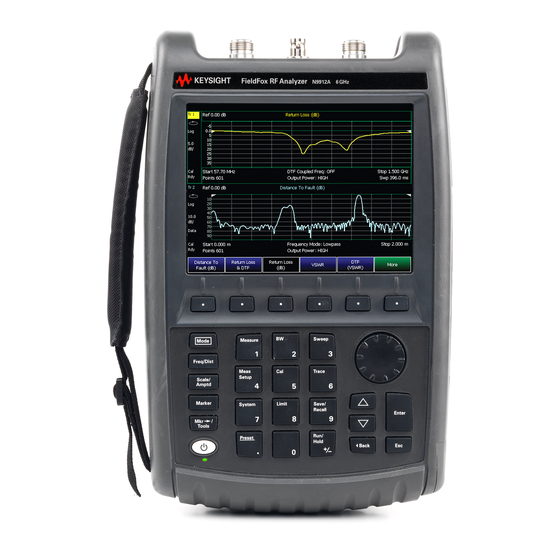
Page 15: Take The Fieldfox Tour
Take the FieldFox Tour Front Panel Preparing for Initial Use of Your New FieldFox... - Page 16 Front Panel Caption Description Learn More on Page: Power ON: press momentarily. STAND BY: with FieldFox power ON, press briefly. OFF: press and hold until the FieldFox shuts off (about 4 seconds). Not lit: FieldFox OFF, not charging Green: FieldFox ON. Charging status indicated by battery icon on screen Orange, flashing: FieldFox STAND BY Orange, intensity increasing, flashing slowly: FieldFox OFF, charging...
- Page 17 Ethernet cable connector to read trace data using the FieldFox Data Link Software. Download the latest version of the software at http://www.keysight.com/find/fieldfox Reserved for future use. DC power connector used to connect to the AC/DC adapter. Maximum: 19 On page 12 VDC, 4 ADC.
- Page 18 Screen Tour Caption Description Learn More on Page: Title – write your own text here Current Mode Run / Hold Display Format Mode dependent Scale/division Mode dependent Calibration Status (CAT and NA) Detection Method (SA) Velocity Factor (Fault Meas) Averaging Status and Count Mode dependent Data / Mem Display (CAT and NA) 159- Trace Math...
-
Page 19: How To Enter Numeric Values
How to Enter Numeric Values Many settings on the FieldFox require the entry of numeric values. How to enter numeric values Use any combination of the following keys: Numeric 0–9 keys, along with the polarity ( +/- ) key. ... -
Page 20: Cat (Cable And Antenna Test) Mode
This process is sometimes referred to as Line Sweeping. CAT Mode is similar to NA (Network Analyzer) Mode. Learn more in the Supplemental Online Help: http://na.support.keysight.com/fieldfox/help/FieldFox.htm CAT Mode Distance to Fault measurements are discussed on page 30. In this Chapter Measurement Selection ........ -
Page 21: Cat Mode Settings
Measurement Selection How to select a CAT Mode Measurement Learn more about the following measurements in the Supplemental Online Help: http://na.support.keysight.com/fieldfox/help/FieldFox.htm Press Measure 1. Then choose one of the following: These softkeys also appear after CAT Mode is selected. -
Page 22: Quick Settings
Quick Settings Table Both CAT and NA Modes allow you to view and change most relevant settings from a single location. All of these settings are discussed in this chapter and, unless otherwise noted, ALL of these settings can also be made using the standard softkey menus. -
Page 23: Scale Settings
After using the ▲|▼ arrows or the rotary knob, press Enter. The amount of frequency increment is based on the current span and can NOT be changed in CAT Mode. Scale Settings Adjust the Y-axis scale to see the relevant portions of the data trace. The Y-axis is divided into 10 graticules. -
Page 24: Resolution
101 | 201 | 401 | 601 | 801 | 1001 |1601 | 4001 | 10001 Using SCPI, Resolution can be set to any number of points between 3 and 10001. See the Programming Guide at www.keysight.com/find/fieldsfoxsupport FieldFox User’s Guide... -
Page 25: Sweep Time
Swp Time setting to slow the sweep time when measuring long lengths of cable. Learn more in the Supplemental Online Help: http://na.support.keysight.com/fieldfox/help/FieldFox.htm The actual sweep time is shown on the FieldFox screen. See the Screen Tour on page 18. To increase the sweep time, enter a value that is higher than the actual sweep time. -
Page 26: Return Loss Measurements
Interference Rejection Use this setting when you suspect that other signals in the area are interfering with a measurement. Interference may look like a spike or lack of stability in the measurement trace. While monitoring a measurement at a specific frequency, toggle this setting between ON and OFF. -
Page 27: 1-Port Cable Loss Measurements
Min Swp trace is visible on the screen. The amount of time that is required increases with longer cable lengths. Learn more in the Supplemental Online Help: http://na.support.keysight.com/fieldfox/help/FieldFox.htm 6. Remove the cable to be tested. CAT (Cable and Antenna Test) Mode... -
Page 28: 2-Port Insertion Loss Measurements
7. Press Cal 5, then or OSL. QuickCal 8. Follow the prompts to perform calibration at the end of the jumper cable or adapter. Learn more about Calibration on page 61. 9. Connect the cable to be tested. NOTE Low-level standing waves (also known as ‘ripple’) which may be visible in reflection measurements, can hide the actual loss of the cable. - Page 29 6. Connect the DUT and view the insertion loss measurement results. When measuring very long lengths of cable, it may be necessary to increase the sweep time. Learn how on page 25. Learn why in the Supplemental Online Help: http://na.support.keysight.com/fieldfox/help/FieldFox.htm CAT (Cable and Antenna Test) Mode...
-
Page 30: Dtf (Distance To Fault) Measurements
DTF (Distance to Fault) Measurements CAT Mode Distance to Fault (DTF) measurements are generally used to locate problems, or faults, in a length of cable or transmission line. In this chapter, the cable to be tested is referred to as the DUT (Device Under Test). Settings that are NOT unique to DTF measurements are documented in the CAT Mode chapter on page 20. -
Page 31: Dtf Measurement Settings
Faults are displayed on the Y-axis in return loss format, Distance to Fault (dB) expressed as a positive number in dB. Faults are displayed on the Y-axis in SWR. Learn more about DTF (VSWR) SWR at the FieldFox Supplemental Online Help: http://na.support.keysight.com/fieldfox/help/FieldFox.htm DTF (Distance to Fault) Measurements... - Page 32 then Faults are displayed on the Y-axis in linear (unitless) More DTF Lin format. DTF Start and Stop Distance In DTF measurements, you set the physical length of cable or other device to be tested. The FieldFox calculates the frequency range of the measurement from this distance.
- Page 33 Then and type the start frequency to use for the DTF Min Start Freq measurement. Then and type the stop frequency to use for the DTF Max Stop Freq measurement. OR Press More Then and type the frequency range to use for the DTF Max Freq Span measurement.
- Page 34 You can edit these files or create new cable files using the following procedure or using the FieldFox Data Link Software. Learn more at: www.keysight.com/find/fieldsfoxsupport The Cable correction data survives a Mode Preset and Preset. With a DTF measurement present: ...
- Page 35 Quickly scrolls through pages of Freq/Loss data. Previous / Next Page Add a blank Freq/Loss pair to the table, Add Data then: Delete/Clear Remove the selected Freq/Loss pair from the table. Delete Line then Remove all Freq/Loss pairs from the table and resets Clear All header information to default settings.
- Page 36 Window Settings Window settings provide the ability to choose between optimizing DTF measurements for resolving closely-spaced faults or for the ability to measure low- level faults. How to select Window settings Press Meas Setup 4. Then Settings. Then press ▲|▼ arrows to move to the Window row. ...
- Page 37 Points = resolution Bandwidth = frequency range Alias-free Range (On/Off) On = No Alias images Off = Alias images may appear in the response. About Alias Faults An alias fault is not a true device response. An alias fault appears because of the method used to convert frequency to time.
-
Page 38: Na (Network Analyzer) Mode
NA (Network Analyzer) Mode Learn more about NA Mode measurements in the FieldFox Supplemental Online Help: http://na.support.keysight.com/fieldfox/help/FieldFox.htm In this Chapter Measurement Selection ........39 Parameter Conversion .......... 39 Quick Settings ............41 Calibration Settings ..........41 Format ..............42 Frequency Range ..........42 Scale Settings ............ - Page 39 +5 dBm (High power) and -25 dBm (Low power). Learn more about raw receiver measurements in the FieldFox Supplemental Online Help: http://na.support.keysight.com/fieldfox/help/FieldFox.htm Parameter Conversion In NA Mode ONLY, converts the active S-parameter trace to an equivalent impedance (Z), admittance (Y), or reciprocal 1/S-parameter.
- Page 40 Multi-Trace Configurations In NA Mode you can display multiple traces on the FieldFox screen. A 3-trace configuration. Tr2 is the ACTIVE trace as indicated by the highlighted Tr 2 Trace Setting Notes The Frequency Range, IF BW, Resolution, Average, and Output Power settings are common for all displayed traces.
- Page 41 NA Mode has a page specifically for making settings that pertain to Port Extensions, including Velocity Factor and Media Type. Learn more about Port Extensions on page 48. NOTE The N9912A does NOT support Media Type: Waveguide. How to view and change Calibration Settings Press Meas Setup 4. Then...
- Page 42 Learn more about Display Formats in the FieldFox Supplemental Online Help: http://na.support.keysight.com/fieldfox/help/FieldFox.htm The marker onscreen readout can be changed to formats other than the display format. Learn how to set marker format on page 151.
- Page 43 Press Freq/Dist Then choose from the following: frequencies – Specify the beginning and end of the sweep. Start Stop frequencies - Specify the center frequency and span of Center Span frequencies (half on either side of center). Follow each by entering a value using the numeric keypad, the ▲|▼ arrows, or the rotary knob.
- Page 44 You can set the electrical delay independently for each measurement trace. To apply an electrical delay to all measurement traces, use Port Extensions. Learn how on page 48. Phase is available only with S11 measurements – NOT S21. Learn how to set Phase formats on page 41. How to set Electrical Delay ...
- Page 45 How to set Averaging Press BW 2. Then where <n> is the number of measurements to average. Average <n> Enter a value using the numeric keypad. Enter 1 for NO averaging. Press Enter. Then Choose from the following: Average Mode Sweep - Each data point is based on the average of the same data point being measured over <n>...
- Page 46 10001. Using SCPI, Resolution can be set to ANY number of points between 3 and 10001. See the Programming Guide at www.keysight.com/find/fieldsfoxsupport Sweep Time The fastest possible sweep time is always used as the default setting. Use the Min Swp Time setting to slow the sweep time when measuring long lengths of cable.
- Page 47 To accurately view data presented in Smith Chart format, first set the System Impedance. Learn how to select Smith Chart format on page 41. Learn how to make 75Ω measurements at the FieldFox Supplemental Online Help: http://na.support.keysight.com/fieldfox/help/FieldFox.htm How to set System Impedance Press Meas Setup 4. NA (Network Analyzer) Mode...
- Page 48 Then Settings. Then scroll to System Z0 and press Edit Then type either 50 or 75 and press Enter Port Extensions Port extensions allow you to electrically move the calibration reference plane on port 1 after you have performed a calibration. Phase measurements, and therefore Port Extensions, are NOT available on port 2.
- Page 49 5. Connect the DUT and view the transmission measurement results. When measuring very long lengths of cable, it may be necessary to increase the sweep time. Learn how on page 25. Learn why at the FieldFox Supplemental Online Help: http://na.support.keysight.com/fieldfox/help/FieldFox.htm NA (Network Analyzer) Mode...
- Page 50 Big Marker Display States (A and B) This feature, available ONLY in NA Mode, allows you to view up to three Big or Super Big marker readouts. This is done by using up to two different display states called A and B.
- Page 51 Notes: To move a marker, press Marker, then Marker, then scroll to the marker number to be moved. The new marker position can NOT be saved with the A or B display state. Settings that are NOT listed above are NOT affected by the recalled display states. ...
-
Page 52: Time Domain - Option 010
Time Domain - Option 010 With NA Mode, Time Domain (Opt 010), frequency information is used to calculate and display measurements with time as the horizontal display axis. The response values appear separated in time allowing a different perspective of the test device's performance and limitations. -
Page 53: Time Domain (Transform) Settings
Markers that are created on a Time Domain trace can be used to pinpoint the distance of the mismatch from the reference plane. For more information on Time Domain theory, see http://literature.cdn.keysight.com/litweb/pdf/5989-5723EN.pdf Time Domain (Transform) Settings You can set and view most of the Time Domain settings on the Transform Settings table. -
Page 54: Frequency Range And Points
Frequency Range and Points Like CAT mode, all Time Domain measurements are made in the frequency domain and, using Inverse Fourier Transform (IFT), time is calculated. Select the frequency range from which Time Domain measurements are calculated. Increasing the data points will improve measurement resolution. -
Page 55: Distance Units
NOTE Zero (0) seconds is always the calibration reference plane. Negative values are useful if moving the reference plane. Distance Units When markers are present on a Time Domain trace, marker X-axis values are shown both in units of time (seconds) and distance. Select the units in which the marker distance data is presented. -
Page 56: Trace Settings
Standard – The normal FieldFox data processing chain. Transform calculations are performed AFTER error correction and trace math. 8510 – The data processing chain used by the Keysight 8510 network analyzer. Transform calculations are performed BEFORE error correction and trace math. -
Page 57: Gating
Transform Enable Enable Time Domain transform for the specific trace. Select the trace. Press Measure 4 Then Transform Then choose from: Trace displays Time Domain data. Trace displays frequency domain data. Gate Enable Enable Gating for the specific trace. ... -
Page 58: Start, Stop, Center, And Span Gate Times
Start, Stop, Center, and Span Gate Times These settings specify the time in the trace to be gated (in or out). The gate times can be specified using either Start and Stop or Center and Span. Press Gating Start/Stop ... - Page 59 Minimum gate span is twice the cutoff time. Each gate shape has a minimum recommended gate span for proper operation. This is a consequence of the finite cutoff rate of the gate. If you specify a gate span that is smaller than the minimum span, the response will show the following effects: ...
-
Page 60: Calibration For Cat, Na, And Vvm Modes
Save a Calibration ..........65 Verify Calibration ..........65 Calibration Method Summary ......66 NOTE ECal and Waveguide Calibrations are NOT supported on the N9912A. See Also Making 75 ohm Measurements at the FieldFox Supplemental Online Help: http://na.support.keysight.com/fieldfox/help/FieldFox.htm Why and When to Calibrate There are well-defined and understood systematic errors that are measured and calculated during the calibration process. -
Page 61: Preset Calibration
OPEN, SHORT, and LOAD are calibration standards. These are precision components that are used during calibration and to terminate a DUT during some measurements. When an RF signal ‘hits’ these components, the signals are reflected in a predictable manner. A SHORT and OPEN standard both cause 100% of an RF signal to be reflected. The difference between these two standards is what happens to the phase of the reflected signal, which is beyond the scope of this discussion. -
Page 62: O,S,L Calibration
Several Cal Kit definitions are built into the FieldFox firmware. NOTE Visit www.keysight.com/find/fieldfoxsupport to see a complete list of supported Cal Kits. Also at this website, download DataLink software that allows you to edit Cal Kit definitions or add a new Cal Kit. -
Page 63: Normalize
is shown on the screen when an O,S,L Cal is correcting the CAL ON U measurement. How to perform O,S,L Cal Before performing an O,S,L Cal, set the Measurement type, Frequency Range, Power Level, and Resolution of the measurement. The calibration will remain highly accurate until these settings change, or the physical connection to the FieldFox changes. - Page 64 Connect a short, high-quality, phase stable cable between the FieldFox RF OUT and RF IN connectors. NOTE All subsequent insertion loss measurements are made relative to the insertion loss of this cable. For example, if you use a Normalization cable with 1 dB of loss, then after pressing Normalize, the display will show 0 dB of loss with this cable in place.
-
Page 65: Verifying Calibration And Jumper Cable Integrity
Cal ON ? – Questionable Accuracy If a change made by the user to the output power setting, or a change made automatically by the FieldFox firmware makes accurate calibration interpolation questionable, a question mark is added to the screen annotation for all calibration states (Ex: ?). -
Page 66: Calibration Method Summary
Observe the trace on the FieldFox screen: Lower than 0 dB indicates a GOOD calibration. Higher than 0 dB indicates that you should recalibrate. Verifying Phase Accuracy Connect a LOAD standard at the calibration reference plane (where calibration standards were connected). - Page 67 General purpose Spectrum Analyzer measurements are available with Option 230 or 231. SA measurements require NO calibration. For a comprehensive SA Mode tutorial, see Spectrum Analysis Basics (App Note 150) http://literature.cdn.keysight.com/litweb/pdf/5952-0292.pdf SA display with markers arrier with 5 kHz frequency modulation and deviation of 1 kHz In this Chapter Frequency Range ..........
-
Page 68: Frequency Range
Triggering .............. 85 Single/Continuous/Restart ........85 Points ..............87 Trace Display States ..........87 Average Type ............88 Average Count ............88 Detection Method ..........89 Display Line ............90 Noise Marker ............90 Band/Interval Power Marker ........ 91 Frequency Counter at Marker ......92 Audio Beep at Marker Power ........ - Page 69 The frequency range of the measurement can be changed using the following methods: Set Center and Span frequencies Set Start and Stop frequencies Toggle between Zero and Last selected span Set Full Span of the FieldFox ...
-
Page 70: Radio Standard
Beginning with Rev A.05.50, your own custom Radio Standards can be imported into the FieldFox. Custom standards are created in *.csv (spreadsheet) format. A template and instructions for creating your custom Radio Standard is at: http://na.support.keysight.com/fieldfox/help/SupHelp/Reference/CustomRadioStan dard.htm Once imported, the *.csv file is stored in the FieldFox \User Data\ folder. The custom Radio Standards are read and presented at the top of the list of internal Radio Standards. -
Page 71: Channel Selection
Then select the *.csv file to delete using the ▲|▼ arrows or rotary knob and press Enter. Note: To overwrite a custom standard that is already uploaded to the FieldFox, you must first delete the *.csv file from the FieldFox, then re-upload the file that contains the standard. -
Page 72: Scale And Units
Channel number X-axis annotation Dn indicates Downlink frequencies. Up (not shown) indicates Uplink frequencies (−) indicates that the lowest frequency in the channel (128) is at the left edge of the screen. (+) indicates that the highest frequency in the channel (130) is at the right edge of the screen. -
Page 73: External Gain
Manually adjust the scale per division to view specific areas of the current Scale trace. Enter a value using the numeric keypad, the ▲|▼ arrows, or the rotary knob. Then press Enter. Manually set the value of the reference line. Enter a negative value by Ref Level pressing Run/Hold (+/-) either before or after typing a value. -
Page 74: Check For Compressed Measurements
When too much power is present at the RF IN port, appears on ADC Over Range the FieldFox screen. This does not necessarily mean that damage has occurred, but that the measurement is probably compressed. When high power levels are present at the RF IN connector, internal attenuation can be switched in to keep the FieldFox receiver from compressing. -
Page 75: Field Strength Measurements
How to Check for a Compressed Measurement Using a marker at the signal peak, make note of the signal power level. Increase the RF Attenuation level by 5 dB. If the signal level does NOT change, then NO compression exists. This indicates that the signal is in the linear region of the FieldFox receiver. - Page 76 Turn ON and OFF correction for all settings Apply Corrections ON OFF Turn ON and OFF Antenna correction. Antenna ON OFF Recall or edit an Antenna Correction table. See Edit/Save/Recall Antennas below. Turn ON and OFF Cable correction. Cable ON OFF Recall or edit a Cable Correction table.
- Page 77 The FieldFox can also read *.ANT (Antenna) files that were created from older Keysight Spectrum Analyzers. Data Link does NOT support the SA Mode cable or antenna (*.csv or *.ANT) files.
-
Page 78: Tune And Listen
How to create a Cable file from an S21 (NA mode) measurement 1. Measure the S21 of a cable. Learn how in NA Mode on page 49. 2. Use Manage Folders to change the active folder to CABLES. Learn how to manage folders on page 166. - Page 79 Tune Frequency The Tune & Listen tuner is separate from the SA display. This allows you to listen to one frequency while displaying a different range of frequencies. Set the Tune Frequency using one of three methods: 1. Selecting Preset, Mode Preset, or Meas Preset sets Tune Frequency to 3.0 GHz. 2.
- Page 80 Independent Source/Tracking Generator A tracking generator, a popular option with Spectrum Analyzers, is a source which always tracks the SA receiver. Like a traditional tracking generator, the Independent Source feature can set the internal FieldFox source to track the SA receiver frequency range. It can also set the internal source to a CW frequency that is independent of the SA frequency.
-
Page 81: Resolution Bandwidth
Then Battery Saver OFF Resolution Bandwidth (Res BW) In SA Mode, the Res BW provides the ability to resolve, or see closely spaced signals. The narrower (lower) the Res BW, the better the spectrum analyzer can resolve signals. In addition, as the Res BW is narrowed, less noise is measured by the spectrum analyzer ADC and the noise floor on the display lowers as a result. -
Page 82: Sweep Type
(FFT or Step) is displayed in the lower-left corner of the FieldFox screen. For a more comprehensive tutorial, see Spectrum Analysis Basics (App Note 150) at http://literature.cdn.keysight.com/litweb/pdf/5952-0292.pdf How to set Sweep Type Press BW 2. -
Page 83: Very Long Sweep Times
Measurement speed specifications do NOT apply in Temperature Control Mode. Learn more on page 14. Learn more about SA mode SwpAcquisition time in the Supplemental Online Help: http://na.support.keysight.com/fieldfox/help/FieldFox.htm Very Long Sweep Times Two primary settings are responsible for the sweep time: Res BW and SwAcquisition. -
Page 84: Zero Span Measurements
When the sweep time exceeds 4000 seconds (about 1 hour), Meas UNCAL annotated on the screen. Accuracy cannot be guaranteed. Zero Span Measurements When setting the frequency span to Zero, there is NO spectrum of frequencies to display, so the X-axis units becomes Time. The SA becomes like a tunable oscilloscope, with the center frequency being the frequency of interest. -
Page 85: Triggering
Res BW is less than or equal to 200 kHz. FFT Gating is available for non-zero span measurements. Learn more about FFT Gating at: www.keysight.com/find/fieldsfoxsupportFieldFox.htm NOTE The following Trigger Settings are available ONLY when performing an FFT sweep or when in Zero Span. -
Page 86: Single/Continuous/Restart
Then Trigger Settings Then Trig Delay Enter a value using the numeric keypad, the ▲|▼ arrows, or the rotary knob. Then select a multiplier key or press Enter. Learn about multiplier abbreviations on page 19. Trigger Level Used with Video triggering, an incoming signal with this amplitude or higher (for positive slope) will initiate a sweep. -
Page 87: Points
Causes the SA to make continuous sweeps. This is the typical setting for making measurements. Each Run / Hold +/- press causes the SA to toggle between continuous sweep and Hold. Causes the SA to Hold. Each Run / Hold +/- or press causes Single the SA to make ONE sweep, then Hold. -
Page 88: Average Type
Displays and then holds the last complete measurement trace on the View screen. Displays no trace. Blank Press to return all traces to their default settings: Trace 1 Default All (Clear/Write); all other traces (Blank). NOTE Trace 4 data WILL be overwritten by the FieldFox when using the Independent Source Normalize feature (page 78) or using Field Strength antenna or cable corrections (page 75). -
Page 89: Detection Method
Then Average Count Enter a value from 1 to 10,000 using the numeric keypad, the ▲|▼ arrows, or the rotary knob. Press Enter Detection Method In SA Mode, the X-axis is comprised of data points, also known as “buckets”. The number of data points is specified using the Resolution setting. -
Page 90: Display Line
[NPk] Displays the minimum value of all the measurements in Negative Peak each bucket. [Smp] Displays the center measurement of all the measurements in Sample each bucket. This setting gives a good representation of the random noise in each bucket. However, it does not ensure that all signals are represented. [#RMS] Displays the Root Mean Squared (RMS) average power of all Average the measurements in each bucket. -
Page 91: Band/Interval Power Marker
In addition, when a Noise Marker is displayed, the Detection method is automatically switched to Average and is shown on the FieldFox screen. This occurs only PAvg when Detection is set to Auto. Learn more on page 89. With a Noise Marker present, the Res BW can be changed and the displayed noise floor will also change, but the Noise Marker readout will remain about the same. -
Page 92: Frequency Counter At Marker
Measures power over 5% of the displayed span, or ½ graticules. The Band Auto Span is automatically updated to remain at 5% when you change the frequency span. Enter a frequency or time value using the ▲|▼ arrows or the rotary knob, then press Enter. -
Page 93: Channel Measurements
Then Marker Function Then Audio Beep ON OFF Audio Beep does NOT beep when the FieldFox is in Hold mode. While Audio Beep is ON, press to toggle Audio Beep through the Marker 1 2 3 4 5 6 existing markers. -
Page 94: Channel Power
When you first select a Channel Measurement, then select a Radio Standard, the BW, Offset, RRC, Integration BW, and Span settings are changed to those of the standard. In addition, Res BW can also change when set to ‘Auto(couple)’. However, center frequency is NOT changed unless you first select Units = CHAN. - Page 95 Channel Power measurement; Chan 190 Downlink; GSM850 Radio Standard The following two Channel Power levels are displayed: Channel Power - measures total power over the specified Integrated BW. Power Spectral Density – same measured power, but mathematically normalized to a 1 Hz bandwidth using the same algorithm as Noise Marker.
-
Page 96: Occupied Bandwidth
Enter a value between 100 Hz and 3 GHz using the numeric keypad, ▲|▼ arrows, or the rotary knob. Press Enter Other Channel Power Settings All relevant FieldFox settings are made automatically to ensure the highest accuracy, such as ResBW, VideoBW, and sweep (SwpAcquisition) speed. These, and all other SA Mode settings, can be changed manually in a Channel Power measurement. -
Page 97: Adjacent Channel Power Ratio
Frequency Span Occupied BW is calculated from power that is measured over the entire displayed Frequency Span. The frequency span can be entered using arbitrary frequencies or by using a Radio Standard in conjunction with channel numbers. Learn how to select a Radio Standard and channels on page 70. - Page 98 GSM 850-Ch 251-Up with one Offset. Freqs (Mhz) added to illustrate Offset and Integ BW. Data in the ACPR graphical chart is always presented in dBm for the carrier, and dBc (dB below the carrier) for the offsets. This can NOT be changed. Use the Meas Type setting (next page) to change how the data is presented in the table below the graph.
- Page 99 Integration Bandwidth The Integration Bandwidth of the carrier and offsets is the frequency span over which power is measured. To change Integration Bandwidth: Press Meas Setup 4 Then Integrating BW Enter a value between 100 Hz and 100 MHz using the numeric keypad, ▲|▼ arrows, or the rotary knob.
- Page 100 Press Meas Setup 4. Then More Then Meas Type Then choose from the following: – Integrated carrier power is represented in dBm, and relative Total Pwr Ref powers between offsets and carrier are represented as dBc (dB below the carrier).
- Page 101 Press Meas Setup 4 Then RRC Weighting ON OFF Then More Then RRC Alpha [current setting] Enter a value between 0 (no smoothing) and 1 (most smoothing) using the numeric keypad, ▲|▼ arrows, or the rotary knob. A standard level of filtering is .22. ...
-
Page 102: Interference Analyzer (Opt 236) Spectrogram Display
Interference Analyzer (SA Mode) - Option 236 Option 236 provides Spectrogram display, Waterfall display, and Record/Playback. . In this Chapter Spectrogram and Waterfall Displays ....102 Spectrogram Display ........102 Common Waterfall and Spectrogram Settings104 Waterfall Display..........105 Record Playback ..........106 About Sessions .......... - Page 103 Spectrogram display- Overlay view- with time markers 23 seconds apart. The following settings all contribute to the sweep time of an individual trace, and therefore, the total elapsed time that can appear on the screen in Spectrogram display: Frequency Range. Learn more on page 68. ...
- Page 104 How to Restart the Spectrogram Press Sweep 3 then Restart Averaging Averaging can be enabled on the underlying measurement. Press Meas 4 then Type. Learn more on page 87. Average Common Settings for Waterfall and Spectrogram Set Red and Blue Limits The colors displayed on the Waterfall and Spectrogram represent the various measured power levels: ...
-
Page 105: Waterfall Display
An invalid (very large number) appears when a trace record is not available at one or both of these markers. How to Restart the Spectrogram Press Sweep 3 then Restart Averaging Averaging can be enabled on the underlying measurement. Press Trace 6 then [Average]. -
Page 106: Record / Playback
Waterfall Angle This setting allows you to show more or less detail. More detail provides fewer (time) records. Press Meas Setup 4 Then Spectrogram Settings Then Waterfall Angle Then choose from the following: Compromise between detail and number of records. Moderate Least detail with highest number of records. -
Page 107: About State And User Tags
When a session is opened or a new session is initiated, an estimate is made of the maximum number of traces that can be saved, based on the available disk space and the current number of data points (resolution). Recording will stop when that number is reached. -
Page 108: How To Record A Session
Frequency Counter at Marker is NOT allowed during Recording or Playback. Learn about this feature on page 92. About State and User Tags When any of the State settings (listed above) are changed during a recording, a ‘state tag’ is inserted at the first trace number to be recorded with the new setting. In addition, you can insert a ‘User Tag’... -
Page 109: How To Playback A Session
Then Recorder Player Then Record is displayed in the left of screen graticules. During recording, choose from the following: Temporarily halts recording until pressed again. The incoming Pause Resume trace continues to sweep. Press again to continue recording. Immediately stops recording. - Page 110 Press Trace 6 Then Record Playback Setup Then an existing session. New Session Recall Then Recording Configuration Then choose from the following: Sets the amount of time to record traces. Default is MAX, which Record Time is to record indefinitely.
- Page 111 When used with Record Interval, a trace is recorded when a limit is exceeded, then no recordings during the specified ‘wait’ interval, then the next trace is recorded, followed by another time delay, and so forth. This pattern repeats indefinitely if Segment Count is OFF, or (if ON) until Segment Count is reached. Frequency Mask Trigger Configuration Create or recall a Frequency Mask to be used with the FreqMaskTrigger feature.
-
Page 112: Playback Configuration
Data can be recorded from Traces 1,2,3, or 4 which includes the trace state (Max Hold, Min Hold, and so forth. Recording from a Clear/Write trace yields exactly the same data as recording from the Raw Meas block. ... -
Page 113: Record Playback Example
Copies the selected session to a different storage device, or the same Copy storage device with ‘Copy_’ appended to the beginning of the name. Copies ALL of the listed sessions to a different storage device, or the Copy All same storage device with ‘Copy_’ appended to the beginning of the names. Record Playback Example The following “Interval Recording”... - Page 114 Channel Power Meter Mode - Option 311 Channel Power Meter (also known as CPM or Built-in Power Meter) uses the RF IN connector to make quick and simple power measurements over a selectable frequency span. A power sensor is NOT required. In this Chapter Set Frequency/Span ...........
-
Page 115: Set Frequency/Span
Please observe the RF IN port damage level. CAUTION +27 dBm (320 mW) average +33 dBm peak (2 W) <10μs +50 V Frequency/ Span / Step Valid CPM measurements can be made over the entire frequency range of the FieldFox. Although it is possible to enter a center frequency below the FieldFox minimum frequency, the LO feed-thru of the internal SA hardware will invalidate these Built-in Power Meter measurements. -
Page 116: Attenuation
Attenuation The Attenuation setting controls the power level into the FieldFox. To compare CPM measurements to SA Channel Power measurements, use the same attenuation settings. Built-in Power Meter Mode defaults to 30 dB attenuation, while SA mode defaults to 10 dB attention. In CPM Mode, the attenuation setting is NOT annotated on the screen. -
Page 117: See Also
Set Limits ............122 See Also Frequency Offset using Power Sensor ....123 Supported Power Sensors For a complete list of supported Keysight USB Power Sensors, please visit: www.keysight.com/find/usbsensorsforfieldfox NOTE The FieldFox does NOT support the following Keysight USB Power Sensor features: External Triggering (Time Gated Burst Power Measurement), Power Sweep Operation, and Frequency Sweep Operation. -
Page 118: How To Connect The Power Sensor
Zeroing The Keysight USB Power Sensors perform Internal Zeroing automatically. Because Keysight USB Power Sensors have an internal switch, Internal Zeroing does NOT require that the power source be turned OFF. For highest measurement accuracy, when measuring power levels below –30 dBm, External Zeroing should be performed. -
Page 119: Learn More About These Settings: Set Scale
NO warning is shown. Frequency A table of correction factors versus frequency is stored within the Keysight U2000 Series Power Sensors. The frequency of the power to be measured is entered in the FieldFox so that the appropriate correction factor can be used. -
Page 120: Set Relative And Offset Power
Turn ON the internal source Turn OFF the internal source Optionally set the power level. Press (0.0 dBm default setting) Set output power to an arbitrary Src Nom Power value at the displayed CW frequency. Then enter a value using the numeric keypad, the ▲|▼ arrows, or the rotary knob. ... -
Page 121: Set Display Units
When switched to ON, the FieldFox measures and stores the Relative On Off current power level. Subsequent power measurements display a power level which is relative to the stored value. When relative is ON, the units change from dBm to dB or from Watts to %. Toggles ON and OFF the displayed power level using the Offset Offset On Off value. -
Page 122: Single/Continuous
Sets the number of Power Meter readings to be averaged Num Averages before a valid reading is displayed. When a number is entered, Averaging is automatically set to Man. Single or Continuous Measure This setting determines whether the FieldFox measures continuously or only once each time the button is pressed. -
Page 123: See Also
FOPS is accessed through (and requires) Option 302 USB Power Meter Mode. With both options installed, you can send a signal with the FieldFox internal source at one frequency, and measure this signal with a Keysight U-Series USB Power Sensor at another frequency. -
Page 124: Overview
How to select Power Meter (USB Sensor) Press Mode Then Power Meter (USB Sensor) Then connect a USB Power Sensor to either FieldFox USB port. For a complete list of supported Keysight USB Power Sensors, please visit: www.keysight.com/find/usbsensorsforfieldfox FieldFox User’s Guide... -
Page 125: Measurement Selection
Sweep Type and Frequency Set the source and receiver frequencies for the FOPS measurements. The receiver is a Keysight U-Series Power Sensor. These are broadband measurement devices, which means that they measure power over a very wide frequency range. Tables of frequency and power correction factors are stored within the power sensors. - Page 126 NOTE To make swept FOPS measurements at a single frequency, choose Swept, then enter a Src Center frequency, then Span = 0 Hz. Used to make swept FOPS measurements. Swept Then enter source (Src) frequencies as either Center and Span or Start and Stop.
-
Page 127: Power Sensor Settling
Positive Offset, RxSwp = (Offs - Src) Src = 2 GHz to 3 GHz Offset = 3.8 GHz Rx = 1.800 GHz to 800 MHz Positive Offset, RxSwp = (Offs + Src) Src = 2 GHz to 3 GHz Offset = 3.8 GHz Rx = 5.8 GHz to 6.8 GHz Power Sensor Settling The following two settings work together to allow you to choose the right... -
Page 128: Amplitude Markers
Both settings control the number of power Num Points Freq Step Size sensor measurements between the Start and Stop frequencies. Enter one setting and the other will be changed automatically. There must be at least two data points. Specifies a settling time (in seconds) after the internal source steps ... - Page 129 Pulse Measurements Mode - Option 330 Pulsed power meter measurements, available with Option 330, are made with Keysight U2020 X-Series USB Peak Power Sensors. These sensors are capable of detecting, measuring, and storing data from a train of pulses at the RF input. This data is queried from the USB Power Sensor and displayed on the FieldFox screen.
-
Page 130: Supported Power Sensors
Supported Power Sensors Pulse measurements are made using any of the Keysight U2020 X-Series USB Peak Power Sensors. Zeroing of the U2020 X-Series USB Peak Power Sensors is performed automatically at power up, every 5 seconds, and prior to measuring low level signals. -
Page 131: Frequency / Time
Then choose from the following: Average power (Meter display) Average Peak power (Meter display) Peak Displays the difference between the above two measurements Pk to Avg (Meter display) (default) The primary trace (Tr 1) plots pulse data in amplitude Trace Graph versus time. -
Page 132: Scale
How to make Zoom Window settings Press Trace 6 Then Zoom Window Then choose from the following: Opens the zoom window on the bottom half of the FieldFox screen. The window includes the zoomed trace. Closes the zoom window. While monitoring the within the blue vertical posts on Tr 1, enter ... -
Page 133: Averaging
Averaging Averaging helps to reduce the effects of random noise on a measurement. The more measurements that are averaged, the greater the amount of noise reduction. Averaging is allowed for all pulse measurements. Averaging is performed in the USB Power Sensor before the data is sent to the FieldFox. -
Page 134: Resolution
Automatically sets Continuous OFF and causes the FieldFox to query Single the USB Power Sensor ONCE, then hold for the next Single key press. Hold annotated in the upper left corner of the display. Queries the USB Power Sensor whenever a valid trigger signal is Continuous present. - Page 135 Press Sweep 3 Then Trigger Then Trig Edge Then choose from the following: Acquisition is triggered by the rising (positive) edge of a valid signal. Acquisition is triggered by the falling (negative) edge of a valid signal. Trigger Delay After a valid trigger signal is received at the USB Power Sensor, data acquisition begins after the specified Trigger Delay time PLUS the specified Start time.
-
Page 136: Pulse Timing Diagram
Trig Level = -10 dBm, Trig Type (Int), Pos Slope (/), Delay Pulse Timing Diagram Marker Settings Markers are not allowed with Meter-style measurements. Markers are displayed on Tr 1 and also on the zoom trace if the marker is within the zoom window time span. -
Page 137: Marker Search
Then choose from the following: Amplitude markers are NOT displayed. Amplitude markers ARE displayed at their previous positions. Then Ampl Mkr 1 or 2 Enter a value in dBm for the marker using the numeric keypad, the ▲|▼ arrows, or the rotary knob. -
Page 138: Pulse Top
- Peak minus Difference between the above two results Average - Pulse Top Power value based on the specified Pulse Top setting. - Rise Time The time it takes for a pulse to rise from 10% to 90% of its peak value. - Fall Time The time it takes for a pulse to fall from 90% to 10% of its peak value. -
Page 139: Trace Memory
Trace Memory A memory trace is a pulse measurement Tr 1 data trace (NOT the trace in the Zoom window) that has been stored in the FieldFox volatile memory. It then becomes static, meaning it is not updated with normal pulse measurements. It can be displayed on the screen by itself, or with a pulse trace for comparison purposes. - Page 140 VVM (Vector Voltmeter) Mode – Option 308 VVM Mode measures the electrical length of cables and other devices. The 1-Port Cable Trimming application displays the electrical length in both Magnitude and Phase. The 2-Port Transmission measurement displays Magnitude ONLY. Display for the 1-Port Cable Trimming measurement In this Chapter Overview..............
-
Page 141: Overview
Overview In the FieldFox, both 1-port and 2-port measurement types use a different configuration setup from the HP/Keysight 8508A Vector Voltmeter. Typical 8508A measurement configuration – taken from the 8508A manual. The above block diagram requires an external source and directional coupler to measure the electrical length of a DUT or cable to be trimmed. -
Page 142: Frequency Selection
Frequency Selection VVM measurements are made at a single CW frequency. How to set Frequency NOTE Frequency can be set to 1 Hz resolution. Press Freq/Dist Then Frequency Enter a value using the numeric keypad, the ▲|▼ arrows, or the rotary knob. ... -
Page 143: Averaging
For best measurement accuracy, use the Manual power setting at -15 dBm. After calibration, the power level can be decreased for amplifiers, or increased for higher dynamic range. Caution Power Level settings in this mode will NOT change Power Level settings in other modes. -
Page 144: Vvm Calibration
How to set Single or Continuous Press Sweep 3. Then choose one of the following: Automatically sets Continuous OFF and causes FieldFox to make ONE Single measurement, then hold for the next Single key press. When a data trace is displayed, the entire trace is measured, then holds. - Page 145 The receiver measures incident signal (green line) out of the source. The receiver measures reflected signal (red line) from the end of the DUT (black line). In VVM mode, the display ALWAYS shows ratioed (A/R) measurements which is the electrical length of the DUT.
-
Page 146: 2-Port Transmission Measurement
14. Confirm that magnitude measurement is less than –0.1 dB and the phase is within .1 degrees of the value from step 9. Perform Cable Trimming: 1. Attach the shortest cable to the FieldFox RF OUT connector. This cable is the reference cable. -
Page 147: Optional Settings Markers
Data Analysis Features The following features can be used after a measurement to analyze the results. In this Chapter All about Markers ..........147 About Delta Markers ........148 Marker Table..........149 Coupled Markers .......... 149 Marker Colors ..........150 Marker Trace .......... -
Page 148: About Delta Markers
Then press Enter. How to move a Marker after it is created Press Marker. Then repeatedly until the marker of interest is selected. The OFF, Markers 1...6 Normal, or Delta softkey is black to indicate the current setting of each marker. ... -
Page 149: Marker Table
How to Create a Delta Marker Create a Normal marker and move it to the reference position. Press Delta. The marker becomes the reference marker and fixed in its X-Axis position. Move the Delta marker using the numeric keypad, the ▲|▼ arrows, or the rotary knob. -
Page 150: Marker Colors
Coupled Markers ON allows Marker 1 to be moved on ALL traces at the same time. How to create Uncoupled Markers NOTE Markers are coupled by default. To create markers that are NOT coupled (move independently on each trace): Press Marker ... -
Page 151: Marker Format
Marker Trace (SA Mode) Marker Trace determines the trace number on which a marker resides. A marker is created on, or can later be changed to, the trace number specified by the Marker Trace selection. When changed, a marker moves to the same X-axis location on the specified trace. - Page 152 Mag & Phase 0.705, -73.7° To view other formats, change the trace format, then select Default. Learn how to change format on page 41. Searching with Markers Marker Searches are used to move markers to locations on the trace which exhibits the characteristics of the search criteria.
- Page 153 Negative values search down from the TOP (MAX) of the response. Positive values search up from the BOTTOM (MIN) of the notch. If you first enter Negative, then Positive values, it may be necessary to press Marker, then More, then Markers All Off.
-
Page 154: What Is A 'Peak
Right: Frequency of marker 2 or 3 (to right of marker 1). Press Back to return to the previous menu. Press then choose from the following: Peak Search Moves the active marker to the HIGHEST amplitude data point of the trace. ... -
Page 155: Marker Functions
Minimum amplitude (dB). To be considered valid, the peak Peak Threshold must be above the threshold level. The valley on either side can be below the threshold level. Default = –190 for CAT and NA Modes; –90 for SA Mode. Note: CAT mode Loss measurements are displayed in positive values. -
Page 156: Limit Lines
(SA Mode ONLY) The reference level becomes the magnitude of Mkr->RefLev the active marker. (SA Mode with Tune & Listen ONLY) The Tune & Listen Mkr->Tune Freq Frequency becomes the frequency of the active marker. The following applies to DTF Measurements ONLY: then: More The Start Distance of the measurement becomes the... -
Page 157: Relative Limit Lines
Then Limits. A limit line table appears. Edit Use the Up / Down arrows and rotary knob to navigate the cursor to the following editable cells. Description - Press Edit, then enter a description for the limit line using the FieldFox labeler (learn how on page 162). -
Page 158: Build From Trace
How to Create a Relative Limit Line The easiest way to create a Relative limit line is to create a Fixed Limit at a specific center frequency and reference level. Learn how on page 156. Then change the limit line to Relative. The X/Y data points will be re-calculated relative to the center frequency and reference level. -
Page 159: Trace Math
Audible beep sounds when a sweep fails. On Fail No audible beep sounds. Shows Pass Fail indication on the display with each sweep. Warning On Off Data points that fail are highlighted. Limit Type Shifts the limit line up or down. Enter an offset value using the rotary Offset knob, the ▲|▼... -
Page 160: About Math Operations
How to display data and memory traces Press Trace Then to store the current live trace into memory. A ‘beep’ sounds to Data->Mem confirm the data trace has been saved to memory. There is no display annotation that indicates that the memory trace has been stored. Press to view only the data trace. - Page 161 In the following table, Data/Mem shows both pairs of connectors to have the same 2 dB difference. However, the second pair of connectors have much better S11 performance (–50 and –52) and the relative significance is shown in the Data-Mem values.
-
Page 162: Save Measurement Settings And Results
File Management The FieldFox can save any of the following types of files: Current settings and calibration Trace data (*csv and *.S1P) Picture of the FieldFox screen In addition, files can be saved to the internal memory, a USB Flash drive, or a microSD card. - Page 163 How to use the FieldFox labeler The FieldFox labeler is used to edit or change the current filename. It is also used for many other labeling functions, such as creating a title, prefix, and keyword to display on the FieldFox screen. ...
-
Page 164: Recall Files
Recall Files The FieldFox can recall State files, Trace + State files, and image files. State Files ALL FieldFox instrument settings for ALL Modes are saved and recalled in a *.sta file. If error correction is ON in CAT or NA Mode, then calibration data is also saved and recalled. - Page 165 Data (S1P) / (2P) depending on the active measurement. This file format is used by CAE programs such as Keysight's Microwave Design System (MDS) and Advanced Design System (ADS). It can also be imported into spreadsheet software such as Microsoft Excel.
-
Page 166: Manage Files
Image of header information and three rows of data from a *.csv file saved in SA Mode with 4 traces visible. Column A is always the frequency at which the data is measured. Manage Files Files that are stored in the FieldFox internal memory, microSD card, and USB Flash drive, can be copied to another device or deleted. -
Page 167: Edit Keywords
How to Manage Folders Press Save/Recall 9. Then More. Then Manage Folders. Then choose from the following: Changes the active folder to which files can be saved. The Change Folder active device and current folder is displayed at the top of the screen. Use the ▲|▼... -
Page 168: Prefixes For Filenames
Press to close the labeler without saving changes. Cancel Prefixes for Filenames A prefix is used as a default filename to which characters can be added. The prefix can be customized, and quickly enabled or disabled. When enabled, the current prefix is automatically entered as the start of a filename when performing a Save operation. - Page 169 Then press Save/Recall 9 Then and choose from the following: Print - Confirm that that printer is connected and configured Printer and Page Setup properly. The Status line should read “Ready’. Make other print settings as desired. - Print up to 16 *.PNG images on one page that are ...
-
Page 170: Run/Hold
System Settings In this Chapter Run/Hold ............170 Preset ..............171 User Preset ............171 Volume Control ........... 171 Display Settings ..........171 Brightness ............173 Colors ............. 173 Trace Width ........... 173 Title ..............173 Edit Keywords ..........174 Full Screen Mode .......... -
Page 171: Preset
Hold Hold --> is displayed while a single sweep occurs. How to perform a single sweep while in Hold Press Sweep 3. Then choose one of the following: Automatically sets Continuous OFF (Hold) and causes FieldFox to make Single ONE measurement sweep, then hold for the next Single key press. -
Page 172: Display Settings
Then Preset, then select to confirm. Save User Then User Preset ON How to recall User Preset Press Preset . Then choose from the following: The entire UserPreset.sta file is recalled. ALL modes assume the Preset (User) settings that were in place when the User Preset was saved. -
Page 173: Brightness
NOTE Clean the transflective screen with gentle and minimal wiping using Isopropyl alcohol applied to a lint-free cloth. Display Brightness Change the brightness of the background. How to set Display Colors Press System 7 Then Display Then Brightness ... -
Page 174: Title
Then choose one of the following: - Standard width. Normal - Enhanced width. Wide Title A custom title can be made to appear in the upper-left corner of the FieldFox screen. The title can contain up to approximately 65 alpha-numeric characters. To view the Title area, see the Screen Tour on page 18. -
Page 175: Save And Reset Preferences
How to view and change Preference Quick Settings Press System 7 Then Preferences Then Preferences Press to view all settings. Next Page Previous Page To change a setting: Use the ▲|▼ arrows to highlight a setting. Then press Edit. -
Page 176: Language
Then There is a beep when your settings have been Save Current Settings saved. Press to restore the factory default settings. Reset Preferences Language Choose the language in which to display FieldFox softkeys and other messages. How to select a Language ... -
Page 177: System Configuration Options (Licensing)
The currently installed options are listed. How to Install Options A .lic file must already be on a USB Flash Drive. To learn how to obtain a .lic file, visit: http://www.keysight.com/find/softwarelicense Insert the USB Flash Drive in the FieldFox. Press System 7 Then System Configuration ... -
Page 178: Gps
“Streets and Trips” and “AutoRoute” (versions 2010 and later). The GPS receiver is NOT available from Keysight. Only the GPS USB receiver is used with the FieldFox. Therefore, it is NOT necessary to purchase the very latest version of the map software. - Page 179 NOTE The GPS Sync setting has the same restrictions as the Date and Time setting. Time can be changed BACK no more than once a day and no more than 6 hours at a time. Learn more on page 181. The FieldFox clock is synchronized and updated approximately every second to the time of the GPS clock.
-
Page 180: Frequency Reference Source
Frequency Reference Source The FieldFox can phase lock with an external 10 MHz reference signal. When a high- stability 10 MHz reference signal is available, this can improve the accuracy and stability of measurements in CAT, NA, and SA Modes. The External Reference setting will survive a FieldFox or Mode Preset and is saved as part of the Instrument State. -
Page 181: Date And Time Settings
There is no restriction for setting the Time Zone. To change the Date and Time backward a significant amount, send an email to ctd-soco_support@keysight.com. BEFORE setting the Date and Time, be absolutely certain that the Time Zone setting is correct. -
Page 182: Lan Settings
FieldFox screen will update accordingly. LAN Settings Configure the LAN settings to be used to communicate with the Data Link Software. Learn more at: www.keysight.com/find/fieldfoxsupport LAN Settings How to configure the LAN settings The first three ‘Current...’ settings can NOT be edited. -
Page 183: See Also Erase User Data
Thru connection. The format is P1 <date time>, P2 <date time>, P1-P2 <date time>. The factory calibration is updated when you send your FieldFox to Keysight for Instrument Calibration. Learn more on page 183. -
Page 184: Erase User Data
Battery Learn about this table on page 185. Internal Temperatures Learn all about this table and the importance of the internal FieldFox temperatures on page 13. Erase User Data All data that you have written to the FieldFox can be erased with the press of a button. -
Page 185: Viewing Battery Charge Status
Working with the Lithium-Ion Battery In this Chapter Viewing Battery Charge Status ......185 Charging the Battery .......... 185 Reconditioning the Battery ......... 188 Battery Care ............189 Maximizing Battery Life ........189 Battery Disposal ..........190 See Also Installing the Battery ..........12 Conserving Battery Power ........ - Page 186 6. Battery Temperature – internal temperature of the battery as measured by a sensor embedded in the battery. 7. Present Run Time to Empty – minutes of power remaining based on amount of current being used now. 8. Charge Cycles – number of charge cycles the battery has experienced. Charge cycle defined as ≥80% change in relative state of charge.
- Page 187 AC/DC adapter To charge a battery inside the FieldFox, insert the AC/DC adapter plug into the Power connector on the FieldFox side panel (middle hinged door), then plug the adapter into an AC outlet. FieldFox ON: Charging is indicated by a battery icon in the upper right of the front panel screen.
-
Page 188: Reconditioning The Battery
The external battery charger (N9910X–872), lets you charge a fully depleted battery in approximately three hours. It is a two bay, level–3 stand-alone battery charger that is compliant with the standard Smart Battery System. The two bays are charged sequentially on a first-come, first-served basis, though a discharge can be performed in the left bay while the right bay is charging. -
Page 189: Battery Care
3. Fully discharge the battery by disconnecting the AC/DC adapter, then leave the FieldFox ON until it shuts down (about four to five hours). 4. Remove the battery from the FieldFox, wait one minute, then re-install the battery. 5. Reconnect the AC/DC adapter. 6. -
Page 190: Battery Disposal
Regulations vary for different countries. Dispose of the battery in accordance with local regulations. Keysight Technologies, through Rechargeable Battery Recycling Corporation (RBRC), offers free and convenient battery recycling options in the U.S. and Canada. Contact RBRC at 877-2-RECYCLE (877.273.2925) or online at:... - Page 191 Do not install substitute parts or perform any unauthorized modification to the product. WARNING Return the product to Keysight Technologies or a designated repair center for service to ensure that safety features are maintained. Applicable local or national safety regulations and rules for the prevention of accidents must WARNING be observed in all work performed.
- Page 192 No operator serviceable parts inside this product. Do not perform any unauthorized WARNING modification to the product. Return the product to Keysight Technologies or a designated repair center for service to ensure that safety features are maintained. Operated at an ambient temperature: 0 to 40°C; full power rating; derate linearly to WARNING 50 W at 50°C.
- Page 193 If charging batteries externally, use the optional external charger available from CAUTION Keysight, or another SMBus charger of level II or higher. Never use a non–SMBus charger because the battery issues commands over the SMBus to the charger to control the charge rate and voltage.
- Page 194 Must be kept away from children. Must not be short circuited. Must be replaced only with Keysight qualified Li–ion batteries. If replaced or charged improperly, there is a danger of explosion. Do not connect the positive terminal and negative terminal of the battery to each other with WARNING any metal object (such as wire).
- Page 195 The protective functions can be divided between two categories: active and passive. Active protection refers to the type of protection that depends on at least two or more protection devices working together to enable the protection Passive protection refers to the type of protection that is always enabled independent of any other protection device.
- Page 196 Batteries: Safe Handling and Disposal To learn how to safely handle and dispose of the FieldFox battery, refer to the Material Safety Data Sheet for the manufacturer of the battery at: http://na.support.keysight.com/fieldfox/help/Reference/MSDS.htm Environmental Requirements Refer to the Specifications section of this document.
- Page 197 The Korean Certification (KC) mark is required for products that are subject to legally compulsory certification. The KC mark includes the marking's identifier code that has up to 26 digits and follows this format: KCC-VWX-YYY-ZZZZZZZZZZZZZ The standby symbol is used to mark a position of the instrument power line switch.
- Page 198 Certification Keysight Technologies, Inc. certifies that this product met its published specifications at the time of shipment from the factory. Keysight Technologies, Inc. further certifies that its calibration measurements are traceable to the United States National Institute of Standards and Technology, to the extent allowed by the Institute's calibration facility, and to the calibration facilities of other International Standards Organization members.
- Page 199 For more information, see Contacting Keysight on page 2. Compliance with German Noise Requirements This is to declare that this instrument is in conformance with the German Regulation on Noise Declaration for Machines (Laermangabe nach der Maschinenlaermrerordnung –3. GSGV Deutschland).
- Page 200 The following table contains for tips on connector care. Prior to making connections to your analyzer, carefully review the information about inspecting, cleaning, and gauging connectors. For course numbers about additional connector care instruction, contact Keysight Technologies. Handling and Storage Do Not ...
- Page 201 Appendix B: Specifications/Data Sheet To ensure the highest accuracy and consistency, the N9912A Specifications are now stored ONLY at : http://literature.cdn.keysight.com/litweb/pdf/N9912-90006.pdf Appendix B: Specifications/Data Sheet...
- Page 202 Connector Care. Learn more on page 200. How Do I Get an Instrument Calibrated? To get your Keysight instrument calibrated, send it to one of the Keysight Technologies service centers. Please visit this website to learn how: www.keysight.com/find/calibration.
- Page 203 13 Compressed SA Measurements, 76 external zeroing, 120 external, 190 connector care review, 203 internal, 189 considerations, safety, 194 disposal, 193 Contacting Keysight, 2 gauge, 189 control, temperature, 14 features icons, display, 188 Coupled Frequency, 26 overview, 8 installing, 12...
- Page 204 managing, 168 2-Port transmission prefixes, 170 measurement, 148 icons, battery, 188 saving and recalling, 164 DTF measurements, 30 FM Tune & Listen, 79 manage files, 168 IF Bandwidth NA Mode, 45 folders, 169 manage folders, 169 Format measure return loss, 27 VVM, 144 Independent Source, 81 NA Mode, 42...
- Page 205 packaging, 200 front, 16 safety considerations, 194 math top, 17 Save Preferences, 177 operations, 162 Parameter Conversion, 39 saving files, 164 maximizing battery life, 192 peak Scale Settings maximum input voltages and power, 14 criteria, 156 NA Mode, 43 Meas UNCAL error, 94 excursion, 157 scale, setting, 23 Measurement Selection...
- Page 206 Tune & Listen (AM/FM), 79 Velocity Factor, 49 verifying integrity of Waterfall Display, 106 calibration, 66 jumper cables, 66 where to find the latest information, 2 Window Settings Video Bandwidth SA mode, 82 USB keyboard, 9 Video triggering, 86 DTF, 36 User Preset, 173 windows settings, 36 viewing...
- Page 207 This information is subject to change without notice. © Keysight Technologies 2014 Print Date: October 1, 2014 Supersedes: May 23, 2014 N9912–90001 www.keysight.com Index...
Need help?
Do you have a question about the N9912A and is the answer not in the manual?
Questions and answers