Table of Contents
Advertisement
Advertisement
Table of Contents

Related Manuals for Hitachi U-5100


Summary of Contents for Hitachi U-5100
- Page 1 MODEL U-5100 RATIO BEAM SPECTROPHOTOMETER Please read through this manual carefully and keep it in a safe place. • Before using the instrument, read the safety instructions and precautions carefully. • Keep this manual in a safe place nearby so it can be referred to whenever needed.
- Page 2 INSTRUCTION MANUAL MODEL U-5100 RATIO BEAM SPECTROPHOTOMETER Hitachi High-Technologies Corporation Copyright C Hitachi High-Technologies Corporation 2010. 1st Edition, 2010 All rights reserved. Printed in Japan. Part No. 3J2-9001 HT-F (H-LT)
- Page 3 1. Information contained in this document is subject to change without notice for improvement. 2. This manual is copyrighted by Hitachi High-Technologies Corporation with all rights reserved. No part of this manual may be reproduced, transmitted...
-
Page 4: About This Manual
PREFACE We thank you for purchasing the Model U-5100 Ratio Beam Spectrophotometer. This instrument is designed for measuring the absorbance and transmittance of a sample. Note that samples that may have been infected with bacteria or viruses are not applicable to the instrument This instrument is intended for use by persons having a basic knowledge of chemical analysis procedures. -
Page 5: Important
IMPORTANT Precautions on CE Conformity Marking In consideration of use in the European countries, this instrument bears the CE mark indicating the conformity to the requirements mentioned below. Electromagnetic Compatibility Requirement This instrument is designed to satisfy the European Norm EN61326-1 (2006) for the CE conformity marking through conformity to the EMC Directive 2004/108/EC. - Page 6 Information for Users on WEEE (only for EU Countries) This symbol is in compliance with the Waste Electrical and Electronic Equipment directive 2002/96/EC (WEEE). This symbol on the product indicates the requirement NOT to dispose of the equipment as unsorted municipal waste, but use the return and collection systems available.
-
Page 7: Warranty On Product
Warranty on Product This product, inclusive of its accessories, is warranted to be free from defects in material or workmanship under normal use within the product specifications indicated in this manual and under conditions given below. This warranty is void if the instrument is not used according to the instruction manual. - Page 8 Limitations and Exclusions on Warranty Note that the following cases are excluded from the scope of this warranty, i.e., these cases are beyond the coverage of free-of-charge repair even during the warranty period indicated above. Failure due to operation at a place not meeting the installation requirements specified by the manufacturer.
- Page 9 Failure of the hardware, or damage to the system software, application software or data due to computer virus infection. After disposal of this instrument, after its resale without prior approval from the manufacturer, consumable parts, and failure of any part that have reached the end of its service life.
-
Page 10: Installation, Relocation And After-Sale Technical Service
Installation, Relocation and After-sale Technical Service Installation and Relocation Installation at delivery shall not be carried out by the user. It shall be carried out by our sales representative or the engineers who have been trained and qualified for this purpose by us in order to use the instrument safely and accurately. - Page 11 Gas leak, water leak, electrical leak or ignition may be caused if the maintenance parts and consumables of the instrument is used without replacement. It may be impossible to supply the main unit components other than the maintenance parts and consumables due to the discontinuance of main unit manufacture, etc.
-
Page 12: Service Life Of This Instrument
Service Life of This Instrument This instrument has a useful service life of seven years after the date of its initial use (installation), which is estimated under the condition that periodic maintenance, checkup, replacement of life-limited parts, and repair of worn parts are carried out as specified in the present instruction manual. -
Page 13: Safety Summary
SAFETY SUMMARY General Safety Guidelines Before using Model U-5100 Ratio Beam Spectrophotometer, be sure to read the following safety instructions carefully. The hazard warnings which appear on the warning labels on the product or in the manual have one of the following alert headings... -
Page 14: Common Safety Precautions
On occurrence of any trouble in the instrument, notify your nearest Hitachi High-Technologies Corporation sales representative or service office of Hitachi High-Technologies Corporation sales representative. • When using chemicals for the instrument, be sure to provide proper ventilation of the room. Inadequate ventilation could endanger human health. -
Page 15: In Use
If any item is missing or damaged or if you have any question, notify the installation personnel at site or your nearest Hitachi High-Technologies Corporation sales representative or service office of Hitachi High-Technologies Corporation sales representative. - Page 16 • If any warning/caution label has become illegible due to deterioration with age or it has been damaged due to any cause, notify your nearest Hitachi High-Technologies Corporation sales representative or service office of Hitachi High-Technologies Corporation sales representative for replacement with a new one.
-
Page 17: Safety Instructions In This Manual
SAFETY SUMMARY Safety Instructions in This Manual Shown below are the safety instructions contained in this manual and their relevant sections in it. DANGER Indications The indication” DANGER” does not apply to this instrument. WARNING Indications Electric Shock due to Contact with Dangerous Voltage •... -
Page 18: Caution Indications
SAFETY SUMMARY CAUTION Indications Injury due to Gazing Directly at Xe Flash Lamp When Lit • The Xe flash lamp radiates strong ultraviolet rays. Avoid gazing at it directly when lit. For looking at the lamp, be sure to wear goggles equipped with a function for cutting off ultraviolet rays. -
Page 19: Disposal Of Waste Solution
SAFETY SUMMARY NOTICE Disposal of Waste Solution Be sure to collect waste solution and treat it for proper disposal in accordance with the relevant laws and regulations regarding water pollution control and sewage treatment. Improper treatment of waste solution may result in environmental pollution, and could also lead to a penalty. -
Page 20: Electrical Checkups
SAFETY SUMMARY NOTICE (Continued) Electrical Checkups • Make sure that power supply to the spectrophotometer is 100 V AC, 1 kVA or more (50 or 60 Hz). Voltage fluctuation or noise entering the power line may have an adverse effect on the spectrophotometer main unit and cause a malfunction as well. -
Page 21: Table Of Contents
CONTENTS PREFACE ABOUT THIS MANUAL IMPORTANT ....................IMPORTANT-1 Warranty on Product ........IMPORTANT-1 Installation, Relocation and After-sale Technical Service..........IMPORTANT-4 Technical Seminars and Training Courses for Users............IMPORTANT-5 Caution on Disposal of Instrument ....IMPORTANT-5 Service Life of This Instrument......IMPORTANT-6 Other Precautions ..........IMPORTANT-6 SAFETY SUMMARY ..................SAFETY-1 General Safety Guidelines ........SAFETY-1 Common Safety Precautions ......SAFETY-2 Prior to Use ............SAFETY-2... - Page 22 Check of Power Voltage and Fuse......1-5 Connection of Cords..........1-6 Connection of Power Cord and Ground Wire ..1-7 FUNCTIONS AND BASIC OPERATION ..............2-1 Features of Model U-5100........2-1 Name and Function of Each Part ......2-1 2.2.1 Names and Functions of Parts of Spectrophotometer Main Unit .....
- Page 23 3.2.1 Determining Concentration of Solution ..3-3 3.2.2 Measuring Absorbance/Transmittance ..3-41 3.2.3 Measuring DNA Sample (measurement through ratio calculation)......3-60 3.2.4 Measuring a Spectrum........ 3-79 Sample-by-sample Measurement (6-cell manual mode) ..............3-97 3.3.1 Determining Concentration of Solution ..3-98 3.3.2 Measuring Absorbance/Transmittance ..
- Page 24 Measurement in Statistical Calculation Mode ..4-47 Auto Start Function..........4-49 Introduction and Mounting Method of Separately Available Options ............ 4-52 4.6.1 Single Cell Holder (Separately Available) ... 4-53 4.6.2 Mask for Micro Cell (Separately Available) ............ 4-55 4.6.3 Rectangular Long-Path Cell Holder (Separately Available).........
- Page 25 APPENDIX ..................... APPENDIX-1 Appendix a. Operating Principles of Model U-5100......... APPENDIX-1 Appendix b. Absorption Spectrophotometry..APPENDIX-4 Appendix c. Proper Use of Spectrophotometer...... APPENDIX-5 - v -...
-
Page 26: Installation (Reference Information For User)
This instrument weighs about 13 kg. There is a danger of personal injury if you accidentally drop it. When carrying the instrument, carefully handle it and securely hold it at both sides. Fig. 1-1 Model U-5100 Ratio Beam Spectrophotometer 1 - 1... -
Page 27: Installation Conditions
1.2 Installation Conditions 1.2 Installation Conditions Before installation, check the following conditions. 1.2.1 Power Supply Power voltage : 100, 115, 220, 230 or 240 V Voltage variation shall be within ±10% of the rated voltage. Frequency : 50 or 60 Hz Frequency variation shall be within ±0.5 Hz of the rated frequency. -
Page 28: Environmental Conditions
1.3 Environmental Conditions 1.3.1 Operating Temperature 15 to 35 °C For measurement under the most stable conditions, it is recommended to install the instrument in a room which is air- conditioned at 20 to 25 °C. 1.3.2 Operating Humidity 25 to 80% No condensation is allowed. - Page 29 1.3 Environmental Conditions The installation site should be free from excessive dust (which may deteriorate optical performance). The instrument should be free from abrupt variation in power voltage (which constitutes a noise source). Avoid frequently turning on/off the electric motor not provided with a noise suppressor (of a stirrer, vibrator, etc.) on the power line connected with the spectrophotometer main unit.
-
Page 30: Check Of Contents
1.4 Check of Contents After unpacking, check the contents against the packing list. If any part is missing or damaged, or if you have a question, contact the dealer from whom you purchased the instrument. 1.5 Check of Power Voltage and Fuse WARNING Electric Shock due to Dangerous Voltage An electric shock due to power voltage could result in death... -
Page 31: Connection Of Cords
To AC power supply Power cable Printer cable Printer Printer Model U-5100 Spectrophotometer Fig. 1-3 Connection of Cords (for independent operation of instrument) NOTE: Separately prepare a printer having <1> and <2> given below. -
Page 32: Connection Of Power Cord And Ground Wire
1.7 Connection of Power Cord and Ground Wire Securely plug the power cord into the connector of the main unit. When using a plug adapter or table tap, securely connect its ground wire to the ground terminal. WARNING Improper grounding may result in an electric shock hazard. Be sure to provide proper grounding connection. -
Page 33: Functions And Basic Operation
2.2 Name and Function of Each Part 2.2.1 Names and Functions of Parts of Spectrophotometer Main Unit Data display Sample compartment Operation panel Power switch (lit in blue when turned on) Fig. 2-1 External View of Model U-5100 Ratio Beam Spectrophotometer 2 - 1... - Page 34 2.2 Name and Function of Each Part <1> Operation panel : By using the keys on this panel, you can operate the spectrophotometer. <2> Data display : While watching this display panel, operate the spectrophotometer and check data. <3> Sample compartment : In this compartment, set a sample to be measured.
- Page 35 2.2.1 <8> Light source cover Fig. 2-3 Rear View of Spectrophotometer <8> Light source cover : Opened/closed only when mounting the pen-shaped low-pressure mercury lamp (optionally available). For how to mount the pen-shaped low-pressure mercury lamp, refer to its instruction manual.
-
Page 36: Inside View Of Sample Compartment
2.2 Name and Function of Each Part <9> Drain : Tube for draining liquid accidentally spilt in the sample compartment. The spilt liquid is discharged to the bottom of the instrument through this drain. If you accidentally spill liquid in the sample compartment, then carry out cleaning according to section 6.2. - Page 37 2.2.2 6-cell holder: Set cells in the 6-cell holder for measurement. This cell holder can accommodate 6 cells. The cell position inscribed with Autozero is used only for auto zero. Normally, auto zero is executed with the cell at this position (hereafter referred to as cell A).
-
Page 38: Startup And Shutdown Of Instrument
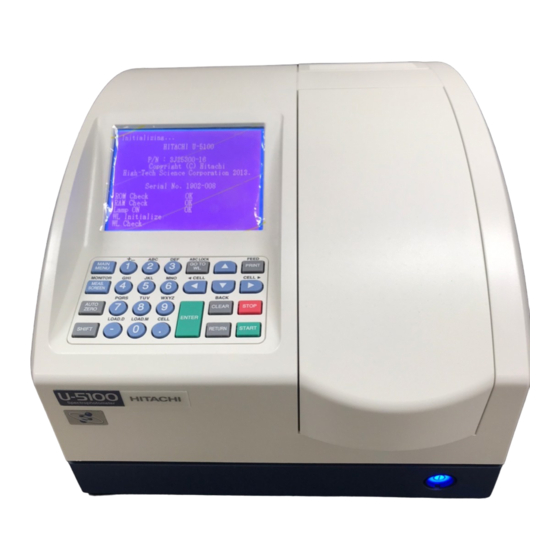
(6) Press the power switch on the front of the instrument. Display of Initialization Screen (1) The initialization screen (Fig. 2-7) appears on the display panel of the instrument. Initializing... HITACHI U-5100 Spectrophotometer P/N : 3J25300-00 Copyright (C) Hitachi High-Technologies Corporation 2010 Serial No. 1234-123... - Page 39 2.3.1 (2) Self-diagnosis and automatic adjustment are carried out. The items to be checked are listed below. For each item, “OK” is indicated if its function is normal and “NG” if abnormal. If “NG” is indicated for ROM Check, RAM Check, Lamp ON, WL Initialize or WL Check, the system will stop.
-
Page 40: Shutdown Of Instrument
2.3 Startup and Shutdown of Instrument Main Menu CELL A 1 Photometry 2 WL Scan 3 Time Scan 4 Method Menu 5 Data Menu 6 System Setup 7 Performance 8 Data Display Select function. :_ Fig. 2-8 Main Menu Screen 2.3.2 Shutdown of Instrument Termination of Measurement (1) Check that the power switch lamp on the front of the... -
Page 41: Basic Operation
2.4.1 2.4 Basic Operation 2.4.1 Operation Panel Figure 2-9 shows the operation panel of the instrument. The function of each key is explained in Table 2-1, and key operation in combination with the [SHIFT] key in Table 2-2. <5> <6> <7>... - Page 42 2.4 Basic Operation (cont’d) Description <5> Enters 4. On the character input screen, the following characters are entered. Alphabet input : g, h, i, G, H, I, 4 Numeric input : 4 Enters 5. On the character input screen, the following characters are entered. Alphabet input : j, k, l, J, K, L, 5 Numeric input : 5 Enters 6.
- Page 43 2.4.1 Table 2-2 Key Operation in Combination with SHIFT Key (The bold-faced characters are entered in sequence each time the relevant key is pressed.) Description [SHIFT] + Allows you to change the currently displayed screen to the monitor screen. MEAS.SCREE [SHIFT] + 1 On the character input screen, the following characters are entered.
-
Page 44: Basic Operation Of Screen
2.4 Basic Operation 2.4.2 Basic Operation of Screen Explained here is the gateway to operation or the Main Menu screen. For the menu items and setting items displayed on the monitor, you can proceed with operation by use of the [◄], [►], [▲] and [▼] keys, numeric keys and [ENTER] key on the operation panel. - Page 45 2.4.2 <4> Operational guidance Guidance on operation is given for the menu item selected by the cursor. This guidance differs depending on the screen active at the time. In the subsequent process, carry out operation according to the guidance. On the Main Menu screen, “Select function.: _”...
- Page 46 2.4 Basic Operation Table 2-4 Guidance on Cell Position in Use of Accessory Guidance on In-use Accessory Indicated Cell Position Single cell holder (optionally available) CELL S Rectangular long path cell holder (optionally available) Auto sipper (optionally available) SIPPER To display the Main Menu screen from another screen, press the [MAIN MENU] key.
-
Page 47: How To Input Characters
2.4.3 Use of numeric keys and [ENTER] key Enter the number preceding the desired menu item and press the [ENTER] key. For setting “3 Curve” for example, enter <3> and press the [ENTER] key. Then, set each item according to the operational guidance and press the [ENTER]. - Page 48 2.4 Basic Operation Alphabet Input and Numeric Input Alphabet input mode and numeric input mode are available for character input. In alphabet input mode, “ABC” is indicated in the lower part of the screen, and “123” is indicated in numeric mode. Alphabet input mode is initially set on the character input screen.
-
Page 49: How To Set Cell
2.4.4 2.4.4 How to Set Cell This section explains about the cell, including cell selection, sample volume required for measurement and how to set a cell to the 6-cell holder. About Cell 10 mm cell is generally used for the spectrophotometer. This cell is 10 mm on an inner side. - Page 50 2.4 Basic Operation For measurement, set the cell so that the beam passes through its transparent face. Figure 2-13 shows the external view of the 6-cell holder. It turns for measurement of each cell. It is therefore necessary to set the cell in different directions according to the cell position.
-
Page 51: Demounting And Remounting Of 6-Cell Holder
2.4.5 2.4.5 Demounting and Remounting of 6-cell Holder The 6-cell holder is demounted when installing any accessory or cleaning the sample compartment. Described below are the procedures for demounting and remounting the holder. Procedure for Demounting 6-cell Holder (1) Loosen the hand screw at the center of the 6-cell holder until being turned freely. - Page 52 2.4 Basic Operation (3) Put the demounted 6-cell holder in a case which can protects against dust and keep it in a safe place. 6-cell holder Fig. 2-16 Demounted 6-cell Holder Procedure for Remounting 6-cell Holder Given below is the procedure for remounting the 6-cell holder demounted.
- Page 53 2.4.5 (2) Check the screw cramp section on the back side of the 6-cell holder to be remounted. The screw cramp section includes a portion for alignment (convex portion). Let us refer to this portion as B. Align the 6-cell holder by turning it so that the convex portion for alignment fits into the notched portion of the drive shaft in the sample compartment.
-
Page 54: Cautions On Operation
2.4 Basic Operation 2.4.6 Cautions on Operation Pay attention to the following points during operation and measurement. NOTICE: For sample measurement, securely close the sample compartment cover. Also, avoid opening the sample compartment cover during measurement. Otherwise abnormal measured values may be obtained. NOTICE: The main unit has a function of saving the measured data or measuring conditions. -
Page 55: Basic Setting
2.5.1 2.5 Basic Setting 2.5.1 Setting of Current Date and Time Set the current date and time. The date and time set here are used for the date and time of analysis, printing, etc. Startup of Instrument Start the instrument according to section 2.3.1. Main Menu Screen The Main Menu screen (Fig. - Page 56 2.5 Basic Setting Setting of Date and Time (1) The Date and Time setting screen (Fig. 2-22) appears. Select each item indicated and make your entry. For details, refer to Table 2-6. System Setup CELL A 1 WL CALIB. Format Y/M/D 2 Lamp Usage Year...
-
Page 57: Setting Of Printer
2.5.2 2.5.2 Setting of Printer Select a type of language for the connected printer. Startup of Instrument Start the instrument according to section 2.3.1. Main Menu Screen The Main Menu screen (Fig. 2-23) appears. To select “System Setup”, press the <6> key (System Setup) and then [ENTER] key. - Page 58 2.5 Basic Setting Setting of Printer (1) The printer setup screen (Fig. 2-25) appears. Select the item indicated and make your entry. For details, refer to Table 2-7. System Setup CELL A 1 WL CALIB. Type 2 Lamp Usage 3 Date and Time 4 Printer Setup 5 6 Cell Mode 6 Auto Lamp OFF...
-
Page 59: Setting Of Auto Lamp Off Time
2.5.3 2.5.3 Setting of Auto Lamp OFF Time This instrument has a function of automatically turning off the lamp after a certain period of time to prevent the lamp staying on unnecessarily for a long time in use of the enlarged display screen (monitor). - Page 60 2.5 Basic Setting System Setup CELL A 1 WL CALIB. 2 Lamp Usage 3 Date and Time 4 Printer Setup 5 6 Cell Mode 6 Auto Lamp OFF 7 Language Select function. :_ Fig. 2-27 System Setup Screen Setting of Auto Lamp OFF Time (1) The auto lamp OFF time setting screen (Fig.
-
Page 61: Setting Of 6-Cell Mode
2.5.4 2.5.4 Setting of 6-cell Mode You can specify whether to control the 6-cell holder. The setting needs to be changed for measurement with the optionally available single cell holder or rectangular long path cell holder in place of the 6-cell holder, or for measurement with the 6-cell holder in place of the single cell holder or rectangular long path cell holder. - Page 62 2.5 Basic Setting System Setup Screen The System Setup screen (Fig. 2-30) appears. To select “6 Cell Mode”, press the <5> key (6 Cell Mode) and then [ENTER] key. Or select “6 Cell Mode” with the [▲] or [▼] key and press the [ENTER] key. System Setup CELL A 1 WL CALIB.
-
Page 63: Selection Of Language
2.5.5 After completion of setting, return to the Main Menu screen with the [RETURN] key. Note:When Method is opened from Method Menu (Refer to section 4.2.1 for details), Auto Start (Refer to section 4.5 for details), and data is opened from Data Menu (Refer to section 4.1.1 for details), the setting of ON/OFF of A is subjected to change. - Page 64 2.5 Basic Setting System Setup CELL A 1 WL CALIB. 2 Lamp Usage 3 Date and Time 4 Printer Setup 5 6 Cell Mode 6 Auto Lamp OFF 7 Language Select function. :_ Fig. 2-33 System Setup Screen Selection of Language (1) The language selection screen (Fig.
-
Page 65: First Measurement
3. FIRST MEASUREMENT 3.1 What this Product can Do Determination of Solution Concentration: This product can measure the absorbance of a solution and determine the concentration from the measured value. → section 3.2.1. Automatic continuous measurement → section 3.3.1. Sample-by-sample measurement Measurement of Absorbance/Transmittance: This product can measure the absorbance and transmittance of a solution at a maximum of 6 wavelengths. -
Page 66: Automatic Continuous Measurement (6-Cell Auto Mode)
3.2 Automatic Continuous Measurement (6-cell auto mode) 3.2 Automatic Continuous Measurement (6-cell auto mode) Up to 6 samples can be measured automatically (auto zero sample is contained; spectrum measurement is excluded.). Automatic absorbance zero correction or baseline correction is possible by using the position of cell A. Determination of Solution Concentration →... -
Page 67: Determining Concentration Of Solution
3.2.1 3.2.1 Determining Concentration of Solution This instrument is used for generating a calibration curve and determining the concentration of an unknown sample, and for entering a calibration curve factor and determining the concentration of an unknown sample. Guide: When auto start is specified, the system automatically sets up the conditions and advances to the measurement screen phase of sequence after the power switch is turned on. - Page 68 3.2 Automatic Continuous Measurement (6-cell auto mode) Photometry CELL A 1 Meas.PARAM Data Mode CONC 2 Sample No.of WL 3 Curve WL1(nm) 600.0 4 Curve Data Delay(s) 5 6 Cell 6 System 7 Print 8 Save Method 9 Meas.Screen Select function. : _ Fig.
- Page 69 3.2.1 Table 3-1 “Meas. PARAM.” Setting Parameters Setting Item Description Data Mode For measuring the concentration of a solution, select [1] CONC. [1] CONC [2] ABS : Used for measuring the absorbance. (For details, refer to section 3.2.2..) [3] %T : Used for measuring the transmittance.
- Page 70 3.2 Automatic Continuous Measurement (6-cell auto mode) Explanation 3-1 Setting of Number of Wavelengths Number of Description Wavelengths Most generally used. Specify a wavelength for WL1. A calibration curve is generated from obtained absorbance A and the concentration of an unknown sample is determined.
- Page 71 3.2.1 (4) After completion of setting, return to the Photometry screen by pressing the [RETURN] key or [◄] key. Setting of Sample Conditions (1) To set the sample conditions, press the <2> key (Sample) and then [ENTER] key. Or select “Sample” with the [▲] or [▼] key and press the [ENTER] key or [►] key.
- Page 72 3.2 Automatic Continuous Measurement (6-cell auto mode) Table 3-2 “Sample” Setting Parameters Setting Item Description Sample Up to 8 characters can be entered for the sample Name name. The sample name entered here is printed in the sample name field on the report. For the character input procedure, refer to section 2.4.3.
- Page 73 3.2.1 Setting of Calibration Curve Conditions (1) To set the calibration curve conditions, press the <3> key (Curve) and then [ENTER] key. Or select “Curve” with the [▲] or [▼] key and press the [ENTER] key or [►] key. (2) The calibration curve condition (Curve) screen (Fig. 3- 5) appears.
- Page 74 3.2 Automatic Continuous Measurement (6-cell auto mode) Table 3-3 “Curve” Setting Parameters Setting Item Description Curve Type Select a method for calculating the concentration of an unknown sample from the following two. 1) 1st Order : Standards (standard solutions) are measured, regression analysis (least-squares method) is made based on the relationship between...
- Page 75 3.2.1 (cont’d) Setting Item Description Thru Zero When ON is selected, regression analysis is made taking the intercept of the calibration curve as zero. When OFF is selected, regression analysis is made with the intercept of the calibration curve. For calculation of the regression formula, refer to Explanation 3-2.
- Page 76 3.2 Automatic Continuous Measurement (6-cell auto mode) Explanation 3-2 How to Calculate Regression Formula Calibration Curve Formula Thru Zero ON Thru Zero OFF (system condition) ・ ・ Abs = f(Conc.) Regression formula: Regression formula: Y = A1 Y = A1 X +A0 ∑...
- Page 77 3.2.1 Photometry CELL A 1 Meas.PARAM. CONC 2 Sample 0.000 3 Curve 10.00 4 Curve Data 20.00 5 System 6 Print 7 Save Method 8 6 Cell 9 Meas.Screen Input value. : _ STD1 [0.000 - 9999] Fig. 3-6 Calibration Curve Data (Curve Data) Screen (Curve Type: 1st Order) (3) Enter the concentration of each standard (standard solution).
- Page 78 3.2 Automatic Continuous Measurement (6-cell auto mode) Table 3-4 How to Set Calibration Curve Factors [Normal Usage] Calibration Curve Formula (system Calibration Curve Formula (system condition): condition): ABS = f(CONC) CONC = f(ABS) Calculation Absorbance = A1 × Concentration + Concentration = A1 ×...
- Page 79 3.2.1 (2) The 6-cell condition (6 Cell) screen (Fig. 3-8) appears (Curve Type: 1st Order). Photometry CELL A 1 Meas.PARAM. 6 Cell Mode Auto 2 Sample STD Autozero STD1 3 Curve SAMP.Autozero ON 4 Curve Data Autozero int. 5 5 6 Cell No.of Sample 6 System 7 Print...
- Page 80 3.2 Automatic Continuous Measurement (6-cell auto mode) (cont’d) Setting Item Description Curve Select a sample to be used for auto zero (operation Autozero for adjusting the absorbance to zero) in standard (indicated measurement between STD1 and Blank. only when 1) STD1 1st Order is Selected when the auto zero sample in standard selected for...
- Page 81 3.2.1 Explanation 3-3 How to Set 6-cell Measurement Parameters without Coloring Reagent Standard solution Sample solution Analyte of interest Absorbance of analyte Absorbance-zero line by Solvent auto zero with <1> Cell <1> <2> <3> <4> STD1 STD2 STD3 Sample Elements causing absorbance without using coloring reagent (not containing interfering substance) A measured absorbance value is given as a total of absorptions due to various elements (cell, solvent, coloring reagent, analyte of interest, interfering substance).
- Page 82 3.2 Automatic Continuous Measurement (6-cell auto mode) (cont’d) In the case where a sample contains an interfering substance such as turbid or disturbing component as illustrated at <6> in the above figure, the absorbance due to the interfering substance will be added to the quantitative value of the analyte. In this case, it is necessary to carry out a blank test (the same preparatory operation as for samples by use of pure water or the like) and subtract the measured absorbance of the blank test solution by auto-zero operation at the time of sample measurement or subtract the quantitative value of the...
- Page 83 3.2.1 Explanation 3-4 How to Set 6-cell Measurement Parameters with Coloring Reagent Standard solution Sample solution Analyte of interest Absorbance of analyte Coloring reagent Absorbance-zero line by Solvent auto zero with <1> Cell <0> <1> <2> <3> <4> Blank STD1 STD2 STD3 Sample...
- Page 84 3.2 Automatic Continuous Measurement (6-cell auto mode) (cont’d) In the case where a sample contains an interfering substance such as turbid or disturbing component as illustrated at <6> in the above figure, the absorbance due to the interfering substance will be added to the quantitative value of the analyte. In this case, it is necessary to carry out a blank test (the same preparatory operation as for samples by use of pure water or the like) and subtract the measured absorbance of the blank test solution by auto-zero operation at the time of sample measurement or subtract the quantitative value of the blank test solution from that of the...
- Page 85 3.2.1 Setting of System Conditions (1) To set the system conditions, press the <6> key (System) and then [ENTER] key. Or select “System” with the [▲] or [▼] key and press the [ENTER] key or [►] key. (2) The system condition (System) screen (Fig. 3-9) appears.
- Page 86 3.2 Automatic Continuous Measurement (6-cell auto mode) Setting of Printing Conditions GUIDE: Specify print items if determined beforehand. You can also specify print items after completion of measurement. If you do not want to set the printing conditions here, proceed to step 9. (1) To set the printing conditions, press the <7>...
- Page 87 3.2.1 Table 3-7 “Print” Setting Parameters Location in Setting Item Description Fig. 3-11 Print Date [1] ON : Printing date is printed. <1> [2] OFF : Printing date is not printed. Run Date [1] ON : Analysis date is printed. <2>...
- Page 88 CONC(mg/l) 0.000 1.000 Sample Name : File Name : ……….. <2> Run Date : 2010/04/10 13:34 Operator : Spectrophotometer Model: U-5100 Spectrophotometer Serial No.: 1234-567 ROM VER.: 3J25300 Option: Instrument Meas. Mode: Photometry Bandpass(nm): Data Mode: CONC 6 Cell Mode:...
- Page 89 “Save Method” with the [▲] or [▼] key and press the [ENTER] key or [►] key. (2) The measuring condition saving (Save Method) screen (Fig. 3-12) appears. Save Method CELL A 1 NO3-(Hitachi Taro) PHT 2010/10/10 2 Cr6+(Hitachi Hanako) PHT 2010/03/30 File name Measurement Saving...
- Page 90 3.2 Automatic Continuous Measurement (6-cell auto mode) NOTE: • If a file of the same name as entered already exists in the same measurement mode, the following guidance appears. Already exists. Overwrite it? :__ □ 1 Yes □ 2 No For overwriting, press the <1>...
- Page 91 3.2.1 Photometry CELL A [Info] Set STD to Cell No.. Cell A STD1 (0.000) Cell 1 Cell number Standard Cell 2 STD2 (10.00) concentration Cell 3 STD3 (20.00) Standard name Example of display with “3” set for START:Meas.: _ number of standards Fig.
- Page 92 3.2 Automatic Continuous Measurement (6-cell auto mode) Table 3-9 Auto Zero Interval and Operation of Instrument (1) Sequence of Operation Cell Position Operation Auto Zero Interval: 5 Auto Zero Interval: 1 Setting of standards (1st round) Cell A Auto zero Cell A STD1 measurement ⎯...
- Page 93 3.2.1 Table 3-11 Auto Zero Interval and Operation of Instrument (2) Sequence of Operation Cell Position Operation Auto Zero Interval: 5 Auto Zero Interval: 1 Setting of standards (1st round) Cell A Auto zero Cell 1 STD1 measurement ⎯ Cell A Auto zero Cell 2 STD2 measurement...
- Page 94 3.2 Automatic Continuous Measurement (6-cell auto mode) (5) When “6” or more is specified for “No. of STD”, the results obtained from measurement of STD1 to STD5 are indicated as shown in Fig. 3-15. This screen also appears after completion of 2nd/3rd-round measurement.
- Page 95 3.2.1 (6) When the specified number of standards have all been measured, the screen shown in Fig. 3-16 appears. When you select the <1> key (Sample Meas.), the system terminates standard measurement and proceeds to sample measurement. Selecting the <2> key (Curve), <3>...
- Page 96 [3] Save You can save the measured standard data. When this function is selected, the following screen appears. Save Data CELL A 1 NO3-(Hitachi Taro) PHT 2010/10/10 2 Cr6+(Hitachi Hanako) PHT 2010/03/30 Select function. : _ □ Save □...
- Page 97 3.2.1 11. Measurement of Sample Solutions (1) The sample setting screen (Fig. 3-17) appears. Photometry CELL A [Info] Set samples to Cell No.. Cell A STD1 (0.000) Cell 1 Sample1 Cell 2 Sample2 Cell 3 Sample3 Cell 4 Sample4 Cell 5 Sample5 START:Meas.: Fig.
- Page 98 3.2 Automatic Continuous Measurement (6-cell auto mode) <1> Press the [AUTOZERO] key when the sample setting screen is displayed. Photometry CELL A [Info] Set samples to Cell No.. Cell A Cell 1 Sample1 Cell 2 Sample2 Cell 3 Sample3 Cell 4 Sample4 Cell 5 Sample5...
- Page 99 3.2.1 Table 3-14 How to Set Cells with ON Selected for SAMP. Autozero Cell A* Cell 1 Cell 2 Cell 3 Cell 4 Cell 5 1st round STD1 or blank Sample 1 Sample 2 Sample 3 Sample 4 Sample 5 2nd round STD1 or blank Sample 6...
- Page 100 3.2 Automatic Continuous Measurement (6-cell auto mode) Table 3-17 Auto Zero Interval and Operation of Instrument SAMP. Autozero: ON SAMP. Autozero: OFF Cell Position Operation Auto Zero Auto Zero Interval: 5 Interval: 1 Setting of samples (1st round) ⎯ Cell A Auto zero Cell 1 Sample 1 measurement...
- Page 101 3.2.1 (3) When “6” or more is specified for “No. of Sample”, the results obtained from measurement of samples 1 to 5 are indicated as shown in Fig. 3-16. This measurement result screen also appears after completion of 2nd/3rd-round measurement. Pressing the [START] key displays the next sample setting screen.
- Page 102 3.2 Automatic Continuous Measurement (6-cell auto mode) Table 3-18 Guidance after Sample Measurement Setting Item Description [1] Meas. You can make setting related to measurement. New Meas., Continue and Remeasure are selectable. [1] New Meas. : Selected when newly measuring samples with the same calibration curve.
- Page 103 [3] Save You can save the measured data. When this function is selected, the following screen appears. Save Data CELL A 1 NO3-(Hitachi Taro) PHT 2010/10/10 2 Cr6+(Hitachi Hanako) PHT 2010/03/30 Select function. : _ □...
- Page 104 3.2 Automatic Continuous Measurement (6-cell auto mode) (cont’d) Setting Item Description [4] Print You can select items to be printed. When this function is selected, the screen given below appears. For each item, select whether to print out (ON or OFF).
-
Page 105: Measuring Absorbance/Transmittance
3.2.2 3.2.2 Measuring Absorbance/Transmittance This instrument is capable of measuring the absorbance and transmittance of a solution at a maximum of 6 wavelengths. GUIDE: When auto start is specified, the system automatically sets up the conditions and advances to the measurement screen phase of sequence after the power switch is turned on. - Page 106 3.2 Automatic Continuous Measurement (6-cell auto mode) (3) The Photometry screen (Fig. 3-23) appears. Photometry CELL A 1 Meas.PARAM Data Mode CONC 2 Sample No.of WL 3 Curve WL1(nm) 600.0 4 Curve Data Delay(s) 0 5 6 Cell 6 System 7 Print 8 Save Method 9 Meas.Screen...
- Page 107 3.2.2 (8) After completion of setting, return to the Photometry screen by pressing the [RETURN] key or [◄] key. Table 3-19 “Meas. PARAM.” Setting Parameters Setting Item Description Data Mode For measuring the absorbance, select 2) ABS. For measuring the transmittance, select 3) %T. 1) CONC : Used for generating a calibration curve and determining the concentration.
- Page 108 3.2 Automatic Continuous Measurement (6-cell auto mode) Photometry CELL A 1 Meas.PARAM. Sample Name 2 Sample Sample ID 3 6 Cell 4 Print 5 Save Method 6 Meas.Screen Input character. : _ Sample Name [Max: 8 characters] Fig. 3-25 Sample Condition (Sample) Screen (3) To enter/select the sample conditions, press the [ENTER] key.
- Page 109 3.2.2 (1) To set the 6-cell conditions, press the <3> key (6 Cell) and then [ENTER] key. Or select “6 Cell” with the [▲] or [▼] key and press the [ENTER] key or [►] key. (2) The 6-cell condition (6 Cell) screen (Fig. 3-26) appears. Photometry CELL A 1 Meas.PARAM.
- Page 110 3.2 Automatic Continuous Measurement (6-cell auto mode) Table 3-21 “6 Cell” Setting Parameters Setting Item Description 6 Cell Mode Specify a 6-cell operation mode for measurement. 1) Auto In this mode, a sample is set at each position of the 6-cell holder beforehand and the holder is automatically turned to automatically perform from auto zero to standard/sample measurement.
- Page 111 3.2.2 Setting of Printing Conditions GUIDE: Specify print items if determined beforehand. You can also specify print items after completion of measurement. If you do not want to set the printing conditions here, proceed to step 6. (1) To set the printing conditions, press the <4> key (Print) and then [ENTER] key.
- Page 112 ……….. <1> Report:2010/04/10 15:12 Sample Name: File Name: ……….. <2> Run Date: 2010/04/10 13:34 Operator: Spectrophotometer Model: U-5100 Spectrophotometer Serial No.: 1234-567 ROM VER.: 3J25300 Option: Instrument Meas.Mode: Photometry Bandpass(nm): Data Mode: 6 Cell Mode: Auto <3> No.of WL:...
- Page 113 3.2.2 Saving of Measuring Conditions GUIDE: When the set measuring conditions need not be saved, proceed to step 7. (1) To save the set measuring conditions, press the <5> key (Save Method) and then [ENTER] key. Or select “Save Method” with the [▲] or [▼] key and press the [ENTER] key or [►] key.
- Page 114 3.2 Automatic Continuous Measurement (6-cell auto mode) NOTE: • If a file of the same name as entered already exists in the same measurement mode, the following guidance appears. Already exists. Overwrite it? :_ □ 1 Yes □ 2 No For overwriting, press the <1>...
- Page 115 3.2.2 Measurement of Samples (1) To determine the measuring conditions set in the preceding steps, press the <6> key (Meas. Screen) and then [ENTER] key. Or press the [MEAS. SCREEN] key. The sample setting screen (Fig. 3-30) appears. Photometry CELL A [Info] Set samples to Cell No..
- Page 116 3.2 Automatic Continuous Measurement (6-cell auto mode) Explanation 3-5 Method of Auto Zero in Absorbance Measurement Cell A Substance B Absorbance of analyte Substance A Absorbance-zero line in auto zero with cell and solvent Solvent Cell <1> <2> <3> Cell and Sample 1 Sample 2 solvent Auto Zero for Measuring Absorbance Except for Cell and Solvent...
- Page 117 3.2.2 Explanation 3-6 Method of Auto Zero in Transmittance Measurement Cell A Transmittance 100% Line in Auto Zero with Air Transmit- tance 100% Transmittance of analyte <1> <2> <3> Sample 1 Sample 2 Auto Zero with Transmittance of Air Set at 100% In transmittance measurement, it is important what condition is to be defined as transmittance 100%.
- Page 118 3.2 Automatic Continuous Measurement (6-cell auto mode) If “-” (hyphen) is indicated for the sample name, avoid setting a sample in the relevant cell. When ON is selected for “SAMP. Autozero”, set samples as shown in Table 3-23, and as shown in Table 3-24 when OFF is selected.
- Page 119 3.2.2 Table 3-25 Auto Zero Interval and Operation of Instrument SAMP. Autozero: ON SAMP. Autozero: OFF Cell Position Operation Auto Zero Auto Zero Interval: 5 Interval: 1 Setting of samples (1st round) ⎯ Cell A Auto zero Cell 1 Sample 1 measurement ⎯...
- Page 120 3.2 Automatic Continuous Measurement (6-cell auto mode) (1) Press the AUTOZERO key when the sample setting screen is displayed. Photometry CELL A [Info] Set samples to Cell No.. Cell A Cell 1 Sample1 Cell 2 Sample2 Cell 3 Sample3 Cell 4 Sample4 Cell 5 Sample5...
- Page 121 3.2.2 (2) During measurement, the screen shown in Fig. 3-32 is displayed. Photometry 600.0nm 0.101ABS CELL A 0.001 0.101 Meas.Sample3... Fig. 3-32 Screen Displayed during Sample Measurement (3) When “6” or more is specified for “No. of Sample”, the results obtained from measurement of samples 1 to 5 are indicated as shown in Fig.
- Page 122 3.2 Automatic Continuous Measurement (6-cell auto mode) Photometry CELL A 0.301 0.251 0.419 0.110 0.234 Select function. : _ 1)Meas. 2)Save 3)Print Fig. 3-34 Example of Display after Sample Measurement (number of samples: 10) Table 3-26 Guidance after Sample Measurement Setting Item Description Meas.
- Page 123 ( 2/ 2) Save You can save the measured data. When this function is selected, the following screen appears. Save Data CELL A 1 NO3-(Hitachi Taro) PHT 2010/10/10 2 Cr6+(Hitachi Hanako) PHT 2010/03/30 Select function. : _ □ Save □...
-
Page 124: Measuring Dna Sample (Measurement Through Ratio Calculation)
3.2 Automatic Continuous Measurement (6-cell auto mode) 3.2.3 Measuring DNA Sample (measurement through ratio calculation) This instrument is capable of measuring the absorbance (at 230 nm, 260 nm, 280 nm and 320 nm) of a DNA sample and calculating the absorbance ratio (A260/A280 and A260/A230) for check of the DNA purity. - Page 125 3.2.3 (3) The Photometry screen (Fig. 3-36) appears. Photometry CELL A 1 Meas.PARAM. Data Mode CONC 2 Sample No.of WL 3 Curve WL1(nm) 600.0 4 Curve Data Delay(s) 5 6 Cell 6 System 7 Print 8 Save Method 9 Meas.Screen Select function.
- Page 126 3.2 Automatic Continuous Measurement (6-cell auto mode) Table 3-27 “Meas. PARAM.” Setting Parameters Setting Item Description Data Mode For estimating the purity of DNA, select 4) DNA. [1] CONC : Used for generating a calibration curve and determining the concentration. (For details, refer to section 3.2.1.) [2] ABS : Used for measuring the absorbance.
- Page 127 3.2.3 (cont’d) Setting Item Description Delay (s) After the [START] key is pressed, the system waits for the time period set here and then starts measurement. This parameter is settable in a range of 0 to 9999 sec in steps of 1 sec. Set the parameter when you want to start measurement after a specified time period, including when measuring a sample after its temperature...
- Page 128 3.2 Automatic Continuous Measurement (6-cell auto mode) Explanation 3-8 Background Correction Bkgd.CORR Setting method Background correction is avoided. Absorbance ratio will be calculated using the obtained absorbance values. Absorbance ratio = A(1)/A(2) A(1) A(2) Wavelength Absorption spectrum The background will be corrected. This is effective when the background level is even along the wavelength axis.
- Page 129 3.2.3 Setting of Sample Conditions (1) To set the sample conditions, press the <2> key (Sample) and then [ENTER] key. Or select “Sample” with the [▲] or [▼] key and press the [ENTER] key or [►] key. (2) The sample condition (Sample) screen (Fig. 3-38) appears.
- Page 130 3.2 Automatic Continuous Measurement (6-cell auto mode) Table 3-28 “Sample” Setting Parameters Setting Item Description Sample Up to 8 half-size alphanumeric characters can be Name entered for the sample name. The sample name entered here is printed in the sample name field on the report.
- Page 131 3.2.3 Setting of 6-cell Conditions “6 Cell Mode” is not indicated if OFF is specified NOTE: for Mode on the 6-cell mode setting screen for use of the single cell holder or rectangular long path cell holder. (For details, refer to section 2.5.4..) When the auto sipper is connected, “Sipper”...
- Page 132 3.2 Automatic Continuous Measurement (6-cell auto mode) Table 3-29 “6 Cell” Setting Parameters Setting Item Description 6 Cell Mode Specify a 6-cell operation mode for measurement. [1] Auto In this mode, a sample is set at each position of the 6-cell holder beforehand and the holder is automatically turned to automatically perform from auto zero to standard/sample measurement.
- Page 133 3.2.3 Setting of Printing Conditions GUIDE: Specify print items if determined beforehand. You can also specify print items after completion of measurement. If you do not want to set the printing conditions here, proceed to step 6. (1) To set the printing conditions, press the <4> key (Print) and then [ENTER] key.
- Page 134 ……….. <1> Report:2010/04/10 15:12 Sample Name: File Name: ……….. <2> Run Date: 2010/04/10 13:34 Operator: Spectrophotometer Model: U-5100 Spectrophotometer Serial No.: 1234-567 ROM VER.: 3J25300 Option: Instrument Meas.Mode: Photometry Bandpass(nm): Data Mode: 6 Cell Mode: Auto <3>...
- Page 135 3.2.3 Saving of measuring conditions GUIDE: When the set measuring conditions need not be saved, proceed to step 7. (1) To save the set measuring conditions, press the <5> key (Save Method) and then [ENTER] key. Or select “Save Method” with the [▲] or [▼] key and press the [ENTER] key or [►] key.
- Page 136 3.2 Automatic Continuous Measurement (6-cell auto mode) NOTE: • If a file of the same name as entered already exists in the same measurement mode, the following guidance appears. Already exists. Overwrite it? :_ 1) Yes 2) No For overwriting, press the <1> key (Yes). To avoid overwriting, press the <2>...
- Page 137 3.2.3 On the screen, displayed from the left are the cell number and sample name. Set the corresponding sample to each cell. If “-” (hyphen) is indicated for the sample name, avoid setting a sample in the relevant cell. When ON is selected for “SAMP. Autozero”, set samples as shown in Table 3-31, and as shown in Table 3-32 when OFF is selected.
- Page 138 3.2 Automatic Continuous Measurement (6-cell auto mode) Table 3-33 Auto Zero Interval and Operation of Instrument SAMP. Autozero: ON SAMP. Autozero: OFF Cell Position Operation Auto Zero Auto Zero Interval: 5 Interval: 1 Setting of samples (1st round) ⎯ Cell A Auto zero Cell 1 Sample 1 measurement...
- Page 139 3.2.3 <1> Press the [AUTOZERO] key when the sample setting screen is displayed. Photometry CELL A [Info] Set samples to Cell No.. Cell A Cell 1 Sample1 Cell 2 Sample2 Cell 3 Sample3 Cell 4 Sample4 Cell 5 Sample5 START:Meas.:_ Sample setting screen <2>...
- Page 140 3.2 Automatic Continuous Measurement (6-cell auto mode) (2) During measurement, the screen shown in Fig. 3-45 is displayed. Photometry 280.0nm 0.268ABS CELL A 3 WL1 ( 260.0nm) WL2 ( 280.0nm) ABS DIFF= ABS Ratio= Meas.Sample3... Fig. 3-45 Screen Displayed during Sample Measurement (3) When “6”...
- Page 141 3.2.3 Photometry CELL A 10 WL1 ( 260.0nm) 0.423 WL2 ( 280.0nm) 0.268 ABS DIFF= 0.155 ABS Ratio= 1.582 START:Continue; Select function.: _ □ Meas. □ Save □ Print Fig. 3-47 Example of Display after Sample Measurement (number of samples: 10) Table 3-34 Guidance after Sample Measurement Setting Item Description...
- Page 142 ( 10/ 10) [2] Save You can save the measured data. When this function is selected, the following screen appears. Save Data CELL A 1 NO3-(Hitachi Taro) PHT 2010/10/10 2 Cr6+(Hitachi Hanako) PHT 2010/03/30 Select function. : _ □ Save □...
-
Page 143: Measuring A Spectrum
3.2.4 3.2.4 Measuring a Spectrum This instrument is capable of measuring the transmission spectrum and absorption spectrum. By setting the blank to cell A, one sample can be measured after automatic execution of baseline correction. GUIDE: When auto start is specified, the system automatically sets up the conditions and advances to the measurement screen phase of sequence after the power switch is turned on. - Page 144 3.2 Automatic Continuous Measurement (6-cell auto mode) WL Scan CELL A 1 Meas.PARAM. Data Mode 2 Sample Start WL(nm) 600.0 3 6 Cell End WL(nm) 400.0 4 System Upper Scale 1.000 5 Peak PARAM. Lower Scale 0.000 6 Print Scan Speed 7 Save Method Delay(s) 8 Meas.Screen...
- Page 145 3.2.4 Table 3-35 “Meas. PARAM.” Setting Parameters Setting Item Description Data Mode Determine the unit of scale on the Y axis. [1] ABS : Used for measuring the absorption spectrum (spectrum with absorbance on the Y axis). [2] %T : Used for measuring the transmission spectrum (spectrum with transmittance on the Y axis).
- Page 146 3.2 Automatic Continuous Measurement (6-cell auto mode) (cont’d) Setting Item Description Data Int. Set up a data interval. “Normal” and “Fine” are selectable. [1] Normal : Usually selected. [2] Fine Permits measurement at short data intervals as compared with Normal. However, noise is more likely to be generated on a spectrum, because the data acquisition time per point is...
- Page 147 3.2.4 (2) The sample condition (Sample) screen (Fig. 3-51) appears. Enter a sample name here. For details, refer to Table 3-36. After input, return to the WL Scan screen by pressing the [ENTER] key or [◄] key. WL Scan CELL A ^1 Meas.PARAM.
- Page 148 3.2 Automatic Continuous Measurement (6-cell auto mode) (2) The 6-cell condition (6 Cell) screen (Fig. 3-52) appears. To set each item on the 6-cell condition (6 Cell) screen, press the [ENTER] key. Or select each item with the [▲] or [▼] key and make your setting according to the guidance.
- Page 149 3.2.4 (2) The system condition (System) setting screen (Fig. 3- 53) appears. Set a response according to the guidance. For detail, refer to Table 3-38. WL Scan CELL A ^1 Meas.PARAM. Response Medium 2 Sample 3 6 Cell 4 System 5 Peak PARAM.
- Page 150 3.2 Automatic Continuous Measurement (6-cell auto mode) WL Scan CELL A ^1 Meas.PARAM. Threshold 0.010 2 Sample Sensitivity 3 6 Cell 4 System 5 Peak PARAM. 6 Print ^7 Save Method 8 Meas.Screen Input value. : _ Threshold[0.001-1.000] Fig. 3-54 Peak Detection Condition (Peak PARAM.) Setting Screen Table 3-39 “Peak PARAM.”...
- Page 151 3.2.4 (cont’d) Setting Item Description Sensitivity Set up a condition for detecting a peak and valley from the measured spectrum. It is sensitivity that determines the detectability in the X-axis direction of a spectrum. For detection of a sharp peak, select sensitivity 1. For detection of a broad peak, select sensitivity 8.
- Page 152 3.2 Automatic Continuous Measurement (6-cell auto mode) Explanation 3-9 Peak Detection Sensitivity The setting of peak detection sensitivity is employed for judging whether data has increased or decreased by comparing the data at the present base point and the data after N points, based on which a peak will be detected.
- Page 153 3.2.4 Setting of Printing Conditions GUIDE: Specify print items if determined beforehand. You can also specify print items after completion of measurement. If you do not want to set the printing conditions here, proceed to step 8. (1) To set the printing conditions, press the <6> key (Print) and then [ENTER] key.
- Page 154 3.2 Automatic Continuous Measurement (6-cell auto mode) Table 3-40 “Print” Setting Parameters Location in Setting Item Description Fig. 3-56 ⎯ Auto Print [1] ON : Automatic printing is carried out after measurement. [2] OFF : Automatic printing is not carried out after measurement.
- Page 155 400.0 650.0 nm 462.5 525.0 587.5 ……….. <2> Sample Name: File Name: Run Date: 2010/04/10 13:34 Operator: Spectrophotometer Model: U-5100 Spectrophotometer Serial No.: 1234-567 ROM VER.: 3J25300 Option: Instrument Meas.Mode: WL Scan Response: Medium Data Mode: Bandpass(nm): <3> Start WL(nm):...
- Page 156 3.2 Automatic Continuous Measurement (6-cell auto mode) Meas.PARAM. CELL A 1 NO3-(Hitachi Taro) PHT 2010/10/10 2 Cr6+(Hitachi Hanako) PHT 2010/03/30 File name Measurement Saving mode date File Name:_ File Name [Max: 20 characters] ( 1/ 1) Fig. 3-57 Measuring Condition Saving (Save...
- Page 157 3.2.4 (5) Return to the WL Scan screen by pressing the [RETURN] key. Setting and Measurement of Samples (1) To determine the measuring conditions set in the preceding steps, press the <8> key (Meas. Screen) and then [ENTER] key. Or press the [MEAS. SCREEN] key.
- Page 158 3.2 Automatic Continuous Measurement (6-cell auto mode) In WL Scan mode, the spectrum of each sample NOTE: cannot be automatically saved. So the save or print operation is required for each sample. WL Scan CELL A 0.800 0.000 400.0 525.0 650.0nm START:Meas.;...
- Page 159 Setting Item Description [3] Save You can save the measured spectrum. When this function is selected, the following screen appears. Save Data CELL A 1 NO3-(Hitachi Taro) WLS 2010/10/10 2 Cr6+(Hitachi Hanako) WLS 2010/03/30 Select function. : _ □ Save □...
- Page 160 3.2 Automatic Continuous Measurement (6-cell auto mode) (2) Before proceeding to the next measurement, the system displays the data deletion confirming screen (Fig. 3-60). When data has already been saved or printed, select the <1> key (Yes). If data has not yet been saved or printed, select the <2>...
-
Page 161: Sample-By-Sample Measurement (6-Cell Manual Mode)
3.3 Sample-by-sample Measurement (6-cell manual mode) Samples are measured one by one. This mode is suitable for measurement of multiple samples with 2 cells (one for auto zero). By pressing the [Autozero] key, it is possible to correct the absorbance to zero with cell A set in advance. →section3.3.1. -
Page 162: Determining Concentration Of Solution
3.3 Sample-by-sample Measurement (6-cell manual mode) 3.3.1 Determining Concentration of Solution This instrument is used for generating a calibration curve and determining the concentration of an unknown sample, and for entering a calibration factor and determining the concentration. GUIDE: When auto start is specified, the system automatically sets up the conditions and advances to the measurement screen phase of sequence after the power switch is turned on. - Page 163 3.3.1 (2) The 6-cell condition (6 Cell) screen (Fig. 3-62) appears. Photometry CELL A 1 Meas.PARAM. 6 Cell Mode Auto 2 Sample STD Autozero STD1 3 Curve SAMP.Autozero 4 Curve Data Autozero int. 5 6 Cell No.of Sample 6 System 7 Print 8 Save Method 9 Meas.Screen...
- Page 164 3.3 Sample-by-sample Measurement (6-cell manual mode) Setting of System Conditions Setting of Printing Conditions * For steps 7 and 8, refer to section 3.2.1.. Measurement of Standard Solutions GUIDE: When 2) Factor is selected for Curve Type in step 4, standard solution measurement is not carried out.
- Page 165 3.3.1 Explanation 3-10 Auto Zero Method (without coloring reagent) Standard solution Sample solution Absorbance of Analyte of interest analyte Absorbance-zero line by auto Solvent zero with <1> Cell <3> <1> <2> <4> STD3 STD1 STD2 Sample Elements causing absorbance without using coloring reagent (not containing interfering substance) A measured absorbance value is given as a total of absorptions due to various elements (cell, solvent, coloring reagent, analyte of interest, interfering substance).
- Page 166 3.3 Sample-by-sample Measurement (6-cell manual mode) Explanation 3-11 Auto Zero Method (with coloring reagent) Sample solution Standard solution Absorbance of Analyte of interest analyte Coloring reagent Absorbance-zero line by auto zero with <1> Solvent Cell <0> <1> <2> <3> <4> Blank (solvent STD1 STD2...
- Page 167 3.3.1 (3) The standard measurement screen (Fig. 3-64) appears. At this time, the cell position shifts to cell 1. For measurement at a different position, hold down the [SHIFT] key and press the [◄] or [►] to shift the cell position.
- Page 168 3.3 Sample-by-sample Measurement (6-cell manual mode) Figure 3-65 shows the standard setting screen. On the screen, displayed from the left are the standard name, measured absorbance and standard concentration. Measurement is carried out sequentially starting from STD1, until the specified number of standards are all measured.
- Page 169 3.3.1 (5) Upon completion of measurement, the absorbance of STD1 is indicated on the screen (Fig. 3-67). This screen appears after completion of measurement of each standard. Pressing the [START] key here starts measurement of the next standard (STD2). Pressing the <1> key (Curve Confirmation) or <2> key (Remeasure) allows the processing shown in Table 3- Photometry CELL 1...
- Page 170 3.3 Sample-by-sample Measurement (6-cell manual mode) (6) When the specified number of standards have all been measured, the screen shown in Fig. 3-68 appears. When the <1> key (Sample Meas.) is pressed, the system terminates standard measurement and proceeds to sample measurement. Pressing the <2> key (Curve) or <3>...
- Page 171 You can save the measured standard data. When this function is selected, the following screen appears. Save Data CELL A 1 NO3-(Hitachi Taro) PHT 2010/10/10 2 Cr6+(Hitachi Hanako) PHT 2010/03/30 Select function. : _ □ 1 Save □ 2 Sort ◄...
- Page 172 3.3 Sample-by-sample Measurement (6-cell manual mode) (cont’d) Setting Item Description [4] Print You can select items to be printed. When this function is selected, the screen given below appears. For each item, specify whether to print out (ON or OFF). Photometry CELL A Print...
- Page 173 3.3.1 Auto zero can be executed by pressing the [AUTOZERO] key when the guidance on sample setting is indicated. For details, refer to Fig. 3-70. <1> Check that a guide message “START: Meas. SampleXX:_” is displayed. For carrying out auto zero, auto zero sample should be set to cell A.
- Page 174 3.3 Sample-by-sample Measurement (6-cell manual mode) Photometry CELL 1 Sample name CONC 0.15 15.04 Sample concentration Measured absorbance START:Meas.SAMP.2; Select FUNC..:_ □ 1 Curve Confirmation □ 2 Remeasure Fig. 3-71 Sample Measurement Screen (3) When measurement is stopped by pressing the [STOP]key or 150 samples have been measured, the screen shown in Fig.
- Page 175 3.3.1 Table 3-45 Guidance after Measurement of All Samples Setting Item Description [1] Meas. You can make setting related to measurement. “New Meas.”, “Continue” and “Remeasure” are selectable. [1] New Meas. : Selected when newly measuring samples with the same calibration curve.
- Page 176 [3] Save You can save the measured data. When this function is selected, the following screen appears. Save Data CELL A 1 NO3-(Hitachi Taro) PHT 2010/10/10 2 Cr6+(Hitachi Hanako) PHT 2010/03/30 Select function. : _ □ 1 Save □ 2 Sort ◄...
- Page 177 3.3.1 (cont’d) Setting Item Description [4] Print You can select items to be printed. When this function is selected, the screen given below appears. For each item, select whether to print out (ON or OFF). Photometry CELL A Print Print Date Run Date Method Curve...
-
Page 178: Measuring Absorbance/Transmittance
3.3 Sample-by-sample Measurement (6-cell manual mode) 3.3.2 Measuring Absorbance/Transmittance This instrument is used for generating a calibration curve and determining the concentration of an unknown sample, and for entering a calibration factor and determining the concentration. GUIDE: When auto start is specified, the system automatically sets up the conditions and advances to the measurement screen phase of sequence after the power switch is turned on. - Page 179 3.3.2 Photometry CELL A 1 Meas.PARAM. 6 Cell Mode Auto 2 Sample SAMP.Autozero 3 6 Cell Autozero int. 4 Print No.of Sample 5 Save Method 6 Meas.Screen Select function. : _ □ 1 Auto □ 2 Manual Fig. 3-73 6-cell Condition (6 Cell) Screen (3) To set each item on the 6-cell condition (6 Cell) screen, press the [ENTER] key.
- Page 180 3.3 Sample-by-sample Measurement (6-cell manual mode) Setting of Printing Conditions Saving of Measuring Conditions * For steps 5 and 6, refer to section 3.2.2.. Upon completion of setting, press the <6> key (Meas. Screen) and then [ENTER] key or press the [MEAS. SCREEN] key to determine the measuring conditions.
- Page 181 3.3.2 Photometry CELL 1 START:Meas. Sample1:_ Fig. 3-75 Sample Measurement Screen Auto zero can be executed by pressing the [AUTOZERO] key when the guidance on sample setting is indicated. For details, refer to Fig. 3-76. <1> Check that a guide message “START: Meas. SampleXX:_”...
- Page 182 3.3 Sample-by-sample Measurement (6-cell manual mode) (3) After measurement of a sample, its measured absorbance is indicated at the corresponding sample position on the screen. This screen appears after measurement of each sample. Pressing the [START] key again starts measurement of the next sample. Starting from the 1st sample, measurement can be made until the [STOP] key is pressed or up to 150 samples.
- Page 183 3.3.2 Table 3-47 Guidance after Measurement of All Samples Setting Item Description [1] Meas. You can make setting related to measurement. “New Meas.”, “Continue” and “Remeasure” are selectable. [1] New Meas. : Selected when newly measuring samples with the same calibration curve.
- Page 184 [2] Save You can save the measured data. When this function is selected, the following screen appears. Save Data CELL A 1 NO3-(Hitachi Taro) PHT 2010/10/10 2 Cr6+(Hitachi Hanako) PHT 2010/03/30 Select function. : _ □ 1 Save □ 2 Sort ◄...
-
Page 185: Measuring Dna Sample (Measurement Through Ratio Calculation)
3.3.3 3.3.3 Measuring DNA Sample (measurement through ratio calculation) This instrument is capable of measuring the absorbance (at 230 nm, 260 nm, 280 nm and 320 nm) of a DNA sample and calculating the absorbance ratio (A260/A280 and A260/A230) for check of the DNA purity. The instrument is also used for measuring the absorbance at 2 wavelengths and calculating the absorbance ratio or absorbance difference between the values thus obtained. - Page 186 3.3 Sample-by-sample Measurement (6-cell manual mode) Photometry CELL A 1 Meas.PARAM. 6 Cell Mode Auto 2 Sample SAMP.Autozero ON 3 6 Cell Autozero int. 4 Print No.of Sample 5 Save Method 6 Meas.Screen Select function. : _ □ 1 Auto □ 2 Manual Fig.
- Page 187 3.3.3 Setting of Printing Conditions Saving of Measuring Conditions * For steps 5 and 6, refer to section 3.3.3.. Upon completion of setting, press the <6> key (Meas. Screen) and then [ENTER] key or press the [MEAS. SCREEN] key to determine the measuring conditions.
- Page 188 3.3 Sample-by-sample Measurement (6-cell manual mode) Photometry CELL 1 1 WL1 ( 260.0 nm) ( 280.0 nm) ABS DIFF= ABS Ratio= START:Meas. Sample1:_ Fig. 3-81 Sample Measurement Screen Auto zero can be executed by pressing the [AUTOZERO] key when the guidance on sample setting is indicated.
- Page 189 3.3.3 (3) After measurement of a sample, its absorbance is indicated on the screen. This screen appears after measurement of each sample. Pressing the [START] key again starts measurement of the next sample. Starting from the 1st sample, measurement can be made until the [STOP] key is pressed or up to 150 samples.
- Page 190 3.3 Sample-by-sample Measurement (6-cell manual mode) Table 3-49 Guidance after Measurement of All Samples Setting Item Description [1] Meas. You can make setting related to measurement. “New Meas.”, “Continue” and “Remeasure” are selectable. [1] New Meas. : Selected when newly measuring samples with the same calibration curve.
- Page 191 [2] Save You can save the measured data. When this function is selected, the following screen appears. Save Data CELL A 1 NO3-(Hitachi Taro) PHT 2010/10/10 2 Cr6+(Hitachi Hanako) PHT 2010/03/30 Select function. : _ □ 1 Save □ 2 Sort ◄...
-
Page 192: Measuring A Spectrum
3.3 Sample-by-sample Measurement (6-cell manual mode) 3.3.4 Measuring a Spectrum This instrument is capable of measuring the transmission spectrum and absorption spectrum. By setting the blank to cell A, one sample can be measured after automatic execution of baseline correction. GUIDE: When auto start is specified, the system automatically sets up the conditions and advances to the measurement screen phase of sequence after the power switch is turned on. - Page 193 3.3.4 (2) The 6-cell condition (6 Cell) screen (Fig. 3-85) appears. To set each item on the 6-cell condition (6 Cell) screen, press the [ENTER] key. Or use the [▲] or [▼] key. Select “Manual” for 6 Cell Mode and specify the number of samples to be measured for No.
- Page 194 3.3 Sample-by-sample Measurement (6-cell manual mode) Baseline Correction (1) To determine the measuring conditions set in the preceding steps, press the <8> key (Meas. Screen) and then [ENTER] key. Or press the [MEAS. SCREEN] key. (2) The guidance on baseline correction (Fig. 3-86) appears.
- Page 195 3.3.4 WL Scan CELL A 0.800 0.000 400.0 525.0 650.0 nm START:Meas.Sample. RETURN:Execute baseline CORR. Fig. 3-87 Sample Measurement Screen (2) After completion of measurement, the screen shown in Fig. 3-88 appears. Pressing the <1> to <5> keys allows the processings given in Table 3-51. For proceeding to the next sample measurement, press the [START] key.
- Page 196 [3] Save You can save the measured spectrum. When this function is selected, the following screen appears. Save Data CELL A 1 NO3-(Hitachi Taro) WLS 2010/10/10 2 Cr6+(Hitachi Hanako) WLS 2010/03/30 Select function. : _ □ 1 Save □ 2 Sort ◄...
- Page 197 3.3.4 (cont’d) Setting Item Description [4] Print You can select items to be printed. When this function is selected, the screen given below appears. For each item, select whether to print out (ON or OFF). Photometry CELL A Print Print Date Run Date Method Graph...
-
Page 198: Measuring Change With Time
3.3 Sample-by-sample Measurement (6-cell manual mode) 3.3.5 Measuring Change with Time This instrument is used for measuring the sample absorbance/transmittance change with time. You can evaluate the sample deterioration or enzyme activity based on the absorbance change thus obtained. GUIDE: When auto start is specified, the system automatically sets up the conditions and advances to the measurement screen phase of sequence after the power switch is turned on. - Page 199 3.3.5 Time Scan CELL A 1 Meas.PARAM. Data Mode 2 Sample WL(nm) 500.0 3 System Scan Time (s) 4 Print Upper Scale 1.000 5 Save Method Lower Scale 0.000 6 Meas.Screen Delay(s) Select function. : _ Fig. 3-91 Time Scan Screen (3) The measuring condition (Meas.
- Page 200 3.3 Sample-by-sample Measurement (6-cell manual mode) (cont’d) Setting Item Description Scan Time (s) Specify a scan time. This parameter is specifiable in a range of 60 to 99999 sec in steps of 1 sec. The data interval differs depending on the scan time.
- Page 201 3.3.5 Setting of Sample Conditions (1) To set the sample conditions, press the <2> key (Sample) and then [ENTER] key. Or select “Sample” with the [▲] or [▼] key and press the [ENTER] key or [►] key. (2) The sample condition (Sample) screen (Fig. 3-93) appears.
- Page 202 3.3 Sample-by-sample Measurement (6-cell manual mode) Setting of System Conditions (1) To set the system conditions, press the <3> key (System) and then [ENTER] key. Or select “System” with the [▲] or [▼] key and press the [ENTER] key or [►] key.
- Page 203 3.3.5 Setting of Printing Conditions GUIDE: Specify print items if determined beforehand. You can also specify print items after completion of measurement. If you do not want to set the printing conditions here, proceed to step 6. (1) To set the printing conditions, press the <4> key (Print) and then [ENTER] key.
- Page 204 3.3 Sample-by-sample Measurement (6-cell manual mode) Table 3-54 “Print” Setting Parameters Setting Location in Description Item Fig. 3-98 ⎯ Auto Print [1] ON Automatic printing is carried out after measurement. [2] OFF : Automatic printing is not carried out after measurement.
- Page 205 <4> -0.1 15.0 30.0 45.0 60 s Sample Name: File Name: <2> Run Date: 2010/04/10 13:34 Operator: Spectrophotometer Model: U-5100 Spectrophotometer Serial No.: 1234-567 ROM Ver.: 3J25300 Option: Instrument Meas.Mode: Time Scan Response: Medium Data Mode: Bandpass(nm): <3> WL (nm):...
- Page 206 “Save Method” with the [▲] or [▼] key and press the [ENTER] key or [►] key. (2) The measuring condition saving (Save Method) screen (with saved data) (Fig. 3-97) appears. Save Method CELL A 1 NO3-(Hitachi Taro) TMS 2010/10/10 2 Cr6+(Hitachi Hanako) TMS 2010/03/30 Saving File name...
- Page 207 3.3.5 • If a file of the same name as entered already NOTE: exists in the same measurement mode, the following guidance appears. Already exists. Overwrite it? :_ [1]Yes [2]No For overwriting, press the <1> key (Yes). To avoid overwriting, press the <2> key (No) and rename the file to be saved.
- Page 208 3.3 Sample-by-sample Measurement (6-cell manual mode) Photometry 600.0 nm 0.000 ABS CELL A [Info] Set autozero sample to Cell A. AUTOZERO:Execute Autozero; CLEAR:Cancel Fig. 3-98 Auto Zero Execution Screen (3) After execution of auto zero, the sample measurement screen (Fig. 3-99) appears. Set a sample at the present cell position and press the [START] key to start measurement.
- Page 209 3.3.5 <1> Check that a guide message “START: Start Meas.:_” is displayed. For carrying out auto zero, auto zero sample should be set to cell A. START:Meas.: _ Sample Measurement Screen <2> Set an auto zero sample, close the cover and press the [AUTOZERO] key.
- Page 210 Save Data CELL A 1 NO3-(Hitachi Taro) PHT 2010/10/10 2 Cr6+(Hitachi Hanako) PHT 2010/03/30 Select function. : _ □ 1 Save □ 2 Sort ◄ ► ( 1/ 1) [1] Save : Allows you to save data under a new file name.
-
Page 211: Measurement With Enlarged Display Screen (Monitor)
3.4 Measurement with Enlarged Display Screen (monitor) This instrument displays a photometric value in enlarged size on the monitor. This function is effective in carrying out measurement while monitoring the photometric value at a wavelength. Described below is the operating procedure for measurement with this function. GUIDE: When auto start is specified, the system automatically sets up the conditions and advances to the measurement screen phase of sequence after the power switch is turned on. - Page 212 3.4 Measurement with Enlarged Display Screen (monitor) Presentation of Enlarged Display Screen (monitor) The enlarged display screen (Fig. 3-103) appears. At this time, the lamp turns on automatically and measurement starts. In the upper part of the monitor, the current wavelength setting is displayed, and a photometric value in the lower part.
- Page 213 Data Display CELL 1 1100.0 Data: -.--- Select function. : _ 1)ABS 2)%T 3)Lamp ON Fig. 3-104 Enlarged Display Screen with Lamp Off Measurement of Sample (1) Confirm the cell position display screen. When the 6- cell holder is connected, move to the aimed-at cell position by pressing the [◄] or [►] key with the [SHIFT] key held down.
- Page 214 3.4 Measurement with Enlarged Display Screen (monitor) (5) When the printer is connected, print the wavelength and photometric value by pressing the [PRINT] key. (Example of Printout) 500.0 nm 0.203 Abs (6) After completion of measurement, return to the previous screen by pressing the [RETURN] key. 3 - 150...
-
Page 215: For More Efficient Operation
4.1.1 4. FOR MORE EFFICIENT OPERATION Explained here is usage of the advanced-level functions for more efficient operations of this product. Read this section so that you can get a smoother control of the product. 4.1 Loading or Deleting the Saved Data Described below are operation methods such as loading and deletion of the saved data. - Page 216 [▲]/[▼] key and press the <1> key (for Load). For other keys, refer to Table 4-2. Load/Delete Data CELL A 1 NO3-(Hitachi Taro) PHT 2010/10/10 2 Cr6+(Hitachi Hanako) PHT 2010/03/30 3 Stability TMS 2010/05/05 4 Vitamin A WLS 2010/02/24 File name...
- Page 217 The alphabetical order of file names is selected by default. (4) The data is now loaded. At this time, U-5100 is set to same Method as read Data. (However, exclude it when Data of Auto Sipper [another sales] was opened while using 6- Cell holder and when 6- Cell holder is opened while using Auto Sipper.
-
Page 218: Deleting The Saved Data
4.1 Loading or Deleting the Saved Data 4.1.2 Deleting the Saved Data Startup of This Product Start up this product. (For startup method, see section 2.3.1..) Data Deleting Procedure (1) Press the [MAIN MENU] key. The Main Menu screen (shown in Fig. 4-4) appears. Press the <5> key (for Data Menu) and then the [ENTER] key or press the [▲]/[▼] key to select Data Menu and then the [ENTER] key. - Page 219 For other keys, refer to Table 4-4. Data, once deleted, cannot be recovered. NOTE: Careful confirmation is required before data deletion. Load/Delete Data CELL A 1 NO3-(Hitachi Taro) PHT 2010/10/10 2 Cr6+(Hitachi Hanako) PHT 2010/03/30 3 Stability TMS 2010/05/05 4 Vitamin A...
- Page 220 4.1 Loading or Deleting the Saved Data Table 4-4 Guidance for Load/Delete Data Screen Function Key Explanation [1] Load Loads the file which is now selected. [2] Delete Deletes the file which is now selected. [3] Check Enables you to check the outline of the Method in the presently selected file.
-
Page 221: Printing The List Of Saved Data
4.1.3 4.1.3 Printing the List of Saved Data Startup of This Product Start up this product. (For startup method, see section 2.3.1..) Display of Print List Screen (1) Press the [MAIN MENU] key. The Main Menu screen (shown in Fig. 4-7) appears. Press the <5> key (for Data Menu) and then the [ENTER] key or press the [▲]/[▼] key to select Data Menu and then the [ENTER] key. - Page 222 “Type” denotes the type of Method in an abbreviation listed in Table 4-5. Load/Delete Data CELL A 1 NO3-(Hitachi Taro) PHT 2010/10/10 2 Cr6+(Hitachi Hanako) PHT 2010/03/30 3 Stability TMS 2010/05/05 4 Vitamin A WLS 2010/02/24 File name...
- Page 223 (Date and Time). The alphabetical order of file names is selected by default. Select function.:_ [1] File Name, [2] Date and Time Data List File Name Type Date NO3-(Hitachi Taro) 2010/10/10 Cr6+(Hitachi Hanako) 2010/03/30 Stability 2010/05/05 Vitamin A 2010/02/24 Fig.
-
Page 224: Photometry Based On Saved Calibration Curve Data
4.1 Loading or Deleting the Saved Data 4.1.4 Photometry Based on Saved Calibration Curve Data Startup of this product Start up this product. (For startup method, see section 2.3.1..) Calibration Curve Data Loading Procedure (1) Press the [MAIN MENU] key. The Main Menu screen (Fig. - Page 225 [▲]/[▼] key to select Load/Delete Data and then the [ENTER] key. The Load/Delete Data screen (Fig. 4-13) appears. Load/Delete Data CELL A 1 NO3-(Hitachi Taro) PHT 2010/10/10 2 Cr6+(Hitachi Hanako) PHT 2010/03/30 Date of file File name...
- Page 226 4.1 Loading or Deleting the Saved Data when the data of sample measurement is included. If wavelength scan or time scan data is opened, the calibration curve data cannot be found. Therefore, you must return to Step 2 “Calibration Curve Data Loading Procedure”...
- Page 227 4.1.4 (2) Set a sample for auto zero and execute auto zero. Then, measure the sample. Thus, sample measurement can be performed with the saved calibration curve. 4 - 13...
-
Page 228: Loading And Deleting The Saved Method
4.2 Loading and Deleting the Saved Method 4.2 Loading and Deleting the Saved Method Introduced here is the photometric method by way of loading the saved Method. 4.2.1 Measurement via Loading of Saved Method Startup of This Product Start up this product. (For startup method, see section 2.3.1..) Method Loading Procedure (1) After completion of initial setting, the Main Menu... - Page 229 Load/Delete Data) and then the [ENTER] key or press the [▲]/[▼] key to select Load/Delete Data and then the [ENTER] key. Load/Delete Method CELL A 1 NO3-(Hitachi Taro) PHT 2010/10/10 2 Cr6+(Hitachi Hanako) PHT 2010/03/30 Date of file File name...
- Page 230 4.2 Loading and Deleting the Saved Method selected. When Method is not read, [2]No is selected. Please refer to Table 4-7 for details. Table 4-7 Set state of U-5100 when measurement condition is opened Opening Method U-5100 Condition 6 Cell Mode ON...
-
Page 231: Deletion Of Saved Method
4.2.2 4.2.2 Deletion of Saved Method Startup of This Product Start up this product. (For startup method, see section 2.3.1..) Call-up of Load/Delete Method Screen (1) Press the [MAIN MENU] key. The Main Menu screen (Fig. 4-19) appears. Main Menu CELL A 1 Photometry 2 WL Scan... - Page 232 Data, once deleted, cannot be recovered. NOTE: Careful confirmation is required before data deletion. Load/Delete Method CELL A 1 NO3-(Hitachi Taro) PHT 2010/10/10 2 Cr6+(Hitachi Hanako) PHT 2010/03/30 Date of file File name saving Measurement mode Select function. :_ [1]Load [2]Delete [3]Check [4]Type [5]Sort ◄...
- Page 233 4.2.2 Table 4-9 Guidance for Load/Delete Method Screen Function Key Explanation [1] Load Loads the file which is now selected. [2] Delete Deletes the file which is now selected. [3] Check Enables you to check the outline of the Method in the presently selected file.
-
Page 234: Printing The List Of Saved Methods
4.2 Loading and Deleting the Saved Method 4.2.3 Printing the List of Saved Methods Startup of This Product Start up this product. (For startup method, see section 2.3.1..) Display of Method List Screen (1) Press the [MAIN MENU] key. The Main Menu screen (shown in Fig. - Page 235 “Type” denotes the type of Method in an abbreviation listed in Table 4-10. Print Method List CELL A 1 NO3-(Hitachi Taro) PHT 2010/10/10 2 Cr6+(Hitachi Hanako) PHT 2010/03/30 3 Stability...
- Page 236 (Date and Time). The alphabetical order of file names is selected by default. Select function.:_ [1] File Name, [2] Date and Time Method List File Name Type Date NO3-(Hitachi Taro) 2010/10/10 Cr6+(Hitachi Hanako) 2010/03/30 Stability 2010/05/05 Vitamin A 2010/02/24 Fig.
-
Page 237: Data Processing
4.3.1 4.3 Data Processing Explanation is given here on data processing of calibration curve, spectrum and time-scan measurement. 4.3.1 Scale Change of Calibration Curve Display of Calibration Curve Data [Confirmation from saved data] For check by opening the saved data, open the photometric data including the saved calibration curve data according to “4.1.1 Loading the Saved Data.”... - Page 238 4.3 Data Processing Scale Changing Procedure (1) Calibration curve data is now opened. Select the <1> key (for Scale). Photometry/Curve CELL A R = 0.9999 R2 = 0.9999 0.893 0.001 0.000 CONC 90.000 Select function. :_ [1]Scale [2]Factor [3]STD Fig. 4-27 Calibration Curve Data (2) Scale Change screen (Fig.
- Page 239 4.3.1 Table 4-12 Scale Changing Parameters Parameter Explanation X-Max Sets the maximum value on the X axis (representing the concentration of standard solution) of calibration curve. Settable within -9999 to -0.001, 0, 0.001 to 9999 (indication in max. 4 digits). Change on the set axis is adopted by pressing the [RETURN] key.
-
Page 240: How To Check Calibration Curve Factor, Correlation Coefficient And Determination Coefficient
4.3 Data Processing 4.3.2 How to Check Calibration Curve Factor, Correlation Coefficient and Determination Coefficient Display of Calibration Curve Data [Confirmation from saved data] For check by opening the saved data, open the photometric data including the saved calibration curve data according to “4.1.1 Loading the Saved Data.”... - Page 241 4.3.2 (2) Calibration Curve Factor Confirmation screen (Fig. 4- 31) appears. On this screen, calibration curve factor, correlation coefficient and determination coefficient can be set. For each parameter (setting item), refer to Table 4-13. Photometry/Curve CELL A Curve Factor ABS = f(CONC) A0 = 0 A1 = 1.000 Correlation Coef.
- Page 242 4.3 Data Processing Explanation 4-1 Calculation Formulae for Concentration Difference, Correlation Coefficient, Determination Coefficient, etc. of Calibration Curve Introduced below are calculation formulae for evaluating a calibration curve. Absorbance value obtained by measuring standard samples Averaged absorbance value obtained by measuring standard samples Concentration of each standard stdn...
-
Page 243: Deletion And Recovery Of Calibration Curve Data
4.3.3 4.3.3 Deletion and Recovery of Calibration Curve Data Displaying Calibration Curve Data [For check from saved data] For check by opening the saved data, open the photometric data including the saved calibration curve data according to section 4.1.1. Upon opening the calibration curve data, a guidance (an example shown in Fig. - Page 244 4.3 Data Processing (2) Each standard data is now displayed as shown below. Photometry/Curve CELL A CONC STD1 0.001 0.000 STD2 0.099 10.00 STD3 0.203 20.00 STD4 0.300 30.00 STD5 0.405 40.00 Select function. :_ [1] Remeasure [2] Delete [3] Recover Fig.
-
Page 245: Scale Change (Wavelength/Time Scan Data)
4.3.4 4.3.4 Scale Change (Wavelength/Time Scan Data) Displaying Data [For check from saved data] For check by opening the saved data, open the saved wavelength scan data or time scan data according to section 4.1.1 . [During measurement] When measurement is in progress with WL Scan or Time Scan selected in Main Menu, you should wait till the end of the measurement. - Page 246 4.3 Data Processing Changing the Scale For wavelength scan data, the scale change screen for wavelength scan (Fig. 4-37) will appear. For time scan data, the scale change screen for time scan (Fig. 4-38) will appear. On each screen, scale change, scale resetting and auto scale operation can be set.
- Page 247 4.3.4 Table 4-15 Scale Changing Parameters for Wavelength Scan Function Key Explanation X-Max Sets the maximum value on the X axis (wavelength axis) of spectrum. Settable within 191.0 to 1100.0. For adopting and changing the set axis, return to the spectrum screen by pressing the [RETURN] key.
- Page 248 4.3 Data Processing Table 4-16 Scale Changing Parameters for Time Scan Function Key Explanation X-Max Sets the maximum value on the X axis (time axis) of spectrum. Settable within 10 to 99999. For adopting and changing the set axis, return to the spectrum screen by pressing the [RETURN] key.
-
Page 249: Peak Detection (Wavelength Scan Data)
4.3.5 4.3.5 Peak Detection (Wavelength Scan Data) Displaying Data [For check from saved data] For check by opening the saved data, open the saved wavelength scan data according to section 4.1.1. [During measurement] When measurement is in progress with WL Scan selected in Main Menu, you should wait till the end of the measurement. - Page 250 4.3 Data Processing Peak Detection Screen (1) The peak detection screen (Fig. 4-41) is now opened. The peak and valley detected according to the peak parameters set for measurement are indicated by + marks at the peak positions on the spectral profile. When plural peaks and valleys have been detected, you can move to different peak/valley by pressing the [◄]/[►] key.
- Page 251 4.3.5 Table 4-17 Peak Detection Data Processing Function Key Explanation [1] Peak PARAM. Used for changing the peak and valley detection parameters. For details of each parameter, refer to Table 3-39 which lists calculation parameters. WL Scan/Peak CELL A Peak PARAM. Threshold 0.010 Sensitivity...
-
Page 252: Data Tracing (Wavelength/Time Scan Data)
4.3 Data Processing 4.3.6 Data Tracing (Wavelength/Time Scan Data) Displaying Data [For check from saved data] For check by opening the saved data, open the saved wavelength scan data or time scan data according to section 4.1.1.. [During measurement] When measurement is in progress with WL Scan or Time Scan selected in Main Menu, you should wait till the end of the measurement. - Page 253 4.3.6 (2) For wavelength scan data, the guidance for wavelength scan (Fig. 4-44) is displayed. And, for time scan data, the guidance for time scan (Fig. 4-45) is displayed. On each screen, select the <1> key (for Trace). Select function. :_ [1]Trace [2]Peak [3]Smoothing [4]List Fig.
- Page 254 4.3 Data Processing Time Scan/Trace CELL A 75 sec 0.402 ABS 0.800 + 0.000 60.0 120s ◄ ► Fig. 4-47 Time Scan/Trace Screen 4 - 40...
-
Page 255: Data Smoothing (Wavelength/Time Scan Data)
4.3.7 4.3.7 Data Smoothing (Wavelength/Time Scan Data) Displaying Data [For check from saved data] For check by opening the saved data, open the saved wavelength scan data or time scan data according to section 4.1.1.. [During measurement] When measurement is in progress with WL Scan or Time Scan selected in Main Menu, you should wait till the end of the measurement. - Page 256 4.3 Data Processing Time Scan CELL A 0.800 0.000 60.0 120 s START:Meas.; Select function.:_ [1]Data [2]Scale [3]Save [4]Print Fig. 4-49 Time Scan Data (2) For wavelength scan data, the guidance for wavelength scan (Fig. 4-50) is displayed. In this guidance, select the <3>...
- Page 257 4.3.7 WL Scan/Smoothing CELL A 0.800 0.000 400.0 525.0 650.0 nm Select function. :_ [1]Smoothing [2]Reset Fig. 4-52 WL Scan/Smoothing Screen Time Scan/Smoothing CELL A 0.800 0.000 60.0 120 s Select function. :_ [1]Smoothing [2]Reset Fig. 4-53 Time Scan/Smoothing Screen 4 - 43...
-
Page 258: Displaying Data In List (Wavelength/Time Scan Data)
4.3 Data Processing 4.3.8 Displaying Data in List (Wavelength/Time Scan Data) Displaying Data [For check from saved data] For check by opening the saved data, open the saved wavelength scan data or time scan data according to section 4.1.1.. [During measurement] When measurement is in progress with WL Scan or Time Scan selected in Main Menu, you should wait till the end of the measurement. - Page 259 4.3.8 (2) For wavelength scan data, the guidance for wavelength scan (Fig. 4-56) is displayed. In this guidance, select the <4> key (for List). For time scan data, the guidance for time scan (Fig. 4-57) is displayed. In this guidance, select the <3> key (for List).
- Page 260 4.3 Data Processing Time Scan/List CELL A No. TIME(s) ABS No. TIME(s) ABS 0.000 0.001 0.001 10 9 0.002 0.000 11 10 0.003 0.000 12 11 0.007 0.001 13 12 0.013 0.000 14 13 0.020 0.000 15 14 0.034 0.000 16 15 0.055 Select function.
- Page 261 4.4 Measurement in Statistical Calculation Mode In quantitation of solution sample concentration and in measurement of a DNA sample (by ratio calculation), the mean value (MEAN), standard deviation (SD) and relative standard deviation (RSD) can be calculated every specified number of calculations when you make setting for statistical calculation before measurement.
- Page 262 4.4 Measurement in Statistical Calculation Mode [For measurement of DNA sample (by ratio calculation)] Depending on each mode, set measurement parameters by reference to the following subsections. However, in setting of sample conditions, you must set the statistical calculation in ON status, and set the number of samples for statistical calculation in setting the number of calculations.
- Page 263 4.5 Auto Start Function The instrument can always be started up under the same measurement parameters by using the auto start function. This is a very useful function when measurement is always carried out in only one mode. Startup of This Product Start up this product.
- Page 264 [ENTER] key. For the set method, an asterisk (*) is put at the head of its file name. Figure 4-65 shows the screen when the file name “1 NO3-(Hitachi Taro)” is selected for auto start. Auto Start CELL A 1 NO3-(Hitachi Taro)
- Page 265 device when Method File that does Auto Start is a file using 6-Cell holder. Moreover, please confirm the same attachment device is installed for Method using the single cell folder (another sales) and the square length cell folders (another sales). Please confirm whether Auto Sipper (another sales) is installed in the device for Method using Auto Sipper (another sales).
- Page 266 10 mm quartz P/N: 210-3939 cell ⎯ Use of sipper Auto sipper P/N: 3J2-0100 For these separately available options and the hottest information about them, contact your dealer or the maintenance service company authorized by Hitachi High-Technologies Corporation. 4 - 52...
- Page 267 4.6.1 4.6.1 Single Cell Holder (Separately Available) A single cell holder has only one cell setting position like the conventional cell holders. This holder should be employed when you want to use cells by the usual method. Removal of 6-cell Holder Remove the 6-cell holder, referring to the 6-cell holder removing method described in “a.”...
- Page 268 4.6 Introduction and Mounting Method of Separately Available Options (2) Only one screw is used for fastening both the sample compartment and single cell holder. Tighten the screw firmly using a Phillips screwdriver. Screw Fig. 4-68 Mounting Single Cell Holder in Sample Compartment (3) Holder mounting is now completed.
- Page 269 4.6.2 4.6.2 Mask for Micro Cell (Separately Available) The mask for micro cell is used in combination with a single cell holder and a micro cell. In this combination, a sample is measurable in a smaller volume (340 to 600 μL) than with a 10 mm rectangular cell.
- Page 270 4.6 Introduction and Mounting Method of Separately Available Options Concave side of mask Groove for inserting mask for micro cell Orient the convex side of mask on this side. Fig. 4-71 External View of Single Cell Holder Insert the mask for micro cell into the groove by sliding.
- Page 271 4.6.3 4.6.3 Rectangular Long-Path Cell Holder (Separately Available) The rectangular long-path cell holder enables the user to measure a sample using a cell having an optical path length within 10 to 100 mm. In this application, low-concentration samples can be measured at enhanced absorbance levels. Removal of 6-cell Holder Remove the 6-cell holder, referring to the 6-cell holder removing method described in “a.”...
- Page 272 4.6 Introduction and Mounting Method of Separately Available Options (2) Only one screw is used for fastening both the sample compartment and rectangular long-path cell holder. Tighten the screw firmly using a Phillips screwdriver. Screw Fig. 4-75 Mounting Rectangular Long-Path Cell Holder in Sample Compartment (3) Holder mounting is now completed.
- Page 273 4.6.4 4.6.4 How to Return 6-Cell Holder Removal of Present Cell Holder Firstly, remove the mask for micro cell when mounted to the single cell holder. Then, remove the single cell holder or rectangular long-path cell holder, whichever mounted, by loosening the screw shown in the figure below.
- Page 274 4.6.5 Measurement in 6-Cell Mode OFF Status Explained here is the measurement method when the 6-cell mode is set at OFF for using a single cell holder or rectangular long-path cell holder. When the 6-cell mode is set at OFF, measurement should be carried out, referring to section 3.3 except for the following.
- Page 275 5. PERFORMANCE CHECK This section pertains to the performance check method for checking whether the instrument provides the specified performance. For performance check with a pen type low- pressure mercury lamp, a separately available option is required. For mounting method of this lamp, refer to the instruction manual for the separately available option.
- Page 276 5.1 Check with Instrument Main Unit Alone [For automatic execution of instrument performance check] For automatically executing instrument performance check, press the <1> key (Performance Check (Auto)) and then the [ENTER] key. For subsequent operation, refer to section 5.1.8. [For instrument performance check in each item] For checking instrument performance in each performance item, press the <2>...
- Page 277 5.1.1 5.1.1 Wavelength Accuracy Display the screen for each item of instrument performance check (Fig. 5-3). For display method, follow the procedure starting from section 5.1.. Using the [▲]/[▼] key, move the cursor to the measuring wavelength in any of WL Accuracy (484.6nm), (229.0nm) and (822.8nm), and then select [1] Yes.
- Page 278 5.1 Check with Instrument Main Unit Alone Performance CELL A WL Accuracy (484.6 nm) -0.2nm WL Accuracy (229.0 nm) WL Accuracy (822.8 nm) WL Repeatability Noise Level (RMS) Baseline Flatness Baseline Stability Hardware Print Report Select function. : _ [1]Print Fig.
- Page 279 5.1.1 Table 5-2 Measuring Conditions and Judgment Standard for Wavelength Accuracy (at 229.0 nm) Item Wavelength Accuracy (at 229.0 nm) Measuring Emission spectrum of Xe lamp bright line conditions (with detector on the monitor side) Wavelength range : 223.0 to 235.0 nm Scan speed 40 nm/min Data interval...
- Page 280 5.1 Check with Instrument Main Unit Alone Fig. 5-6 Example Result of Wavelength Accuracy Check (at 484.6 nm) 5 - 6...
- Page 281 5.1.2 5.1.2 Wavelength Repeatability Display the screen for each item of instrument performance check (Fig. 5-7). For display method, follow the procedure starting from section 5.1.. Using the [▲]/[▼] key, move the cursor to Repeatability of WL, and then select [1] Yes. Wavelength repeatability will be checked.
- Page 282 5.1 Check with Instrument Main Unit Alone Performance CELL A WL Accuracy (484.6 nm) WL Accuracy (229.0 nm) WL Accuracy (822.8 nm) ±0.20 nm WL Repeatability Noise Level (RMS) Baseline Flatness Baseline Stability Hardware Print Report Select function. : _ □...
- Page 283 5.1.2 Fig. 5-10 Example Result of Wavelength Repeatability Check 5 - 9...
- Page 284 5.1 Check with Instrument Main Unit Alone 5.1.3 Noise Level (RMS) Display the screen for each item of instrument performance check (Fig. 5-11). For display method, follow the procedure starting from section 5.1.. Using the [▲]/[▼] key, move the cursor to Noise Level (RMS), and then select [1] Yes.
- Page 285 5.1.3 Performance CELL A WL Accuracy (484.6 nm) WL Accuracy (229.0 nm) WL Accuracy (822.8 nm) WL Repeatability Noise Level (RMS) 0.0001 ABS OK Baseline Flatness Baseline Stability Hardware Print Report Select function. : _ □ 1 Print Fig. 5-13 Screen after Noise Level Check For printing the measurement result, press the <1>...
- Page 286 5.1 Check with Instrument Main Unit Alone Fig. 5-14 Example Result of Noise Level Check 5 - 12...
- Page 287 5.1.4 5.1.4 Baseline Flatness Display the screen for each item of instrument performance check (Fig. 5-15). For display method, follow the procedure starting from section 5.1.. Using the [▲]/[▼] key, move the cursor to Baseline Flatness, and then select [1] Yes. Baseline flatness will be checked. If check is not desired actually, select [2] No.
- Page 288 5.1 Check with Instrument Main Unit Alone Performance CELL A WL Accuracy (484.6 nm) WL Accuracy (229.0 nm) WL Accuracy (822.8 nm) WL Repeatability Noise Level (RMS) ±0.001 ABS OK Baseline Flatness Baseline Stability Hardware Print Report Select function. : _ □...
- Page 289 5.1.4 Fig. 5-18 Example Result of Baseline Flatness Check 5 - 15...
- Page 290 5.1 Check with Instrument Main Unit Alone 5.1.5 Baseline Stability Display the screen for each item of instrument performance check (Fig. 5-19). For display method, follow the procedure starting from section 5.1.. Baseline stability is required to be measured 2 hours after power-on and under an ambient temperature change within 5 °C.
- Page 291 5.1.5 Performance CELL A WL Accuracy (484.6 nm) WL Accuracy (229.0 nm) WL Accuracy (822.8 nm) WL Repeatability Noise Level (RMS) Baseline Flatness Baseline Stability 0.0002 ABS OK Hardware Print Report Select function. : _ □ 1 Print Fig. 5-21 Screen after Baseline Stability Check For printing the measurement result, press the <1>...
- Page 292 5.1 Check with Instrument Main Unit Alone Fig. 5-22 Example Result of Baseline Stability Check 5 - 18...
- Page 293 5.1.6 5.1.6 Hardware Check Display the screen for each item of instrument performance check (Fig. 5-23). For display method, follow the procedure starting from section 5.1.. Using the [▲]/[▼] key, move the cursor to Hardware, and then select [1] Yes. The hardware will be checked.
- Page 294 5.1 Check with Instrument Main Unit Alone Table 5-8 Judgment Standard for Hardware Item Hardware Check items RAM is checked. ROM is checked. Lamp It is checked whether the lamp is lit or not. Wavelength Driver Wavelength driver is checked. Wavelength : Wavelength calibration at 484.6 nm is executed on the...
- Page 295 □ 1 Yes □ 2 No Fig. 5-25 Screen for Each Item of Instrument Performance Check A report is printed as shown below. Report: 2010/04/10 15:12 Spectrophotometer Model U-5100 Spectrophotometer Serial No. 1234-567 ROM VER. : 3J25300 Option Performance Check Items subjected to WL Accuracy (484.6 nm) : -0.4 nm Tolerance ±1.0 nm OK...
- Page 296 5.1 Check with Instrument Main Unit Alone 5.1.8 Auto Check Display the screen for automatically checking the instrument performance (Fig. 5-27). For display method, follow the procedure starting from section 5.1.. Make sure nothing is contained in the sample compartment and select [1] Yes for execution of automatic performance check.
- Page 297 5.1.8 After start of measurement, you must wait for about 80 minutes till the end of all measurements. Upon completion of measurement, the screen after completion of automatic performance check (Fig. 5-30) is displayed. OK appears when the result of each check meets the judgment standard or NG appears if it does not meet the standard.
- Page 298 5.2 Check with Pen Type Low-Pressure Mercury Lamp Available at Option 5.2 Check with Pen Type Low-Pressure Mercury Lamp Available at Option For performance check with a pen type low-pressure mercury lamp, a separately available option is required. For mounting method of this lamp, refer to the instruction manual for the separately available option.
- Page 299 Performance CELL A 1 Performance Check(Auto) 2 Performance Check(Manual) 3 Performance Check(Option) Select function. : _ Fig. 5-32 Instrument Performance Check Screen Mount the pen type low-pressure mercury lamp available at option to the main unit. For mounting method of this lamp, refer to the instruction manual for this option.
- Page 300 5.2 Check with Pen Type Low-Pressure Mercury Lamp Available at Option 5.2.1 Wavelength Accuracy (with Hg Lamp) Display the Performance Check (Option) screen (Fig. 5-33). For display method, follow the procedure starting from section 5.2.. Using the [▲]/[▼] key, move the cursor to WL Accuracy Hg (253.7 nm), (435.8 nm) or (546.1 nm) to be checked, and then select [1] Yes.
- Page 301 5.2.1 Performance CELL A (Option) WL Accuracy Hg (253.7 nm) -0.4 nm OK WL Accuracy Hg (435.8 nm) WL Accuracy Hg (546.1 nm) WL Repeatability Hg Resolution Hg (546.1 nm) Hardware Print Report Select function. : _ □ 1 Print Fig.
- Page 302 5.2 Check with Pen Type Low-Pressure Mercury Lamp Available at Option 5.2.2 Wavelength Repeatability (with Hg Lamp) Display the Performance Check (Option) screen (Fig. 5-36). For display method, follow the procedure starting from section 5.2.. Using the [▲]/[▼] key, move the cursor to WL Repeatability Hg, and then select [1] Yes.
- Page 303 5.2.2 Performance CELL A (Option) WL Accuracy Hg (253.7 nm) WL Accuracy Hg (435.8 nm) WL Accuracy Hg (546.1 nm) ±0.05 nm OK WL Repeatability Hg Resolution Hg (546.1 nm) Hardware Print Report Select function. : _ □ 1 Print Fig.
- Page 304 5.2 Check with Pen Type Low-Pressure Mercury Lamp Available at Option 5.2.3 Resolution Display the Performance Check (Option) screen (Fig. 5-39). For display method, follow the procedure starting from section 5.2.. Using the [▲]/[▼] key, move the cursor to Resolution Hg (546.1nm), and then select [1] Yes. Resolution with the Hg lamp (546.1 nm) will be checked.
- Page 305 5.2.3 Performance CELL A (Option) WL Accuracy Hg (253.7 nm) WL Accuracy Hg (435.8 nm) WL Accuracy Hg (546.1 nm) WL Repeatability Hg Resolution Hg (546.1 nm) 4.75 nm OK Hardware Print Report Select function. : _ □ 1 Print Fig.
- Page 306 Print Report Execute it? :_ □ 1 Yes □ 2 No Fig. 5-42 Performance Check (Option) Screen A report is printed as shown below. Report: 2010/04/10 15:12 Model : U-5100 Spectrophotometer Serial No. : 1234-567 ROM VER. : 3J25300 Option :...
- Page 307 5.3.1 5.3 Wavelength Calibration Wavelength calibration is required if the instrument performance specification is not satisfied in the wavelength accuracy check. The method of wavelength calibration is explained here. 5.3.1 Wavelength Calibration Method After startup of the instrument, press the [MAIN MENU] key to display the Main Menu screen (Fig.
- Page 308 5.3 Wavelength Calibration The wavelength calibration executing screen (Fig. 5-45) is displayed. Select [1] Yes for execution of wavelength calibration. If wavelength calibration is not desired actually, select [2] No. System Setup CELL A 1 WL CALIB. 2 Lamp Usage 3 Date and Time 4 Printer Setup 5 6 Cell Mode...
- Page 309 Consumables and lifetime-limited parts should be purchased from your dealer or the nearest maintenance service company authorized by Hitachi High-Technologies. 6.1 Lamp Usage You can check the present time point in the life cycle of the lamp in the following procedure.
- Page 310 Section 5 in order to check if the lamp performance is within the specified range. If out of the specified range, contact your dealer or the nearest maintenance service company authorized by Hitachi High- Technologies. System Setup CELL A 1 WL CALIB.
- Page 311 Be particularly careful not to spill a sample or the like over the control panel. If abnormality is found on the exterior, contact your dealer or the maintenance service company authorized by Hitachi High-Technologies. 6 - 3...
- Page 312 6.4 Replacement of Radiation Source Lamp This lamp is warranted for 1 year. The user must not attempt to replace the lamp definitely. Entrust lamp replacement work to a service engineer who has received training at Hitachi High- Technologies. 6.5 Caution on Lithium Battery...
- Page 313 If the new fuse is also blown, the instrument may be faulty. Contact your dealer or the maintenance service company authorized by Hitachi High-Technologies. Unplug the power cord from the connector of the spectrophotometer. (See <1> in Fig. 6-4.) <1>...
- Page 314 6.6 Replacement of Power Fuse <2> Fuse holder Power connector Fig. 6-5 Ejection of Fuse Holder Remove the blown fuse and replace it with a new one. (See <3> in Fig. 6-6.) Use a fuse having a proper capacity (time lag fuse (2 A), P/N J821391). It is recommended to prepare a spare fuse.
- Page 315 6.7 Storage of Instrument After Measurement (1) Turn off the power switch and unplug the power cord from the receptacle. (2) Cover the instrument with a clean cloth or the like. When an organic solvent or toxic gas sample is NOTICE: placed in the sample compartment, it shall be taken out of the compartment and prevented...
- Page 316 “b. Troubleshooting.” If the instrument does not work normally despite the troubleshooting, contact year dealer or the maintenance service company authorized by Hitachi High- Technologies. WARNING Electric Shock due to Contact with Instrument Interior The instrument incorporates electric components which might cause an electric shock if touched directly with hand.
- Page 317 (cont’d) Error Message Cause Remedy Set X-Max - On the scale change Set the X axis so that X-Min >= 10. screen for time scan the difference between measurement, the Max and Min is 10 s or difference between X- more.
- Page 318 Method file or improvement can be data file. seen, contact the maintenance service company authorized by Hitachi High- Technologies. No. of STD >=2. This error occurs if you Under the condition at Cannot delete. attempt to set the...
- Page 319 Abnormality is found Turn on the lamp again. when turning on the If no improvement can be lamp. seen, contact the maintenance service company authorized by Hitachi High- Technologies. Error occurred Wavelength Retry wavelength when WL was initialization is initialization. If no initialized abnormal.
- Page 320 Irregularity is found Retry driving. If no when driving the improvement can be wavelength motor. seen, contact the maintenance service company authorized by Hitachi High- Technologies. Capacitor Error Irregularity is found Retry setting. If no when setting the improvement can be capacitor.
- Page 321 Calibration Method (section specification. 5.3.1.)” and check the performance again. If no improvement can be seen, contact the maintenance service company authorized by Hitachi High- Technologies. NG appears for The result of Check the performance wavelength wavelength again. If no improvement...
- Page 322 If no improvement performance check. not satisfy the can be seen, contact the specification. maintenance service company authorized by Hitachi High-Technologies. NG appears for The result of Check the performance baseline flatness in baseline flatness again. If no improvement performance check.
- Page 323 6.9 Specifications of Model U-5010 Ratio Beam Spectrophotometer Table 6-1 Specifications of Model U-5010 Ratio Beam Spectrophotometer Optics Seya-Namioka mount, ratio beam Measuring wavelength range 190 to 1100 nm Spectral bandpass 5 nm (546.1 nm) Stray light 0.07% or less (220 nm for NaI, 340 nm for NaNO ±1 nm (at 484.6 nm) Wavelength accuracy...
- Page 324 APPENDIX Appendix a. Operating Principles of Model U-5100 Optics: Figure “a” shows the optics of Model U-5100 ratio beam spectrophotometer. For radiation source, a xenon flash lamp is used. The white light emitted from the radiation source passes through the filter and entrance slit and is converted into a monochromatic beam by the Seya-Namioka mount monochromator.
- Page 325 Concave diffraction grating Mirror Filter (F) (M1) Entrance slit Monitor-side detector Exit slit 6-cell holder Condenser lens Half mirror (HM) Sample Sample-side detector Toroidal mirror (M2) Monochromator Sample compartment Fig. a-1 Optics of Model U-5100 Ratio Beam Spectrophotometer APPENDIX - 2...
- Page 326 Signal Processing and Control System: Figure “a-2” shows the signal processing and control system arrangement. This system is controllable with the operation panel. After opto-electric conversion by a pair of detectors, electric signals are amplified and A/D converted, and then logarithmically converted by software to generate absorbance data.
- Page 327 “c.” Therefore, using this relationship, quantitative analysis is enabled by comparing absorbance between a concentration-known standard solution and a concentration-unknown solution. The Model U-5100 is capable of measuring both percent transmittance and absorbance. For the customer who will use a spectrophotometer for the first time, it is recommended to read JIS K 0115:2004 “General rules...
- Page 328 Appendix c. Proper Use of Spectrophotometer Solvent Selection When selecting a solvent for sample preparation, keep the following requirements in mind. • No or small absorption in measuring wavelength range. • Non-interactive with solute. • Low volatility. Table c-1 lists the applicable wavelength ranges of common organic solvents.
- Page 329 Table c-1 Applicable Wavelength Ranges (indicated by solid lines) Wavelength 200 nm 300 nm 400 nm or more Solvent 200 nm Cyclohexane 220 nm Ethyl alcohol 220 nm Methyl alcohol 220 nm Diethyl ether 220 nm Dioxane 220 nm n-hexane 250 nm Chloroform 250 nm...
- Page 330 Special Samples Note that the Bouguer-Beer law mentioned in Appendix “b” is not applicable to the following special samples. • Fluorescing sample • Significantly turbid sample In measurement of a solid sample such as glass plate, the energy of beam radiation undergoes a loss (r) due to reflection on the surface of solid substance.
Need help?
Do you have a question about the U-5100 and is the answer not in the manual?
Questions and answers