
Related Manuals for Thermo Scientific MIRAN 205B Series


Summary of Contents for Thermo Scientific MIRAN 205B Series
- Page 1 MIRAN 205B Series SapphIRe Instruction Manual Portable Ambient Air Analyzers Part Number BK3538 26Jun2015...
- Page 2 © 2007 Thermo Fisher Scientific Inc. All rights reserved. Specifications, terms and pricing are subject to change. Not all products are available in all countries. Please consult your local sales representative for details. Thermo Fisher Scientific Air Quality Instruments 27 Forge Parkway Franklin, MA 02038 1-508-520-0430 www.thermo.com/aqi...
- Page 3 WEEE Compliance This product is required to comply with the European Union’s Waste Electrical & Electronic Equipment (WEEE) Directive 2002/96/EC. It is marked with the following symbol: Thermo Fisher Scientific has contracted with one or more recycling/disposal companies in each EU Member State, and this product should be disposed of or recycled through them.
-
Page 5: Table Of Contents
CONTENTS 1. Introduction ........................ 1-1 General Description ..................... 1-1 2. Specifications ......................2-1 3. Instrument Preparation..................... 3-1 Unpacking ........................3-1 Identification ....................... 3-3 Wand and Filters ......................3-4 Adjusting Shoulder Strap .................... 3-4 Charger/Power Supply ....................3-5 Analyzer Output Connections ..................3-8 4. - Page 6 7. Configuration and Setup ................... 7-1 Calibration ........................7-3 Preferences ........................7-3 Gas Unit ........................7-5 Clock ........................... 7-6 Analysis ........................7-7 Analysis Setup page 1 ....................7-8 Analysis Setup Page 2 ....................7-17 Analysis Setup Page 3 ....................7-19 Analysis Setup Page 4 ....................
- Page 7 13. Infrared Spectroscopy Tutorial ................13-1 Overview ........................13-1 Electromagnetic Energy .................... 13-1 Basic Properties of Waves ..................13-3 Atoms and Molecules in Motion ................13-4 Qualitative Analysis: Identifying Compounds ............13-7 Quantitative Analysis: Measuring Absorption Levels ..........13-15 The Beer-Lambert Law ................... 13-16 Infrared Spectroscopy Summary ................
- Page 8 Appendix D – Humidity Compensation Table ............D-1 Appendix E. – MIRAN SapphIRe Field Performance Verification Kit ....E-1 General ........................E-1 Introduction ......................... E-1 Instrument Configuration .................... E-2 Configuring the Gas Sampling Accessory ..............E-2 Gas Challenge ......................E-3 Appendix F – Parts and Accessories ................F-1 Appendix G.
-
Page 9: Introduction
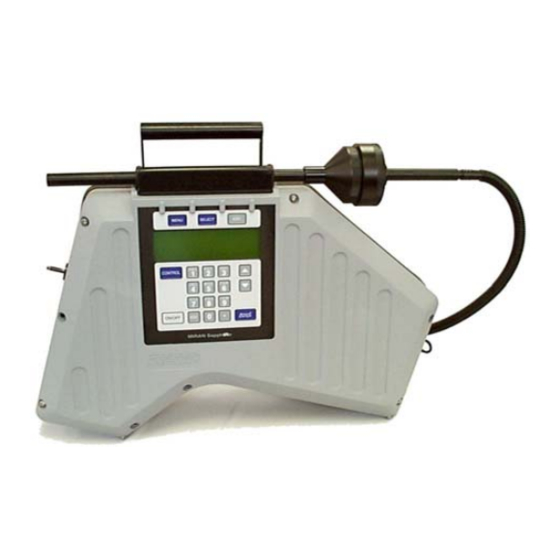
Chapter1 INTRODUCTION GENERAL DESCRIPTION The MIRAN SapphIRe family of lightweight portable ambient air analyzers consists of a group of infrared instruments that can monitor ambient air in workplace environments for the purpose of detecting the presence of gases (Figure 1-1). The family includes three models, all of which are available in intrinsically safe versions. - Page 10 Chapter 1 Introduction Each SapphIRe analyzer contains a single-beam infrared spectrophotometer. A microcontroller automatically controls the analysis, processes the measurement signal, and calculates the absorbance values. Analysis results can be displayed in parts per billion (ppb), parts per million (ppm), percent (%), mg/m , or absorbance units (AU).
-
Page 11: Specifications
Chapter 2 SPECIFICATIONS Thermo Fisher Scientific reserves the right to change/modify specifications without prior notice. Table 2-1. Standard Specifications Item Specification Measurement See Appendix H for each compound range. Range Concentration Compound Dependent Absorbance 0.000 to 1.2 Au (practical upper limit) SapphIRe-DL: up to 5 gases in a background of 5 additional gases. - Page 12 Chapter 2 Specifications Concentration Alarm Low, High, and STEL Power Requirements of 95 to 260 V ac at 50/60 Hz, ±3% or 11 to 15 V dc, 5 A ac/dc Converter (from automobile battery with optional dc power cable) Single gas analysis screen updated each half-second. Measurement Cycle Time Dependent upon application in multigas mode or if compensations are enabled.
- Page 13 Chapter 2 Specifications Table 2-3. Physical Specifications Item Specification Enclosure Material Estaloc Internal Sampling Lines Corrugated Teflon Detector Pyroelectric lithium tantalate Standard - Bare Aluminum Gas Cell Optional - Teflon Coated Lenses Silver Bromide 21.8 in (55.3 cm) wide Analyzer Dimensions 14.4 in (36.5 cm) high 7.6 in (19.3 cm) deep Corrugated Polyethylene,...
-
Page 15: Instrument Preparation
Chapter 3 INSTRUMENT PREPARATION UNPACKING Remove the instrument from its shipping carton and/or transportation case and check it for visible damage. If the instrument has been damaged, notify the carrier immediately and request an inspection report. Obtain a signed copy of the report from the carrier. Check the contents of the shipping package against Table 3-1;... - Page 16 Chapter 3 Instrument Preparation Power Cord, 115V Charger/Chassis Interface Cable N0249XS TR101TN Charger/Battery Pack Interface Cable TR101TK Printer Cable Serial Communication Cable TR101QX P0170QW Figure 3-1. Cable Identification...
-
Page 17: Identification
Chapter 3 Instrument Preparation IDENTIFICATION A data plate (Figure 3-2) or a metal identification plate (Figure 3-3), are located on the back of the instrument. The information contained on these plates may be required should the factory be contacted for technical information or repairs. The metal identification plate is required for intrinsically safe models and contains additional information. -
Page 18: Wand And Filters
Chapter 3 Instrument Preparation WAND (Optional) AND FILTERS Caution: To prevent damage to the optics, never leave the inlet port uncovered. Always use a zero or particulate filter when pump is on, and cap both the inlet and outlet ports when not in use. Remember to remove the caps before using the analyzer. The particulate and zero gas filters have been chosen for their low resistance to sample flow. -
Page 19: Charger/Power Supply
Chapter 3 Instrument Preparation CHARGER/POWER SUPPLY Warning: Intrinsically safe models require special actions with respect to the following section. Refer to Appendix B for descriptions of these actions. Note: The analyzer is shipped with a battery installed. The battery should remain installed, even when the instrument is running on ac power. - Page 20 Chapter 3 Instrument Preparation Figure 3-6. Rear of Charger/Power Supply When either the instrument (with battery installed) or an external battery is connected to the charger, the ready light (green) goes out and the conditioning light (yellow) briefly appears. The charging light (amber) comes on and remains on until the battery is fully charged.
- Page 21 Chapter 3 Instrument Preparation Warning: Intrinsically safe models require special actions with respect to the following section. Refer to Appendix B for descriptions of these actions. The calibration procedure is: 1. Remove the battery from the analyzer and connect it to the Charger/Power Supply using the battery pack interface cable.
-
Page 22: Analyzer Output Connections
Chapter 3 Instrument Preparation ANALYZER OUTPUT CONNECTIONS Warning: Intrinsically safe models require special actions with respect to the following section. Refer to Appendix B for descriptions of these actions. The power and signal connection panel is located behind a hinged door on the analyzer. It contains a parallel port for output to a printer, a serial port for connections to a PC, and an output connection to provide 0 to 1 V dc analog and relay contact output. -
Page 23: Operation
Chapter 4 OPERATION CONTROLS AND DISPLAY Operator controls and display are located on the front panel of the analyzer. Figure 4-1 shows the panel arrangement. Table 4-1 identifies the function of each key on the panel. Figure 4-1. Controls and Display Table 4-1. -
Page 24: Passcode Access
Chapter 4 Operation If the analyzer is running on battery power, the lower left corner of the display may indicate that the instrument is using battery power as well as the status of the battery. See Chapter 7, “Preferences” to activate or deactivate this feature. PASSCODE ACCESS Most operations with the SapphIRe analyzer are not passcode protected. -
Page 25: Making Menu Selections
Chapter 4 Operation ENTERING ALPHANUMERIC CHARACTERS Some setup and data entry fields use alphanumeric data. Entering alphanumeric characters is a two-step process. For example, to get the number "2" or the letters "D", "E", or "F", first press "2". The display then prompts "0=2, 1=D, 2=E, 3=F". To enter the letter "D", press "1". -
Page 26: Startup Procedure
Chapter 4 Operation STARTUP PROCEDURE Press the ON/OFF button to activate the instrument. The first menu to appear is the Main Menu, shown below. If the application shown on the Main Menu is the one that is wanted, press “1” or ENTER to display the Zero Menu, shown on page 4-6. - Page 27 Chapter 4 Operation ┌────────────────────────────────────────┐ │╒══CURRENT APPLICATION══╕ APPLIC MENU │ ││ │1=Standard lib │ ││ │ ───── │ ││ │User libraries:│ ││ METHANE: ---- ppm │2=Single gas │ ││ │3=Multi-gas │ ││ │ ───── │ │└───────────────────────┘4=Spectrum scan│ └────────────────────────────────────────┘ Applications Menu Select an application in the Primary Applications menu from the SL or XL standard library, or from the single or multi-gas user libraries.
- Page 28 Chapter 4 Operation If an application has more than one wavelength, a Secondary Application menu appears. An asterisk appears next to all secondary applications. Make a selection using the number keys or MENU and SELECT. Upon selection, the display responds “ACCEPTED”...
- Page 29 Chapter 4 Operation To establish a new zero, press “1”. In the unlikely event that the instrument is experiencing problems, the display indicates “Please wait...” and/or “Please wait while system warms up...”. To view the details on the Warm Up Status screen, Press “1”. In the example screen, both the chopper is not locked at the proper frequency and the filter is not properly positioned.
- Page 30 Chapter 4 Operation While the cell fills with zero air, the Zero Purge screen indicates the time remaining. Press ENTER to shortcut the purge. CAUTION: The zero process requires five volumes of air (about 11 liters) to completely flush the cell. Shortcutting this step will result in an incomplete purge and incorrect readings during analysis due to an invalid baseline value.
- Page 31 Chapter 4 Operation If the instrument is not set up for zero autosave mode, the display asks to save the new zero. Press “1” to repeat the zeroing procedure or ENTER to save the zero. The display responds “ZERO SAVED.” ┌────────────────────────────────────────┐...
- Page 32 Chapter 4 Operation When the purge is complete, the display changes to the Analysis menu. The bands above and below the left portion of the display indicate that the analyzer is actively making measurements. Note: The location on the bottom line of the Analysis Menu and choices 3, 4, and 5 do not appear unless the location mode is enabled.
-
Page 33: Using The Search Feature
Chapter 4 Operation USING THE SEARCH FEATURE If searching for a chemical in the standard library or for a location in the location list, scroll through the list or alternatively use the search feature if the list has more than one screen of selections. -
Page 34: Information Screens
Chapter 4 Operation INFORMATION SCREENS The following information regarding the analyzer is presented on information screens. To access these screens, press "0" from the Main Menu. Press or to access additional information screens. Press “ESC” to return to the Main Menu. ... -
Page 35: Error Screens
Chapter 4 Operation ERROR SCREENS The SapphIRe analyzer displays one of several error screens if certain problems occur. The message is identified as an ERROR, WARNING, or ALARM. An error beep or continuous alarm also occurs. Acknowledge these messages by pressing the ESC or ENTER key. - Page 36 Chapter 4 Operation Table 4-4. Warning Messages Warning Message Meaning Corrective Action This message is generated if the measured Absorbance is too negative! Rezero the analyzer. If absorbance falls below a negative Try rezeroing the analyzer problem persists, absorbance threshold value set in the replace the zero gas and make sure zero gas is application.
- Page 37 Chapter 4 Operation Table 4-4. Warning Messages (continued) This message is only generated during the initial self-test on powerup. It indicates that the time reported by the real time clock Built-in clock's date/time is hardware is invalid. When this message is Contact service for wrong! displayed, the clock is set to a valid time.
-
Page 38: Changing The Pathlength
Chapter 4 Operation CHANGING THE PATHLENGTH The SapphIRe analyzer can be set to one of two pathlengths: short (0.5 m) and long (12.5 m). To change the pathlength from the short pathlength (0.5 m) to the long pathlength (12.5 m), turn the hex recess adjustment clockwise with the pathlength change tool or 9/64 hex wrench. -
Page 39: Analog Output
Chapter 4 Operation ANALOG OUTPUT Warning: Intrinsically safe models require special actions with respect to the following section. Refer to Appendix B for descriptions of these actions. The SapphIRe analyzer is equipped with a 0 to 1 V dc analog output jack (see See Analyzer Output Connections, Figure 3-8). -
Page 41: Analyze/Start
Chapter 5 ANALYZE/START To start the analysis, press 1 (Analyze/Start) from the Main Menu. The display presents the Zero Menu if a zero has been taken for all of the current application wavelengths. The date and time of the last zero and analyzer status are shown. To re-zero the analyzer, press 1. - Page 42 Chapter 5 Analysis To re-zero the analyzer, press 1 (New zero) from the Zero Menu. The display responds with "Please wait..." and/or "Please wait while system warms up...". When all areas are indicated "ok", press ENTER to continue. If the Analyzer mode is not zero, or scan and pressure compensation is configured On, the display shows the current pressure compensation and gives the user the opportunity to accept or change it.
- Page 43 Chapter 5 Analysis ┌────────────────────────────────────────┐ │╒══CURRENT APPLICATION══╕ │ If zero autosave is not enabled, the ││ │ Save this │ display asks to save this zero. ││ │ zero? │ Press “1” to repeat the zeroing ││ │ │ procedure or ENTER to save the ││...
-
Page 44: To Begin Analysis
Chapter 5 Analysis Caution: If ENTER is pressed to skip the purge cycle, a message is displayed citing the need to completely fill the cell. If the purge cycle is skipped, an error flag, "P", appears next to the displayed data. Any logged data is also flagged with a “P” for insufficient purge. -
Page 45: Log
Chapter 5 Analysis The Log function saves measurement values for later downloading to a PC or printer. To begin the log function press 1 (Log) from the Analysis Menu. If a site has not been created, the display reads “Must start site before logging!” If logging was not set up, the display reads "Logging is not configured!"... - Page 46 Chapter 5 Analysis To review the Location List or to select a location name, press 1 (Browse). If no locations are in the current list, the display reads "Location list is empty." If locations are listed, select the location name using the MENU and SELECT keys or the number keys. The display responds "-ACCEPTED-".
-
Page 47: Error Fault Messages
Chapter 5 Analysis ERROR/FAULT MESSAGES The instrument displays error/fault messages relating to analysis by indicators on the display or by flag screens. Display Indicators A letter or symbol at the end of the analyzer reading indicates the following: Table 4-2. Display Indicators Symbol Description High alarm level exceeded... - Page 48 Chapter 5 Analysis Flag Screens In the analysis mode, the SapphIRe analyzer displays flag screens if other problems occur. Acknowledgment is not required for flag screens. A summary of active flags and corrective action recommendations can be viewed by pressing the "0" key from the Analysis Menu.
-
Page 49: Change Gas
Chapter 6 CHANGE GAS To change an application, press 2 (Change application) from the Main Menu. If one or more applications have previously been selected, the display presents the Recent Applications Menu in alphabetical order (see Recent Applications menu, below). The current application is shown on the left and up to five other recent applications on the right. - Page 50 Chapter 6 Change Application ┌────────────────────────────────────────┐ │╒══CURRENT APPLICATION══╕ STANDARD LIB │ ││ │1=111TRICL │ ││ │2=11DICLOR │ ││ │3=12DICLOR │ ││ METHANE: ---- ppm │4=13BUTADI │ ││ │5=2CLETH │ ││ │ =More │ │└───────────────────────┘ ENTER=Search │ └────────────────────────────────────────┘ Primary Applications Menu If the instrument is a SapphIRe-SL or SapphIRe-XL, a Secondary Applications menu might appear, providing alternate application wavelengths.
- Page 51 Chapter 6 Change Application 0.250 0.200 Acetone 0.150 0.100 0.050 0.000 Wavelength In Microns 0.160 0.140 Methyl Acrylate 0.120 0.100 0.080 0.060 0.040 0.020 0.000 -0.020 Wavelength In Microns Figure 6-1. Alternate Wavelength Example To effectively use the alternate wavelengths, refer to a book of infrared spectra or access an internet web site such as http://webbook.nist.gov/chemistry).
-
Page 52: Spectrum Scan
Chapter 6 Change Application SPECTRUM SCAN This feature invokes the screen shown below. It allows scanning of all measurable wavelengths. Before starting this analysis, configure a site and set the logging parameters. NOTE: If the unit is not configured for scanning with the ThermoMatch Spectrum Correlation Software, menu items 3 –... - Page 53 Chapter 6 Change Application ┌────────────────────────────────────────┐ │╒══CURRENT APPLICATION══╕Auto configure │ ││ │ logging with │ ││ │auto start and │ ││ │ one cycle │ ││ METHANE: ---- ppm │ interval? │ ││ │ │ ││ │1=Yes, reconfig│ │└───────────────────────┘2=Keep current │ └────────────────────────────────────────┘...
-
Page 55: Configuration And Setup
Chapter 7 CONFIGURATION and SETUP Setup mode customizes the analyzer as shown in Table 7-1. To access the Setup mode, press (Config/Setup) from the Main Menu. The display presents the Setup Menu, shown below. A summary of the current site, measurement units, and clock reading is shown on the left and the menu of selections on the right. - Page 56 Chapter 7 Configuration and Setup Set Up Menu Analysis Calibration Preferences Gas Unit Clock Setup Key Click Zero Date PAGE 1 Temperature Time Logging Sensor Log Mode percent Screen Delay Performance Log Interval Short mg/m Verification Log Start Medium Log Store Long Other Parameters Power Graphic...
-
Page 57: Calibration
Chapter 7 Configuration and Setup CALIBRATION The Calibration mode can be used to check zero, to calibrate the temperature sensor, or load the performance verification application. To access the Calibration mode, press from the Setup Menu. The display presents the Calibration Menu (see Calibration Menu, below). - Page 58 Chapter 7 Configuration and Setup ┌────────────────────────────────────────┐ │╒════════SUMMARY════════╕PREFERENCE MENU│ ││ Key click: On │1=Key click │ ││ Screen delay: Medium │2=Screen delay │ ││ Power graphic: On │3=Power graphic│ ││Battery status: Always │4=Battry status│ ││ Text type: Regular│5=Text type │ ││ │...
-
Page 59: Gas Unit
Chapter 7 Configuration and Setup Menu Item Selections Selects the language of the display: 1 = English, 2 = Francais, 3 = 1 = Language Espanol, and 4 = Deutsche Selects the type of decimal point character: 1 = a period (.) and 2 = a 2 = Decimal comma (,). -
Page 60: Clock
Chapter 7 Configuration and Setup Next, the Gas Unit Menu is displayed (see Gas Unit menu, below). The current application is displayed on the left and the menu of selections on the right. Choose Select the unit from the menu. Press to set all gases to their default unit. -
Page 61: Analysis
Chapter 7 Configuration and Setup ANALYSIS Analysis Setup is done from four menus. The menus are shown here and are discussed in depth in the following sections. ┌────────────────────────────────────────┐ │╒════════SUMMARY════════╕ANALYSIS SETUP │ ││Logging──Single Sample │1=Logging │ ││ └─ 10 Seconds │2=Alarms │... -
Page 62: Analysis Setup
Chapter 7 Configuration and Setup ANALYSIS SETUP PAGE 1 Pressing 5 (Analysis) from the Setup Menu causes the display to ask for the passcode if the analyzer is configured to be passcode-protected. If the passcode is correct, the first of four Analysis Setup Menus is displayed (see Analysis Setup Menu Page 1, above). - Page 63 Chapter 7 Configuration and Setup Log Mode To set the Log Mode, press (Log mode) from the Log Menu. Then press to turn off the logging feature, 2 to specify a single sample per logging trigger, or 3 to specify continuous sampling per logging trigger.
- Page 64 Chapter 7 Configuration and Setup Note: Too small an interval is chosen if in a multi-gas analysis mode or compensations enabled (for example, 10 seconds) the analyzer displays an error message. This is because the analyzer only provides one new set of concentration readings at the end of the cycle which, depending on the number of wavelengths in the application and the sampling duration, could be anywhere from approximately 30 seconds to a maximum of approximately 120 seconds.
- Page 65 Chapter 7 Configuration and Setup Other Parameters In the Continuous Sample Mode, the analyzer is placed in Auto Save and Auto Repeat Mode. This means that the analyzer automatically stores the log without user intervention and continue logging at the defined logging interval. In Single Sample Mode, the Auto Save and Auto Report parameters are disabled.
- Page 66 Chapter 7 Configuration and Setup Note: The “Latched” alarm state only applies to the alarm relay. To make the audible alarm work as a latching alarm, set the Alarm action to ErrScrn in Analysis Preferences (see page 7-15). Press from the Alarm Menu to set the state of the High alarm, 2 for the Low alarm and 3 for the STEL alarm.
- Page 67 Chapter 7 Configuration and Setup Compensation To specify analysis compensations, press (Compensations) from the Analysis Setup Menu 1. The Analysis Compensations Menu is displayed. Press to specify Temperature compensation, 2 for Pressure, 3 for Reference, and 4 for Humidity. When finished, press to accept these selections.
- Page 68 Chapter 7 Configuration and Setup The reference wavelength is chosen based on the analytical wavelength and must be chosen at a wavelength where other gases do not absorb IR energy. The default wavelength of 4.004 microns should be used if the presence of other gases is not certain. Once the analyzer has measured the signal at the reference wavelength, the value is applied to the analytical wavelength and a correction in its value is made.
- Page 69 Chapter 7 Configuration and Setup compensate for this effect, the analyzer employs an analysis wavelength which is responsive mainly to water vapor. Intensity changes at this and the reference wavelength may be used to correct for changes in sample absorbance due to variable water vapor levels after zeroing.
- Page 70 Chapter 7 Configuration and Setup Menu Item Selections Selects the zero save mode: 1 = Auto and 2 = Manual. In Auto Mode, when a zero has been performed, a valid zero is automatically saved 1 = Zero save and the next prompt displayed. In Manual Mode, when a zero has been performed, there is a prompt that the zero is valid and instructed to Save or Repeat Zero (see Chapter 5, Save Zero Display screen).
-
Page 71: Analysis Setup
Chapter 7 Configuration and Setup ANALYSIS SETUP PAGE 2 To continue with the analysis setup, press the down arrow key in the Analysis Setup Menu Page 1. The Analysis Setup Menu Page 2, shown below, is displayed. ┌────────────────────────────────────────┐ │╒════════SUMMARY════════╕ANALYSIS SETUP │ ││... - Page 72 Chapter 7 Configuration and Setup If 1 is pressed, the next display requires entering the zero warning time interval. This can be set from 0 to 999 minutes or hours. The numeric field entry is keyed in; the units are selected with the down arrow key.
-
Page 73: Analysis Setup
Chapter 7 Configuration and Setup ANALYSIS SETUP PAGE 3 To continue with the analysis setup, press the down arrow key from the second Analysis Setup Menu. The third Analysis Setup Menu, shown below, is displayed. ┌────────────────────────────────────────┐ │╒════════SUMMARY════════╕ANALYSIS SETUP │ ││ Passcode: Off │1=Passcode │... - Page 74 Chapter 7 Configuration and Setup Locations To configure the locations, press (Location List) from the Analysis Setup Page 3. The Location Menu, shown below, is displayed. ┌────────────────────────────────────────┐ │╒═══LOCATION SUMMARY════╕ LOCATION MENU │ ││ Mode: Enabled │1=Mode │ ││ │ │ ││Ordering: As entered │2=Order of list│...
-
Page 75: Analysis Setup
Chapter 7 Configuration and Setup is pressed to select the locations reported, press to choose “All Locations” or choose “Only Logged” locations. is pressed to select if duplicates are to be reported, press to choose “Duplicates” or to choose “No Duplicates.” ANALYSIS SETUP PAGE 4 This menu, shown below, differs from the three other Analysis Setup Menus in that it is used to set up a specific application. - Page 76 Chapter 7 Configuration and Setup User Settings User Settings modify the parameters of the selected application that do not impact application performance. This involves selecting the gas if it is a multi-gas application and then configuring the gas unit, high alarm, low alarm, STEL alarm, and STEL time for any application.
- Page 77 Chapter 7 Configuration and Setup Unit To select a unit for the application, press from the Set Parameters Menu. The Gas Unit Selection Menu is displayed. The last unit configured is shown on the display. If this is the unit of the present application, press .
- Page 78 Chapter 7 Configuration and Setup Alarms To set a high, low, or STEL alarm level for the application, press , or respectively from the Set Parameters Menu. The appropriate Alarm Level Menu is displayed (see Alarm Level menu, below). The last alarm level configured for that alarm is shown on the display.
-
Page 79: Application View And Edit
Chapter 7 Configuration and Setup ┌────────────────────────────┐ │╒════METHANE SUMMARY════╕Select │ ││ HRL: 100.0ppm │ gas STEL time:│ ││High: 100.0ppm │ │ ││ Low: 50.00ppm │ 15 minutes │ ││STEL: 5.00ppm @ 15min│ │ ││TwaWt: │ 1=Off 2=5 min│ ││MolWt: 16.0 D: Off │ 3=10 minutes │... - Page 80 Chapter 7 Configuration and Setup Application Type The Type is the type of the application (single gas, multi-gas, or scanning). The Application Type cannot be changed. Primary Name The Primary Name is the name of the application being monitored. The last application configured is shown on the display.
- Page 81 Chapter 7 Configuration and Setup Group TWA Group TWA enables setting the multi-gas group TWA mode off or on. The last mode condition configured is shown on the display. If this is the type of the present application, press . The display changes to the Gas Summary. To change the ENTER mode condition, press .
- Page 82 Chapter 7 Configuration and Setup Gas High Range Limit The Gas High Range Limit (HRL) is the high range limit of the gas for the application. The last limit configured is shown on the display. If this is the limit for the present application, press .
- Page 83 Chapter 7 Configuration and Setup Gas STEL Time Interval The Gas STEL Time Interval is the interval for the STEL alarm for the application. The last interval configured is shown on the display. If this is the interval for the present application, press .
- Page 84 Chapter 7 Configuration and Setup Wave Count Wave Count sets the number of analytical wavelengths for the application. The last number configured is shown on the display. If this is the number for the present application, press . The display changes to the next parameter to be configured. ENTER Press to change the number.
- Page 85 Chapter 7 Configuration and Setup Humidity to Absorbance Correction Correction for humidity may be necessary as water vapor is a strong absorber in the infrared, with frequently overlapping absorption bands of many compounds of interest. The relationship between humidity level and absorption is often nonlinear. Humidity to Absorbance Correction specifies the coefficient for a P, Q, and R parameter, any of which may be assigned to Range 1, 2, or 3 for each wave for the application.
- Page 86 Chapter 7 Configuration and Setup Note: This table only contains P term values because this is all that is required for humidity compensation. Temperature Compensation Temperature Compensation sets the temperature compensation off or on. The last compensation condition configured is shown on the display. If this is the compensation condition for the present application, press .
- Page 87 Chapter 7 Configuration and Setup Reference Compensation Summary Since the SapphIRe analyzer is a single beam infrared spectrophotometer, any changes to the analyzer which may cause drift are associated as changes to the detector signal compared to the zero signal. As the analyzer warms up, changes to the electronics, the infrared filter, and the gas cell affect the data.
- Page 88 Chapter 7 Configuration and Setup ┌────────────────────────────────────────┐ │╒REFERENCE COMPENSATION═╕ │ ││ Mode: Enabled │ ───── │ ││ │ Reference │ ││Reference 4.004um │ Compensation │ ││ │ ───── │ ││ Meas Drift: 5.0% │ │ ││ │ 1=Change │ │└───────────────────────┘ =Prev =Next│...
- Page 89 Chapter 7 Configuration and Setup To convert percent to an absorbance limit value, use the following formula: Aborbance Limit drift For example, if the drift value was set to 25 percent, a drift flag is generated if the absorbance at the reference wavelength is over 0.1245 AU or under –0.0969 AU.
- Page 90 Chapter 7 Configuration and Setup Humidity Absorbance Humidity Absorbance specifies the coefficient for a P, Q, and R parameter or the maximum absorbance value, any of which may be assigned to Range 1, 2, or 3 for the application. The last humidity absorbance value for each range configured is shown on the display.
- Page 91 Chapter 7 Configuration and Setup Pathlength Pathlength specifies a long or short pathlength. The last pathlength condition configured is shown on the display. If this is the pathlength condition for the present application, press . The display changes to the next parameter to be configured. Press ENTER change the pathlength condition.
- Page 92 Chapter 7 Configuration and Setup If Batch Mode is enabled, the analyzer performs a trap and purge routine. This turns the pump off during the measurement of all analytical wavelengths. This ensures the sample is measured at all analytical wavelengths, allowing for proper compensations if necessary.
- Page 93 Chapter 7 Configuration and Setup ┌────────────────────────────────────────┐ │╒═══MEAS ABSORB->CONC═══╕Select │ ││ │ PQ cal range:│ ││Range 1: -> 0.5000AU │ │ ││Range 2: -> 0.7500AU │ │ ││Range 3: --- │ │ ││ │ 1=Range 1 │ ││ │ 2=Range 2 │...
- Page 94 Chapter 7 Configuration and Setup The value is always expressed in ppb. The conversion results in a displayed value determined by the application. If the absorbance value generated by the analyzer had been greater than 0.1700, range 2 P, Q, and R values would be used. Select the desired parameter (P, Q, R, or Absorb Range).
- Page 95 Chapter 7 Configuration and Setup If the entry is valid, the display responds "-ACCEPTED-" and then returns to the Matrix Parameters Display. The next position in the matrix can then be configured. When done, press the key. For more information on calibration parameters of multicomponent applications, see LAD 001-036.
-
Page 97: Site Info
Chapter 8 SITE INFO Sites and locations are storage locations for logged data within the SapphIRe memory. A site is the collection point for logged data - concentration, date, time, absorbance data, and possibly locations. A location is specific identity assigned to logged data. Note: PCIP is a DOS program. -
Page 98: Locations
Chapter 8 Site Info General Comments 1. There may have up to 50 sites in the analyzer memory at one time. 2. When downloading or printing site data, select either a single site, all sites, or current site. 3. Selection # 2 (enter site information) under the site menu allows the entering of notes about the data to be logged. - Page 99 Chapter 8 Site Info noted above. Repeat this process for as many locations as needed. There should be one blank line after the version line and another blank line prior to the end line. These locations will be available in all sites, and will reside even after the memory is cleared of sites and logged data.
- Page 100 Chapter 8 Site Info How to Use Locations 1. Create standard (and supplemental if desired) locations by downloading the location template from the analyzer to a PC. 2. Modify the location list and load into the analyzer. 3. Scroll to next page by pressing . Activate selection # 2 (location) on the analysis setup preference menu.
-
Page 101: Sites And Locations Summary
Chapter 8 Site Info 4. Since standard locations and supplemental locations are loaded from a PC and are "permanent", the only way to remove these is to clear the entire memory. To clear all memory, press (Report / Data), then select (memory clear) from the Report/Data menu. -
Page 103: Report/Data Transfer
Chapter 9 Report/Data Transfer Warning: Intrinsically safe models require special actions with respect to the following section. Refer to Appendix C for descriptions of these actions. From the Main Menu, press (Report/Data) to access the Report/Data Menu (see Report/Data Menu, below). The current status is shown on the left and the menu of selections on the right. -
Page 104: Print Menu
Chapter 9 Report/Data PRINT MENU Warning: Intrinsically safe models require special actions with respect to the following section. Refer to Appendix B for descriptions of these actions. To print a report, connect the analyzer to any printer that can accept ASCII text format by connecting the printer cable (see Figure 3-1) to the analyzer parallel port (see Figure 3-8). -
Page 105: Data Transfer
Chapter 9 Report/Data While printing, an indicator shows the percentage complete. When complete, the message "Print Transfer Okay" is displayed. If unable to print the report, the analyzer displays the message "Printing Failed." DATA TRANSFER To transfer data, connect the analyzer to a computer with an RS-232 cable and press (Data transfer) from the Report/Data Menu. - Page 106 Chapter 9 Report/Data Send Data To send data, press (Send) from the Data Transfer Menu. If mode is Auto, the display shows the percent transfer complete as the data is sent. If mode is Manual, the Send Menu is displayed (see Send Menu, below). The current status continues to be shown on the left and the menu of selections on the right.
-
Page 107: Memory Clear
Chapter 9 Report/Data MEMORY CLEAR To clear memory, press (Memory clear) from the Report/Data Menu. The Memory Menu is displayed (see Memory Menu, below). The current status continues to be shown on the left and the menu of selections on the right. Press to clear logged data and sites. -
Page 109: Maintenance And Service
Chapter 10 Maintenance and Service The SapphIRe analyzer has no user-serviceable parts and requires no lubrication or routine cleaning. With the exception of the battery pack, all parts have an infinite storage life. Warning: Intrinsically safe models require special actions with respect to the following section. -
Page 110: Care Of Optics
Long Term Storage NiCd batteries discharge at the rate of 30% per month at room temperature. Be sure to fully charge any battery pack retrieved from storage prior to using it in the analyzer. Recharging For a complete description of battery pack operations with either the Model 5025A or Model 5100A Charger/Power Supply (see Chapter 3, “Charger/Power Supply”). -
Page 111: Service Locations
SERVICE LOCATIONS For additional assistance, service is available from exclusive distributors worldwide. Contact one of the phone numbers below for product support and technical information or visit us on the web at thermo.com/aqi. 1-866-282-0430 Toll Free 1-508-520-0430 International 10-3... -
Page 113: Firmware Update
Chapter 11 Firmware Update INTRODUCTION Warning: Intrinsically safe models require special actions with respect to the following section. Refer to Appendix C for descriptions of these actions. Thermo Fisher Scientific updates the SapphIRE software, and periodically provides firmware feature enhancements/modifications to the analyzer. These enhancements can be upload to the analyzer via a personal computer and the serial port on the analyzer. -
Page 114: Procedure
Chapter 11 Firmware Update Notes: 1. Thermo Fisher Scientific supplies two disks with each SapphIRE. One contains the ThermoConnect software and should be loaded as indicated above. The second contains instrument specific application files ("applic.txt"), a generic read me file ("readme.txt"), and a setup file ("setup.txt"). - Page 115 Chapter 11 Firmware Update ┌────────────────────────────────────────┐ │╒════════STATUS═════════╕ DATA TRANSFER │ ││ Site: <all> │ Mode=Auto │ ││ │ Baud=9600 │ ││Locations: --- │ │ ││ │ │ ││ │1=Change mode │ ││ Memory: 94% free │2=Change baud │ │└───────────────────────┘3=Send/receive │ └────────────────────────────────────────┘ ┌────────────────────────────────────────┐...
- Page 116 Chapter 11 Firmware Update ╔════════════════════════════════════════╗ ║───────────────MAIN MENU────────────────║ ║ Firmware version: 205 050000P ║ ║ Firmware validity: Valid ║ ║ ║ ║ ║ ║ 1=Update firmware ║ ║ 2=Validate firmware 3=Serial setup ║ ║ 4=Details 5=Exit update mode ║ ╚════════════════════════════════════════╝ Firmware Main Menu In the Firmware Main Menu, press to display the Serial Menu.
- Page 117 Chapter 11 Firmware Update Uploading Setup Information Next, reload the file saved earlier into back to the computer. To do this, press from the Analyzer Main Menu (see below). Then Press from the Report/Data Menu to select Data Transfer (see Data Transfer Menus, above). The display indicates that it is waiting for a request.
-
Page 119: User Performance Verification
Chapter 12 USER PERFORMANCE VERIFICATION INTRODUCTION Performance verification can be done by introducing a pure sample of the compound through a septum into a closed loop circulating pump which is connected to the analyzer. The closed loop calibration system, consisting of the septum, pump, and tubing is available from Thermo Fisher Scientific. - Page 120 Chapter 12 User Performance Verification 3. Determine the required injection volume for the calibration. For Liquids: For Gases: VI Where: VI = Injection volume in microliters ( L) C = Concentration in parts per million (ppm) = Total volume of cell and calibration system in liters (2.24 L) Liquid density (g/cm M = Molecular weight of sample ...
-
Page 121: Infrared Spectroscopy Tutorial
Chapter 13 Infrared Spectroscopy Tutorial OVERVIEW The MIRAN SapphIRe Infrared Analyzer quickly measures concentrations of a wide range of chemical substances present in the air. In identifying and measuring various gases in the air, it uses fundamental principles of how molecules composing these substances absorb infrared energy. - Page 122 Chapter 13 Infrared Spectroscopy Tutorial Figure 13-1. Electromagnetic Spectrum 13-2...
-
Page 123: Basic Properties Of Waves
Chapter 13 Infrared Spectroscopy Tutorial Figure 13-2. Herschel Experiment People can see visible wavelengths as light and color but usually cannot feel them, whereas people can feel infrared wavelengths, but cannot see them. Certain analytical instruments, however, such as the SapphIRe Analyzer, use infrared wavelengths from about 1.8 to 14.1 μm. -
Page 124: Atoms And Molecules In Motion
Chapter 13 Infrared Spectroscopy Tutorial Speed and Frequency of the Wave Velocity, V, of infrared waves in air is approximately the speed of light in a vacuum (c or 3 x 10 m/s). Whereas the velocity is expressed in distance travelled per unit of time, frequency measures how many waves pass a given point in a period of time. - Page 125 Chapter 13 Infrared Spectroscopy Tutorial Vibrational Bending and Stretching Vibrations can involve either a change of bond length, stretching, or bond angle, bending (Figure 13-4). Figure 13-4. Molecular Bending and Stretching Stretching can be either asymmetrical or symmetrical (Figure 13-5). Figure 13-5.
- Page 126 Chapter 13 Infrared Spectroscopy Tutorial Resonance Every object has a natural frequency at which it vibrates. As a sound wave travels through the air, it carries energy with it. This energy is what causes eardrums to vibrate when struck by the wave. In the same manner, a larger, less sensitive object also bends slightly with each compression or rarefaction which hits it.
-
Page 127: Qualitative Analysis: Identifying Compounds
Chapter 13 Infrared Spectroscopy Tutorial Summary At the atomic and molecular level, all matter, regardless of size or composition, is in constant motion. The bonds holding atoms together in molecules can be thought to behave much like a "Slinky" spring. The spring-like wagging, stretching, and bending motions of the bonds are forms of molecular vibration. - Page 128 Chapter 13 Infrared Spectroscopy Tutorial In this figure, note the following: Source of IR radiation - Heated wire in the SapphIRe Analyzer Sample Cell – 0.5 or 12.5 m pathlength cell in the SapphIRe Analyzer Optical Filter - permits selection of a single, specific wavelength of IR radiation ...
- Page 129 Chapter 13 Infrared Spectroscopy Tutorial microns. The signal from the detector is transmitted to the y-axis of the recorder, indicating how much radiation is absorbed by the sample at a particular wavelength. Thus, any point on the curve of an absorption spectrum can characterized by two factors: wavelength and the intensity of IR energy absorption.
- Page 130 Chapter 13 Infrared Spectroscopy Tutorial Not all absorption spectra are so simple. Most contain multiple peaks. Figure 13-10 is an absorption spectrum of a single organic compound, Isopropanol in air. There are a number of distinct absorption peaks (shown circled). Some peaks contain "shoulders", less intense peaks leading up to the main peak.
- Page 131 Chapter 13 Infrared Spectroscopy Tutorial For example, in the following 10 ppm scan of methylene chloride in ambient air, its characteristic absorption peak at around 13.5 microns is practically obscured at low concentrations by other components in the air (Figure 13-11, upper). Only at higher concentrations or by compensating for other compounds (see second scan at 100 ppm compensated for air) can certain peaks be easily identified (Figure 13-11, lower).
- Page 132 Chapter 13 Infrared Spectroscopy Tutorial Choosing Analytical Wavelengths of Gas Compounds From the "fingerprint" or IR spectrum by which a compound is identified, we must choose a good analytical wavelength for a measurement. This is a critical step in performing a gas calibration. By identifying characteristic main and secondary absorption peaks unique for that particular compound and recording them for future reference, a library of analytical wavelengths for a large number of gases can be maintained.
- Page 133 Chapter 13 Infrared Spectroscopy Tutorial 0.300 0.250 0.200 Isopropanol 0.150 0.100 0.050 0.000 Wavelength In Microns 0.450 0.400 0.350 0.300 Methyl Ethyl Ketone 0.250 0.200 0.150 0.100 0.050 0.000 Wavelength In Microns Figure 13-12. Selecting a Distinguishing Peak of a Compound Intensity A second important criterion in selecting a wavelength for analysis is that the absorption level must be sufficiently intense to be measurable in the concentration range desired.
- Page 134 Chapter 13 Infrared Spectroscopy Tutorial peaks present themselves at 8.5 and 10.5 microns . Note that the one at 8.5 microns is strong at both concentrations and that the one at 10.5 microns practically disappears at the concentration of 10 ppm. 0.800 0.700 0.600...
-
Page 135: Quantitative Analysis: Measuring Absorption Levels
Chapter 13 Infrared Spectroscopy Tutorial QUANTITATIVE ANALYSIS: MEASURING ABSORPTION LEVELS The previous section showed that the second major characteristic of an absorption peak is the intensity of energy absorption and that the presence and intensity of IR absorption of any given peak varies with the identity of the specific organic compound being analyzed. Absorption also varies with the concentration of gases in the sample cell and with the effective length of the path the infrared beam travels through the sample cell. -
Page 136: The Beer-Lambert Law
Chapter 13 Infrared Spectroscopy Tutorial Figure 13-15. Concentration vs. Absorbance Relation of Transmittance to Absorbance Units Since both transmittance (T = I /I) and Absorbance (A = log /I) are derived from the same proportion of intensity of incident vs. transmitted energy, we can substitute to solve for the value of A in terms of T. - Page 137 Chapter 13 Infrared Spectroscopy Tutorial k is a proportionality constant often known as the absorptivity. It is related to wavelengths absorbed by particular chemicals. At a given wavelength it does not change. C is a measure of concentration. It represents the quantity of the gas in the sample cell.
-
Page 138: Infrared Spectroscopy Summary
Chapter 13 Infrared Spectroscopy Tutorial Figure 13-17. Absorbance - Actual Concentration Linearity The apparent failure of Beer's Law at higher concentrations is most likely due to the interaction of gas molecules with one another in the sample cell. Collisions between molecules as well as polymerization are two phenomena thought to account for deviations from linearity. -
Page 139: How The Sapphire Analyzer Works
Chapter 13 Infrared Spectroscopy Tutorial unknown sample. By knowing at what wavelengths energy is absorbed, the types of molecules in a compound can be identified. 2. Selecting a good fingerprint for a compound involves finding an intense absorption peak in its IR spectrum at a wavelength where: a. - Page 140 Chapter 13 Infrared Spectroscopy Tutorial In the cell, the infrared light is reflected back and forth through the sample by gold-coated mirrors(s). This folded-pathlength design allows for adjustment of pathlength between 0.5 and 12.5 meters. The greater number of reflections, the more energy is absorbed by the sample before the infrared radiation reaches the detector (e).
- Page 141 Chapter 13 Infrared Spectroscopy Tutorial Table 13-1. Wavelength Ranges Wavelength Bandwidth Bandwidth (μm) (μm) General Hydrocarbons 0.11 3.333 Other Fixed Filters 0.06 at wavelength of 4.0 1.859, 3.573, 4.004, 4.250, 4.500, 4.620 μm 8.000 0.22 11.000 0.25 14.000 0.28 Resolution becomes very important if two compounds have absorbance close together in the infrared spectrum.
-
Page 143: Custom Report Formatting
Chapter 14 Custom Report Formatting GENERAL The standard report format for the analyzer includes (Figure 14-1): A header containing the product name and model, the date and time of the site report, and the site being reported. The gas data For single sample log: contains the name of the gas, its HRL and concentration unit, the location of the readings, the maximum, minimum, average readings at each date and time along with any alarm flags. -
Page 144: Header
Chapter 14 Custom Report Formatting HEADER The header appears one time per site. In the coded format, it begins with the words REPORT-HEADER and ends with the word END. The standard entry begins: \*00]~~~~~~~~~-\01]~~~~~~~~~~ SITE REPORT\_60~~~~~~~~~~~~~\!20~~~ \!31~ This prints out as MIRAN SapphIRe - (model number) and, after tabbing to column 60, the date, two spaces, and the time. -
Page 145: Gas Data
Chapter 14 Custom Report Formatting GAS DATA The main part of the report is the gas data section. It reports data for each location. In the coded format, it begins with the words GAS DATA and ends with the word END. The standard printed format is shown in Figure 14-1 and the same format as coded in Figure 14-2. -
Page 146: Footer
Chapter 14 Custom Report Formatting FOOTER The footer, like the header, appears one time per site. In the coded format, it begins with the words REPORT-FOOTER and ends with the word END. A footer is optional. If it is used, it may be just typed in or coded to insert the notes entered in the REPORT-ENTRY FIELDS section. -
Page 147: Report-Entry Fields
Chapter 14 Custom Report Formatting Example: REPORT-ENTRY FIELDS SITE NAME« LAST NAME« 1ST NAME« ADDRESS 1« ADDRESS 2« ADDRESS 3« SQ FEET« DATE« TIME« 0« 0« 0« SUNNY« CLOUDY« RAINING« WIND DIR« 0« 0« USER NAME« UNIT NAME« 0« 0« 0«... - Page 148 Chapter 14 Custom Report Formatting Field Designator Specification Overview The field designator is in the format \ANNF where: Start of field designator the type of field = Special functions = Set general purpose index = Tab to column = User entries = General configuration information = Application data = Measurement data...
- Page 149 Chapter 14 Custom Report Formatting Special Characters Certain characters have a special meaning: For definition readability/layout only; may be ignored \« Terminate format definition line processing, move to next line Field Designator Specification Details Field Designator ! (Special Functions) 00: Form Feed Description: Form feed character When Valid:...
- Page 150 Chapter 14 Custom Report Formatting 22: Current Date - MM/DD/YY Description: Current date When Valid: Always Character size: Format: MM/DD/YY " - - - ", Undefined 23: Current Date - MM/DD/YYYY Description: Current date When Valid: Always Character size: Format: MM/DD/YYYY "...
- Page 151 Chapter 14 Custom Report Formatting 31: Current Time-Minutes Description: Current time When Valid: Always Character size: Format: HH:MM " - - - ", Undefined 32 to 99: Reserved Description: Reserved for future use When Valid: Never Character size: Not applicable Format: Not applicable Field Designator + (Set General Purpose Index)
- Page 152 Chapter 14 Custom Report Formatting Field Designator * (General Information) 00: Product Name Description: Product name from configuration, alphanumeric When Valid: Always Character size: Format: Left justified, trailing spaces 01: Product Model Description: Product model from configuration, alphanumeric When Valid: Always Character size: Format:...
- Page 153 Chapter 14 Custom Report Formatting 06: Logging Interval Description: The time interval sampled for one logged data point When Valid: Always, but may change if value changed during site, initially value when reset for new site Character size: Format: "N DDDDDDD ", Duration, N=0-9 "NN DDDDDDD ", Duration, NN=10-99 "NNN DDDDDDD", Duration NNN=100-999...
- Page 154 Chapter 14 Custom Report Formatting 10: Pressure Compensation Enable Description: Indicates whether pressure compensation is enabled for applications supporting the compensations When Valid: Always, but may change if value changed during site, initially value when reset for new site Character size: 1 Format: "X", Enabled "-", Disabled...
- Page 155 Chapter 14 Custom Report Formatting 15: Low Concentration Alarm Latched Description: Indicates whether the low concentration alarm is enabled and latched for applications supporting the alarm When Valid: Always, but may change if value changed during site, initially value when reset for new site Character size: Format: "X", Enabled...
- Page 156 Chapter 14 Custom Report Formatting 01: Application Secondary Name Description: Secondary name of application When Valid: Always, but may change if application changed during site, initially value when reset for new site Character size: Format: Left justified, trailing spaces " - - - ", undefined 02: Application Type Description: Type of application...
- Page 157 Chapter 14 Custom Report Formatting 32: Application Gas High Alarm Limit Description: Application gas high alarm limit of gas specified by the current General Purpose Index (see previous section) When Valid: Always, but may change if application changed during site, initially value when reset for new site Character size: Format:...
- Page 158 Chapter 14 Custom Report Formatting 03 to 29: Reserved Description: Reserved for future use When Valid: Never Character size: Not applicable Format: Not applicable Field Designator # (Measurement Data) 00: Measurement Data - Date-DDMMMYY Description: Date measurement logged When Valid: When data logged for site, initially first value logged for a site Character size: Format:...
- Page 159 Chapter 14 Custom Report Formatting 04: Measurement Data - Date-DD/MM/YY Description: Date measurement logged When Valid: When data logged for site, initially first value logged for a site Character size: Format: DD/MM/YY " - - - ", undefined 05: Measurement Data - Date-DD/MM/YYYY Description: Date measurement logged When Valid:...
- Page 160 Chapter 14 Custom Report Formatting 16: Measurement Data - Temperature-Degrees C Description: Logged sample temperature When Valid: When data logged for site, initially first value logged for a site Character size: Format: XXX.XC, right justified, leading spaces " - - - ", undefined 17: Measurement Data - Temperature-Degrees F Description: Logged sample temperature...
- Page 161 Chapter 14 Custom Report Formatting 21: Measurement Data - Concentration Min Description: Minimum concentration measured during the data logging interval for the gas specified by the current General Purpose Index (see previous section) When Valid: When data logged for site, initially first value logged for a site Character size: Format: Right justified, leading spaces...
- Page 162 Chapter 14 Custom Report Formatting 40: Measurement Data - Validity Flags-Okay/Fault/Alarm Description: Concentration validity flags measured during the data logging interval When Valid: When data logged for site, initially first value logged for a site Character size: Format: Left justified, trailing spaces "...
- Page 163 Chapter 14 Custom Report Formatting 43: Measurement Data - Validity Flags-Okay/All Flags Without CrLf Description: Concentration validity flags measured during the data logging interval When Valid: When data logged for site, initially first value logged for a site Character size: 12 to 416 max Format: Outputs all active flags separated by a `+' (note no separation...
- Page 164 Chapter 14 Custom Report Formatting 46: Measurement Data - Validity Flags-./Alarm High Description: Concentration validity flags measured during the data logging interval When Valid: When data logged for site, initially first value logged for a site Character size: Format: Measurement high alarm flag "-", Undefined ".", No measurement alarm "H", High alarm active...
- Page 165 Chapter 14 Custom Report Formatting Field Designator S (Measurement Statistics) Measurement Statistics Format 01234567890123456789012345678901234567890123456789012345678901234567890 00: LOG RUN STATISTICS« 01: ------------------« 02: START: DDDDDDDDDD TTTTTTTT« 03: STOP: DDDDDDDDDD TTTTTTTT« 04: « 05: « 06: GGGGGGGG: CONCENTRATION DATE/TIME VALIDITY« ------------- --------- --------« 09: STEL MAXIMUM: XXXXXX UUU DDDDDDDDDD TTTTTTTT...
- Page 166 Chapter 14 Custom Report Formatting 20: Measurement Statistics - Date-DDMMMYY Description: Select format for date in statistics When Valid: Last designator encountered is used Character size: Format: DDMMMYY " - - - ", undefined 21: Measurement Statistics - Date-DDMMMYYYY Description: Select format for date in statistics When Valid: Last designator encountered is used...
- Page 167 Chapter 14 Custom Report Formatting 26 to 29: Reserved Description: Reserved for future use When Valid: Never Character size: Not applicable Format: Not applicable 30: Measurement Statistics - Time Format Seconds Switch Description: Select format for time in statistics When Valid: Last designator encountered is used Character size: Format:...
- Page 168 Chapter 14 Custom Report Formatting 42: Measurement Statistics - Validity Flags Format-Okay/First Flag Description: Select format for validity flags in statistics When Valid: Last designator encountered is used Character size: Format: See Measurement Data - Validity Flags-Okay/First Flag in previous section 43: Measurement Statistics - Validity Flags Format-Okay/All Flags Without CrLf Description:...
- Page 169 Chapter 14 Custom Report Formatting 52: Measurement Statistics - Measurement Time Off Description: Suppresses columns and trailing separated spaces associated with concentration times, including header lines When Valid: Last designator encountered is used Character size: Format: Not applicable 53: Measurement Statistics - Measurement Validity Off Description: Suppresses columns and trailing separated spaces associated with concentration validity, including header lines...
-
Page 171: Appendix A - Warranty
Appendix A Warranty Seller warrants that the Products will operate or perform substantially in conformance with Seller's published specifications and be free from defects in material and workmanship, when subjected to normal, proper and intended usage by properly trained personnel, for the period of time set forth in the product documentation, published specifications or package inserts. - Page 172 they were not designed, (v) causes external to the Products such as, but not limited to, power failure or electrical power surges, (vi) improper storage and handling of the Products or (vii) use of the Products in combination with equipment or software not supplied by Seller. If Seller determines that Products for which Buyer has requested warranty services are not covered by the warranty hereunder, Buyer shall pay or reimburse Seller for all costs of investigating and responding to such request at Seller's then...
-
Page 173: Appendix B Intrinsic Safety
Appendix B Intrinsic Safety The SapphIRe analyzer is available in an intrinsically safe model. Intrinsically safe apparatus is apparatus in which any spark or thermal effect, produced either normally or in specified fault conditions, is incapable, under test conditions prescribed in NFPA Standard Number 493 (entitled "Intrinsically Safe Apparatus for use in Division 1 Hazardous Locations 1978"), of causing ignition of a mixture of flammable or combustible material in air in its most easily ignitable concentration. - Page 174 Appendix B Intrinsic Safety Warning: When operating in hazardous areas: 1. Static discharge hazard. Wipe case with moist cloth before use and avoid rubbing the case against clothing. 2. Do not remove or replace the battery cassette. 3. Keep the I/O panel door closed. No electrical connections are allowed. In a non-hazardous location, the devices shown in Figure B-2 may be safely attached to the SapphIRe analyzer.
-
Page 175: Appendix C - Scan/Calibration Procedure
Appendix C Scan/Calibration Procedure Note: Creation of custom calibrations should only be attempted by personnel familiar with laboratory procedures, especially the preparation of chemical samples. A working knowledge of infrared spectra is also recommended as the results of the scanning need to be interpreted to yield the best results. -
Page 176: Create A Logging Site
Appendix C Scan/Calibration Procedure The following steps are required to optimize the calibration or to calibrate for an unknown wavelength: A. Create a logging site B. Perform a peak pick or full-spectrum scan C. Download data from the analyzer to a PC D. -
Page 177: Perform A Peak Pick Or Full Spectrum Scan
Appendix C Scan/Calibration Procedure PERFORM A PEAK PICK OR FULL SPECTRUM SCAN To perform a Peak Pick 1 Calculate the injection volume of the compound to be injected into a closed loop system (CLS), using the equations provided in Chapter 12 “User Performance Verification.”... - Page 178 Appendix C Scan/Calibration Procedure Use a suitably sized syringe to introduce Injection Port the compound to be scanned into the injection port of the closed loop system. The injection volume was calculated in step 1. Turn pump ON for approximately 30 seconds.
-
Page 179: Download Data From The Analyzer To A Pc
Appendix C Scan/Calibration Procedure 10. If "Zero Save” is on automatic (see Analysis Preferences screen), there is no option either to repeat zero or save zero. If “Zero Save” is not on automatic, there will be a prompt to select "1=Repeat Zero" or "Enter=Save". After the zero is saved, the prompt is to install the particulate filter. -
Page 180: Analyze The Spectrum
Appendix C Scan/Calibration Procedure ANALYZE THE SPECTRUM 1. In PCIP, highlight the file containing the logged scan data and press "F2=Edit". The file should contains a header and two columns. The first column contains the wavelength data and the second column is the corresponding absorbance. - Page 181 Appendix C Scan/Calibration Procedure 5. The main menu reappears. From it, select "4=Config/Setup" 6. Select "5=Analysis" 7. Press the UP () arrow key 8. Select "3=Application view and edit". 9. The “Application type” screen should indicate "Single gas" or "Multi-gas", depending upon which was selected in step 3.
- Page 182 Appendix C Scan/Calibration Procedure 25. The Application gas liquid density default is "Off". Select "1=Change" to set a value , or "=Next". 26. For Multi Gas Library Application Only: The Application gas GTWA weight default is "Off". Select "1=Change" to set a value , or "=Next". 27.
- Page 183 Appendix C Scan/Calibration Procedure 38. The Application pathlength can be set for "Long" or "Short". Press "1=Change" to select the appropriate pathlength and then "=Next". For optimum sensitivity the long pathlength should be used. The short pathlength is recommended for very high concentration measurements. 39.
- Page 184 Appendix C Scan/Calibration Procedure CALIBRATION 1. Calculate five injection volumes that cover the complete concentration range (also see Chapter 12). E.g., if the concentration is 0 to 1000 ppm, the concentrations should be approximately 200, 400, 600, 800, and 1000 ppm. ...
-
Page 185: Generate The P-Matrix
Appendix C Scan/Calibration Procedure 7. For Single Gas Library Application: Inject first volume and wait for absorbance to stabilize. Record absorbance value. Air out the instrument and repeat until the absorbance returns to zero (±0.0010 AU). Reconnect the pump and repeat for each injection volume. Rezero the instrument if the absorbance is outside of the allowable ±0.0010 AU. - Page 186 Appendix C Scan/Calibration Procedure 2. For Single Gas Library Application: Click first cell adjacent to the absorbance matrix (C2 if application is single gas) and type "=B2^2" (without the quotation marks), and press the Enter key. Return the mouse to the lower corner of cell C2 (if single gas application) until the mouse character turns into an "+".
-
Page 187: Enter P-Mtrix Into The Analyzer And Verify Calibration Accuracy
Appendix C Scan/Calibration Procedure 8. Skip one row and highlight an area having the same number of columns as the C matrix and the same number of rows as the INV(A'A)*A' matrix. Type "=MMULT(". With the mouse highlight the INV(A'A)*A' matrix and type ",". With the mouse highlight the C matrix and type ")". - Page 188 Appendix C Scan/Calibration Procedure Gas 1 Gas 2 Gas 3 Wave 1 P 11 P 21 P 31 Wave 2 P 12 P 22 P 32 Wave 3 P 13 P 23 P 33 Wave 1 Q 11 Q 21 Q 31 Wave 2 Q 12...
-
Page 189: Appendix D - Humidity Compensation Table
Appendix D HUMIDITY COMPENSATION TABLE Wavelength Wavelength Wavelength 3.333 0.1421 8.725 0.0625 9.900 0.0000 3.573 0.0000 8.750 0.0576 9.925 0.0135 4.004 0.0000 8.775 0.0527 9.950 0.0138 4.250 0.0000 8.800 0.0484 9.975 0.0137 4.500 0.0076 8.825 0.0441 10.000 0.0138 4.620 0.0173 8.850 0.0410 10.025... - Page 190 Appendix D Humidity Compensation Table Wavelength Wavelength Wavelength 11.075 0.0324 12.125 0.0271 13.175 0.0517 11.100 0.0317 12.150 0.0272 13.200 0.0532 11.125 0.0307 12.175 0.0279 13.225 0.0569 11.150 0.0298 12.200 0.0285 13.250 0.0598 11.175 0.0287 12.225 0.0296 13.275 0.0645 11.200 0.0281 12.250 0.0304 13.300...
-
Page 191: Appendix E. - Miran Sapphire Field Performance Verification Kit
Appendix E ® MIRAN SapphIRe Field Performance Verification Kit The SapphIRe Field Performance Verification Kit (Kit Part Number: CR014LG) includes the following items: Quantity Part No. Item CR014MA Gas Delivery System CR014LN Cylinder of N O and SF mixture in air Material Safety Data Sheets (N O and MI 611-035 Instruction Manual... -
Page 192: Instrument Configuration
MIRAN SapphIRE Field Performance Verification Kit The steps involved in kit use are discussed in the sections that follow. The three steps are: 1. Configure the analyzer for "Performance Verification". 2. Configure the gas cylinder with the sample delivery system. 3. -
Page 193: Gas Challenge
MIRAN SapphIRE Field Performance Verification Kit Warning: The gas tank is shipped with a trigger valve safety tab. DO NOT REMOVE THIS TAB UNTIL AFTER THE GAS SAMPLING LINE HAS BEEN FULLY INSTALLED. Grasp the capillary tubing end of the sampling line at the location indicated in Figure E-2, and slowly push it into the nozzle opening on the gas tank. - Page 194 MIRAN SapphIRE Field Performance Verification Kit 3. Slowly squeeze the trigger. When the trigger is fully depressed, insert the trigger holder as shown in Figure E-3. This holder keeps the gas tank valve open while the test proceeds. Once the gas sampling accessory is installed, lay the complete assembly down with no further intervention.
- Page 195 MIRAN SapphIRE Field Performance Verification Kit 5. Mark the gas tank in large letters "MT" to denote that it has been used to perform a gas check. 6. Dispose of the tank properly. The tank should never be refilled. Assessing the Results Provided there are no significant deviations from the pressure or temperature at which the original calibrations were performed, the displayed readings should fall within the following ranges of values:...
-
Page 197: Appendix Fparts And Accessories
Appendix F PARTS and ACCESSORIES The following parts and accessories are used with the 205B Series MIRAN SapphIRe Portable Ambient Air Analyzer, Style A Note: This product may be configured and supplied as an intrinsically safe device. Any disassembly of the product, or tampering within the analyzer enclosure will negate the intrinsically safe certification. - Page 198 Appendix F Parts and Accessories Parts used with the 205B Series Power Supply/Dual Battery Charger Analyzer, Style A Part No. 107152-00 Air Sampling Hose Assembly Part No. CR015AB ___________________________________ ___________________________________ Charger/Chassis Interface Cable Battery Pack Part No. TR101TN Part No. CR014GZ ___________________________________ __________________________________ Charger/Battery Pack Interface Cable...
- Page 199 Appendix F Parts and Accessories Printer Cable Parts used with the 205B Series Part No. TR101QX Analyzer, Style A *Pathlength Changing Tool Part No. TR101RV ___________________________________ *Battery Compartment Key Part No. X0173QH ___________________________________ Power Cord, 115V Part No. N0249XS ___________________________________ *Particulate Filter Part No.
- Page 200 Appendix F Parts and Accessories Accessories used with the 205B Series *Field Performance Verification Kit Part No. CR014LG Analyzer, Style A Leak Detection and Sampling Wand Part No. CR014QC ___________________________________ Transportation/Carrying Case Part No. CR013XM ___________________________________ Gas Delivery System Part No. CR014MA ___________________________________ ___________________________________ Closed Loop Calibration System...
- Page 201 Appendix F Parts and Accessories Analog Output Cable Part No. CR013VQ ___________________________________ 12V Charger Adapter Cable Part No. TR101TP...
- Page 203 Appendix G USING HYPERTERMINAL with the MIRAN SAPPHIRE The MIRAN SapphIRe is shipped with a Windows-based ThermoConnect program, which is the primary program, used to transfer data between the analyzer and a PC using an RS-232 connection. ThermoConnect does not work on some newer PCs running the Windows operating system.
- Page 204 Appendix G Using Hyperterminal with the MIRAN SapphIRe Note: The SapphIRe baud rate is user-selectable. While 19,200 baud is optimum, it may not be correct. The terminal program should be set to match the analyzer under 5=Report/Data, 3=Data transfer, 2=Change baud. The analyzer must be configured for TEXT-MANUAL transfer protocol before using a party terminal application.
- Page 205 Appendix H STANDARD LIBRARIES Detection Detection Accuracy Library Limit Limit (+/-% of Compound Name Acronym (see key) (ppm) (mg/m3) (ppm) (mg/m3) Wavelength Pathlength reading) ACETALDEHYDE ACETALD 1.44 9.140 Long ACETIC ACID ACETCACD 1.23 10.196 Long ACETIC ACID ACETCACD 0.15 0.37 8.636 Long ACETONE...
- Page 206 Detection Detection Accuracy Library Limit Limit (+/-% of Compound Name Acronym (see key) (ppm) (mg/m3) (ppm) (mg/m3) Wavelength Pathlength reading) CHLOROFORM CHCL3-L 0.07 0.34 13.058 Long CHLOROFORM CHCL3-L 2.45 8.372 Long m-CRESOL MCRESOL 1.77 8.756 Long CUMENE CUMENE 4.93 13.256 Long CYCLOHEXANE CYCLHEX...
- Page 207 Detection Detection Accuracy Library Limit Limit (+/-% of Compound Name Acronym (see key) (ppm) (mg/m3) (ppm) (mg/m3) Wavelength Pathlength reading) GEN HALOCARBONS (Chloroform) GENHAL-H 0.34 13.058 Short GEN HALOCARBONS (Chloroform) GENHAL-L 0.07 8.32 13.058 Long GEN HYDROCARBONS (Hexane) THCHEX 1766 0.25 1.02 3.333...
- Page 208 Detection Detection Accuracy Library Limit Limit (+/-% of Compound Name Acronym (see key) (ppm) (mg/m3) (ppm) (mg/m3) Wavelength Pathlength reading) NITROUS OXIDE 0.04 0.072 4.500 Long OCTANE OCTANE-H 1000 4681 23.41 3.333 Short OCTANE OCTANE-L 0.35 1.64 3.333 Long PENTANE PENTANE 2000 5913...
- Page 209 Detection Detection Accuracy Library Limit Limit (+/-% of Compound Name Acronym (see key) (ppm) (mg/m3) (ppm) (mg/m3) Wavelength Pathlength reading) STYRENE STYRNE-H 1000 4268 64.02 11.076 Short STYRENE STYRNE-L 2.56 11.076 Long STYRENE STYRNE-L 2.99 12.980 Long SULFUR DIOXIDE 3.15 8.780 Long SULFUR HEXAFLUORIDE (c)
- Page 211 INDEX Absorption Peaks ...........13-9 Accessories, Parts and ........F-1 Alarm Clear ............4-2 Alarm Settings for an Application ....7-24 Alarms, Configuring ........7-11 Alpha Characters, Entering ......4-3 Analog Output ..........4-17 Analysis............7-7 Analysis, To Begin.........5-4 Analysis Preferences ........7-15 Analysis Setup ..........7-8 Application View and Edit ......7-25 Batch Sample, Configuring ......7-17 Battery Conditioning ........3-7 Battery Indicator Calibration ......3-6...
- Page 212 Index Display ............4-1 Electromagnetic Energy .........13-1 Error Fault Messages ........5-7 Error Screens ..........4-13 Filter Maintenance .........10-1 Firmware Update ...........11-1 Flag Screens ...........5-8 Flowchart, Application View and Edit 7-25 Gas, Change ...........6-1 Gas Unit ............7-5 Humidity Compensation ........7-35 Humidity Compensation Table ......D-1 Hyperterminal ..........9-5, G-1 Identification ..........3-3 Information Screens ........4-12...
- Page 213 Index Maintenance ...........10-1 Matrix Parameters ..........7-40 Memory, Clearing Menu Selections, Making ......4-3 Operation............4-1 Optics, Care of ..........10-2 Particulate Filter Replacement .......10-1 Parts and Accessories ........F-1 Passcode Access ..........4-2 Passcode, Configuring the ......7-19 Pathlength, Changing ........4-16 Performance Verification .......12-1, E-1 Power Supply/Charger ........3-5 Preferences .............7-3 Pressure Compensation ........7-32 Print Menu .............9-2...
- Page 214 Index Site Info ............8-1 Site Selection for Report/Data Transfer ..9-1 Specifications ..........2-1 Startup Procedure ...........4-4 STEL Time Setting for an Application ..7-24 Temperature Compensation 7-32 Tutorial, Infrared Spectroscopy .....13-1 Unit Selection for an Application ....7-23 User Settings for an Application ....7-22 View Enable, Configuring ......7-18 Wand and Filters, Assembling .......3-4 Warranty ............A-1...
Need help?
Do you have a question about the MIRAN 205B Series and is the answer not in the manual?
Questions and answers