Furuno FEA-2807 Operator's Manual
Electronic chart display and information system (ecdis)
Hide thumbs
Also See for FEA-2807:
- Specifications (4 pages) ,
- Operator's manual (704 pages) ,
- Installation manual (168 pages)
Table of Contents
Advertisement
Quick Links
Download this manual
See also:
Installation Manual
Advertisement
Table of Contents
Troubleshooting

Related Manuals for Furuno FEA-2807


Summary of Contents for Furuno FEA-2807
- Page 1 OPERATOR'S MANUAL Electronic Chart Display and Information System (ECDIS) FEA-2107 FEA-2107-BB FEA-2807 Model www.furuno.com...
- Page 2 The paper used in this manual is elemental chlorine free. ・FURUNO Authorized Distributor/Dealer 9-52 Ashihara-cho, Nishinomiya, 662-8580, JAPAN B : JUL 2005 Printed in Japan All rights reserved. X : AUG . 06, 2013 Pub. No. OME-41220-X ( DAMI ) FEA-2107/BB/2807...
-
Page 3: Important Notices
How to discard a used battery Some FURUNO products have a battery(ies). To see if your product has a battery, see the chapter on Maintenance. Follow the instructions below if a battery is used. Tape the + and - terminals of battery before disposal to prevent fire, heat generation caused by short circuit. - Page 4 A warning label is attached to the The battery may burst if it is the wrong processor unit. Do not remove the label. type. If the label is missing or damaged, contact a FURUNO agent or dealer about replacement. Name: Warning Label (1) WARNING Type: 86-003-1011-0 To avoid electrical shock, do not Code No.: 100-236-230...
-
Page 5: Table Of Contents
Table of Contents Foreword ............................xv Virus Prevention ......................... xvii Introduction ........................1-1 Contents of This Manual ........................1-1 System Configuration .......................... 1-2 1.2.1 Single workstation........................1-2 1.2.2 Multiple workstation configuration ..................1-3 The Chart Processor Unit ........................1-4 How to Turn the Power On/Off ......................1-4 How to Find Version Number of ECDIS Software................ - Page 6 Table of Contents Set up Before Departure ....................6-1 How to Update Chart, Notes, User Chart, Chart Alerts............... 6-1 How to Create, Update a Route......................6-2 6.2.1 How to check your route against chart alerts ................6-2 6.2.2 How to recalculate timetable and ETA values ................ 6-2 How to Check and Prepare Route to Monitor ..................
- Page 7 Table of Contents 8.8.2 Additional messages in S57 chart load.................. 8-60 8.8.3 Standard messages in S57 SENC conversion................ 8-62 8.8.4 Additional messages in S57 SENC conversion ..............8-62 8.8.5 Changing service provider..................... 8-63 Vector Chart Display ......................... 8-64 8.9.1 How to select the vector chart material to use ............... 8-64 8.9.2 How to select charts to view....................
- Page 8 Table of Contents 9.13 How to Remove ARCS Charts from the System................9-28 9.13.1 How to manually remove an ARCS chart ................9-28 9.13.2 How to remove an ARCS chart group by "group" ..............9-29 9.14 ARCS Chart Display ......................... 9-30 9.14.1 How to display ARCS chart material..................
- Page 9 Table of Contents 13.4.3 How to use the Check page ....................13-8 13.4.4 How to use the Parameters page.................... 13-9 13.4.5 How to use the Prepare page ....................13-9 13.5 How to Modify an Existing Route....................13-10 13.5.1 Parameters ........................... 13-10 13.5.2 How to change waypoint position ..................
- Page 10 Table of Contents 16.3 How to Select Notes to use in Monitoring Mode ................16-4 16.4 How to Send Notes to the Radar Screen ................... 16-4 16.4.1 Monitor Notes dialog box description................... 16-5 16.5 How to Select Notes to use in Planning Mode .................. 16-6 16.5.1 Plan Notes dialog box description..................
- Page 11 Table of Contents 19.11 Wind Sensor ............................ 19-19 19.11.1 Installation parameter for wind sensor ................19-20 19.12 Depth Sensor ........................... 19-21 19.13 ROT Sensor ............................. 19-22 19.14 Sensor-related Alerts........................19-22 Tracked Targets (TT) Functions ..................20-1 20.1 How to Show, Hide Tracked Targets and Select Color and Size of TT Symbol ........ 20-1 20.2 Dangerous Tracked Targets .......................
- Page 12 Table of Contents 23.6.3 How to compensate for bearing error..................23-8 23.6.4 How to compensate for position error................... 23-8 23.7 Radar Overlay Related Alerts......................23-9 Recording Functions......................24-1 24.1 Introduction............................24-1 24.2 Events and Man Overboard Functions ....................24-1 24.3 Details Log............................
- Page 13 30.12 List of Alerts ............................30-6 30.12.1 Navigation alerts........................30-6 30.12.2 Chart alerts .......................... 30-23 30.12.3 Steering alerts with FURUNO Autopilot FAP-2000............30-23 30.12.4 Steering alerts with YOKOGAWA Autopilot PT-500A Cat. B .......... 30-28 30.12.5 Steering alerts with YOKOGAWA Autopilot PT-500A Cat. C .......... 30-31 30.12.6 Steering alerts with TOKYO KEIKI Autopilot PR-6000 ............
- Page 14 Table of Contents A4.2 Chart Subscription Service......................AP-34 A4.2.1 C-MAP service........................AP-34 A4.2.2 What is SENC delivery? ....................AP-34 A4.2.3 CM-ENC service (SENC delivery) ..................AP-35 A4.2.4 RENC service........................AP-36 A4.2.5 CM-93/3 Prof, CM-93/3 Prof+ and CM-93/2 services ............AP-37 A4.3 CM93/3 Chart Display ........................
- Page 15 Table of Contents A8.1.1 Input sentences ........................AP-97 A8.1.2 Output sentences......................... AP-97 A8.1.3 Data reception........................AP-97 A8.1.4 Sentence structure....................... AP-98 A8.2 Serial Interface..........................AP-117 A8.2.1 Input ports ........................AP-117 A8.2.2 Input/output ports ......................AP-118 Appendix 9: Parts List and Parts Location ............... AP-119 A9.1 Parts List............................
- Page 16 Table of Contents This page intentionally left blank.
-
Page 17: Foreword
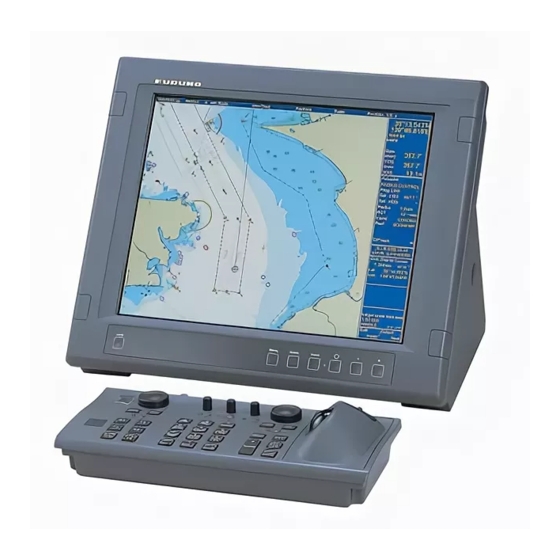
ECDIS displays electronic charts, nav lines, TT data, AIS targets and other navigation data on a high-resolution 19- inch or 20.1-inch (FEA-2107), or 23.1-inch display (FEA-2807). The FEA-2107-BB is supplied without a monitor, permitting use of the commercial monitor of your choice. - Page 18 S-57 Edition 3.1, S-57 Edition 3.1.1 and S-52 PresLib S-63 edition 06.2x S-57 Maintenance S-61 Edition 1.0 61174ed3 edition 3.4 Document (Cumulative) Number 8 You can find the latest ECDIS software maintenance on the internet, at the following address: http://furuno.com/en/business_product/merchant/product/ecdis/popup.html...
-
Page 19: Virus Prevention
Virus Prevention The ECDIS is not equipped with a virus checker. The ECDIS operates in real time; therefore, having a virus checker that periodically checks the equipment for viruses would increase the processing load, which can affect operation. However, you can prevent viruses by following the instructions in this section. When you update a chart The PC and medium (USB, floppy disk, etc.) used to download and store an update for an existing chart or a new chart may be infected with a virus. - Page 20 Virus Prevention This page intentionally left blank. xviii...
-
Page 21: Introduction
Introduction Contents of This Manual This manual provides the following information: • System configuration • Screen interpretation and use of the control unit • Set up before departure • Rules to replace paper charts with electronic ones • Chart material management •... -
Page 22: System Configuration
* Conning use MONITOR UNIT* MONITOR UNIT MU-201CE (FEA-2107) MU-201CE (FEA-2107) TT RADARS 100-230 VAC MU-190 (FEA-2107) MU-190 (FEA-2107) 100-230 NAVTEX MU-231CE (FEA-2807) MU-231CE (FEA-2807) TRACKPILOT LAN-ADAPTER MU-231 (FEA-2807) MU-231 (FEA-2807) LOG/DUAL AXIS LOG EC-1010 GYROCOMPASS 24 VDC CALCOMP NAVTEX... -
Page 23: Multiple Workstation Configuration
*Conning use MONITOR UNIT* MONITOR UNIT MU-201CE (FEA-2107) MU-201CE (FEA-2107) MU-190 (FEA-2107) MU-190 (FEA-2107) 100-230 VAC TT RADARS 100-230 MU-231CE (FEA-2807) MU-231CE (FEA-2807) NAVTEX MU-231 (FEA-2807) MU-231 (FEA-2807) TRACKPILOT LAN-ADAPTER LOG/DUAL AXIS LOG EC-1010 GYRO COMPASS 24 VDC... -
Page 24: The Chart Processor Unit
1. Introduction The Chart Processor Unit The chart processor unit is the heart of the system, and is responsible for the loading, storing, updating and processing of electronic sea charts, with the DVD-ROM drive and floppy disk drive. The DVD-ROM and floppy disk drives are behind the lid on the front panel. -
Page 25: Navigation Tasks
Navigation Tasks Overview Navigation tasks can be divided into four basic tasks: Voyage Positioning planning Navigation tasks Monitoring Steering Navigation tasks Voyage Planning Voyage planning is the preparation phase for a coming voyage. Preparation includes route definition, route calculation and route optimization. Required sea charts are also prepared in voyage planning, either by updating existing charts or creating new ones. -
Page 26: Route Planning
2. Navigation Tasks 2.2.1 Route planning A route can be created two ways: Modify an existing route to create a new route or create a new route from scratch. A route consists of the following: • Position of each waypoint •... -
Page 27: Positioning
2. Navigation Tasks Positioning Positioning means using all available methods available to calculate and keep ship’s position up-to-date during a voyage. The calculation of ship’s position is based on available navigation sensors. The system integrates valid information from different sensors and uses the Kalman filter technology for final position calculation. Direct Dead reck. -
Page 28: Monitoring
2. Navigation Tasks Monitoring Monitoring means a continuous check of navigation data, operator actions and performance of the system. Another part of the monitoring is the display of electronic sea charts and conning information. Electronic chart Data Alarms distribution Monitoring Data overboard logging... -
Page 29: Ecdis Display
ECDIS Display ECDIS Overview The ECDIS (Electronic Chart Display and Information Systems) screen is divided into several areas. The Status bar, which is always shown at the top of the screen, mainly displays equipment status. The boxes at the right side of the screen comprise the Information areas. They are permanently displayed and show information such as your ship's position, alerts generated by the system, workstation mode and cursor position. -
Page 30: Electronic Chart Area
3. ECDIS Display Electronic Chart Area The ECDIS can use the following types of charts: • S-57 (IHO) • S-63 (IHO) • ARCS (UK-HO) • CM-ENC (C-MAP) • CM-93/2 (C-MAP) • CM-93/3 (C-MAP) The following information can also be displayed: •... - Page 31 3. ECDIS Display CM-ENC: C-MAP produced official ENC chart that complies with the IHO's (International Hydrographic Organisation's) S-57 Edition 3 product specification. When used in an ECDIS, the ENC data improves the safety of navigation at sea. (WT) S57 vector chart ARCS raster format ARCS charts are digital reproductions of British Admiralty (BA) paper charts.
-
Page 32: User Interface
3. ECDIS Display User Interface The user interface is defined as the areas that do not display the electronic chart, either raster chart or vector chart. The user interface contains information about settings, parameters and selections used by the ECDIS. The nature of the information displayed can be either static (such as name of a certain window, fields in chart legend, units, etc.) or dynamic (such as position of your ship, time, operator selections, etc.). -
Page 33: Information Area
3. ECDIS Display 3.3.2 Information area The information area displays your ship's position, course and speed and the cursor's location on the chart Information from the positioning sensors: • HDG: Heading and its source if it is not true gyro. (WT) •... -
Page 34: Sidebar On User Interface
3. ECDIS Display 3.3.3 Sidebar on user interface You may select what kind of information to display in the sidebar (right side) of the ECDIS. The options shown below are available and the content of the sidebar windows change with the devices and sensors connected to the system. - Page 35 3. ECDIS Display How to open the sidebar Sidebar(s) may be opened as shown below. Two sidebars may be displayed. 1. Put the cursor on the area shown. 2. "Select Sidebar" appears in the mouse functions area. (WT) See figure at right. 3.
- Page 36 To WPT: The waypoint that the ship is approaching. The following steering modes are available with the • Dist WOP (Wheel Over Point): Distance to the FURUNO Autopilot FAP-2000. See the operator's point where rudder order for course change at "To manual for the trackpilots. WPT" is given.
- Page 37 3. ECDIS Display Information in autopilot sidebar The following information is shown in the autopilot sidebar. • Steering mode (below "Autopilot") • Prog CRS: If you use program track or program heading change steering modes, planned course is shown. • Set CRS: Actual set course •...
-
Page 38: How To Activate Dialog Boxes On The Display
3. ECDIS Display 3.3.4 How to activate dialog boxes on the display The dialog boxes provide information to the use or a means to change equipment settings. The boxes are activated by mouse-clicking over certain areas on the ECDIS display. Put the cursor on the appropriate area then click the right or left mouse button to display the corresponding dialog box on the ECDIS display. - Page 39 3. ECDIS Display Additional menu functions in dialog boxes Dialog boxes that have a triangle at their upper left-hand corner contain a menu that provides additional functions. See the figure at right. Put the cursor on the triangle to show a menu from which to select additional functions.
-
Page 40: How To Control Planning And Monitoring Modes
3. ECDIS Display How to Control Planning and Monitoring Modes A route, a user chart or Notes can be selected from the information area, in either the planning mode or the monitoring mode. To select desired mode, put the cursor on the text Route, User Chart or Notes in the information area and click. A drop-down dialog box appears, where you can select either Monitor or Plan by clicking the appropriate button with the left mouse button. -
Page 41: Control Units
Control Units How to Control the ECDIS The operator controls the ECDIS with the Control Unit RCU-018 or the Control Unit RCU-015. Either unit is equipped with a trackball, right and left mouse buttons and a scrollwheel. The RCU-018 is additionally equipped with a keyboard. -
Page 42: Control Description
4. Control Units 4.2.1 Control description Description Power Turns the system on/off. (This control does not switch the display on/off.) VRM rotary Adjusts active VRM. encoder VRM ON Activates and displays VRM 1 if none is displayed or VRM2 is active. Activates and displays VRM 2 if VRM1 is active. -
Page 43: Control Unit Rcu-015
4. Control Units Control Unit RCU-015 The Control Unit RCU-015 provides minimum configuration with controls that function as described below. Power: Turns the system on/off. (This control does not switch the display on/off.) F1-F4: Execute function assigned. Press more than two seconds to restore monitor brilliance to calibrated state. -
Page 44: How To Activate A Menu Or Function With A Hot Key
4. Control Units In the example in the figure at the bottom of page 4-3, the function of each hot key is as below: F1: Opens Chart Display dialog box. F2: Sets Standard Display settings on display. F3: Opens Chart menu. F4: Acknowledges alerts generated by ECDIS. -
Page 45: How To Change Co-Ordinate Polarity
4. Control Units 4.5.3 How to change co-ordinate polarity By clicking co-ordinate polarity 1. Put the cursor before the co-ordinate (N, S, E, W) then push the left mouse button. 2. Spin the scrollwheel to select desired polarity then push the scrollwheel. By choosing polarity from drop-down menu 1. -
Page 46: The Scrollwheel
4. Control Units 4.5.5 The scrollwheel Items directly controlled by the scrollwheel Selections can be made on the screen by pointing on the screen with the cursor then scrolling various options with the scrollwheel. When you put the cursor on a text or a numeric it turns green, purple or blue (depending on Palette in use) to indicate that the scrollwheel can be used to scroll options available or change the value of a numeric. - Page 47 4. Control Units Scrollwheel incrementing direction The scrollwheel incrementing direction can be selected to normal (forward) or reverse. 1. Open the Initial Settings menu. Function keys Operation Parameter backup Digitizer Backup and Restore Installation parameters Navigation parameters Chart Alert parameters Optimization parameters Print Navigation parameters Print Optimization parameters...
-
Page 48: How To Call Menus And Functions By The Mouse Buttons
4. Control Units 4.5.6 How to call menus and functions by the mouse buttons The mouse buttons can be used to call menus or functions on the display. At the lower right corner of the display the mouse functions area displays available function or menu name, as shown in the figure below. Spin the scrollwheel to select menu or function desired then push the left mouse button, scrollwheel or right mouse button as appropriate to access the menu or function desired. -
Page 49: Standby Mode
Standby Mode How to Switch Standby Mode ON and OFF The standby mode deactivates the audio alarms from the ECDIS. Use it while in harbour or other similar situation where use of the ECDIS is not required. When you switch the Standby mode to ON, Human Interface, ARCS and S57 drawing processes are automatically restarted. - Page 50 5. Standby Mode This page intentionally left blank.
-
Page 51: Set Up Before Departure
Set up Before Departure How to Update Chart, Notes, User Chart, Chart Alerts How to update chart material Update your ARCS and S57 chart material before embarking on a new voyage. See Chapter 9 "Raster Chart Material" for ARCS charts and section 8.2 for S57 charts. Display and approve dates for S57 charts and manual updates Note: It is very important that you set the Display and Approve dates for S57 charts as the current date. -
Page 52: How To Create, Update A Route
6. Setup Before Departure How to Create, Update a Route Create a new route or modify an existing one. See Chapter 13 "Route Planning". 6.2.1 How to check your route against chart alerts Before you sail your route, you should always check your route against chart alerts. This is important because your S57 charts and manual updates may contain chart viewing dates information. -
Page 53: How To Check And Prepare Route To Monitor
6. Setup Before Departure How to Check and Prepare Route to Monitor Select a route for the next voyage: select Route from the menu then click the Monitor button. See section 14.2 "How to Select Route to Monitor". Average SPD If the text "Checked conditions differ"... -
Page 54: How To Confirm Checked Conditions Of The Route Plan
6. Setup Before Departure 6.3.3 How to confirm checked conditions of the route plan You can check on the Alerts page if checked conditions are used with the route in route monitoring. If the text "Current selection differs" is displayed, use Initial Settings>Chart alert parameters to make "Chart alerts"... -
Page 55: Planned User Chart
6. Setup Before Departure 6.3.4 Planned user chart To check if planned user chart is selected, open the Selections page in the Monitor Route dialog box to check that you have the correct user chart This has been in the monitoring changed after Route mode. -
Page 56: Configuration Of Navigation Sensors
6. Setup Before Departure Configuration of Navigation Sensors The operator can select navigation sensors for use in navigation and view their current values. There are "pages" for speed and course and position. The figure below shows the SPD/CRS page. The presence or absence of a checkmark in a checkbox shows whether the sensor is used for integrated navigation or not. - Page 57 Primary-Secondary-OFF indicates sensor status and priority. (In the figure at right the primary sensor is DGPS, FURUNO.) Position in local datum, speed and course are also shown. If a differential signal is in use with a DGPS position the text "Diff" appears.
-
Page 58: How To Reset Distance And Trip Counters
6. Setup Before Departure How to Reset Distance and Trip Counters Reset menu Record menu To reset the distance and trip counters, do the following: 1. Spin the scrollwheel to show Menu/Info/Chart Menu in the mouse functions area then push the left mouse button. -
Page 59: Conditions Required To Replace Paper Charts
Conditions Required to Replace Paper Charts Introduction Carriage requirements for adequate and up-to-date charts for a voyage can be found in SOLAS Chapter V/20 of 1974. In resolution A.817(19), IMO has specified how those requirements can be fulfilled with a device called ECDIS. - Page 60 7. Conditions Required to Replace Paper Charts Can your ECDIS replace paper charts Is ECDIS type- approved according IEC 61174? Do you have type-approved electronic back-up arrangement? (i.e. second ECDIS) You should use paper charts Go to flow chart Are official ENCs available RCDS, on the for intended voyage? next page.
- Page 61 7. Conditions Required to Replace Paper Charts RCDS (Raster Chart Display system) Is ECDIS type approved according IEC 61174 including RCDS mode (Appendix 7)? Are Raster charts available for intended You should use voyage? paper charts Have you included the latest updates into your ECDIS? Have you a...
-
Page 62: How To Detect Enc Coverage In S57 Chart Display
7. Conditions Required to Replace Paper Charts How to Detect ENC Coverage in S57 Chart Display The electronic chart system can display more than one S57 chart cell at a time. This feature is called multi-cell display. If one S57 chart cell does not cover the whole display, the system opens more S57 chart cells for display, if appropriate cells for the displayed area are available. -
Page 63: Vector Chart Material
Vector Chart Material Introduction Theoretically a chart can be coded for use on a computer as raster or vector chart. Vector-coded charts are coded using a variety of techniques. One technique is called S57ed3 and it has been selected by IMO as the only alternative for SOLAS compliant electronic charts. - Page 64 8. Vector Chart Material Each S57 chart may contain additional links to textual descriptions or pictures, besides the chart itself. Typically additional textual descriptions and pictures contain important sailing directions, tidal tables and other traditional paper chart features that do not have any other method to be included into the S57 chart. This ECDIS copies these textual descriptions and pictures into its hard disk so the user may cursor-pick them for viewing purposes.
-
Page 65: Chart Legend For S57 Chart
8. Vector Chart Material 8.2.2 Chart legend for S57 chart The chart legend, which provides various data about the chart currently displayed, can be toggled on and off by placing the cursor in the sidebar, clicking the right mouse button, choosing Chart Legend from the menu then pushing the scrollwheel. -
Page 66: Permanent Warnings For S57 Charts
8. Vector Chart Material 8.2.3 Permanent warnings for S57 charts Permanent warnings help you keep the S57 charts up-to-date and these are shown at the top left corner on the screen. Only up-to-date S57 charts can be legal replacement for paper charts. Permanent warnings appear if the system detects a condition that may cause the use of charts that are not up-to-date. -
Page 67: How To Load S57 Charts
8. Vector Chart Material How to Load S57 Charts 8.3.1 Flow chart for loading S57 charts into ECDIS Loading ENC into ECDIS Load S57 charts from CD Open SENC convert window. window Wait until all conversions are completed Do you want to see If any ENC conversion fails, result of SENC conversion? a failed senc conversion... - Page 68 8. Vector Chart Material POINT 1 During SENC conversion the system sets Display Until date for the current system date Make a visual inspection for changes in ENCs Added objects are marked with orange circle symbols Do you want to see changes Deleted objects are marked before approving them? with orange slash symbols...
-
Page 69: How To Load S57 Charts From A Cd-Rom, Floppy Disk, Usb Memory Or Lan
8. Vector Chart Material 8.3.2 How to load S57 charts from a CD-ROM, floppy disk, USB memory or LAN When you load S57 charts, by CD-ROM floppy disk, USB memory or LAN, the system first loads a CD-ROM catalogue, which stores certain information into your hard disk such as the position and edition number of cell ID. Then, the system asks which charts you want to load from the selected media. - Page 70 8. Vector Chart Material 4. In the Load or Update Charts from loaded CD-ROM window (see page 8-10), select the charts to load into the ECDIS. BE SURE TO CHECK "Permit". IMPORTANT! Check "Permit" 5. Click the Load button to load charts into the ECDIS. See also "Interpretation of Load or Update Charts from loaded CD-ROM dialog box"...
- Page 71 8. Vector Chart Material 8. When conversion is completed, the following window appears. 9. Remove the CD-ROM (floppy or USB memory) and insert next CD-ROM (floppy or USB memory). 10. Do step 2 to 10 to repeat the procedure for remaining CD-ROM (floppy or USB memory). 11.
- Page 72 8. Vector Chart Material How to interpret Load or Update Charts from loaded CD-ROM window (WT) 1. The source and edition date of the CD is displayed here. 2. A list of charts stored in the CD-ROM, edition number of the chart and the number of updates included in the chart.
- Page 73 8. Vector Chart Material Publisher notes You should read the text file associated with each catalogue. The text file typically contains very important notices for the usage of the charts from the producing Hydrographic Office. Click the View CD-ROM Publisher Notes button in the Load or Update Charts from loaded CD-ROM dialog box.
- Page 74 8. Vector Chart Material How to display load history of CD-ROM You can view what is loaded from a CD-ROM using Load History, which is in the Load or update Charts from CD- ROM dialog box. 1. Show the Load or Update Charts from loaded CD-ROM dialog box. (See page 8-10.) 2.
- Page 75 8. Vector Chart Material How to remove an unnecessary CD-ROM catalogue (WT) If you have unnecessary CD-ROM catalogues on your CD-ROM list, you can remove them as follows: 1. Show the Load or Update Charts from loaded CD-ROM dialog box. (See page 8-10.) 2.
- Page 76 8. Vector Chart Material Messages that contain only notice If you tried to load chart data that is older than you already have in your hard disk, you will get one of the following messages: This indicates that you are using a newer edition of the chart mentioned in the box.
- Page 77 8. Vector Chart Material Messages that require careful attention All messages in this section change the legal status of the charts in your system. Study these messages very carefully because you may need to use paper charts to fulfil SOLAS requirements. Test before ENC to SENC conversion fails CRC checksum is tested before the SENC conversion and if it fails you...
- Page 78 8. Vector Chart Material You do not have all the published updates If you tried to load updates and you missed one or more updates between updates already loaded into your hard disk and the updates that you are loading, you get this message. The message above indicates that you tried to load update numbers 3, 4 and 5 when at least update 2 and possibly update 1 were not available in your hard disk.
-
Page 79: How To Load S57 Charts That Are Not Fully Compliant With The Imo Standards
8. Vector Chart Material 8.3.3 How to load S57 charts that are not fully compliant with the IMO standards The ECDIS can, in some cases, load S57 charts that do not have full compliance with S57 standard coding for transfer media. Minimum requirements for loading manually is legally coded: •... -
Page 80: S57 Senc Conversion Details
8. Vector Chart Material S57 SENC Conversion Details S57 charts from Hydrographic Offices are called ENCs. An ENC has to be converted into SENC format before it can be used in the ECDIS. The ECDIS can convert ENC into SENC format automatically. If the conversion is successful, the Failed SENC conversion window does not appear. -
Page 81: How To Display Progress Of Senc Conversion
8. Vector Chart Material 8.4.3 How to display progress of SENC conversion If you want to view the progress of SENC conversion, display the SENC CONVERSION window as follows: 1. Spin the scrollwheel to display Menu/Info/Chart Menu in the mouse functions area then push the right mouse button. -
Page 82: Failed Senc Conversions Window
8. Vector Chart Material 8.4.4 Failed SENC conversions window If the system is unable to convert ENC into SENC without error or failure, the Failed SENC conversions window appears with a list of failed ENCs. "Errors" in the Status column means that the system detected minor or major errors in the conversion of the ENC into the SENC. -
Page 83: Senc Conversion History Log
8. Vector Chart Material 8.4.5 SENC conversion history log The system automatically records the results of all conversions into the conversion history log. You can view the content of this log at any time by doing the following: 1. Spin the scrollwheel to display Menu/Info/Chart Menu in the mouse functions area then push the right mouse button. - Page 84 8. Vector Chart Material Conversion errors, but the chart is partly usable as NON ENC Use cell status to check details of errors. The chart is no longer ENC if it was produced by a Hydrographic Office. You must refer to a paper chart as legal primary aid of navigation, when you navigate in the area covered by this chart.
-
Page 85: How To Use Senc Convert Window To Initiate Senc Conversion
8. Vector Chart Material 8.4.6 How to use SENC convert window to initiate SENC conversion Normally automatic SENC conversion is selected and there is no need to initiate SENC conversions (from the SENC convert window). If you do not use the automatic SENC conversion, you need to manually initiate SENC conversion. -
Page 86: Features Of The Chart Menu
8. Vector Chart Material Features of the Chart Menu 8.5.1 Overview of the chart menu The Chart menu provides various features for processing charts. To display the menu, spin the scrollwheel to display Menu/Info/Chart Menu in the mouse functions area then click the right mouse button. Activate ARCS chart: This function activates ARCS chart onto the screen. - Page 87 8. Vector Chart Material System System contains a set of additional selections, and they are described below: Log file: The log file contains various system events that might be useful when your system supplier tries to find the reason for unexpected behavior of the system reported by you. User permit: Check your user permit, which is used as your identifier in security systems such as PRIMAR and C-MAP.
-
Page 88: Catalogue Of S57 Cells
8. Vector Chart Material 8.5.2 Catalogue of S57 cells An S57 catalogue is used to view graphical coverage of the charts stored in your hard disk, available in a named "CD-ROM" or available from an RENC. Available charts are displayed using their limits of charts. Sometimes the real coverage of a chart may be considerably less than its declared limits. - Page 89 8. Vector Chart Material 3. Selected Chart • Cell: Name of the chart • Cell Status: Open Cell Status window. • Open: Open selected chart to ECDIS display. 4. Edit Group: See section 8.5.5 "How to group S57 chart cells". 5.
-
Page 90: How To Display Status And Setting Viewing Dates Of S57 Chart Cells And Their Updates
8. Vector Chart Material 8.5.3 How to display status and setting viewing dates of S57 chart cells and their updates When you load S57 chart cell(s) and/or their updates, the system sets Display Until of S57 chart cell(s) as current date of the system. -
Page 91: How To Remove S57 Chart Cells From The System
8. Vector Chart Material 8.5.4 How to remove S57 chart cells from the system How to remove specific chart cells from the system To remove an S57 format vector chart cell from the system, do the following: 1. Select Remove Charts from the Chart menu. 2. - Page 92 8. Vector Chart Material How to remove all chart cells from the system 1. Select Remove Charts from the Chart menu. 2. Select all directories in Contents list, except 7C<DIR> (background charts of system) and AA<DIR> ( ECDIS 1 charts). 3.
-
Page 93: How To Group S57 Chart Cells
8. Vector Chart Material 8.5.5 How to group S57 chart cells You can define groups of S57 charts. This means you can collect related charts, for example, all cells that cover a route from Liverpool to New York or all cells available from a National Hydrographic Office. You can make a group and define charts included to group using either "Chart Catalogue"... - Page 94 8. Vector Chart Material 3. Click the New Group button. HDG (MAN) 289.0° SPD (MAN) 0.0kn (MAN) 0.0kn COG (MAN) 289.0° SOG (MAN) 0.0kn ° 03.400'N 1.453 NM ° ° 58.372'E 352.0 4. Enter a name for the group, click the OK button then click the Add Frame button. 8-32...
- Page 95 8. Vector Chart Material 5. Define a frame. HDG (MAN) 289.0° SPD (MAN) 0.0kn (MAN) 0.0kn COG (MAN) 289.0° SOG (MAN) 0.0kn ° 03.400'N 1.453 NM ° ° 58.372'E 352.0 6. When you have completed the frame, click the Done button. 7.
- Page 96 8. Vector Chart Material 8. Select Group as a qualifier for loading. HDG (MAN) 289.0° SPD (MAN) 0.0kn (MAN) 0.0kn COG (MAN) 289.0° SOG (MAN) 0.0kn ° 03.400'N 1.453 NM ° ° 58.372'E 352.0 9. Now you can load charts of the group by clicking the Load button. How to group by chart catalogue window The Chart Catalogue can be used to define a group as follows: 1.
- Page 97 8. Vector Chart Material 3. Enter a name for the group then click the OK button. HDG (MAN) 289.0° SPD (MAN) 0.0kn (MAN) 0.0kn COG (MAN) 289.0° SOG (MAN) 0.0kn RENC RENC SENC SENC C-Map C-Map ° 03.400'N 1.453 NM °...
- Page 98 8. Vector Chart Material 6. Select Group to view content of group in Chart Catalogue window. HDG (MAN) 289.0° SPD (MAN) 0.0kn (MAN) 0.0kn COG (MAN) 289.0° SOG (MAN) 0.0kn RENC SENC C-Map ° 03.400'N 1.453 NM ° ° 58.372'E 352.0 8-36...
- Page 99 8. Vector Chart Material How to remove S57 chart cells from a group You can remove chart cells from a defined group as follows: 1. Select desired group then click the Edit Group button. HDG (MAN) 289.0° SPD (MAN) 0.0kn (MAN) 0.0kn COG (MAN) 289.0°...
- Page 100 8. Vector Chart Material How to delete a group You can delete a group as follows: HDG (MAN) 289.0° SPD (MAN) 0.0kn (MAN) 0.0kn COG (MAN) 289.0° SOG (MAN) 0.0kn RENC SENC C-Map Use Remove button to delete a group. °...
-
Page 101: S57 Chart Service From An Renc
8. Vector Chart Material S57 Chart Service from an RENC 8.6.1 Introduction Before you can use an RENC service, you have to be authorized as a customer of an RENC. To be authorized you have to contact an official distributor (chart agent) of RENC. Then, the following services are available: 8.6.2 Permits Permits are used to control the permission to use a chart. -
Page 102: Cd-Rom Service
8. Vector Chart Material 8.6.5 CD-ROM service If you are using a CD-ROM service, you receive the following from an RENC: • Base CD-ROM that contains all available Base cells in an RENC CD-ROM database when the CD-ROM was released. •... -
Page 103: Services Provided By An Renc
8. Vector Chart Material 8.6.7 Services provided by an RENC How to display the coverage of an RENC service To view the Product List in graphical presentation, use the catalogue, which you may display by opening the Chart menu and choosing Chart Catalogue. The catalogue of S57 charts shows when you last ordered the Product List from an RENC or loaded the latest Base or Update CD-ROM into the ECDIS. -
Page 104: How To Find Up-To-Date Status Of A Chart From An Renc
8. Vector Chart Material 8.6.8 How to find up-to-date status of a chart from an RENC To keep charts up-to-date, you should check for updates with an RENC weekly. The ECDIS compares charts used to Product List of an RENC. If a Permanent Warning appears on the chart display of ECDIS (at the upper left corner), this means that the charts used were checked against the Product List and at least one of the charts used is not up-to- date. -
Page 105: How To Find Up-To-Date Status Of An Renc Product List
8. Vector Chart Material 8.6.9 How to find up-to-date status of an RENC Product List The ECDIS periodically checks for the last time you ordered the Product List from an RENC. If the Product List is more than 30 days old, the ECDIS displays the S57 Message shown below: To check the date when you last ordered the Product List of RENC, select "Chart viewing dates"... -
Page 106: How To Manage Permits From An Renc
8. Vector Chart Material 8.6.10 How to manage permits from an RENC Permits are used to control the right to use a chart in the ECDIS. A permit in an RENC ENC service is connected to the edition of a chart. Permits are issued in two different types: •... -
Page 107: How To Manage Public Key From An Renc, Jha
8. Vector Chart Material Subscription warnings If you have at least one subscription-type permit, the system will automatically warn you about the expiration date of your subscription license. Warning about soon-to-be-expired subscription is activated every 12 hours when it is less than 30 days from the expiration date. - Page 108 8. Vector Chart Material 96EF 14E3 2BA5 3729 28F2 4F15 B073 0C49 D31B 28E5 C764 1002 564D B959 95B1 5CF8 800E D54E 3548 67B8 2BB9 597B 1582 69EO 79F0 C4F4 926B 1776 1CCB 9EB7 7C98 7EF8 Public key dialog box for PRIMAR, AVCS 96EF 14E3 2BA5 3729 28F2 4F15 B073 0C49 D31B 28E5 C764 1002 564D B959 95B1 5CF8...
-
Page 109: Cd-Rom Service From An Renc
8. Vector Chart Material CD-ROM Service From an RENC 8.7.1 Flow table for how to get started with RENC-provided S57 charts How to get started with a CD-ROM service Make a Subscription / End User Agreement with your chart Distributor Send a list of Charts to your Distributor. -
Page 110: How To Keep Renc-Provided S57 Charts Up To Date
8. Vector Chart Material 8.7.2 How to keep RENC-provided S57 charts up to date How to keep current Charts up-to-date in a CD-ROM service Subscription type: Subscription type: Subscription One-Off You received a weekly or monthly packet If you received new Permits, You do not receive load them into ECDIS automatically anything... -
Page 111: How To Expand Chart Coverage With An Renc
8. Vector Chart Material 8.7.3 How to expand chart coverage with an RENC How to expand coverage in a CD-ROM service Use Catalogue of S57 Charts to select additional Charts Send a list of Charts to your Distributor. Remember Subscription type. You received new Permits, etc. -
Page 112: Base Cd-Rom From An Renc
8. Vector Chart Material 8.7.4 Base CD-ROM from an RENC A Base CD-ROM from an RENC contains all the charts stored in an RENC when the CD-ROM was issued. When you load charts (using the CD-ROM catalogue) the following information is also loaded into the ECDIS hard disk: •... - Page 113 8. Vector Chart Material 5. In the Load or Update Charts from loaded CD-ROM window, select the charts to load into the ECDIS, then click the Load button to load charts into the ECDIS. (MAN) 289.0° (MAN) 0.0kn (MAN) 0.0kn (MAN) 289.0°...
- Page 114 8. Vector Chart Material 7. The SENC CONVERSION window appears. Charts are loaded into ECDIS then automatically converted to SENC format. 8. If an error is detected during conversion from ENC to SENC, the following window appears. To find the reason, click the Details button.
- Page 115 8. Vector Chart Material How to interpret load or update charts from loaded CD-ROM window (MAN) 289.0° (MAN) 0.0kn (MAN) 0.0kn (MAN) 289.0° (MAN) 0.0kn ° 03.400'N 1.453 NM ° ° 58.372'E 352.0 1. The source and edition date of the CD is displayed here. 2.
-
Page 116: How To Load An Update Cd-Rom From An Renc
8. Vector Chart Material 8.7.5 How to load an update CD-ROM from an RENC An Update CD-ROM from an RENC contains all the updates included for charts stored in an RENC when the latest Base CD-ROM was issued. When you load charts by a CD-ROM catalogue the following information is also loaded into the ECDIS hard disk: •... - Page 117 8. Vector Chart Material 4. In the Load or Update Charts from loaded CD-ROM window (see page 8-10), select the charts to load into the ECDIS, then click the Load button to load charts into the ECDIS. (MAN) 289.0° (MAN) 0.0kn (MAN) 0.0kn...
- Page 118 8. Vector Chart Material The SENC CONVERSION window appears. Charts are loaded into ECDIS then automatically converted to SENC format. If an error is detected during conversion from ENC to SENC, the following window appears. To find the reason click the Details button. When the conversion is completed, the following window appears.
- Page 119 8. Vector Chart Material How to display coverage of a Base or Update CD-ROM from an RENC Insert desired CD-ROM into CD-ROM drive. Open the Chart menu then select Load or Update Charts followed by from CD-ROM. (MAN) 289.0° (MAN) 0.0kn (MAN) 0.0kn...
-
Page 120: How To Load An Renc-Generated Permit Cd-Rom, Floppy Disk Or Usb Memory
8. Vector Chart Material 8.7.6 How to load an RENC-generated permit CD-ROM, floppy disk or USB memory An RENC can deliver permits in a CD-ROM, floppy disk or USB memory. When you receive new permits from an RENC, you have to load them into the ECDIS. A permit is a key that is used to decrypt the chart you want to use in the ECDIS. - Page 121 8. Vector Chart Material If one or more permit(s) has format error, you get the following message. Please contact RENC service to get the new permit file. If you load permits from a different ECDIS, you get the following message. Check that you are loading permits to the correct ECDIS.
-
Page 122: Renc Security System
8. Vector Chart Material RENC Security System 8.8.1 Standard messages in S57 chart load When loading S57 charts into the ECDIS, messages appear to alert you to permits and authentication. These are described below and on the next several pages. 8.8.2 Additional messages in S57 chart load Issue control of Base and Update CD-ROM from RENC... - Page 123 8. Vector Chart Material Messages that contain only notice If you tried to load charts for which you do not have permit, you will get this message: Messages that require careful attention All messages in this section change the legal status of the charts in your system. Study these messages carefully because you may need to use paper charts to fulfil SOLAS requirements.
-
Page 124: Standard Messages In S57 Senc Conversion
8. Vector Chart Material Authentication of chart failed The chart was not loaded because of invalid Public key. The chart was not loaded because of invalid Signature. Coding error in Signature. 8.8.3 Standard messages in S57 SENC conversion When converting S57 charts for use in the ECDIS, messages appears to alert you during the conversion. For details see section 8.4.5 "SENC conversion history log". -
Page 125: Changing Service Provider
8. Vector Chart Material Messages that require careful attention Permit for a chart has expired. You have a permit, but it is valid for another edition of the cell or for another RENC service. You can check the edition of the permit with the Chart Permits window and the edition of a chart with the Cell Status window, both in... -
Page 126: Vector Chart Display
8. Vector Chart Material Vector Chart Display 8.9.1 How to select the vector chart material to use To activate S57 chart material onto the display, do the following: 1. Open the Chart menu then select Activate S57 chart. 2. Select Ignore Scale (show S57 chart in scale used previously to open an S57 chart) or Sync Scale (show S57 chart in same scale as ARCS chart). -
Page 127: How To Select A Chart By Its Name On The Display
8. Vector Chart Material How to look for charts around own ship You can use either true motion or relative motion. In the true motion mode, own ship moves until it reaches the true motion reset borderline, where it jumps back to an opposite position on the screen based on ship’s course. In the relative motion mode, own ship stays in a fixed position, while the chart moves on screen. -
Page 128: How To Control Visible Chart Features
8. Vector Chart Material 8.9.4 How to control visible chart features The Chart Display dialog box contains several pages of chart features that you may adjust as appropriate. To display this dialog box, spin the scrollwheel to show Chart Display/Info/Standard Display in the mouse functions area then push the left mouse button. - Page 129 8. Vector Chart Material Chart page Chart Display Black and grey color symbol: This symbol verifies that you can distinguish black (frame of symbol) and grey (inner part of symbol) colors with current contrast and brilliance settings. DISP dimmer: Use this control to adjust dimming of the display. The text "CALIB" indicates that the dimmer setting is within the calibration values.
- Page 130 8. Vector Chart Material For TWO COLOR, the chart display uses only two colors: • Deeper than safety contour • Shallower than safety contour Boundaries: Set how to display boundaries of some chart features. The options are: • Plain: The line styles are limited to plain solid and dashed lines. •...
-
Page 131: Display Base
8. Vector Chart Material "Standard, Other 1 and Other 2" pages The Standard page contains chart features defined by IMO that comprise a standard display. You can recall the standard display at any time using a single action, by pressing the STD DSP key on the Control Unit RCU-018, or displaying Chart Display/Info/Standard Display in the mouse function area and pushing the right mouse button. -
Page 132: How To Control Visible Navigation Features
8. Vector Chart Material 8.9.6 How to control visible navigation features Visibility control of the navigation features is divided into five pages in the Symbol Display dialog box: Route page: Controls planned and monitored route. Tracking page: Controls past tracks and some other features. Mariner page: Controls Notes and user charts. - Page 133 8. Vector Chart Material Tracking page Symbol Display Past tracks • System: Plot own ship’s tracks using system-fed position. • Primary: Plot own ship’s past track with position fed from the primary sensor. • Secondary: Plot own ship’s past track with position fed from a secondary sensor.
- Page 134 8. Vector Chart Material Targets page Symbol Display Color: Select color of target from the list box. TT: Select size of tracked target symbols to Std or Small. AIS: ROT (º/min), limit to display AIS target with curved speed vector. Note: Source of ROT must be ROT gyro on target vessel.
- Page 135 8. Vector Chart Material Mariner page Symbol Display Notes Position: Check to show positions of Notes records with symbols on the chart. Range: Check to circumscribe Notes records with circles on the display. The size of a circle depends on the value set in Notes. Text: Check to show text of Notes records on the chart.
- Page 136 8. Vector Chart Material General page Ship Outlines True outline shown if "Beam width>6 mm / Length>6 mm". You can set whether width or length is used to set limit for displaying true symbol. Ship outlines: Choose OFF or ON to show ship symbol minimized or scaled symbol, respectively.
-
Page 137: How To Store And Recall Chart Display Settings For Visible Chart And Navigational Features
8. Vector Chart Material 8.9.7 How to store and recall chart display settings for visible chart and navigational features Chart display settings and symbol display settings use common settings, which means that when you select settings display settings the same file is selected for symbol settings. You can define chart display and symbol display settings that are displayed over S57 charts cells. -
Page 138: Control Of Predefined Imo Chart Display Settings
8. Vector Chart Material 8.9.8 Control of predefined IMO Chart Display Settings There are three sets of predefined Chart Display Settings that can be used to display Charts with certain chart features. The predefined Chart Display Settings are as follows: •... -
Page 139: Sailing Directions, Tidal Tables, Etc., Features Of Vector Charts
8. Vector Chart Material 8.10 Sailing Directions, Tidal Tables, etc., Features of Vector Charts Vector charts contain sailing directions, tidal tables and other textual and picture information that is not immediately visible on the chart. This information forms an integral part of the legal ENC chart that can fulfil SOLAS requirements and thus replace a paper chart. -
Page 140: Chart Viewing Dates And Seasonal Features Of The Vector Chart
8. Vector Chart Material 8.11 Chart Viewing Dates and Seasonal Features of the Vector Chart 8.11.1 Introduction Vector charts contain date-dependent features. Updating in general, including reissues, new editions and updates, creates date dependency. In addition to the obvious date dependency, some features of the S57 charts create additional date dependency. -
Page 141: How To Set "Display Until" Date
8. Vector Chart Material 8.11.3 How to set "display until" date 1. Open the Chart menu. 2. Select Set Chart viewing dates from the menu. 3. Set the cursor in the Display Until field, use the scrollwheel to set desired date, and confirm by pushing the scrollwheel. -
Page 142: About Chart Viewing Date Dependency Of S57 Standard
8. Vector Chart Material 8.11.5 About chart viewing date dependency of S57 standard How the issue date of updates changes the visibility of the changes Study the example below to understand the behavior of updates relative to date. The figure above shows how updates are dependent on Chart viewing dates set in Display/Approve date settings by user. - Page 143 8. Vector Chart Material An example of changes known to happen in the future 8-81...
- Page 144 8. Vector Chart Material How seasonal features are coded in vector charts Some chart producers may define a chart feature to use seasonal date start and end as shown below. • YYMMDD (Full date for date start and date end) •...
- Page 145 8. Vector Chart Material The example below shows how a user can find, using Info query (seasonal), the starting and ending month and day in every year (--MMDD). The example below shows how a user can find, using Info query (seasonal), the starting and ending month in every year (--MM).
- Page 146 8. Vector Chart Material An example of a seasonal chart feature The next two figures show a caution area that is valid from April 1 to November 15. The figure below shows the attributes of the caution area in the example above, in the Info request window. 8-84...
-
Page 147: Symbology Used In Vector Charts
8. Vector Chart Material 8.12 Symbology Used in Vector Charts You can familiarize yourself with the symbology used by browsing IHO ECDIS Chart 1, which is included in this ECDIS. See section 8.9.4 "How to control visible chart features". 1. Open the Chart menu. 2. -
Page 148: How To Get Information About Vector Chart Objects
8. Vector Chart Material 8.13 How to Get Information About Vector Chart Objects The ability to cursor-select an object to find additional information about the object is an important function of the ECDIS. However, an unprocessed cursor selection, which does not discriminate or interpret and merely dumps on the interface panel all the information available at that point on the display, will normally result in pages of unsorted and barely intelligible attribute information. -
Page 149: How To Display Properties Of A Vector Chart Object
8. Vector Chart Material Detailed information for the selected object appears in the Object window. 5. To close the windows, click the CANCEL key on the keyboard-equipped control unit, or click the X on the window you wish to close. 8.13.3 How to display properties of a vector chart object After you have selected a vector chart object, you can view detailed information about it in the Object window:... -
Page 150: About Vector Chart Coding
8. Vector Chart Material 8.13.4 About vector chart coding Tidal information is available as a table TextView 8-88... - Page 151 8. Vector Chart Material More information is available in text More information is available as a graphic 8-89...
- Page 152 8. Vector Chart Material Linked objects Often a group of chart objects are linked together. The most common example of this practice is a beacon or buoy, in which the body and the top mark are defined separately. Another example is lights and recommended track. Still another example is measurement mile.
- Page 153 8. Vector Chart Material Recommended track defined by two beacons 8-91...
- Page 154 8. Vector Chart Material Recommended track defined by a building and a beacon 8-92...
- Page 155 8. Vector Chart Material Measurement mile 8-93...
-
Page 156: Other Features Of Vector Charts
8. Vector Chart Material 8.14 Other Features of Vector Charts There are some functions or features that are not used on a daily or weekly basis, but sometimes there is a need to use them. 8.14.1 Cell status Use the Chart Cell Status function in the Chart Menu to find out the status of individual cells in your system, in a CD-ROM or in an RENC. -
Page 157: S57 Cell Details
8. Vector Chart Material 8.14.2 S57 cell details You may need to check when an update has been added into your ECDIS. Also you may need to check what was shown in your chart display three weeks ago. There are also many other cases where you need to find what was known by your ECDIS. -
Page 158: How To Initiate Senc Conversion From Cell Status Window
8. Vector Chart Material 8.14.3 How to initiate SENC conversion from cell status window The Chart Cell Status window in the Chart menu can be used to force a new SENC conversion for any chart cell that is already in the SENC format. Normally you do not need this feature, but it could be useful if, for example, you need to analyze why an update could not be converted. -
Page 159: Raster Chart Material
Raster Chart Material ARCS Charts Approximately 2,700 ARCS charts are available on 11 chart CD-ROMs, covering the world's major trading routes and ports. Regionally based chart CD-ROMs RC1 to RC10 contain standard BA navigation charts, while RC11 contains ocean charts at scales of 1:3,500,000 and smaller. ARCS charts are facsimile copies of BA paper charts, and as such share a common numbering system. -
Page 160: T&P Notices, Details And Warnings Of Arcs
9. Raster Chart Material 9.1.2 T&P notices, details and warnings of ARCS Access to view T&P Notices, which are details or warnings of ARCS, is contained in the ARCS chart legend mentioned on the previous page. At the lower part of the legend there are three buttons to activate a corresponding window. - Page 161 9. Raster Chart Material How to set preference for inset (panel) If there are the different insets with the same position, the operator can select preferred inset, which displays your ship's position. Chart with three insets 1. Put the cursor in the sidebar area, confirm that "Select Sidebar" appears in the mouse functions area then push the right mouse button.
- Page 162 9. Raster Chart Material How to display notes of ARCS chart The operator can select a desired item from the combo box in the ARCS Details dialog box in order to view notes for that item. After choosing the item from the Notes combo box, click the Notes… button, and a text window appears.
-
Page 163: Datum And Arcs Charts
9. Raster Chart Material Datum and ARCS Charts 9.2.1 Difference between ARCS chart local datum and positions in WGS-84 datum The difference between ARCS chart local datum and WGS-84 datum is known as WGS-84 Shift. For most of the ARCS charts this is known and the system can do the conversion automatically. For some ARCS chart, however, this is unknown and the operator must define the shift. - Page 164 9. Raster Chart Material WGS shift is not defined for this chart. Latitude and longitude positions of the cursor, routes, user charts, Notes, etc. may not be correctly displayed on the current ARCS chart. You can use WGS shift to define correct transformation from WGS-84 co- ordinates to local datum of the current ARCS chart.
- Page 165 9. Raster Chart Material How to display cursor position in local datum of an ARCS chart On demand you can view the cursor position in local datum of an ARCS chart. This is useful when you need to refer to the corresponding paper chart. You can access ARCS details with the Details button in the chart legend of ARCS. In this example WGS-84 shift is defined for the current ARCS chart.
- Page 166 9. Raster Chart Material In this example, WGS-84 shift is not defined for the current ARCS chart. The Cursor Position panel shows cursor position in local ARCS chart datum (indicated as Local Datum) and in WGS-84 datum as defined by the operator WGS shift (indicated as WGS-84 User).
- Page 167 9. Raster Chart Material In this example WGS-84 shift is not defined in the current ARCS chart Undefined Undefined Chart Shift: "Undefined" indicates that current ARCS chart does not have defined WGS-84 shift. 00.176'N 01.290'E Accuracy: This field contains accuracy as defined by the chart producer.
-
Page 168: Permanent Messages Of Arcs
9. Raster Chart Material 9.2.2 Permanent messages of ARCS The system can help you to keep your ARCS charts up-to-date for the charts that you have received from ARCS. Producers of ARCS charts store up-to-date status on an ARCS Weekly Update CD-ROM (system Files). This information is loaded into the ECDIS when you update, either by permits or by active group. -
Page 169: Chart Menu
9. Raster Chart Material Chart Menu The Chart menu is used for managing chart database. Menu description Activate S57 chart: The function activates an S57 chart onto the display. You have two options to select how to open a chart on the display. "Ignore scale" opens S57 chart cell with the scale that was used the last time you used an S57 chart. -
Page 170: Arcs Subscriptions
9. Raster Chart Material ARCS Subscriptions ARCS customers can subscribe to one of two service levels, ARCS Navigator or ARCS Skipper. 9.4.1 ARCS Navigator ARCS Navigator operators receive a comprehensive weekly updating service on a CD-ROM that mirrors the Admiralty Notices to Mariners (NMs) used to correct Admiralty paper charts. The update information is cumulative, ensuring that only the most recent Update CD-ROM is necessary. -
Page 171: How To Get Started With Arcs Charts
9. Raster Chart Material If ARCS format is active, you can select ARCS License from the Chart menu, with "License". License information is shown in the window. This window contains information about the license type and license number. ARCS License information window How to Get Started with ARCS Charts Copy ARCS permit from floppy disk to USB memory. -
Page 172: How To Load, Remove Chart Permits For Arcs Navigator License
9. Raster Chart Material How to Load, Remove Chart Permits for ARCS Navigator License Permits are usually delivered in a floppy disk. Load the ARCS navigator license permits as follows: Permit Load Select Next Chart 1. Copy ARCS permit from floppy disk to USB memory. Then, do the following: 2. -
Page 173: How To Load Chart Permits For Arcs Skipper License
9. Raster Chart Material How to Load Chart Permits for ARCS Skipper License Permits are usually delivered in a floppy disk. Copy permit file into a USB memory then load ARCS Skipper chart permits into the system as follows: Permit Load 1. -
Page 174: How To Remove Chart Permits
9. Raster Chart Material How to Remove Chart Permits Normally you do not need to remove permits during normal operation. However, it may be necessary to remove chart permits from the system. Permits may be removed individually or collectively. To remove chart permits, do the following: 1. -
Page 175: How To Load A New Arcs Chart Into The System
9. Raster Chart Material How to Load a New ARCS Chart into the System You may load a new ARCS chart into the system for which you have a permit, by the following methods. • Load by permit. Load all the charts that are covered in your license. The system will load them automatically. •... -
Page 176: How To Load Arcs Charts By Active Group
9. Raster Chart Material 9.9.2 How to load ARCS charts by active group Use "Loading by active group" when you want to load only ARCS charts that are in a group that you have defined. This is very useful if your license includes many charts from around the world and you are going to use only a part of those charts for which you have a permit. -
Page 177: How To Load Arcs Charts Manually
9. Raster Chart Material 9.9.3 How to load ARCS charts manually You can also load ARCS charts manually into the system as follows. 1. Insert desired ARCS CD-ROM into the CD-ROM drive. 2. Select Load Charts from the Chart menu and Manual from the sub menu. A Chart Operations window appears;... -
Page 178: How To Update Arcs Charts
9. Raster Chart Material 9.10 How to Update ARCS Charts The updates are delivered separately in an Update CD-ROM. To update ARCS format raster chart into the system, you can use one of following procedures: • Update by permit. You can update all the charts that are applicable to your license. The system will update them automatically. -
Page 179: How To Load Updates By Active Group
9. Raster Chart Material 9.10.1 How to load updates by active group Loading updates by active group is used when you want to update only ARCS charts that you have designed to include in a defined group. This is very useful if your license includes a lot of charts from around the world and you are going to use only a part of charts for which you have a permit. -
Page 180: How To Load Updates Manually
9. Raster Chart Material 9.10.2 How to load updates manually You can also load updates for ARCS charts manually as follows: 1. Insert Update ARCS CD-ROM into CD-ROM drive. 2. Open the Chart menu, select Update Charts from the menu and Manual from the sub menu. -
Page 181: How To Display Chart Load And Update History Of Arcs
9. Raster Chart Material 9.11 How to Display Chart Load and Update History of ARCS You may view a history of all chart load and updates (Notices to Mariners) of ARCS. This information is stored in the ECDIS. Open the Chart menu and select Load and Update History to show the log file for the loaded ARCS Update. -
Page 182: Arcs Catalogue
9. Raster Chart Material 9.11.2 ARCS catalogue The Chart Catalogue command in the Chart menu helps you manage ARCS charts. When you select this command, the ARCS Catalogue window opens in the electronic chart area and the ARCS Catalogue dialog box appears in the information area. -
Page 183: How To Group Arcs Charts
9. Raster Chart Material You can select a chart by clicking the limit of the chart in the ARCS Catalogue dialog box. The information about the selected chart is displayed in the Selected Chart field. After you have clicked the limit of chart you get information of the chart in Selected Chart window as follows: •... -
Page 184: How To Add An Arcs Chart To A Group
9. Raster Chart Material 9.12.2 How to add an ARCS chart to a group After you have entered a name for the group, click the Add Frame button in the Group field. Select the area to group by moving the cursor to the desired location and clicking the left mouse button. Below is a sample group. Charts that are inside the frame or intersect a frame limit are added to the group. -
Page 185: How To Remove Arcs Charts From A Group
9. Raster Chart Material You can also save your chart cells as a text file, if you want to have a list of chart cells in text format. To do this, click the Save As Text... button. The Save As window appears as below. Select directory and drive where you want save your text file. -
Page 186: How To Select An Active Group
9. Raster Chart Material 9.12.4 How to select an active group You can make a group an active group as follows: 1. Open the Chart menu. Select Chart Catalogue from the menu. 2. Click Groups in the View Filters window. 3. -
Page 187: How To Remove An Arcs Chart Group By "Group
9. Raster Chart Material 9.13.2 How to remove an ARCS chart group by "group" 1. Open the Chart menu. 2. Select Remove Charts from the menu and By Group from the sub menu to show the ARCS Remove Charts window. [Remove Charts] Go Back By Group... -
Page 188: Arcs Chart Display
9. Raster Chart Material 9.14 ARCS Chart Display 9.14.1 How to display ARCS chart material To display ARCS format raster chart material on the display, do the following: 1. Put the cursor just above the area where the ECDIS shows chart scale. 2. -
Page 189: How To Display Other Arcs Charts
9. Raster Chart Material 9.14.3 How to display other ARCS charts How to select a chart from ARCS catalogue You may use the ARCS Catalogue to display an ARCS format chart. 1. Open the Chart menu. 2. Select Chart Catalogue from the menu. 3. -
Page 190: How To Select An Arcs Chart By Its Number
9. Raster Chart Material Searching for an ARCS chart around your ship You can use either true motion or relative motion. In the true motion mode, your ship moves until it reaches the true motion reset borderline, where it jumps back to an opposite position on the screen based on ship’s course. In the relative motion mode, your ship stays in a fixed position, while the chart moves on screen. - Page 191 9. Raster Chart Material How to open an ARCS chart by position To open an ARCS chart by position of your ship or by chart center, if your display is in TM RESET OFF status, use the menu item "Open by position". Then you get a list of charts that cover current position. To open chart by position, do the following: 1.
-
Page 192: How To Control Arcs Chart Features
9. Raster Chart Material 9.14.5 How to control ARCS chart features The Display dialog box contains several pages to control visible chart features. Chart page Chart Display Black and grey color symbol: This symbol is used to verify that you can distinguish black (frame of symbol) and grey (inner part of symbol) colors with current contrast and brilliance settings. - Page 193 9. Raster Chart Material Symbols: Select how to display chart symbols. The options are: Simplified: The shape of the symbols is of modern design and the sea mark symbols are filled in a color Paper Chart: The shape of the symbols imitates traditional symbols used in paper charts. Depth: Set how to display different depth zones on the chart display.
-
Page 194: Display Base
9. Raster Chart Material "Standard", "Other 1" and "Other 2" pages The Standard page contains chart features defined by IMO that comprise a standard display. You can recall the standard display at any time using a single action, by pressing the STD DSP key on the Control Unit RCU-018 or displaying Chart Display/Info/Standard Display in the mouse function area and pushing the right mouse button. - Page 195 9. Raster Chart Material ARCS details page Chart Display The ARCS details page provides details about current ARCS chart. To open this box, spin the scrollwheel to show Chart Display/Info/Standard Display in the mouse functions area then push the left mouse button. You can change pages by clicking the right mouse button (Select Next), clicking the arrow tabs in the dialog box.
- Page 196 9. Raster Chart Material The ARCS chart that Chart Display is displayed as original edition and places that show updates are marked with a yellow rectangle. 9-38...
-
Page 197: How To Control Navigation Features
9. Raster Chart Material 9.14.7 How to control navigation features Visibility control of the navigation features is divided into five pages in the Symbol Display dialog box. Route page: Controls planned and monitored route. Tracking page: Controls past tracks and some other features. Mariner page: Controls Notes and user charts. - Page 198 9. Raster Chart Material Tracking page Symbol Display Past tracks • Ship System: Plot own ship's tracks using system-fed position. • Ship Primary: Plot own ship's past track with position fed from the primary sensor. • Ship Secondary: Plot own ship's past track with position fed from a secondary sensor.
- Page 199 9. Raster Chart Material Targets page Symbol Display Color: Select color of target from the list box. TT: Select size of tracked target symbols to Std or Small. AIS: ROT (º/min), limit to display AIS target with curved speed vector. Note: Source of ROT must be ROT gyro on target vessel.
- Page 200 9. Raster Chart Material Mariner page Symbol Display Notes • Position: Check to show positions of Notes records with symbols on the chart. • Range: Check to circumscribe pilot data records with circles on the display. The size of a circle depends on the value set in Notes. •...
- Page 201 9. Raster Chart Material General page Ship Outlines True outline shown if "Beam width>6 mm / Length>6 mm". You can set whether width or length is used to set limit for displaying true symbol. Ship outlines: Choose OFF or ON to show ship symbol minimized or scaled symbol, respectively.
-
Page 202: How To Store And Recall Chart Display Settings For Visible Chart And Navigational Features
9. Raster Chart Material 9.14.8 How to store and recall chart display settings for visible chart and navigational features Chart display settings and Symbol display settings are using common settings, which means that when you select settings display settings the same file is selected for symbol settings. You can define chart display and symbol display settings that are displayed over S57 charts cells. -
Page 203: Manual Updates
10. Manual Updates 10.1 Introduction SOLAS requires that mariners keep their charts up-to-date for an intended voyage. Mariners receive chart corrections and other essential information for the area of their intended voyage as • Notices to Mariners (by post, by email, by fax, etc.) •... -
Page 204: Symbols To Use With Manual Updates
10. Manual Updates 10.2 Symbols to Use with Manual Updates Manual updates can be used for the following purposes: • Keep charts up-to-date using similar symbols as the real chart uses. We refer to these symbols as "True symbols". • Keep charts up-to-date using conspicuous orange symbols reserved for this purpose. -
Page 205: How To Control Chart Viewing Dates Of Manual Updates
10. Manual Updates 10.4 How to Control Chart Viewing Dates of Manual Updates 10.4.1 How to set current date for viewing Manual updates operate like any other S57 chart that contains updates and other set chart viewing dates features. When you accept manual updates as permanent, the system sets Display Until of manual updates as the current date of the system. -
Page 206: Manual Update Editor With Orange Symbols
10. Manual Updates 10.5 Manual Update Editor with Orange Symbols The manual update editor has the choices shown below and you can select one by choosing Manual Updates from the Chart menu. Planning: Operate with new manual updates. Undo Last: Remove last accepted manual update planning session. By repeating Undo Last you can remove any amount of old manual update planning session. -
Page 207: How To Insert New Orange Symbols
10. Manual Updates 10.5.2 How to insert new orange symbols The mariner can insert a new object either using New or Copy in the Manual Update Planning dialog box. With New he creates a new feature from scratch. With Copy he uses an already existing object as an example for the newly inserted feature. - Page 208 10. Manual Updates 1. Spin the scrollwheel to display Menu/Info/Chart Menu in the mouse functions area. 2. Push the right mouse button. 3. Select Manual Updates, push the scrollwheel, select Planning then push the scrollwheel. 4. Click the New button in a Manual Update Planning dialog box. 5.
- Page 209 10. Manual Updates How to insert new orange symbols with "copy" You can make new orange symbols by copying existing orange symbols. Then you pick up an orange symbol and make a copy of it. After copying you can modify position suitable for your purposes. 3.
-
Page 210: How To Delete Orange Symbols
10. Manual Updates 10.5.3 How to delete orange symbols The mariner cannot permanently remove any of the official chart objects from the chart display. If the mariner needs to remove any of the official chart objects, he is allowed to mark them as deleted. In practice the deleted chart object is still visible, but it has a special presentation for a deleted object on top of it. -
Page 211: How To Edit Position Of Orange Symbols
10. Manual Updates 10.5.4 How to edit position of orange symbols An object can be a point, line or area. • Point has only one point in its presentation. • Line can consist of one or more chains. A chain consists of two or more points. •... -
Page 212: Examples Of How To Use Orange Symbols
10. Manual Updates 10.5.5 Examples of how to use orange symbols How to modify a line 1) Activate Position Edit. 2) Place cursor on point to edit. 3) Keep left mouse button pushed down to modify a point. How to set position for a point This method is also applicable to insert or append new WPT points for existing chart features. -
Page 213: Manual Update Editor With True Symbols
10. Manual Updates 10.6 Manual Update Editor with True Symbols The manual update editor has the following features: • Planning: Operate with new manual updates. • Undo Last: Remove last accepted manual update planning session. By repeating Undo Last you can remove any amount of old manual update planning session. •... -
Page 214: How To Delete Chart Objects
10. Manual Updates 10.6.2 How to delete chart objects The mariner cannot permanently remove any of the official chart objects from the chart display. If mariner needs to remove any of the official chart objects he is allowed to mark them as deleted. In practice the deleted chart object is still visible, but it has a special presentation for a deleted object on top of it. -
Page 215: How To Modify Chart Objects
10. Manual Updates 10.6.3 How to modify chart objects The mariner cannot permanently remove from the chart display any of the official chart objects, but he can modify position and/or properties of chart objects. When the mariner modifies a chart object, the ECDIS will mark original chart object as deleted and a copy of original chart object as inserted. -
Page 216: How To Insert New Chart Objects
10. Manual Updates 8. Set positions with cursor and push left mouse button. Click Accept button. 10.6.4 How to insert new chart objects The mariner can insert a new object either using New or Copy. With New he creates a new feature from scratch. With Copy he uses an already existing object as an example for the new feature. - Page 217 10. Manual Updates Example of how to insert a "restricted area" 1. Follow steps 1-3 on page 10-6 to display the Manual Update Planning dialog box. 2. Click the New button in the Manual Update Planning dialog box. 3. Select Area from the Drawing Type list box then select Single from the Category list box. 4.
- Page 218 10. Manual Updates Example of how to insert easy lateral sea mark The method is similar also for easy cardinal sea marks, easy other sea marks, easy lights and easy obstructions. 1. Follow steps 1-3 on page 10-6 to display the Manual Update Planning dialog box. 2.
- Page 219 10. Manual Updates Example of how to insert a nav aid A light is only a light - it also requires a support that could be a pile or buoy, etc. Body and top mark of a buoy are separated to enable a vast number of possible combinations. 1.
- Page 220 10. Manual Updates How to insert new chart objects with "copy" You can make a new object by copying an existing one. Then you pick up an object and make a copy of it with all related properties. After copying, you can modify position and properties of copied object suitable for your purposes.
-
Page 221: How To Edit Properties Of Manually Updated Chart Objects
10. Manual Updates 10.6.5 How to edit properties of manually updated chart objects How to edit properties of chart objects 1. Follow steps 1-3 at the top of page 10-6 to display the Manual Update Planning dialog box. 2. In the Manual Update Planning dialog box, click the Edit Properties button. An Object window appears. 3. - Page 222 10. Manual Updates How to edit position of chart objects An object can be a point, line or area. • A Point has only one point in its presentation. • A Line can consist of one or more chains. A chain consists of two or more points. •...
- Page 223 10. Manual Updates Example of how to set next WPT position for a point The method is also applicable to insert or append new WPT points for existing chart features. 1) Activate Position Edit. 2) Insert point with left mouse button. 3) If necessary change lat and lon position.
-
Page 224: How To Check Creation And Usage History Of Manual Updates
10. Manual Updates 10.7 How to Check Creation and Usage History of Manual Updates You may need to check when a manual update has been added into your ECDIS. Also, you may need to check what was shown in your chart display, for example, what was shown three weeks ago. There are also many other cases when you need to know what was known by your ECDIS. -
Page 225: Chart Alerts
11. Chart Alerts 11.1 General The ECDIS can detect areas where the depth is less than the safety contour or detect an area where a specified condition exists. If you plan a route or if prediction of your ship's movement goes across a safety contour or an area where a specified condition exists, the system will display a visual alert or sound an audio alarm to alert you to impending danger. -
Page 226: How To Select Safety Contour
11. Chart Alerts 11.2.1 How to select safety contour The operator selects a safety depth suitable for the ship. To select a suitable depth, do the following: 1. Spin the scrollwheel to display Chart Display/Info/Standard Display in the Chart Display mouse functions area then push the left mouse button. -
Page 227: How To Highlight Chart Alert Areas
11. Chart Alerts • "Inshore Traffic Zone" • "Restricted Area" • "Caution Area" • "Offshore Production Area" • "Military Practice Area" • "Seaplane Landing Area" • "Submarine Transit Lane" • "Anchorage Area" • "Marine Farm / Aquaculture" • "PSSA Area" 11.2.3 How to highlight chart alert areas The user can elect to highlight chart alert areas. -
Page 228: How To Insert User Chart Symbols, Lines And Areas In Chart Alert
11. Chart Alerts 11.3 How to Insert User Chart Symbols, Lines and Areas in Chart Alert Symbols For user chart symbols, use the option Danger Symbol in the Symbol page of the Plan User Chart dialog box. To display this box, do the following: 1. - Page 229 11. Chart Alerts Areas To include areas in the chart alert, check the Danger Area box in the Area page of the Plan User Chart dialog box. Danger Area must checked, otherwise danger areas of a user chart cannot be used in the chart alert. The dangerous area is drawn in red instead of dark yellow (color may be different depending on Palette in use).
-
Page 230: How To Activate Own Ship Check
11. Chart Alerts 11.4 How to Activate Own Ship Check Calculation of your ship's predicted movement is done using watch sector from your ship's position. Sector size is defined by time and Width or by distance and Width. To set them, do the following: 1. - Page 231 11. Chart Alerts (WT) (WT) (WAT) Chart alert always uses the largest scale chart available no matter which chart is selected for display. 11-7...
-
Page 232: Route Planning
11. Chart Alerts 11.5 Route Planning The system will calculate chart alerts using operator-defined channel limits for routes. Danger areas are shown highlighted if safety contour or operator-selected chart alert areas are crossed by the planned route. For more information on route planning, see the chapter on route planning. Note: If your voyage is going to take a long time or you are planning it much earlier than it is to take place, use display and approve dates corresponding to the dates you are going to sail. -
Page 233: How To Find Chart Alerts Leg By Leg
11. Chart Alerts 11.5.1 How to find chart alerts leg by leg After you have done chart alert calculation, the system is able to show you legs on the route where danger areas are located. All the alerts for each leg where alerts occur are shown in the Alerts list. The list of alerts is based on selections made in the Chart alert parameters sub menu. -
Page 234: How To Find Chart Alerts By Category
11. Chart Alerts 11.5.2 How to find chart alerts by category After you have done chart alert calculation, the system is able to show you legs on the route where the chart alerts are located. The system can show alerts by their category. To find chart alerts for a route by alert category, do the following: 1. -
Page 235: Route Monitoring
11. Chart Alerts 11.6 Route Monitoring Route monitoring can be divided into two categories: your ship's estimated position and monitored route. (WT) The figure above shows how the system highlights chart alerts inside channel limits of a monitored route and inside predicted movement area of your ship. -
Page 236: Chart Alert With Arcs Charts
11. Chart Alerts 11.7 Chart Alert With ARCS Charts In case of ARCS charts, the operator can define danger areas by using a user chart. The system can use user chart symbols, lines and areas and calculate chart alert from this material. For further details, see Chapter 15 "User Chart Control". -
Page 237: Navigation Tools
12. Navigation Tools 12.1 Display Mode and Chart Orientation There are two display modes to present your ship’s movement on the electronic chart. They are true motion, TM, and relative motion, RM. In the true motion mode, the ECDIS shows your ship's position and other "in motion" data such as radar targets moving on the earth-fixed chart background. -
Page 238: Navigation Marks
12.Navigation Tools 12.2 Navigation Marks Navigation marks consist of two sets of Reference Point, EBL, VRM, and four parallel index lines. Two sets of these marks are provided on the Nav. Marks dialog box, so that you can arrange each set according to a particular navigation operation. -
Page 239: How To Shift The Vrm
12.Navigation Tools 12.2.2 How to shift the VRM With control unit RCU-018 There are two VRMs, No. 1 and No. 2, which appear as dashed rings so that you can discriminate them from the fixed range rings. The two VRMs can be distinguished from each other by different lengths of their dashes. Press the VRM ON key to display either of the VRMs. - Page 240 12.Navigation Tools (WT) Display REF point Range: Info REF point centered Reference point off centered with Variable Range Marker (VRM) and Electronic Bearing Line (EBL) (WT) Display REF point Range: Info REF point centered Centered reference point with range ring 12-4...
-
Page 241: How To Adjust The Parallel Index Lines
12.Navigation Tools 12.2.4 How to adjust the parallel index lines Parallel index lines are useful for keeping a constant distance between own ship and a coastline or a partner ship when navigating. Controls for the parallel index lines are in the NAV Marks dialog box. To display the Nav. Marks dialog box, spin the scrollwheel to display Show Value/Info/Nav Marks in the mouse functions area then push the right mouse button. - Page 242 12.Navigation Tools This page intentionally left blank. 12-6...
-
Page 243: Route Planning
13. Route Planning 13.1 Introduction A route plan defines the navigation plan from starting point to the final destination. The plan includes: • Route name • Name, latitude and longitude of each waypoint • Radius of turn circle at each waypoint (max. 200 waypoints) •... -
Page 244: Main Menu For Route Planning
13. Route Planning 13.2 Main Menu for Route Planning The main parameters for the route planning are: • Latitude and longitude of the waypoint • Channel limits to the waypoint • Turning radius of the waypoint • Maximum and minimum speed limits for a leg There are two phases for a route: Route Plan and Route Monitor. - Page 245 13. Route Planning Contents of Plan Route menu Select: Select an existing route and edit it for use. Choose "Select" from the menu, push the scrollwheel, and a list box appears. Spin the scrollwheel to select appropriate route from the list box, push the scrollwheel to confirm then click the OK button.
-
Page 246: How To Select Datum
13. Route Planning Spin the scrollwheel to show Symbol Display/Info/ in the mouse functions area then click the left mouse button to open the Symbol Display dialog box. Click the arrow tabs or right mouse button (or NEXT key on the keyboard-equipped control unit) to select the Route page. -
Page 247: How To Create A New Route
13. Route Planning 13.4 How to Create a New Route Select Route WPT Alerts Monitor Mode RAD/NM CH LIM/m MIN/kn MAX/kn Plan WPT count Delete WPT WPT Alerts Alerts Alerts by Leg Legs by Alert Alert: Alerts: WPT Alerts To make a complete route for a voyage, do the following: 1. -
Page 248: How To Use The Wpt Page (Processing Waypoints)
13. Route Planning 13.4.1 How to use the WPT page (processing waypoints) Alerts Mode RAD/NM Ch LM/m MIN/kn MAX/kn WPT count Delete WPT Following fields and buttons can be found in the WPT page. Enable changes: Check to edit waypoints. Note: Routes can only be modified in the North-up or Course-up mode. -
Page 249: How To Use The Alerts Page
13. Route Planning 13.4.2 How to use the Alerts page The Alerts page lets you define conditions along a route for which you want to be alerted, by visual or audible indication. (You cannot get both visual and audible indications for a condition.) You can select safety contour and chart alerts used to check the safety of the route. -
Page 250: How To Use The Check Page
13. Route Planning 13.4.3 How to use the Check page The Check page allows you to make safe water calculation for your route. You also store the names of the user chart and Notes to use during route monitoring together with planned route on this page. This storage happens when you activate the safe water calculation by pushing the Start button. -
Page 251: How To Use The Parameters Page
13. Route Planning 13.4.4 How to use the Parameters page The Parameters page allows you to set departure time and arrival time for your route. Also optimization type is selected on this page. Check in order to enable editing. Enable changes: Note: A route may only be modified when using the north-up or course-up mode. -
Page 252: How To Modify An Existing Route
13. Route Planning 13.5 How to Modify an Existing Route 13.5.1 Parameters The main parameters for route planning are: • Latitude and longitude of the waypoint • Channel limits to the waypoint • Turning radius of the waypoint • Maximum and minimum speed limits for a leg 13.5.2 How to change waypoint position To change position of a waypoint, you have following alternatives:... -
Page 253: How To Change Other Waypoint Data
13. Route Planning How to drag and drop a waypoint to a new position 1. Click Route in the information area then click the Plan button to open the Plan Route dialog box. Click the WPT tab to open the WPT page. 2. -
Page 254: How To Insert A Waypoint
13. Route Planning 1. Click Route in the information area then click the Plan button to open the Plan Route dialog box. Click the WPT tab to open the WPT page. Check Enable changes. 2. Select last waypoint as current waypoint. 3. -
Page 255: How To Import Waypoints From Other Routes
13. Route Planning 13.5.7 How to import waypoints from other routes You can import waypoints from other routes to use them in the current route. To import waypoints do the following: 1. Click Route in the information area then click the Plan button to open the Plan Route dialog box. Click the WPT tab to open the WPT page. -
Page 256: How To Import Waypoints From External Device (Gp-80 Or Gp-90)
How to import waypoints from external device (GP-80 or GP-90) You can import waypoints from external device such as a GPS navigator, like FURUNO GP-80 or GP-90, to the current route. To import waypoints from an external device, do the following: 1. -
Page 257: How To Reverse Sailing Order Of A Route
13. Route Planning 13.5.9 How to reverse sailing order of a route You may reverse the order of waypoints in a planned route. Put the cursor on Route in the status bar then click the Plan button to open the Plan Route dialog box. Click the WPT tab to open the WPT page. Check Enable changes. Click the Reverse route button. -
Page 258: How To Plan A Speed Profile
13. Route Planning In case of optimization by "max. speed" With entered EDT as reference, ETA is calculated with entered speed limit. ETA may be entered in the ETA/UTC box, however ETA is shown below it. The monitor display shows ETD, speed limit and calculated ETA. 13.6.3 How to plan a speed profile A speed profile is defined by general max. -
Page 259: Wpt Report
13. Route Planning 13.7 WPT Report This report is generated when you select Report from the Plan Route menu. To display the report viewer, click Route in the information area, click the Plan button, put the cursor on the triangle in the Plan Route dialog box, select Report then push the scrollwheel. -
Page 260: Full Wpt Report
13. Route Planning 13.8 Full WPT Report The Full WPT Report provides detailed information on each waypoint in a plan route. To display the report viewer, click Route in the information area, click the Plan button, put the cursor on the triangle in the Plan Route dialog box, select Full WPT Report then push the scrollwheel. -
Page 261: Passage Plan Report
13. Route Planning 13.9 Passage Plan Report The Passage Plan report generates WPT report together with Notes report. The system automatically attaches Notes from the planning mode on the route plan when you select the Passage Plan report. To display the report viewer, click Route in the information area, click the Plan button, put the cursor on the triangle in the Plan Route dialog box, select Passage Plan Report then push the scrollwheel. - Page 262 13. Route Planning An example of a passage plan report. Notes text notes are placed between waypoints based on their position (in which leg defined Notes will be activated) 13-20...
-
Page 263: Route Monitoring
14. Route Monitoring 14.1 Introduction Route monitor is a means for permanent monitoring of the ship’s behavior relative to the monitored route. The information area displays the data on the ship’s position relative to the monitored route. The monitored route consists of the following information, displayed in the electronic chart area: •... -
Page 264: How To Select To Wpt
14. Route Monitoring Note 1: When you select a route for monitoring, the message shown below may appear when the geometry of the route makes it impossible to sail the ship. Select the Plan Route dialog box and make necessary modifications. Note 2: Limitation of displayed route If you have small-scale chart(s) on display that have the whole eastern/western (0-180°E/0-180°W) hemisphere and a part of the other hemisphere on display, there is a limitation to display a route. -
Page 265: How To Select Final Waypoint
14. Route Monitoring 14.4 How to Select Final Waypoint Normally you use the last waypoint in a monitored route as the final waypoint, and the ECDIS automatically does this when you select the route to monitor. However, sometimes you may prefer to use some other waypoint as the final waypoint of a monitored route. -
Page 266: How To Display A Route On The Electronic Chart Screen
14. Route Monitoring 14.6 How to Display a Route on the Electronic Chart Screen To display a monitored route, make sure that desired options of the monitored route (center line, channel borders, WPT marks, leg marks and wheel over line) are selected on the Route page of the Chart Display dialog box. To show this display, spin the scrollwheel to show Symbol Display/Info/ in the mouse functions area, push the left mouse button then click an arrow tab to display the Route menu. -
Page 267: Monitor Route Dialog Box
14. Route Monitoring 14.8 Monitor Route Dialog Box The monitor route dialog box facilitates safe use of routes. During route planning, you can check your route plan for safe water and you can attach a user chart and Notes that you intend to use together with a route plan. The monitor route dialog box reminds you if •... - Page 268 14. Route Monitoring The Alerts page may show the following message: "* = Current selection differs" indicates which conditions are currently set differently as planned. Remedy: Open Chart Alerts parameters to set them as they were at the time the route was planned.
-
Page 269: How To Monitor A Route
14. Route Monitoring 14.9 How to Monitor a Route You can monitor the route from the two Plan Speed windows in the information area. Upper window: • Plan Speed: Planned speed to approach a "To WPT". • Plan: Planned course between a previous WPT and a "To WPT". Note that if the gyro value is compensated and Gyro error correction and Gyro error compensation have been enabled in Ship and Route parameters in the Initial Settings menu, then the text "(corr)"... -
Page 270: Information About Steering Mode On Permanent Route Monitor Windows
Information about the current steering mode is available on the Route monitor windows. The information shown depends on connected autopilot and the steering mode in use. FURUNO Autopilot FAP-2000 The following steering mode information appears with the FAP-2000. •... -
Page 271: Eta (Estimated Time Of Arrival)
14. Route Monitoring 14.10 ETA (Estimated Time Of Arrival) The estimated time of arrival to a waypoint is calculated by the ECDIS. The operator can select waypoint number and speed profile for calculation, in the Monitoring page of the Monitor Route dialog box. To WPT: Indicates approaching "To WPT". - Page 272 14. Route Monitoring Average: Select Average from the Speed profile box to enter desired speed for calculation of ETA at To WPT. The speed profile is changed to Average speed. Enter average speed and the system will calculate ETAs. Trial SPD SPD profile 14-10...
- Page 273 14. Route Monitoring Time table optimization displayed in route monitoring. Trial SPD SPD profile Plan: This displays ETA at final WPT. Value also appears in the Parameters page of the Plan Route dialog box. Off Plan: Indicates time difference between planned ETA and calculated ETA to final WPT. Suggested SPD: This is used only when the route has been optimized for "Time table".
-
Page 274: Route Monitoring Alerts
14. Route Monitoring 14.11 Route Monitoring Alerts Auto steering in use 352 Route: Illegal ETA WPT: Appears when the system cannot use the selected ETA waypoint. The reason might be corrupted or missing route file. 353 Route: Illegal To WPT: Appears when the system cannot use the selected "To WPT". The reason might be corrupted or missing route file. -
Page 275: User Chart Control
15. User Chart Control 15.1 Introduction User charts are simple overlay charts that the operator makes for his own purposes. They can be displayed on both the radar display and the electronic chart. These charts are intended for highlighting safety-related items like position of important navigation marks, safe area for the ship, etc. -
Page 276: Modes Of User Charts
15. User Chart Control 15.1.2 Modes of user charts A user chart can be selected for the monitoring mode, which means that it is displayed on the connected radar display and it can be used in chart alert calculation. Another user chart mode modifies the user chart planning mode. In the planning mode, a user chart is only displayed on the ECDIS display;... - Page 277 15. User Chart Control User chart dialog box and menu Click UserChart in the information area then click Plan or Monitor button to open corresponding dialog box. If no User Chart has been selected, one of the menus shown below appears, along with appropriate dialog box. If you want to make further selection from a menu and only the dialog box is shown, you can show the menu on the display by clicking the Plan or Monitor button again, or put the cursor on the triangle in the dialog box.
-
Page 278: What Is A User Chart Point And How Is It Used
15. User Chart Control 15.2 What is a User Chart Point and How is it Used? A point is a center point for a sub chart inside a user chart. Sub charts are small enough (max 80 elements) to be sent for display on the radar. - Page 279 15. User Chart Control Below are some examples of sub-charts. Note the position used for points to collect the sub charts. 15-5...
-
Page 280: How To Select Datum
15. User Chart Control 15.3 How to Select Datum Selection of datum is very important, especially if you manually enter latitude-longitude positions from the control panel or keyboard or if you use digitizer. If you only use the cursor to add and to modify waypoint locations, then you could use any datum, although it is recommended to use native datum of the chart. -
Page 281: How To Show A User Chart On The Radar Screen
15. User Chart Control 15.5 How to Show a User Chart on the Radar Screen If ECDIS workstation is set as SINGLE mode, you have to define on Radar Selection dialog box if the ECDIS sends Route, User Chart and Notes to radar. When Route, User Chart or Notes is selected to Monitor mode, information of Route, User Chart and Notes are sent to radar if "Send to Radar"... -
Page 282: How To Create A User Chart
15. User Chart Control 15.7 How to Create a User Chart You can create and modify a user chart when you have selected the planning mode of user chart. Enter name of the new User Chart Select User Chart Monitor DISP Plan DISP... -
Page 283: Point Page
15. User Chart Control 15.7.1 Point page The Point page lets you define points on a user chart. To select this page, push the right mouse button (Next Card) then click the tab with the left mouse button. Show the current and total number of points. Point box: Name: Name current point. -
Page 284: Symbol Page
15. User Chart Control 15.7.2 Symbol page The Symbol page lets you draw symbols on a user chart. To select this page, push the right mouse button (Next Card), click the tab with the left mouse button or hit the NEXT key on the keyboard- equipped control unit. -
Page 285: Line Page
15. User Chart Control 15.7.3 Line page The Line page lets you inscribe lines on a user chart. To select this page, push the right mouse button (Next Card), click the tab with the left mouse button or hit the NEXT key on the keyboard- equipped control unit. -
Page 286: Tidal Page
15. User Chart Control 15.7.4 Tidal page The Tidal page lets you inscribe tidal data on a user chart. To select this page, push the right mouse button (Next Card) then click the tab with the left mouse button. Show the current and total number of tidal points. Tidal box: Name current tide. -
Page 287: Area Page
15. User Chart Control 15.7.5 Area page The Area page lets you inscribe areas on a user chart. To select this page, push the right mouse button (Next Card) then click the tab with the left mouse button. Area window When a operator defines an area for a user chart he adds an area object then gives a name and selects if it is displayed on radar and/or if it is used for safe water calculation (Danger Area). - Page 288 15. User Chart Control How to add a new area to a user chart An area of a user chart can be used, for example, to define a safe water area for display on the radar. To add a new user chart area, do the following: 1.
-
Page 289: How To Add A New Point, Symbol, Line Or Tidal To A User Chart
15. User Chart Control 15.7.6 How to add a new point, symbol, line or tidal to a user chart In this manual the term "user chart object" refers to any point, symbol, line or tidal. The procedure for modifying a user chart object is common to all user chart objects. -
Page 290: How To Change Other Data Of Point, Symbol, Line Or Tidal
15. User Chart Control How to drag and drop a user chart object to change its position 1. Open desired user chart object page. 2. Put the cursor on the user chart object in the electronic chart area then press and hold down the left mouse button while rolling the trackball to position the user chart object. -
Page 291: How To Join Two Or More User Charts
15. User Chart Control 15.8 How to Join Two or More User Charts The ECDIS allows you to combine two or more user charts into one user chart. To join two or more user charts, do the following: 1. Click UserChart in the information area to show the User Chart dialog box. 2. -
Page 292: How To Display User Charts On Ecdis Display
15. User Chart Control 15.9 How to Display User Charts on ECDIS Display User charts can be displayed on the ECDIS display, and you can select which chart objects to display from the Mariner page in the Symbol Display dialog box. Below are some examples from the same user chart with different selections. - Page 293 15. User Chart Control An example with only symbols and points displayed. Note that this is also a very good example how many and where the points should be defined. No symbols displayed 15-19...
-
Page 294: How To Back Up User Charts To A Floppy Disk Or Usb Memory
15. User Chart Control 15.10 How to Back up User Charts to a Floppy Disk or USB Memory You may make backups of user charts. This feature is also useful for carrying user charts to other planning or navigation station. For further details, see section 17.5 "How to Back up a File to a Floppy Disk or USB Memory". 15.11 How to Restore User Charts from a Floppy Disk or USB Memory This procedure can be used to read backup copies of any User Chart file if some data is lost during modification of... - Page 295 15. User Chart Control Sample reports Points report Lines report Areas report Symbols report Full report Report for radar 15-21...
- Page 296 15. User Chart Control This page intentionally left blank. 15-22...
-
Page 297: Notes
16. Notes 16.1 Introduction A navigation-related notebook is called "Notes". Notes is a "notebook data" file that provides messages for the operator relative to a specific ship position in the monitoring mode. The operator specifies the range for each Notes record. -
Page 298: Notes Modes
16. Notes 16.1.1 Notes modes Notes can be selected for the monitoring mode, which means that Notes gives predefined messages for the operator relative to a specific ship position. Another mode is for modifying Notes in the planning mode. In the planning mode, Notes is used to define predefined messages relative to your ship's position. -
Page 299: How To Use Notes
16. Notes 16.2 How to Use Notes To prepare Notes, do the following: 1. Click Notes in the information area then click the Plan or Monitor button as appropriate. If no Notes is selected, the Notes menu (shown below) appears in addition to the Monitor Notes dialog box or Plan Notes dialog box. -
Page 300: How To Select Notes To Use In Monitoring Mode
16. Notes 16.3 How to Select Notes to use in Monitoring Mode Do as shown below to select Notes for use in the monitoring mode. (WT) Place cursor here, spin scrollwheel to choose Notes and push scrollwheel. Select Notes Monitor DISP Plan DISP... -
Page 301: Monitor Notes Dialog Box Description
16. Notes 16.4.1 Monitor Notes dialog box description Current record page If "View all records" is not selected (checked): • Opens "Current Record" page. • When the ship is within the range set for a Notes, the information of current record appears, something like the dialog box shown right. -
Page 302: How To Select Notes To Use In Planning Mode
16. Notes 16.5 How to Select Notes to use in Planning Mode If "Notes" in the information area is black (or white depending on color scheme) this means that the workstation is in the monitoring mode for Notes. To activate the planning mode and select Notes for the planning mode, do the following: (WT) Select Notes... -
Page 303: How To Create New Notes
16. Notes 16.6 How to Create New Notes You can create and modify Notes, and this can be done in the planning mode. It is recommended to use the true motion display mode while editing. Select Notes Monitor DISP Plan DISP Enter name of the new Notes To create a new Notes, do the following:... -
Page 304: How To Select Notes Record To Modify
16. Notes To add a new Notes record by Add button: 1. Open the Edit page of the Plan Notes dialog box then check Enable changes. 2. Click the Add button. This adds a new Notes record to the end of record, and it is a copy of current Notes record. -
Page 305: How To Import Notes From Other Routes
16. Notes 16.6.6 How to import Notes from other routes You may import Notes records from other Notes records as follows: 1. Open the Edit page of the Plan Notes dialog box then check Enable changes. Click the Import button to show the following dialog box. - Page 306 16. Notes This page intentionally left blank. 16-10...
-
Page 307: Backup Operations
17. Backup Operations 17.1 Introduction There are several menus from which the operator may initiate backup and restore functions. From those menus the operator may execute hard disk operations such as backup, copy, rename and delete. The operator may make backup copies to backup devices or restore from backup device to hard disk. -
Page 308: How To Select Appropriate File Category
17. Backup Operations 17.2 How to Select Appropriate File Category The system automatically selects corresponding file depending on your selection. The categories consist of the following files: • Route plans • User Charts • Notes • Installation parameters • Display Settings •... -
Page 309: How To Back Up A File To A Floppy Disk Or Usb Memory
17. Backup Operations 17.5 How to Back up a File to a Floppy Disk or USB Memory You can make a backup from an original file to a floppy disk or USB memory. To make a backup of a file to a floppy disk or USB memory, insert a floppy disk in the disk drive or connect a USB memory, then do the following: 1. -
Page 310: How To Move A File To Planning Or Navigation Station
17. Backup Operations 17.8 How to Move a File to Planning or Navigation Station If there are two ECDIS workstations connected via a LAN, files can be moved from one workstation to another. Note: The intention of the Backup function is to make a backup copy of a route, user chart, etc. to a backup medium. -
Page 311: How To Read A File From Planning Or Navigation Station
17. Backup Operations 17.9 How to Read a File from Planning or Navigation Station If there are two ECDIS workstations connected via a LAN, it is possible to read files from planning station to navigation station and vice versa. 1. Select desired menu. 2. -
Page 312: How To Save A Route As An Ascii Text File
17. Backup Operations 17.12 How to Save a Route as an ASCII Text File Sometimes it is useful to save route information as an ASCII text file for use with some other application, or to restore some ASCII text produced by some other application to the ECDIS. For further details see Appendix 6. The following formats are available for route backup and restore: •... -
Page 313: How To Back Up Chart Material
17. Backup Operations 17.14 How to Back up Chart Material The ECDIS lets you keep a chart database identical both in the hard disk of the ECDIS and the hard disk of the backup ECDIS. If you want to make a backup of chart material to backup ECDIS, open the Backup & Restore dialog box and do the following: 1. -
Page 314: How To Restore Chart Material
17. Backup Operations 17.15 How to Restore Chart Material The ECDIS lets you keep a chart database identical both in the hard disk of the ECDIS and the hard disk of backup the ECDIS. If you want restore a backup of some chart material from the backup ECDIS, open the Backup and Restore dialog box and do the following: 1. -
Page 315: Common Reference System (Multi-Workstation Mode)
18. Common Reference System (Multi-workstation mode) 18.1 Introduction A system is comprised of one or more Workstation(s) and it is configured as follows: • Single workstation • Multiple workstation (for example, navigation workstation and planning station) • Multiple workstation (for example, navigation workstations) An access server takes care of information shared inside the system to keep workstations consistent within the common reference system concept. -
Page 316: How To Control Common Reference System
18. Common Reference System 18.2 How to Control Common Reference System If the system has a dual workstation, the following dialog box appears when choosing the Initial Settings menu. Open the box by moving the cursor onto the workstation mode indication and pushing the right mouse button. 1. -
Page 317: Shared Alert Management
18. Common Reference System 18.2.1 Shared alert management The common reference system concept provides that all alerts are indicated in all workstations and a single acknowledge of alert from any workstation is enough to acknowledge the alert from all workstations. 18.2.2 Harmonized databases on workstations When the multi-workstation mode is used, information between workstations is shared via the access server. - Page 318 18. Common Reference System You can set access server display options ON if you want to monitor access server windows to know harmonization status, whenever harmonization is completed by the system. To set access server display ON/OFF, do the following: 1.
-
Page 319: Shared Operator Selections
18. Common Reference System 18.2.3 Shared operator selections The common reference system concept allows that some selections and settings made by an operator in one workstation are transferred to the other workstation. These are as follows: • Route, user chart and Notes in monitoring mode •... -
Page 320: How To Set Usage Rights As "Multi" Or "Slave
18. Common Reference System 18.3.2 How to set usage rights as "multi" or "slave" Multiple workstations can be selected to control monitoring modes and navigation sensors. This means that these particular workstations are used to select route, user chart and Notes for monitoring modes. However, the multiple control requires that none of the other workstations is set for Master usage rights. -
Page 321: How To Set Usage Rights As "Plan
18. Common Reference System 18.3.3 How to set usage rights as "plan" A workstation can be set to control only the planning mode. This means that a particular workstation is used to edit route, user chart and Notes in the planning mode. Selection of Plan usage rights is done in the Installation Parameters of the ECDIS by service personnel. -
Page 322: Sensor Source For The System
18. Common Reference System 18.4 Sensor Source for the System Normally the sensor source of a system is a single workstation to which all the sensors are connected. All workstations share the navigation sensors. The workstation selected as a sensor source is connected to all sensors. The workstations that can be used as sensor source are shown in the Sensor source list box in the Sensors dialog box. -
Page 323: Mode Of Workstations
18. Common Reference System 18.5 Mode of Workstations The system is designed so that information and operations are shared among workstations. Sharing requires that the access server be running in the specified workstation. (This is an installation parameter. See the Installation Manual.) The access server requires that the workstation be designated as multi workstation. -
Page 324: Troubleshooting
18. Common Reference System 18.6 Troubleshooting If something fails while the access server is harmonizing workstations, the following window appears to indicate that harmonising has failed. What to do if pending access server window remains on screen The window below indicates that operation of the access server is pending. This means that you have not closed all windows. -
Page 325: Access Server Log
18. Common Reference System 18.6.1 Access server log The access server log is used to analyze and diagnose access server operations. Service personnel can use this log to check the access server for proper operation. To access the access server log, do the following: 1. -
Page 326: Human Interface Log
18. Common Reference System 18.6.2 Human interface log The human interface log is used to analyse and diagnose system operations. Service personnel can use this log to check the system for proper operation. To activate the human interface log, do the following: 1. -
Page 327: Navigation Sensors
19. Navigation Sensors 19.1 Common Reference Sensors that are used for position (like EPFS, dual-axis log and radar) have a common reference point, which is located on the conning position. • The values of center and conning positions depend on size and geometry of the ship. •... -
Page 328: How To Select Navigation Sensors
19. Navigation Sensors 19.2 How to Select Navigation Sensors The operator can select navigation sensors to use for navigation and view their current values on the Sensors dialog box. To access this dialog box, put the cursor on the Position field in the information area then push the right mouse button. - Page 329 19. Navigation Sensors POSN page The field of a position sensor contains a label (here DGPS-1st and GPS+ZDA) that indicates the name of the sensor; a status (primary/secondary/off) that indicates if the sensor is used or not; position at conning position and local datum; speed and course that SPD/CRS POSN has (mag) if the course is referenced to magnetic north.
- Page 330 19. Navigation Sensors Other page Set and Drift: See the description below. Wind: Wind (True or North) speed (kn or m/s) and direction are displayed. Note that true wind is wind relative to your ship heading. For further details, see section 19.11 "Wind Sensor".
-
Page 331: Source Of Position
19. Navigation Sensors 19.3 Source of Position The figure below shows how the source for position is selected. The Kalman filter uses all position sensors that have either primary or secondary as input for its calculation. DGPS and SYLEDIS position sensors are considered more accurate than other position sensors. -
Page 332: Primary And Secondary Positions Of Own Ship
19. Navigation Sensors 19.4 Primary and Secondary Positions of Own Ship The system has three different positions for your ship: System position, primary position and secondary position: • System position: Used for navigation and steering. See section 19.3 "Source of Position". •... -
Page 333: Position Discrepancy Alert
19. Navigation Sensors 19.5 Position Discrepancy Alert You can activate the alert "407 Position discrepancy" from the Initial Settings dialog box. The alert is active between primary position and any secondary positions. Note that the alert is also effective between your ship's position and any positions, since ECDIS compass position discrepancy between position used by system (your ship's position) and any individual position sensor... - Page 334 19. Navigation Sensors Calculated ROT Selected in Installation parameters from movement of Heading Not selected in Installation parameters Value exists ROT Gyro used by system No value Alarm 718 ROT gyro error SOG/COG used by the system is shown at the upper right corner of the ECDIS display. In the example below, COG and SOG are from selected position sensors and this is indicated with the text "(pos)".
- Page 335 19. Navigation Sensors The figure below show the source of docking speed components used for the predictor. Installation parameter offset values ROT used by the system Bow and stern speed SOG/COG used by the system Calculator used by the system Speed (water speed) used by the system Heading used by the system The figure below shows the source of water speed is used for drift calculation.
- Page 336 19. Navigation Sensors Drift used by the system is shown in the Other page of the Sensors dialog box. In the example below, set and drift have been entered manually since the Manual box is checked. Other text that may appear to show source of set and drift are (LOG): Log or dual-axis log...
-
Page 337: Dual Gyro Interface For Dnv Naut-Aw
19. Navigation Sensors 19.7 Dual Gyro Interface for DNV NAUT-AW DNV NAUT-AW requires dual gyro interface for a track control system, which consists of the ECDIS and the Autopilot FAP-2000. The benefit of this arrangement is that loss of a single gyro does not interrupt track control. The track control system can continue smoothly with a backup gyro. -
Page 338: Indication Of Gyro Source
19. Navigation Sensors 19.7.1 Indication of gyro source Information area Possible gyro source indications, which appear at the upper right corner, are as follows: • (1): Heading used by the ECDIS is from Gyro 1. • (2): Heading used by the ECDIS is from Gyro 2. •... -
Page 339: Gyro-Associated Alerts
19. Navigation Sensors 19.7.2 Gyro-associated alerts When no gyro value is received from gyro selected by "First priority gyro selection", alert AL 10 (Missing working gyro) is generated at the Autopilot FAP-2000. When no gyro value is received from a gyro not selected by "First priority gyro selection", alert AL 11 (Reference gyro missing or Compass comparison alert) is generated at the Autopilot FAP-2000. -
Page 340: Filter And Automatic Route Steering
19. Navigation Sensors 19.8.1 Filter and automatic route steering The filter can operate based on only one position sensor and one gyro. However, this minimum selection is not suitable for automatic route steering or program track, which both require an independent speed source. With automatic route steering, the minimum selection is for GOTO WPT: •... -
Page 341: Position Alignment
19. Navigation Sensors 19.9 Position Alignment The position alignment feature functions to fine-tune ship’s position by using radar overlay, radar echo target and ECDIS chart material. If position alignment is in use, the ECDIS will generate the following alert every 30 minutes to remind the operator to align position: "342 ChartAlign: over 30 min". -
Page 342: How To Reset Position Alignment
19. Navigation Sensors 5. If the position source is dead reckoning, the position set with chart alignment is the new start position for dead reckoning. In this case, there is no offset and the text indication "offset" does not appear. If the position source is something other than dead reckoning, then the indication "offset"... -
Page 343: Gyro Error Correction
19. Navigation Sensors 19.10 Gyro Error Correction Typical gyro error sources are installation error, speed/latitude error and dynamic settling error. Typically you detect gyro error on a user chart superimposed on the TT picture, on Tracked Target drawn on the ECDIS display or on radar overlay drawn on the ECDIS display. -
Page 344: How To Enable Gyro Error Correction
19. Navigation Sensors 19.10.1 How to enable gyro error correction To enable gyro error correction, which is effective for radar, ECDIS and route steering, do the following: 1. Spin the scrollwheel to display Menu/Info/Chart Menu in the mouse functions area, push the left mouse button, select Initial Settings from the menu then push the scrollwheel. -
Page 345: Wind Sensor
19. Navigation Sensors 19.11 Wind Sensor ECDIS can display and output wind data in the following three formats: Apparent: Wind meter-measured wind speed and direction. Wind angle reference: Heading North: True wind angle, true wind speed Wind angle reference: True North Theoretical: True wind angle, true wind speed Wind angle reference: Heading The illustration below shows wind speed and direction with given ship data. -
Page 346: Installation Parameter For Wind Sensor
19. Navigation Sensors True wind or Relative wind may be selected from the Other dialog box in the Sensors menu. Relative wind/true wind selection box 19.11.1 Installation parameter for wind sensor There are installation parameters for a wind sensor: • Source of True wind (Setting for inputted serial data) •... -
Page 347: Depth Sensor
19. Navigation Sensors Output to radar Option Description Output T(=True/North) only The reference field of the MWV sentence is T(True) and North data is output. Output T(=True/Theoretical) only The reference field of the MWV sentence is T(True) and Theoretical data is output. -
Page 348: Rot Sensor
19. Navigation Sensors 19.13 ROT Sensor You can get an alert when the ship's ROT is above the specified ROT. Open the Sensors dialog box and click the Count/ROT tab. Enter the limit in the Rot Alert input box. When the ROT is higher than the value specified for 10 seconds the alert "819 ROT over limit"... - Page 349 19. Navigation Sensors "714 Position Eq Error": Lost connection to position sensor No. 3. "715 Position Eq Error": Lost connection to position sensor No. 4. "716 Position Eq Error": Lost connection to position sensor No. 5. "718 ROT gyro error": Lost connection to ROT gyro sensor. "721 Radar system Error": Displayed if radar No.
- Page 350 19. Navigation Sensors This page intentionally left blank. 19-24...
-
Page 351: Tracked Targets (Tt) Functions
20. Tracked Targets (TT) Functions 20.1 How to Show, Hide Tracked Targets and Select Color and Size of TT Symbol Do the procedure below to show TTs on the ECDIS display and set their color and size. 1. Put the cursor on the text "TT" in the information area then left- click to select one of the options (AUTO, MAN, OFF). -
Page 352: How To Set Cpa And Tcpa Limits
20. Tracked Targets (TT) Functions 20.3 How to Set CPA and TCPA Limits You can set the CPA and TCPA limits used by the ECDIS in the information area. 1. Put the cursor on the text "CPA OFF" then left-click to get distance and time fields. 2. -
Page 353: Lost Tracked Targets
20. Tracked Targets (TT) Functions 20.5 Lost Tracked Targets A lost tracked target is displayed on the ECDIS as a blinking target symbol in green and dark yellow alternately. 20.5.1 Lost tracked target alarm (buzzer) Put the cursor on the text OFF, FILT or ALL (whichever is shown) in the Lost TGT alarm line, spin the scrollwheel to select desired option then left click to confirm selection. -
Page 354: How To Display Tracked Target Data
20. Tracked Targets (TT) Functions 20.7 How to Display Tracked Target Data On the ECDIS display, put the cursor on a desired TT then push the scrollwheel. TT on ECDIS screen TT display window Expanded TT display The basic target display dialog for a tracked target consists of the following information: •... -
Page 355: Source Of Tracked Targets
20. Tracked Targets (TT) Functions 20.8 Source of Tracked Targets Tracked targets on ECDIS can be monitored from one source at the time. To find the source of tracked targets, put the cursor on Radar in the status bar. (WT) To change the source of radar targets, put the cursor on Radar in the status bar to show the Radar selections dialog box. -
Page 356: Tracked Target Recording Functions
20. Tracked Targets (TT) Functions 20.10 Tracked Target Recording Functions Target recording is used to record tracked target information to the danger targets log. For more information about recording a dangerous target, see section 24.5 "Danger Target Log". 20.11 Tracked Target Related Alerts The alert "355 Radar comm. -
Page 357: Ais Target Functions
21. AIS Target Functions 21.1 Introduction An AIS transponder can be connected to the ECDIS to display AIS targets received from an AIS transponder. The ECDIS can store up to 1,500 AIS targets in its storage buffer. When this buffer becomes full of AIS targets, the alert 639 is generated to alert you that the storage buffer is full. - Page 358 21. AIS Target Functions Additionally the AIS transponder receives messages other than messages from ships: • AIS Base station • AIS on airborne SAR craft • AIS on ATON (AIS aid to navigation) There can be several hundreds or several thousands AIS targets, and of those only a few will be significant for your ship.
-
Page 359: Ais Symbols On Ecdis
21. AIS Target Functions 21.2 AIS Symbols on ECDIS Below you can find symbols used for AIS in different status: Sleeping AIS target AIS dangerous target blinking Active AIS target Selected AIS target turning to port red until acknowledged, then it is displayed as red symbol. AIS target turning starboard, ROT is ATON symbol Lost AIS target, red X-sign... -
Page 360: How To Display Ais Targets
21. AIS Target Functions 21.3 How to Display AIS Targets Targets that are being tracked by an AIS transponder can also be displayed on the ECDIS display. To do this; Put the cursor on the text AIS in the information area then push the left mouse button to select an option (DISP OFF, DISP FIL, DISP ALL). - Page 361 21. AIS Target Functions Below are examples of how targets are filtered using various filtering methods. Filtered by TCPA Filtered by Range Filtered by CPA Note: AIS and tracked target viewing limitations are as follows: • AIS and tracked targets are displayed on top of chart 1:1,000,001 for S57 charts. •...
-
Page 362: How To Set Cpa And Tcpa Limits
21. AIS Target Functions The right illustration shows AIS targets with "Outlines" and the left illustration shows AIS targets with "point symbols". AIS targets are displayed as true scale symbol if the displayed chart scale is larger than set with "Outlines"... -
Page 363: Cpa Auto Activation
21. AIS Target Functions 21.6 CPA Auto Activation You can get automatic activation of a sleeping AIS target when it is within the set CPA limit. The options are OFF, FILT or ALL. • OFF activates no AIS targets inside the CPA limit •... -
Page 364: Lost Ais Target Alarm
21. AIS Target Functions 21.8 Lost AIS Target Alarm A lost AIS target is indicated with an X through the AIS target symbol. When alert "633: Lost AIS target" is acknowledged, AIS symbol will be removed from display. If alert "633: Lost AIS target" is not acknowledged in a certain time, lost AIS target symbol will be automatically removed from display. -
Page 365: Ais Target Related Alerts
21. AIS Target Functions 21.10 AIS Target Related Alerts "636 AIS display 95% full": Shown when 95% of user set limit reached. "637 AIS display 100% full": Shown when user set limit is reached. "638 AIS storage 95% full": Given when 95 percent of 1500 targets are in the storage buffer "639 AIS storage 100% full": Given when 1500 targets or more are in the storage buffer. - Page 366 21. AIS Target Functions If more information is needed, put the cursor in the Target Dialog window then push the left mouse button to get the Target Details window. Note: Availability of data in the Target Details window is subject to the content the AIS transponder reports. The operator can set Closest Point of Approach (CPA), and Time to CPA (TCPA) to define dangerous AIS targets.
-
Page 367: How To Display Ais Target Past Positions
21. AIS Target Functions 21.12 How to Display AIS Target Past Positions The past position display shows equally time-spaced dots marking past positions of activated AIS targets. A new dot is added at preset time intervals until the preset number is reached. If a target changes its speed, the spacing will be uneven. -
Page 368: How To Display Name Or Call Sign Of Ais Target
21. AIS Target Functions 21.13 How to Display Name or Call Sign of AIS Target You can display either the name or call sign of AIS targets on the ECDIS display. Put the cursor in the upper left corner of the Target Dialog window then select No Label, Display Name or Display Call Sign as desired. See the figure below for how the data display changes when changing from call signs to names and vice versa. -
Page 369: How To Display Ais Interface Status
21. AIS Target Functions 21.15 How to Display AIS Interface Status You can verify the status of the AIS interface on the Other page in the Sensors dialog box. The lower part of this page is reserved for AIS interface monitoring. •... -
Page 370: Ais Safety Message
21. AIS Target Functions 21.16 AIS Safety Message 21.16.1 Introduction You may send and receive messages via the VHF link, to a specified destination (MMSI) or all AIS-equipped ships in the area. Messages can be sent to warn of safety of navigation, for example, an iceberg sighted. Routine messages are also permitted. -
Page 371: How To Create A New Safety Message
21. AIS Target Functions 21.16.2 How to create a new safety message You can create a safety message on the ECDIS for transmission by the AIS transponder. This can be done as follows: 1. Display Menu/Info/Chart Menu in the mouse functions area then push the left mouse button to open the Main menu. -
Page 372: How To Display A Received Safety Message
SAFETY MESSAGE 2. Select Safety Message from the menu then push the scrollwheel to show the dialog box shown left. 3. Check Enable changes. The Safety Message dialog box shows the message received by the AIS transponder. FURUNO SIMULAT 21-16... -
Page 373: How To Reply To A Safety Message
To reply to a safety message, do as follows: 1. Display the Safety Message dialog box then check Enable changes. SAFETY MESSAGE FURUNO SIMULAT 2. In the Filter field, select Received from the upper box and the message to reply to from the Name box. -
Page 374: Ais Own Ship Info
21. AIS Target Functions 21.17 AIS Own Ship Info Own ship information (voyage related data and ship related data) sent by the AIS transponder can be modified in ECDIS. To view or modify own ship information, do following: 1. Display Menu/Info/Chart Menu in the mouse functions area then push the left mouse button to open the Main menu. -
Page 375: Navtex Messages
22. NAVTEX Messages 22.1 Introduction NAVTEX (Navigational Telex) is an international automated medium frequency direct-printing service for delivery of navigational and meteorological warnings and forecasts, as well as urgent marine safety information to ships. NAVTEX messages can be read and written in ECDIS. The position of NAVTEX data can be marked on the screen, with the NAVTEX icon. -
Page 376: How To Receive Navtex Messages
23. Radar Overlay 22.2 How to Receive NAVTEX Messages When a Navtext message is received in ECDIS, the alert "798 NAVTEX message received" appears. To display a NAVTEX message, do as follows: 1. Display Menu/Info/Chart Menu in the mouse functions area then push the left mouse button to open the Main menu. -
Page 377: Radar Overlay
23. Radar Overlay 23.1 Introduction The optional radar overlay has the radar echo image overlaid on the ECDIS chart display. The radar overlay video can be received by ECDIS two ways: • Via a radar overlay card fitted in the ECDIS •... -
Page 378: How To Select Source Of Radar Overlay
23. Radar Overlay 23.3 How to Select Source of Radar Overlay 23.3.1 Radar overlay via LAN from FAR-2x07 radars Put the cursor on Radar in the status bar to show the Radar selections window. The item "Radar overlay source" shows the current source for the radar overlay. In the example display below the source is MAST X. If there are more than one radar video source available, you can change the radar overlay source by clicking Radar Overlay source then spin the scrollwheel to select a source. -
Page 379: Radar Overlay Display Modes
23. Radar Overlay 23.3.3 Radar overlay display modes You can select from the following presentation modes with the radar overlay: ECDIS only: Only chart is displayed on the ECDIS. ECDIS and radar: With S57 chart material, the radar echo image is mixed into the chart so that some chart features lie above or beneath the radar image. -
Page 380: How To Adjust The Radar Overlay (Radar Overlay Dialog Box)
23. Radar Overlay 23.4 How to Adjust the Radar Overlay (Radar Overlay dialog box) The Radar Overlay dialog box has controls for adjustment of the radar image - gain, sea clutter, rain clutter, interference rejector, echo stretch, and echo average. Note 1: Sea clutter and rain clutter controls are not available in the Radar Overlay dialog box if the radar video is received through LAN from FAR-2x07 radars. -
Page 381: Rain Clutter
23. Radar Overlay 23.4.4 Rain clutter The rain clutter control removes rain clutter from the radar echo image. If you get radar overlay video through LAN from FAR-2x07 radar, use the rain clutter control on the radar. When you adjust the rain clutter, "Noise" is automatically switched ON in order to display low-level radar images. -
Page 382: Transparency
23. Radar Overlay • Adjust controls (gain, sea clutter, rain clutter, interference rejector, etc) on the radar to obtain proper radar image. • On the radar overlay dialog box, do the following: a) Set IR to IR1. b) Adjust the Gain control to properly set the gain. Note: The condition of the radar echo changes with adjustment of range, etc. -
Page 383: How To Adjust Radar Overlay To Match Positions Of Chart Features
23. Radar Overlay 23.6 How to Adjust Radar Overlay to Match Positions of Chart Features 23.6.1 Error sources of radar echo image and chart display mismatch There are several reasons why the radar echo image and chart display do not match exactly. The mismatch is a combination of several reasons and removing one reason doesn't solve the mismatch perfectly. -
Page 384: How To Compensate For Bearing Error
23. Radar Overlay 23.6.3 How to compensate for bearing error Bearing error can be compensated on the Ship and Route Parameters dialog box. To show this box, open the menu, select Initial Settings, Navigation parameters, and Ship and route parameters. There are two ways to compensate for gyro-induced bearing error: 1) Manual Adjust value of manual gyro correction. -
Page 385: Radar Overlay Related Alerts
23. Radar Overlay 23.7 Radar Overlay Related Alerts Alerts generated by Radar Overlay are related to ECDIS workstation where Radar overlay card is located. This means that Radar overlay related alerts on first ECDIS workstation starts with alert number 100 and Radar overlay related alerts on the No.2 ECDIS starts with alert number 200. - Page 386 23. Radar Overlay Alert number 110: TT DANGEROUS TARGET ------------------------------------ TT DANGEROUS TARGET FOUND. Alert number 111: TT TARGET IN ACQ ZONE 6/13 ------------------------------------ TT TARGET IN ACQUISITION ZONE. 23-10...
-
Page 387: Recording Functions
24. Recording Functions 24.1 Introduction The ECDIS records various voyage-related items like movement and position of your ship and dangerous radar targets (from radar). These items are recorded in the following logs: Voyage log: Records entire voyage, i.e., a sailing of a route from first point to the last. Details log: Records position, speed and course once every minute. -
Page 388: Details Log
24. Recording Functions 24.3 Details Log The details log contains voyage information of the last 12 hours. Various information is recorded in the Details log once per minute. • Date and time • Position of your ship as output by selected navigator. •... -
Page 389: Voyage Log
24. Recording Functions 24.4 Voyage Log The voyage log holds data for the entire voyage, recording the following data: • Changes of course and speed. User can define limits for course change and speed change of your ship to be recorded. -
Page 390: How To Set Conditions For Logging
24. Recording Functions 24.4.2 How to set conditions for logging The operator can define limits for course change and speed change of your ship to be recorded and also time period for automatic logging. To set them, do the following: 1. -
Page 391: Recording Positions
DGPS-1st ° 19.222'N ° 00.404'E An example of saving direct position or position calculated by the system FURUNO ° 19.222'N ° 00.404'E An example of saving position based on operator observation First you should locate the position of your observation on the ECDIS chart. Use, for example, the two separate EBL and VRM available in the Nav Marks dialog box. - Page 392 24. Recording Functions Basic operation Coordinates of the aid to navigation can be entered into dialog boxes or they can be selected graphically on the chart: • S57: Click on a charted object (beacon, light, buoy etc.). Description of the object appears above coordinate boxes.
-
Page 393: Danger Target Log
24. Recording Functions 24.5 Danger Target Log The Danger Target log stores information about targets that are received from a TT and/or targets that are received from an AIS transponder (AIS targets). If a tracked target or AIS target is within the set CPA and TCPA, information of all tracked targets (including non- dangerous targets) are recorded into the Danger Target log. -
Page 394: How To Set Conditions For Viewing And Logging Of Danger Targets
24. Recording Functions 24.5.2 How to set conditions for viewing and logging of danger targets The operator may set Closest Point of Approach (CPA), Time to CPA (TCPA) and Log interval for viewing dangerous tracked target and AIS targets on the ECDIS display. A dangerous tracked target or AIS target is blinking and its color is green and red alternately. -
Page 395: Chart Usage Log
24. Recording Functions 24.6 Chart Usage Log The chart usage log stores which charts were displayed on the ECDIS chart display area or which were used for chart alerts. The following information is recorded in the chart usage log: • Chart ID •... -
Page 396: How To Make Backup Copy From Logs
24. Recording Functions How to change font size for hard copy of logs In each log (Details, Voyage or Danger Targets log) you can select font size for printed version. To change font size, do the following: 1. Open desired log. 2. -
Page 397: How To Reset (Emptying) Voyage And Danger Targets Logs
24. Recording Functions 24.9 How to Reset (emptying) Voyage and Danger Targets Logs It may be useful to reset (empty) the Voyage and Danger Targets logs when you are starting a new voyage. If necessary, make a backup copy before resetting. To reset a log, do the following: 1. - Page 398 24. Recording Functions 5. Click the triangle and select "Save as User Chart" to show log. 6. The User Chart Conversion dialog box appears. This dialog box contains the following fields: User chart name: Enter name for the user chart. Select points with distance >...
-
Page 399: Alert Log
24. Recording Functions 24.11 Alert Log The Alert log collects and records alarms generated by the system. You may view a list of generated alarms using the Alert log. TEXT VIEW - ALERT LOG To open the log, do as follows: 1. -
Page 400: Distance And Trip Counters
24. Recording Functions 24.12 Distance and Trip Counters Distance and trip counters have separate fields for both through water and over ground distances. This information is available on the Count page of the Sensors dialog box, shown right. To reset the distance trip counter, click the Reset trip counter on the Count page. -
Page 401: Anchor Watch
25. Anchor Watch 25.1 Introduction The anchor watch feature checks to see if your ship is drifting when it should be at rest. Set the limit for the anchor watch on the menu. If your ship drifts more than the distance set, the alert "874: Anchor watch" appears. Alarm setting Your ship's position, where... -
Page 402: How To Deactivate Anchor Watch
25. Anchor Watch 25.3 How to Deactivate Anchor Watch To deactivate the anchor watch: 1. Open the main menu. 2. Select Anchor Watch. 3. Click the Stop Anchor Watch button to deactivate the anchor watch. 25-2... -
Page 403: Datum
26. Datum 26.1 General Datum is a mathematical model of the earth based on which a sea chart is produced. If the datum of a position sensor and that of a sea chart are different, a transformation has to be made somewhere in the system. Not doing so can result in errors of several sea miles. -
Page 404: Positioning Devices And Datum
26. Datum 26.4 Positioning Devices and Datum In early days of electronic positioning devices, datums received little attention because the commonly used systems utilised special charts (like Decca charts). Later on, data output was added to these systems, but still no attention was paid to datums and the position errors were considered as an inaccuracy of the system. -
Page 405: Parameters Setup
27. Parameters Setup 27.1 Parameters The Initial Settings menu in the Initial Settings dialog box contains the installation parameters, navigation parameters and optimization parameters that define the configuration of the ECDIS and operative parameters that are either used to control steering and navigation calculation or used during route planning. To open the Initial Settings menu, do the following: 1. -
Page 406: How To Access The Installation Parameters
27. Parameters Setup Parameter backup User can make backup copy of parameters. See Chapter 17 for details. Installation parameters The ECDIS system parameters are set by the installation parameters. Note: Access to the installation parameters requires a password. For details see the installation manual. Navigation parameters Parameters for your ship and routes. -
Page 407: Navigation Parameters Settings
MAX r.o.t.: Indicate the maximum rate of turn of the ship. Turn end tol.: Define the window for the detection of the FURUNO FAP-2000 TOKYO KEIKI end of turn. Typical values are between 2 to 4 degrees. or YOKOGAWA PT-500A... -
Page 408: Forwarding Distances
27. Parameters Setup 27.1.5 Forwarding distances The forwarding distance is the distance the ship travels straight after the steering command is given to the autopilot. This distance may vary with a different required radius of turn. The logic to verify the correct distance is to perform a maneuver of 90 degrees (Port and Starboard), with a SMALL RADIUS (0.3 nm), and verify from the radar, using the curved EBL, if the turn goes "long"... - Page 409 27. Parameters Setup How to set forwarding distances for Yokogawa PT-500A (category B) In order to edit forwarding distances parameters, do the following: 1. Put the cursor on the text SINGLE, PLAN, SLAVE, MULTI or MASTER (whichever is shown) on the lower right corner, then push the right mouse button to open the Initial Settings dialog box.
- Page 410 27. Parameters Setup Normally these parameters are entered during sea trial but can also be modified later on. See figures below: Wheel Over Point (WOP) Forwarding distance = 1 Radius Next course How forwarding distance is defined Theoretical turn Forwarding distance too short;...
-
Page 411: Optimization Parameters Setting
27. Parameters Setup 27.1.6 Optimization parameters setting The optimization parameters are used in optimization calculation. Therefore these parameters must be defined before calculation. In order to modify optimization parameters, do the following: 1. Spin the scrollwheel to show Menu/Info/Chart Menu in the mouse functions area then push the left mouse button. - Page 412 27. Parameters Setup This page intentionally left blank. 27-8...
-
Page 413: Color Calibration
28. Color Calibration 28.1 Color Calibration Settings Note: Use of the brilliance control (with FURUNO-supplied monitor) may adversely affect the visibility of information on the night display. 28.1.1 Color test for ARCS charts You may want to adjust brilliance. You have a tool to check that you can clearly see all details of the charts. For ARCS chart this tool is Colors. -
Page 414: Color Differentiation Test For S57 Charts
28. Color Calibration 28.1.2 Color differentiation test for S57 charts You may want to adjust brilliance. You have a tool to check that you can clearly see all details of the charts. For ARCS chart this tool is Colors. For S57 charts this tool is the color differentiation test diagram. The color differentiation test diagram is a part of ECDIS chart 1 and you can use it as follows: 1. -
Page 415: Gray Scale Test
28. Color Calibration 28.1.3 Gray scale test Set brilliance and contrast to calibrated positions. Use the gray scale test to visually inspect neutral shades of grey. Note: During any self-test, the ECDIS becomes inoperative and this is indicated by sounding the buzzer and flashing the lamp in the SYSTEM FAILURE key on the keyboard-equipped control unit. - Page 416 28. Color Calibration 6. Click the Gray Scale button at the upper left-hand corner of display with the left mouse button, and the following display appears: Grey scale test pattern 7. Check for proper display of gray shades. If the menu at the left side has disappeared, roll the trackball rightward to display it.
-
Page 417: Conning Display
29. Conning Display 29.1 System Configuration The ECDIS can receive data from various sensors. It can adopt information output by the sensors in either analog or digital format, make navigation calculations from the data display and show the results on the conning display (option). -
Page 418: Display Interpretation
29. Conning Display 29.2 Display Interpretation The conning display shows collected data from different sensors, and the data below is available for display. However, this depends on which sensors are installed and connected on board the ship. Typically information which is displayed on the conning display are received from following sensors: •... -
Page 419: Rot Window
29. Conning Display 29.2.1 ROT window The ROT window monitors actual ROT, which is displayed in digital format in the upper center box and analog format in the center of the window. The text CALC" appears when ROT is calculated by the system. The scale is available from 35 to 90 degrees, and is set at installation, with installation parameters. -
Page 420: Rudder Window
29. Conning Display 29.2.4 Rudder window The rudder window shows the following information: First rudder and source of the first rudder. In this example the source is actual rudder (ACT). Second rudder and source of the second rudder. In this example the source is ordered rudder (ORD). -
Page 421: Autopilot Fap-2000 Window
29. Conning Display 29.2.7 Autopilot FAP-2000 window The Autopilot FAP-2000 window displays the following information: • SET ROT: Current set rate of turn based on current speed and set turning radius. • SET COURSE: Current set course. • MODE: Indicates selected steering mode. •... -
Page 422: Route Window
29. Conning Display 29.2.8 Route window When you have selected a route to monitor, the route window shows the following information: TO WPT: The waypoint your ship is approaching. ROUTE: Calculated set course to follow the monitored route including off track, drift and gyro error compensation. -
Page 423: Weather And Wind Window
29. Conning Display 29.2.9 Weather and wind window The weather and wind window shows • Wind direction, true or relative • Wind speed • Air pressure (optional) Weather conditions of last 12 hours are shown. Numerical values are presented in magenta for True Wind and in orange for Relative Wind. -
Page 424: Combined Wind, Depth And Destination Window (For Dnv Specification)
29. Conning Display 29.2.11 Combined wind, depth and destination window (for DNV specification) 29.2.12 Fuel consumption window The fuel consumption window displays three sets of indications that show ship’s speed, fuel consumption per hour and fuel consumption per nautical mile. Each indication has two vertical bars. The bar on the left shows planned speed or fuel consumption and the bar at right shows actual situation. -
Page 425: Propellers Window
29. Conning Display 29.2.14 Propellers window Propulsion RPM and pitch Three different types of propellers windows are available and one is selected during the installation. The content of this window is defined with Propellers 1-4 in the Installation parameters. Propulsion with actual and ordered information You can select during installation actual and ordered information of propeller using Engine Control Device Type "IEC 61162-1 (MAN B+W, $xxXDR, $xxRPM)". - Page 426 29. Conning Display Propulsion with main engine (for DNV specification) Four different types of propellers windows are available and one is selected during the installation. The content of this window is defined with Propellers 1-4 in the Installation parameters. Single Single CPP Dual Dual CPP...
-
Page 427: Azimuth Propulsion Window
29. Conning Display 29.2.15 Azimuth propulsion window Two different types of azimuth propulsion windows are available and one is selected during the installation. The content of this window is defined with Azimuth in the Installation parameters. 29.2.16 Speedpilot window The speedpilot window displays the following data: •... -
Page 428: Message Window
29. Conning Display 29.2.17 Message window The message window is available with connection of a central alert unit (option), and it shows various alerts generated by the central alert unit. 29.2.18 Main engine start air pressure window This window shows engine starting air pressure. 29.2.19 Alarm messages window This window shows all active or pending alerts in priority order. -
Page 429: Modes For Conning Display
29. Conning Display 29.3 Modes for Conning Display The conning display shows data collected from different sensors and also data from ECDIS and Autopilot processors. There are four different conning display modes; Harbour 1 mode, Harbour 2 mode, Navigate 1 mode and Navigate 2 mode, and one of these modes may be selected from a dialog box. -
Page 430: Use Of Ecdis Display For Conning Display
29. Conning Display 29.4 Use of ECDIS Display for Conning Display If you have only one monitor, it is possible to use it for both an ECDIS display and a Conning display, if ECDIS software installation has been done for "ECDIS with Conning Display (1 display unit)". Then you can switch between ECDIS display and Conning Display. -
Page 431: Alerts
30. Alerts 30.1 Introduction FEA-2x07 is designed to meet requirements set on paper "IMO MSC 252, xxx" issued by IMO. Alerts generated by ECDIS can be divided into three priorities: • Alarm: Only the most urgent alerts that need your attention. The alert initially flashes in red, and an audio alarm sounds until acknowledged. -
Page 432: Alerts Generated By Navigation Calculation
30. Alerts 30.3 Alerts Generated by Navigation Calculation Navigation calculation generates the following alerts: • Error detected in any sensor • Radar communication error • Software alerts, etc. 30.4 Alerts Generated by Chart Calculation Chart calculation generates the following alerts: •... -
Page 433: Alert Priority System
30. Alerts 30.7 Alert Priority System The permanently visible alert is the top most urgent alarm at any moment. • Alarms have priority from 1 to 2 to control urgency. Priority 1 is the highest. When an alarm appears, a buzzer is continuously sounding until alarm is acknowledged. -
Page 434: Indications For Doubtful Integrity
30. Alerts 30.8 Indications for Doubtful Integrity There are a few cautions that have to indicate which are sources of doubtful integrity. These kind of cautions are "404 Gyro data unreliable", "405 Log data unreliable", "407 Position discrepancy" and " 413SOG/COG data unreliable. -
Page 435: Backup Navigator Alert
"2451 Route: WP approach alarm" is not acknowledged within 30s of wheel-over line, the "Backup Navigator Alarm" is released. "Backup Navigator Alarm" is related to following alarms (Furuno FAP-2000, YOKOGAWA PT-500A or TOKYO KEIKI PR-6000): Alert "400 Filter: POSN unreliable"... -
Page 436: List Of Alerts
30. Alerts 30.12 List of Alerts 30.12.1 Navigation alerts Alert number 320: DEPTH BELOW LIMIT /2/9 ------------------------------------ ECHO SOUNDER INDICATES WATER DEPTH BELOW TRANSDUCER TO EXCEED SPECIFIED SAFE LIMIT. Alert number 400: FILTER: POSN UNRELIABLE /1/- ------------------------------------ ECDIS IS NOT ABLE TO ESTIMATE A RELIABLE POSITION. - Page 437 30. Alerts Alert number 407: POSITION DISCREPANCY /7/14 ------------------------------------ SYSTEM HAS DETECTED MORE DIFFERENCE THAN SET LIMIT BETWEEN OWN SHIP PRIMARY AND SECONDARY POSITIONS OR BETWEEN OWN SHIP AND ANY SENSOR POSITION. CHECK POSITION SENSORS Alert number 408: FILTER: SPD BELOW /3/10 ------------------------------------ KALMAN FILTER REQUIRED THAT THE...
- Page 438 30. Alerts Alert number 352: ROUTE: ILLEGAL ETA WPT ------------------------------------ ETA WAYPOINT DOESN'T EXIST IN ROUTE FILE OR ETA WAYPOINT IS NOT BETWEEN NEXT AND FINAL WAYPOINT. VERIFY IN 'ROUTE MONITOR' THAT A VALID ROUTE IS SELECTED. Alert number 353: ROUTE: ILLEGAL TO WPT ------------------------------------ NEXT WAYPOINT DOESN'T EXIST IN ROUTE...
- Page 439 30. Alerts Alert number 363: ROUTE: SELECT DISABLED ------------------------------------ A NEW ROUTE CANNOT BE SELECTED DURING ROUTE STEERING. USE 'RADIUS CONTROL' TO OVERRIDE ROUTE STEERING BEFORE CHOOSING A NEW ROUTE. Alert number 364: ROUTE: CANCEL DISABLED ------------------------------------ A ROUTE CANNOT BE CANCELED DURING ROUTE STEERING.
- Page 440 30. Alerts Alert number 381: USER CHART: NEED POINTS ------------------------------------ USER CHART HAS MORE THAN 60 LINES OR 20 SYMBOLS AND IT DOES NOT CONTAIN ANY POINTS. USE 'USER CHART' MENU TO SELECT A VALID USER CHART OR ADD POINTS TO CURRENT USER CHART Alert number 382: USERCHART: FILE NOT FOUND ------------------------------------...
- Page 441 30. Alerts Alert number 480: TRACKPILOT RECEIVE ERROR /5/12 ------------------------------------ ECDIS CANNOT RECEIVE ANY DATA FROM TRACKPILOT. CHANGE "MAIN STEERING" -SELECT OR TO ANY OTHER POSITION THAN AUTOP. CHECK AND VERIFY TRACKPILOT OPERATION BEFORE NEW TRY Alert number 488: TRACK CONTROL STOPPED ------------------------------------ CONNECTION TO THE TRACKPILOT HAS BEEN LOST WHILE THE SYSTEM PERFORMED...
- Page 442 30. Alerts Alert number 636: AIS DISPLAY 95% FULL /6/13 ------------------------------------ WHEN 95% OF DISPLAY CAPACITY FOR AIS TARGETS ARE IN USE. Alert number 637: AIS DISPLAY 100% FULL /5/12 ------------------------------------ WHEN 100% OF DISPLAY CAPACITY FOR AIS TARGETS ARE IN USE. Alert number 638: AIS STORAGE 95% FULL /6/13...
- Page 443 30. Alerts Alert number 706: GYRO ERROR /5/12 ------------------------------------ GYRO1 DATA IS NOT RECEIVED CORRECTLY USE 'INITIAL SETTINGS' MENU TO SET GYRO AGAIN. IF FAILURE STILL EXISTS, USE 'SENSORS' SPEED/POSITION PAGE TO SELECT VALID SENSORS. Alert number 707: GYRO ERROR /5/12 ------------------------------------ GYRO2 DATA IS NOT RECEIVED CORRECTLY...
- Page 444 30. Alerts Alert number 714: POSITION EQUIPMENT ERROR /5/12 ------------------------------------ POSITION EQUIPMENT 3 DATA IS NOT RECEIVED CORRECTLY. USE 'SENSORS' POSITION TO SELECT VALID POS SENSOR. Alert number 715: POSITION EQUIPMENT ERROR /5/12 ------------------------------------ POSITION EQUIPMENT 4 DATA IS NOT RECEIVED CORRECTLY.
- Page 445 30. Alerts Alert number 729: DGPS POS. SOURCE CHANGE /5/12 ------------------------------------ DGPS POSITION SENSOR IN CHANNEL NUMBER 3 HAS CHANGED ITS OPERATION MODE FROM NORMAL TO DIFFERENTIAL OR FROM DIFFERENTIAL TO NORMAL. CHECK SENSORS AND IF REQUIRED SELECT MORE SUITABLE POSITION SENSOR. Alert number 730: DGPS POS.
- Page 446 30. Alerts Alert number 736: AMWSS COMM ERROR /6/13 ------------------------------------ COMMUNICATION WITH AMWSS FAILS. CHECK CONNECTION TO AMWSS Alert number 737: AIS RECEIVE ERROR /6/13 ------------------------------------ DATA FROM AIS IS NOT RECEIVED CORRECTLY. CHECK CONNECTION TO Alert number 738: DATUM MISMATCH /6/13 ------------------------------------ POSITION SENSOR IN CHANNEL NUMBER 1...
- Page 447 30. Alerts Alert number 744: DATUM CHANGE ------------------------------------ POSITION SENSOR IN CHANNEL NUMBER 1 HAS CHANGED OUTPUT POSITION FROM ANOTHER DATUM TO WGS 84 DATUM. Alert number 745: DATUM CHANGE ------------------------------------ POSITION SENSOR IN CHANNEL NUMBER 2 HAS CHANGED OUTPUT POSITION FROM ANOTHER DATUM TO WGS 84 DATUM.
- Page 448 30. Alerts Alert number 756: AFT ECHO SOUNDER ERROR /6/13 ------------------------------------ DATA FROM AFT ECHO SOUNDER IS NOT RECEIVED CORRECTLY. CHECK COMMUNI- CATION BETWEEN ECDIS AND ECHO SOUNDER. Alert number 757: WATER CURRENT ERROR /6/13 ------------------------------------ DATA OF WATER CURRENT IS NOT RECEIVED CORRECTLY.
- Page 449 30. Alerts Alert number 765: NO LAN ADAPTER INSTALLED /5/12 ------------------------------------ INSTALLATION MISTAKE. "NO LAN ADAPTER(S) DEFINED. INSTALL ECDIS SW AGAIN. Alert number 766: LAN ADAPTER 1 PARAM ERROR /6/13 ------------------------------------ INSTALLATION MISTAKE. INSTALL ECDIS SW AGAIN. Alert number 767: LAN ADAPTER 2 PARAM ERROR /6/13 ------------------------------------...
- Page 450 30. Alerts Alert number 775: LAN RADAR 4 CONN ERROR /5/12 ------------------------------------ ECDIS FAILED TO COMMUNICATE WITH LAN RADAR 4. CHECK IP ADDRESSES BOTH FOR LAN RADAR ON ECDIS AND ON RADAR. Alert number 776: AIR TEMPERATURE ERROR /6/13 ------------------------------------ DATA OF AIR TEMPERATURE IS NOT RECEIVED CORRECTLY.
- Page 451 Alert number 788 SYSTEM FROZEN APPEARS AS AN EARLY WARNING INDICATION THAT THE SYSTEM MAY ENTER STATE OF FREEZE. IF THIS ALERT WILL BE GENERATED FREQUENTLY, CONTACT TO FURUNO SERVICE. Alert number 789: PROPELLER1 ERROR (ACT) /3/10 ------------------------------------ DATA OF PROPELLER 1 IS NOT RECEIVED CORRECTLY.
- Page 452 30. Alerts Alert number 819: ROT OVER LIMIT /5/12 ------------------------------------ IF ROT VALUE STAYS OVER LIMIT MORE THAN 10 SECS, WARNING IS GENERATED. Alert number 830: EXT. NAVIGATION EQ ERROR ------------------------------------ EXTERNAL NAVIGATION EQUIPMENT IS REPORTED HAVING ERROR. Alert number 831: EXT.
-
Page 453: Chart Alerts
Alert number 873: PSSA AREA /5/12 Alert number 874: ANCHOR WATCH /5/12 30.12.3 Steering alerts with FURUNO Autopilot FAP-2000 Alert number 451: ROUTE: WPT APPROACH ALARM /1 or /7 ------------------------------------ WAYPOINT IS NOW BEING APPROACHED. CLICK 'ACKN. WARNING' TO ACCEPT THE TURN. - Page 454 30. Alerts Alert number 456: ROUTE: WPT APPROACH ERROR ------------------------------------ 'TIME TO WOP' HAS CHANGED SINCE 'WPT APPROACH' ALERT WAS ACKNOWLEDGED, POSSIBLY DUE TO A POSITION JUMP. VERIFY POSITION AND SPEED SEN SORS IN 'SENSORS' PAGE Alert number 458: ROUTE: LAST WPT APPROACH /1 or /7 ------------------------------------ FINAL WAYPOINT OF THE ROUTE IS...
- Page 455 30. Alerts Alert number 469: TRACKPILOT: OFF COURSE /6/13 ------------------------------------ TRACKPILOT DOES NOT STEER WITHIN LIMITS OF 'COURSE TO STEER' COMMAND'. VERIFY TRACKPILOT FUNCTIONS. Alert number 470: DISABLED: NEEDS FILTER ON ------------------------------------ 'ROUTE STEERING' MODE CAN BE USED ONLY WHEN 'FILTER' IS ON AND THERE ARE ENOUGH SPEED, HEADING AND POSITION SENSORS.
- Page 456 30. Alerts Alert number 490: DISABLED: NEEDS LOG SENS. ------------------------------------ 'ROUTE STEERING' MODE CAN BE USED ONLY WHEN THERE IS AN INDEPENDENT SPEED SOURCE. ALTERNATIVES ARE A LOG OR TWO POSITION RECEIVERS Alert number 491: DISABLED: NEEDS DIFF POS. ------------------------------------ 'GOTO TRACK' MODE CAN BE USED ONLY IF A HIGH-PRECISION POSITION SENSOR IS IN USE WITH KALMAN FILTER.
- Page 457 30. Alerts Alert number 499: DISABLED: NEEDS GOOD POS ------------------------------------ 'ROUTE STEERING' MODE CANNOT BE ACTIVATED WITHOUT DIFF. POSITION AND IF POSITION DISCREPANCY LIMIT IS EXCEEDED. Alert number 501: ROUTE: NEED HIGHER SPEED /3/10 ------------------------------------ THIS IS WARNING THAT SPEED IS BELOW LIMIT SET FOR KALMAN FILETER.
-
Page 458: Steering Alerts With Yokogawa Autopilot Pt-500A Cat. B
30. Alerts Alert number 507: ROUTE: NEED SOG/COG REF. /5/12 ------------------------------------ 'GOTO TRACK' MODE CANNOT CONTINUE WITHOUT SOG/COG REFERENCE AVAILABLE FROM POSITION SENSOR OR BOTTOM TRACK OF DUAL AXIS LOG. Alert number 508: DISABLED: NEED SOG/COG REF. ------------------------------------ GOTO TRACK STEERING MODE CANNOT BE ACTIVATED WITHOUT SOG/COG REFERENCE AVAILABLE FROM POSITION SENSOR OR BOTTOM TRACK OF DUAL AXIS LOG... - Page 459 30. Alerts Alert number 455: ROUTE: OFF COURSE /6/13 ------------------------------------ SYSTEM NEEDS MORE THAN A SET LIMIT TO KEEP THE TRACK. THIS ALERT IS REPEATED EVERY 5 MINUTES. Alert number 456: ROUTE: WPT APPROACH ERROR ------------------------------------ 'TIME TO WOP' HAS CHANGED SINCE 'WPT APPROACH' ALERT WAS ACKNOWLEDGED, POSSIBLY DUE TO A POSITION JUMP.
- Page 460 30. Alerts Alert number 471:AP MODE CONFLICT - USE AUTO/4/11 ------------------------------------ YOU HAVE TRIED TO ACTIVATE TRACK STEERING OR YOU HAVE REACHED THE END OF THE ROUTE, BUT YOU HAVE NOT LEFT 'TRACK' MODE CHANGE IMMEDIATELY TO AUTO' MODE Alert number 475: ROUTE: NEEDS FILTER ON /3/10 ------------------------------------...
-
Page 461: Steering Alerts With Yokogawa Autopilot Pt-500A Cat. C
30. Alerts Alert number 514: ROUTE: NAVI COMPLETE TURN /5/12 ------------------------------------ THIS IS INSTRUCTION TO CHANGE STEERING MODE. THIS ALERT IS GENERATED IF THERE ARE NOT SUFFICIENT SENSORS AVAILABLE TO CONTINUE TRACK MODE AFTER TURN. Alert number 515: CONFLICT-NAVI COMPL. TURN /5/12 ------------------------------------ THIS IS INSTRUCTION TO CHANGE... - Page 462 30. Alerts Alert number 458: ROUTE: LAST WPT APPROACH /1/8 ------------------------------------ FINAL WAYPOINT OF THE ROUTE IS REACHED. LEAVE NAVI MODE BEFORE ACKNOWLEDGED ALERT. Alert number 460: PILOT: ROT WILL BE EXCEEDED /6/13 ------------------------------------ THE RADIUS SENT TO AUTOPILOT IS EXCEEDING THE MAXIMUM LIMIT FOR TURNRATE.
- Page 463 30. Alerts Alert number 476: ROUTE: NEEDS LOG SENSOR /3/10 ------------------------------------ THIS IS A WARNING THAT YOU ARE USING ROUTE STEERING WITH ONE POSITION DEVICE AND WITHOUT ANY LOG DEVICE. VERIFY AND SELECT SENSORS IN'SENSORS' Alert number 480: AUTOPILOT RECEIVE ERROR /5/12 ------------------------------------ AUTOPILOT AND ECDIS CANNOT COMMUNICATE...
-
Page 464: Steering Alerts With Tokyo Keiki Autopilot Pr-6000
30. Alerts Alert number 512: USE NFU RUDDER CONTROL /3/10 ------------------------------------ RUDDER SERVO UNIT CANNOT BE CONTROLLED BY YOKOGAWA STEERING CONTROL UNIT, THIS ALERT IS GENERATED TO CHANGE NON FOLLOW UP CONTROL OF RUDDER(S). FIRST CHANGE USING SYSTEM SELECTOR SWITCH FROM "FU" TO "NFU" AND THEN USE NON-FOLLOW UP STEERING LEVER TO CONTROL RUDDER(S). - Page 465 30. Alerts Alert number 456: ROUTE: WPT APPROACH ERROR ------------------------------------ 'TIME TO WOP' HAS CHANGED SINCE 'WPT APPROACH' ALERT WAS ACKNOWLEDGED, POSSIBLY DUE TO A POSITION JUMP. VERIFY POSITION AND SPEED SENSORS IN 'SENSORS' PAGE Alert number 458: ROUTE: LAST WPT APPROACH /1 or /7 ------------------------------------ FINAL WAYPOINT OF THE ROUTE IS...
- Page 466 30. Alerts Alert number 471: RC/NAV-TC STOP - USE AUTO /4/11 ------------------------------------ ECDIS AND TOKYO KEIKI AUTOPILOT CANNOT PERFORM TRACK STEERING MODE. FIRST CHANGE MODE FROM "RC" TO "AUTO" THEN CHECK THAT PRECONDITIONS FOR ROUTE STEERING ARE FULFILLED. Alert number 475: ROUTE: NEEDS FILTER ON /3/10 ------------------------------------...
- Page 467 30. Alerts Alert number 492: ROUTE: NEEDS DIFF POS. /5/12 ------------------------------------ 'GoAW' MODE CANNOT CONTINUE WITHOUT A HIGH-PRECISION POSITION SENSOR. STEERING MODE IS AUTOMATICALLY CHANGED TO"GoSEA" WITH ALERT 489: ROUTE: CHG TO GoSEA Alert number 497: ROUTE: STOP-SENSOR FAIL ------------------------------------ GYRO, SPEED AND/OR POSITION DATA IS NOT RECEIVED CORRECTLY.
- Page 468 30. Alerts Alert number 511: ROUTE:AUTO RESUME DISABLE ------------------------------------ IF ALERT 471 HAS BEEN GENERATED AND LATER CONDITION FOR ALERT 471 DISAPPEARS WITHOUT CHANGING STEERING MODE FROM "RC" TO "AUTO" OR "HAND". FIRST CHANGE STEERING MODE TO "AUTO" OR "HAND" AND CHECK THAT PRECONDITIONS FOR ROUTE STEERING ARE FULFILLED.
-
Page 469: Radar Overlay Related Alerts
30. Alerts Alert number 519: TRACKPILOT: XTE COMP. LIM /5/12 ------------------------------------ TRACK CONTROL SYSTEM IS UNABLE TO GET VESSEL TO APPROACH THE TRACK. ALERT IS TRIGGERED IF VESSEL IS OUTSIDE CHANNEL LIMIT AND IF CROSS TRACK ERROR IS STILL INCREASING. 30.12.7 Radar overlay related alerts Alert number 100: RADOV NO HEADLINE... - Page 470 30. Alerts Alert number 107: LAN RADAR DLL FAILURE 6/13 ------------------------------------ FAILURE TO ESTABLISH LAN CONNECTION FOR RADAR FEATURES BETWEEN ECDIS PROCESSOR AND RADAR PROCESSOR. RESTART ECDIS AND RADAR. REINSTALL ECDIS SW. IF NECESSARY. Alert number 109: RADOV NO ECHO DATA 6/13 ------------------------------------ NO RADAR VIDEO AVAILABLE.
- Page 471 30. Alerts Alert number 207: LAN RADAR DLL FAILURE 6/13 ------------------------------------ FAILURE TO ESTABLISH LAN CONNECTION FOR RADAR FEATURES BETWEEN ECDIS PROCESSOR AND RADAR PROCESSOR. RESTART ECDIS AND RADAR. REINSTALL ECDIS SW. IF NECESSARY. Alert number 209: RADOV NO ECHO DATA 6/13 ------------------------------------ NO RADAR VIDEO AVAILABLE.
- Page 472 30. Alerts Alert number 157: LAN RADAR DLL FAILURE 6/13 ------------------------------------ FAILURE TO ESTABLISH LAN CONNECTION FOR RADAR FEATURES BETWEEN ECDIS PROCESSOR AND RADAR PROCESSOR. RESTART ECDIS AND RADAR. REINSTALL ECDIS SW. IF NECESSARY. Alert number 159: RADOV NO ECHO DATA 6/13 ------------------------------------ NO RADAR VIDEO AVAILABLE.
-
Page 473: External Sensor Related Alerts
30. Alerts Alert number 257: LAN RADAR DLL FAILURE 6/13 ------------------------------------ FAILURE TO ESTABLISH LAN CONNECTION FOR RADAR FEATURES BETWEEN ECDIS PROCESSOR AND RADAR PROCESSOR. RESTART ECDIS AND RADAR. REINSTALL ECDIS SW. IF NECESSARY. Alert number 259: RADOV NO ECHO DATA 6/13 ------------------------------------ NO RADAR VIDEO AVAILABLE. -
Page 474: Retriggered Alarms
30. Alerts 30.12.9 Retriggered alarms Retriggered alarm/alert is used together with route steering. If there are some changes in the sensors connected to TCS that may affect route steering, a retriggered alarm occurs. These "reminder" alarms can be: • Lost of heading in autopilot •... -
Page 475: Maintenance And Troubleshooting
Interval Check point Check and measures Remarks When needed FURUNO-supplied Dust or dirt may be removed from the cabinet Do not use chemical- LCD monitor and with a soft cloth. Water-diluted mild detergent based cleaners to clean processor unit may be used if desired. -
Page 476: How To Replace The Fuse
31. Maintenance and Troubleshooting 31.2 How to Replace the Fuse The 5A fuse located at the back of the processor unit protects the system from overcurrent and internal fault. If the power cannot be turned on, check if the fuse has blown. If it has blown, find out the cause before replacing the fuse. If it blows again after replacement, contact your dealer for advice. -
Page 477: Troubleshooting
31. Maintenance and Troubleshooting 31.4 Troubleshooting The troubleshooting table below provides common faults and the remedy with which to restore normal operation. If you cannot restore normal operation do not check inside the equipment - there are no operator-serviceable parts inside. - Page 478 31. Maintenance and Troubleshooting Troubleshooting (continued from previous page) If… then… Remedy ARCS chart cannot be displayed • ARCS display mode is not • Activate ARCS charts display activated. mode: Open Chart menu and select Activate ARCS Charts from the menu. •...
-
Page 479: Keyboard Test
31. Maintenance and Troubleshooting 31.5 Keyboard Test In addition to the color calibration tests mentioned in Chapter 28, the ECDIS provides a keyboard test that the operator may use to check the keyboard of the Control Unit RCU-018 and the hot keys of the Control Unit RCU- 015. -
Page 480: Consumable Parts
Appendix 1: Symbols and Abbreviations 6. Click the Control Head button to show the control head-checking screen. 7. Push each key, mouse button and scrollwheel. The perimeter of the on-screen key, button or scrollwheel blackens if the pushed item is functioning normally. (For the Control Unit RCU-015, push the hot keys. Their on-screen location is in the Control Head window.) 8. -
Page 481: Appendix 1: Symbols And Abbreviations
Appendix 1: Symbols and Abbreviations A1.1 Symbols IEC 62288 Symbol name and description Symbol graphic(s) reference 1.1 a Own ship – true scaled outline This can be displayed when based on user selection either beam width or length is more than 6 mm 1.1 b Own ship –... - Page 482 Appendix 1: Symbols and Abbreviations 1.6 d Path predictor (Only for own ship) 1.7 a Past track System past track is indicated by thick line. Raw sensor primary past track is indicated by thin line. Raw sensor secondary past track is indicated by grey thin line.
- Page 483 Appendix 1: Symbols and Abbreviations Sleeping AIS targets Orientation is towards heading (or COG if heading unknown). If both heading and COG are unknown the orientation is toward top of display 2.5 a Activated AIS targets Activated target may show name or call sign Orientation is towards heading (or COG if heading unknown).
- Page 484 Appendix 1: Symbols and Abbreviations 2.8 a Velocity vectors - Radar target - AIS target 2.8 b Velocity vectors – time increments - Radar target - AIS target 2.8 d Velocity vectors – path predictor Sarah J Sarah J AP-4...
- Page 485 Appendix 1: Symbols and Abbreviations Target past positions 2.10 AIS aid to navigation (ATON) Real ATON is without "V" and visual ATON is with "V" An ATON in off position is red 2.11 AIS search and rescue transmitter - SART AP-5...
- Page 486 Appendix 1: Symbols and Abbreviations 2.12 Selected targets 2.13 Lost targets Lost target symbol is red and it flash until acknowledged 3.1 a Waypoint Next waypoint AP-6...
- Page 487 Appendix 1: Symbols and Abbreviations 3.1 b Routes - Monitor Monitored route leg lines are dashed Leg lines may indicate planned speed and 153T bearing. 15kn 136T 15kn 089T 10kn 3.1c Routes - Planned 133T Planned route leg lines are dotted 15kn Leg lines may indicate planned speed and bearing.
- Page 488 Appendix 1: Symbols and Abbreviations Line of position Abbreviation is LOP. Label TPL is used to indicate measurement transferred by dead reckoning. Tidal stream User defined tidal stream symbols are available as part of UserChart. Actual tidal stream use solid vector and predicted tidal stream use dashed vector.
- Page 489 Appendix 1: Symbols and Abbreviations Event marker Event markers indicate events recorded into the Voyage record. Man over board event has label MOB. User cursor Electronic bearing line (EBL) Second example show with range marker. Variable range marker (VRM) Range rings Parallel index lines AP-9...
-
Page 490: A1.2 Abbreviations
Appendix 1: Symbols and Abbreviations A1.2 Abbreviations Abbreviation Meaning Acknowledge Acquire Activate Automatic Identification System Antenna Autopilot ARCS Admiralty Raster Chart System AUTO Automatic AVAIL Available Acquisition zone Bow Crossing Range Bow Crossing Time Bearing BRILL Brilliance Calibrate CALC Calculated CCRP Consistent Common Reference Point CCRS... - Page 491 Appendix 1: Symbols and Abbreviations Abbreviation Meaning Estimated Time Of Departure External FILT Filter / Filtered Great Circle Ground Global Positioning System Guard Zone Heading Heading Line High Speed Craft Integrated Bridge System Identification Integrated Navigation System Latitude / Longitude Latitude Limit Longitude...
- Page 492 Appendix 1: Symbols and Abbreviations Abbreviation Meaning Rate Of Turn Receive South IHO Special publication 57 SART Search And Rescue Transponder Transversal Speed Anti Clutter Sea SENC System ENC Speed Over the Ground Speed STAB Stabilized STBD Starboard Standard Speed Through the Water Symbol True TCPA...
-
Page 493: Appendix 2: Iho Ecdis Chart 1
Appendix 2: IHO ECDIS Chart 1 International Hydrographic Organization (IHO) has published a set of charts where you can find examples of symbology used in S57 charts. You can study them by using the "Info/Help" feature and by switching different layers ON and OFF in the Chart Display dialog box. - Page 494 Appendix 2: IHO ECDIS Chart 1 Information about the chart display 1 Information about the chart display 2 AP-14...
- Page 495 Appendix 2: IHO ECDIS Chart 1 Nature and Man-made features Port features AP-15...
- Page 496 Appendix 2: IHO ECDIS Chart 1 Depths, Currents, etc. Seabed, Obstructions, Pipelines, etc. AP-16...
- Page 497 Appendix 2: IHO ECDIS Chart 1 Traffic routes Special areas AP-17...
- Page 498 Appendix 2: IHO ECDIS Chart 1 Aids and Services Buoys and Beacons AP-18...
- Page 499 Appendix 2: IHO ECDIS Chart 1 Topmarks Color test diagram AP-19...
- Page 500 Appendix 2: IHO ECDIS Chart 1 Mariners’ navigational symbols AP-20...
-
Page 501: Appendix 3: Interpreting S57 Charts
Appendix 3: Interpreting S57 Charts The following examples give you a short introduction to the features of S57 charts. Paper chart or simplified symbols Two color or multi-color depth AP-21... - Page 502 Appendix 3: Interpreting S57 Charts Plain or symbolized boundaries Limited or full light sectors AP-22...
- Page 503 Appendix 3: Interpreting S57 Charts Shallow, safety and deep contours Shallow = 2m, Safety = 5m and Deep = 10m Shallow = 5m, Safety = 10m and Deep = 20m Safety depth = 6m Safety depth = 10m AP-23...
- Page 504 Appendix 3: Interpreting S57 Charts Shallow pattern Items on Standard page of Chart Display dialog box Unknown object or presentation Chart data coverage AP-24...
- Page 505 Appendix 3: Interpreting S57 Charts Land features Water and seabed features Traffic routes AP-25...
- Page 506 Appendix 3: Interpreting S57 Charts Cautionary areas Information areas Buoys and beacons Lights AP-26...
- Page 507 Appendix 3: Interpreting S57 Charts Fog signals Radars Services AP-27...
- Page 508 Appendix 3: Interpreting S57 Charts Items on Other page in Chart Display dialog box Information about chart data Land features Soundings AP-28...
- Page 509 Appendix 3: Interpreting S57 Charts Depth contours, current magnetic Seabed and obstructions Services and small craft facilities AP-29...
- Page 510 Appendix 3: Interpreting S57 Charts Special areas Additional information available Important text AP-30...
- Page 511 Appendix 3: Interpreting S57 Charts Text on Other page in Chart Display dialog box Names for position reporting Light descriptions Nature of seabed AP-31...
- Page 512 Appendix 3: Interpreting S57 Charts Geographic names, etc. Swept depths, magnetics Berth and anchorage numbers AP-32...
-
Page 513: Appendix 4: C-Map Cm-93/3 Charts
Appendix 4: C-MAP CM-93/3 Charts A4.1 C-MAP Cartographic Service Your ECDIS system has the capability of using and displaying the latest CMAP CM-93/3 worldwide vector chart database. These charts are fully compliant with the latest IHO S-57 3.1 specifications. In order to prepare the system for use with the C-MAP CM-93/3 database, there are a number of things that must be done. -
Page 514: A4.2 Chart Subscription Service
A4.2.1 C-MAP service There are three different services available through C-MAP Cartographic service that can be used in FURUNO ECDIS FEA-2x07. Two of them are using CM-93/3 format. These data sets contain two databases: CM-ENC (SENC delivery), Official Electronic Navigational Charts distributed by C-MAP on DVD. -
Page 515: A4.2.3 Cm-Enc Service (Senc Delivery
Appendix 4: C-MAP CM-93/3 Charts A4.2.3 CM-ENC service (SENC delivery) Chart data distributed through the service is S57 ed.3.0 or ed. 3.1 coded ENC in CM-ENC format. When using charts loaded and updated using CM-ENC service, on ECDIS there are no indications at the top right corner. -
Page 516: A4.2.4 Renc Service
Appendix 4: C-MAP CM-93/3 Charts A4.2.4 RENC service RENC service produced by Primer or IC-ENC is considered to legally fulfil SOLAS requirements as primary aid of navigation. National Hydrographic Organization (NHO) may have arranged similar subscription service as RENC on its own waters. Chart data distributed through the service is S57 ed.3.0 or ed. -
Page 517: A4.2.5 Cm-93/3 Prof, Cm-93/3 Prof+ And Cm-93/2 Services
Appendix 4: C-MAP CM-93/3 Charts A4.2.5 CM-93/3 Prof, CM-93/3 Prof+ and CM-93/2 services When using any of mentioned above you will always have indication "No ENC Available" at the top right corner of ECDIS. If there is indication "No ENC Available" you have to refer paper charts in navigation. (WT) AP-37... -
Page 518: A4.3 Cm93/3 Chart Display
Appendix 4: C-MAP CM-93/3 Charts A4.3 CM93/3 Chart Display A4.3.1 Introduction CM93/3 charts are vector charts displayed together with ENC (S57) and CM93/2 charts. These charts have the priority order shown below. 1. CM- ENC 2. CM93/3 Prof and CM93/3 Prof+ 3. -
Page 519: A4.3.2 How To Select Cm93/3 Chart Material To Use
Appendix 4: C-MAP CM-93/3 Charts A4.3.2 How to select CM93/3 chart material to use Do the procedure below to display CM93/3 charts in the ARCS mode. 1. Open the Chart menu and select Activate S57 chart. 2. Select Ignore Scale (use same scale as used on previously loaded CM93/3 chart) or Sync Scale (use scale currently used for ARCS chart). - Page 520 Appendix 4: C-MAP CM-93/3 Charts 289.0 ° HDG (MAN) SPD (MAN) 0.0kn (MAN) 0.0kn 289.0 ° COG (MAN) SOG (MAN) 0.0kn RENC SENC C-Map ° 03.400'N 1.453 NM ° ° 58.372'E 352.0 1. Source of Chart Catalogue • CD: Display charts available in a named "CD-ROM". •...
- Page 521 Appendix 4: C-MAP CM-93/3 Charts 5. The chart limit boxes are color-coded as follows: Green The chart is available for use in SENC format. If the source of the chart is an RENC then the chart is also up-to-date. If the source of the chart is something other than an RENC, then all loaded updates are included into the SENC.
-
Page 522: A4.3.4 Chart Catalogue Of C-Map Charts
Appendix 4: C-MAP CM-93/3 Charts How to look for charts around your ship You can use either true motion or relative motion. In the true motion mode, your ship moves until it reaches the true motion reset borderline, where it jumps back to an opposite position on the screen based on ship’s course. In the relative motion mode, your ship stays in a fixed position, while the chart moves on screen. -
Page 523: A4.4 How To Manage C-Map Charts
Appendix 4: C-MAP CM-93/3 Charts 2. View Filters • Name: Display also cell names in graphical coverage display. • Permit: Display only charts for which you have permit. • RENC Cancelled Charts: Display charts that are cancelled in an RENC. •... -
Page 524: A4.4.3 System Id For C-Map
Appendix 4: C-MAP CM-93/3 Charts A4.4.3 System ID for C-MAP Each ECDIS has individual eToken connected to USB. Find eToken ID in the following sequence: Menu → Chart Menu → C-MAP Ed3 → Licenses It is indicated as System ID. A4.5 CM93/3 Database There are three different CM93/3 Databases that can be loaded into ECDIS: •... -
Page 525: A4.5.2 How To Use Multiple Databases
Appendix 4: C-MAP CM-93/3 Charts 4. You can see loaded database version and issue date. A4.5.2 How to use multiple databases It is possible to use CM93/3 Professional, CM93/3 Professional+ and CM-ENC databases at the same time at the same workstation. 1. -
Page 526: A4.6 License Of Cm93/3
Appendix 4: C-MAP CM-93/3 Charts You can see loaded database version and issue date. Above is an example where CM-ENC and CM93/3 Professional + databases are loaded into ECDIS. A4.6 License of CM93/3 To view charts of C-Map database(s), you need to load license for database. For each database (CM93/3 Professional, CM93/3 Professional + and CM-ENC) C-Map generates own license. - Page 527 Appendix 4: C-MAP CM-93/3 Charts 3. Select desired Hydrographic Office. First open sub folder by clicking + sign, then double click desired charts in left hand side list box. Selected charts are shown in list box right hand side. 4. Enter desired expiry date in "Add expired at". Note that you have to overwrite existing date by entering the whole date.
-
Page 528: A4.6.2 How To Add License From File
Appendix 4: C-MAP CM-93/3 Charts A4.6.2 How to add license from file To get access to CM93/3 chart data base, you have to enter a code that is received from C-Map directly or through Chart agent. The code defines coverage of charts you can display on ECDIS. To enter code do as follows: 1. - Page 529 Appendix 4: C-MAP CM-93/3 Charts 5. Click YES button. Now reading code. 6. Successfully loaded code will be indicated with following dialog box. 7. Click Close button. If the above dialog box appears it indicates that there is mismatch between chart database and password.usr. Check that you have password.usr that is delivered to you to be used together with CM-93/3 professional CD- ROM.
-
Page 530: A4.6.3 How To Add License Manually
Appendix 4: C-MAP CM-93/3 Charts A4.6.3 How to add license manually If you receive license as a "License string", you can enter this string manually into ECDIS. To enter code, do as follows: 1. Menu -> Chart Menu -> C-MAP Ed3 -> Licenses. 2. -
Page 531: A4.6.4 How To Renew A License
Appendix 4: C-MAP CM-93/3 Charts A4.6.4 How to renew a license As an early warning, a following dialog box appears to remind you expiration of C-Map license. This indication is shown 14 days before expiration. Expiry date of license can be seen in License Adm. Dialog box. In this case expiry of license takes place end of February. -
Page 532: A4.7 How To Keep Charts Up To Date
Appendix 4: C-MAP CM-93/3 Charts A4.7 How to Keep Charts up to Date During subscription time of period, you will receive CM-93/3 Professional CD-ROM onboard three times. To keep up-to-date between CD issuing period, you can use Real Time Updating service. ECDIS users do not have possibility to connect to the internet directly from the ECDIS. - Page 533 Appendix 4: C-MAP CM-93/3 Charts 3. Click the Create button then select the drive where to save the Chart Update Order file. 4. When Chart Update Order file is generated and saved to destination, the following dialog box appears: 5. Click the OK button. Update order file to address updates@C-MAP.no 6.
-
Page 534: A4.7.2 How To Load Chart Updates From The File
Appendix 4: C-MAP CM-93/3 Charts A4.7.2 How to load chart updates from the file When you have received an update file via e-mail, then you can load it to ECDIS. 1. Open the Chart menu and select C-MAP Ed 3 in the menu. Select Update Charts in C-MAP Ed 3 menu and Apply Updates from e-mail in Update charts menu. -
Page 535: A4.7.3 How To Review Chart Updates
Appendix 4: C-MAP CM-93/3 Charts 4. When completed, the following dialog box appears. Click the OK button. A4.7.3 How to review chart updates You can see a list of changes for every updated chart as follows: 1. Open the Chart menu and select C-MAP Ed 3 in the menu. Select Update Charts in C-MAP Ed 3 menu and Apply Updates from e-mail in Update charts menu. - Page 536 Appendix 4: C-MAP CM-93/3 Charts 3. Select from the list shown below. 4. Select a chart from the list. 5. Click the X button. 6. In the RTU dialog box, click the X button. AP-56...
-
Page 537: A4.7.4 How To View Update Status Of Cm93/3 Charts
Appendix 4: C-MAP CM-93/3 Charts A4.7.4 How to view update status of CM93/3 charts 1. Open the Chart menu and select C-Map Ed 3 from the menu. Select C-Map Update Status in C-Map Ed. 3 menu. [Chart Menu] 2. C-Map Database Update Status dialog appears. The Following information is available: - Database version number (ENC version 227) - Date of Update file processed (UPD 20081112) for database above using RTU... -
Page 538: A4.7.5 How To View Update History Of Cm93/3 Charts
Appendix 4: C-MAP CM-93/3 Charts A4.7.5 How to view update history of CM93/3 charts 1. Open the Chart menu and select C-Map Ed 3 from the menu. Select C-Map Update Status in C-Map Ed. 3 menu. [Chart Menu] 2. C-Map Database Update history viewer appears. The following information is available: - Loading date of Database with version number (ENC BASE version 227, date) - Date of Update file processed (UPD) for database above using RTU... -
Page 539: A4.7.6 How To Check Database Signature
Appendix 4: C-MAP CM-93/3 Charts A4.7.6 How to check database signature To check database signature, do as follows: 1. Open the Chart menu and select C-MAP Ed 3 in the menu. Select Update Charts in C-MAP Ed 3 menu and Apply Updates from e-mail in Update charts menu. -
Page 540: A4.8 How To Remove Cm93/3 Charts
Appendix 4: C-MAP CM-93/3 Charts A4.8 How to Remove CM93/3 Charts You can remove CM93/3 charts from ECDIS using Unregister. This will remove license and entire database from ECDIS. 1. Open the Chart menu and select C-MAP Ed 3 from the menu. Select Load and register for use from the C-MAP Ed 3 menu. -
Page 541: A4.9 Use Of Dynamic Licensing
Appendix 4: C-MAP CM-93/3 Charts A4.9 Use of Dynamic Licensing A4.9.1 Introduction Dynamic licensing service is a user friendly and cost-effective method for licensing ENC charts in C-MAP SENC format. The charts are viewed on credit which is specified in the agreement between end user and Jeppesen. The agreement also implies specification of chart collection within the limits of which the end user plans to navigate. - Page 542 Appendix 4: C-MAP CM-93/3 Charts First time activation Sending request to C-Map: To activate Dynamic licensing first time in ECDIS, proceed as follows: 1. Select Chart Menu -> C-Map Ed 3 -> Update charts -> Create Update e-mail to show the C-Map Chart Update dialog box.
- Page 543 Appendix 4: C-MAP CM-93/3 Charts Receiving reply from C-Map: 1. Insert dynamic license response file(s) (file extension .ans) to some drive. 2. Select Chart Menu -> C-Map Ed 3 -> Update charts -> Apply Updates from e-mail. 3. Select Apply Chart Update from Files. 4.
- Page 544 Appendix 4: C-MAP CM-93/3 Charts 6. Click Apply Updates. 7. The message Chart Update succeeded if the update was successful. 8. Click OK to finish. How to view status of dynamic licensing In ECDIS there is a catalogue with some information available to view dynamic license information. 1.
- Page 545 Appendix 4: C-MAP CM-93/3 Charts 4. Uncheck Collections check box (if needed). Then all charts in every collection that have been activated for DL are displayed in frame view window (on the left). 5. In case Reported or Not Reported charts exist, charts can be from all activated collections and they are displayed in expansion part.
- Page 546 Appendix 4: C-MAP CM-93/3 Charts 14. Below is an example of Dynamic License Info window. How to deactivate DL in ECDIS You can deactivate (or activate again) DL in use if you don’t want that ECDIS opens any new charts in your collection(s).
-
Page 547: Appendix 5: C-Map Cm-93/2 Charts
Appendix 5: C-MAP CM-93/2 Charts A5.1 C-MAP Charts A5.1.1 Introduction This electronic chart system is also compatible with C-MAP vector chart format CM-93 charts, available from C- MAP Norway A/S. This material is used like Hydrographic Offices S57ed3 charts, but it doesn't have ENC status as defined by IMO, IHO and IEC and thus it cannot be used to replace paper charts. -
Page 548: A5.2 How To Manage C-Map Charts
Appendix 5: C-MAP CM-93/2 Charts A5.2 How to Manage C-MAP charts A5.2.1 Licensing system used by the C-MAP The licensing system used with C-MAP is based on serial numbered CD-ROMs and authorisation codes received from C-MAP Norway A/S. You select either required C-MAP areas or zones and your electronic chart system generates a operator code based on your selection, the serial number of the serial numbered C-MAP CD-ROM and the hardware identifier of your electronic chart system. - Page 549 Appendix 5: C-MAP CM-93/2 Charts How to load serial number of CD-ROM Each CD-ROM has an individual serial number that is used to identify the operator of C-MAP charts. In order to load the serial number into the ECDIS, do the following: 1.
- Page 550 Appendix 5: C-MAP CM-93/2 Charts How to define subscription by zones The contents of the CD-ROM are divided into nine zones (1/0 - 9/0) and each zone has been divided in various numbers of areas (1/1 - 1/16…9/1 - 9/2). A various number of charts are included into each area. You can specify the charts you want to have in your chart folio either by zones or by areas.
- Page 551 Appendix 5: C-MAP CM-93/2 Charts How to define subscription by areas The contents of a CD-ROM are divided into nine zones (1/0 - 9/0) and each zones has divided various number of areas (1/1 - 1/16 … 9/1 - 9/2). The various number of charts are included by Area. You can define a chart you would like to have in your chart folio either by zones or by areas.
- Page 552 Appendix 5: C-MAP CM-93/2 Charts How to enter authorisation code An authorisation code allows you to define your subscription to C-MAP. Based on your operator code you receive an authorisation code from C-MAP. You have to enter this string into the ECDIS, following the procedure below. 1.
-
Page 553: A5.2.5 How To Load C-Map Charts From A Cd-Rom Into The System
Appendix 5: C-MAP CM-93/2 Charts A5.2.5 How to load C-MAP charts from a CD-ROM into the system When you load C-MAP charts by CD-ROM catalogue, the system first loads a CD-ROM catalogue, which stores certain information into your hard disk such as cells ID, their position and edition number, from your LAN (Local Area Network) connection, floppy disk or CD-ROM. - Page 554 Appendix 5: C-MAP CM-93/2 Charts If an error is detected during conversion from ENC to SENC, the following window appears. To find the reason click the Details button. When conversion is completed, the following window appears. How to interpret load or update charts from loaded CD-ROM window 1.
- Page 555 Appendix 5: C-MAP CM-93/2 Charts 3. In the Load Selector field, you can select how to pick desired charts from the list: • Name: ECDIS will display chart names on graphical presentation if selected. • Permit: ECDIS will highlight the charts which are available in the CD-ROM and for which you have permits.
- Page 556 Appendix 5: C-MAP CM-93/2 Charts How to display load history of CD-ROM You can view what is loaded from a CD-ROM using the Load History in Load or Update Charts from CD-ROM. 1. Spin the scrollwheel to show Menu/Info/Chart Menu in the mouse functions area then push the right mouse button.
-
Page 557: A5.2.6 Catalogue Of S57 Cells With C-Map Charts
Appendix 5: C-MAP CM-93/2 Charts A5.2.6 Catalogue of S57 cells with C-MAP charts A S57 catalogue is used to view your cells stored into your hard disk or named "CD-ROM catalogues". You view limits of cells in the S57 catalogue window. It is possible to pick any cell to see information for it (cell, update’s number) by going over its limit with the cursor. - Page 558 Appendix 5: C-MAP CM-93/2 Charts 5. The chart limit boxes are color-coded as follows: Green The chart is available for use in SENC format. If the source of the chart is an RENC then the chart is also up-to-date. If the source of the chart is something other than an RENC, then all loaded updates are included into the SENC.
-
Page 559: A5.2.7 How To Group S57 Chart Cells
Appendix 5: C-MAP CM-93/2 Charts A5.2.7 How to group S57 chart cells You can define groups of S57 charts. This means you can collect related charts, for example, all cells that cover a route from Liverpool to New York or all cells available from a National Hydrographic Office. You can make a group and define charts included to group using either "Chart Catalogue"... - Page 560 Appendix 5: C-MAP CM-93/2 Charts 5. Press the Add Frame button. 60 03.400'N 1.453 NM 024 58.372'E 352.0 6. Use the trackball to define frame then push the left mouse button. 60 03.400'N 1.453 NM 024 58.372'E 352.0 7. Click the Done button. AP-80...
- Page 561 Appendix 5: C-MAP CM-93/2 Charts 8. Press the Close Edit button to finish. (POSN) 60 03.400'N 1.453 NM 024 58.372'E 352.0 9. Select the group to load. 60 03.400'N 1.453 NM 024 58.372'E 352.0 10. Press the Load button to load chart. AP-81...
- Page 562 Appendix 5: C-MAP CM-93/2 Charts How to group S57 cells with Chart catalogue window Chart Catalogue can be used to define a group as follows: 1. Select "Chart Catalogue" from the Chart menu. HDG (MAN) 289.0° SPD (MAN) 0.0kn (MAN) 0.0kn COG (MAN) 289.0°...
- Page 563 Appendix 5: C-MAP CM-93/2 Charts 4. Press the Add Frame button. HDG (MAN) 289.0° SPD (MAN) 0.0kn (MAN) 0.0kn COG (MAN) 289.0° SOG (MAN) 0.0kn RENC SENC C-Map ° 03.400'N 1.453 NM ° ° 58.372'E 352.0 5. Define frame using left mouse button in "Select" mode then click the Done button. 6.
- Page 564 Appendix 5: C-MAP CM-93/2 Charts How to remove S57 chart cells from a group You can remove chart cells from a defined group as follows: HDG (MAN) 289.0° SPD (MAN) 0.0kn (MAN) 0.0kn COG (MAN) 289.0° SOG (MAN) 0.0kn RENC SENC C-Map Select “Group”...
- Page 565 Appendix 5: C-MAP CM-93/2 Charts How to delete a group You can delete a defined group as follows: HDG (MAN) 289.0° SPD (MAN) 0.0kn (MAN) 0.0kn COG (MAN) 289.0° SOG (MAN) 0.0kn RENC SENC C-Map Use Remove button to delete a group. °...
-
Page 566: A5.3 Automatic Display Until Setting
Appendix 5: C-MAP CM-93/2 Charts A5.3 Automatic Display Until Setting Display data may be set to system data automatically. 1. Open the Chart menu, select System and SENC Convert Settings to show the following window. 2. Check Automatic Display Until. A5.4 How to Remove C-MAP Charts from the System To remove C-MAP charts from the system, do the following: 1. -
Page 567: A5.5 How To Display Status And Date Dependency Of S57 Chart Cells And Their Updates
Appendix 5: C-MAP CM-93/2 Charts A5.5 How to Display Status and Date Dependency of S57 Chart Cells and their Updates When you load S57 chart cell(s) and/or their updates, the system sets Display Until of S57 chart cell(s) as current date of the system. - Page 568 Appendix 5: C-MAP CM-93/2 Charts This page intentionally left blank. AP-88...
-
Page 569: Appendix 6: How To Backup Routes
Appendix 6: How to Backup Routes A6.1 How to Backup and Restore Routes in ASCII Format Sometimes it is useful to save some information about a route as an ASCII text file for use with some other application, or use some ASCII format-generated route in the ECDIS. ECDIS can generate an ASCII text file from a route. -
Page 570: A6.2 How To Export Routes Into An Excel File
Appendix 6: How to Backup Routes A6.2 How to Export Routes into an Excel File Below is an example of how to export waypoints' name and latitude/longitude values to a Microsoft Excel table. 1. Put the cursor on Route in the status bar then click the Plan button to open the Plan Route dialog box. Put the cursor on the triangle in the dialog box, select Backup and Restore from the menu then push the scrollwheel. -
Page 571: A6.3 How To Import Routes From Excel File Into Ecdis
Appendix 6: How to Backup Routes A6.3 How to Import Routes from Excel File into ECDIS Below is an example of how to import waypoints' name and latitude/longitude values from a Microsoft Excel table into ECDIS. Limit the length of waypoint names to eight alphanumeric characters and route names to 30 alphanumeric characters. - Page 572 Appendix 6: How to Backup Routes Below is an example where you can see which fields are from text file and which fields are using default values generated by the ECDIS. Minimum speed (default=0 kn) Steering mode (default=Rhumb line) From text file Channel limit (default=185 m) Mode...
-
Page 573: A6.4 How To Backup And Restore Routes In Orion Pro Weather Route Format
Appendix 6: How to Backup Routes A6.4 How to Backup and Restore Routes in Orion Pro Weather Route Format A6.4.1 How to export a route from ECDIS to Orion Pro To make backup from a route in format, which can then be imported to Orion Pro weather routing program, do the following: 1. -
Page 574: A6.4.2 How To Import A Route From Orion Pro
Appendix 6: How to Backup Routes A6.4.2 How to import a route from Orion Pro To restore a route in format of Orion Pro weather routing program to ECDIS, do the following: 1. Put the cursor on Route in the status bar then click the Plan button to open the Plan Route dialog box. Put the cursor on the triangle in the dialog box, select Backup and Restore from the menu then push the scrollwheel. -
Page 575: Appendix 7: Menu Tree
Appendix 7: Menu Tree Main menu, S57 chart mode Go back DB: Voyage, Danger Targets Ignore Scale [Record] ARCS mode* Sync Scale Go Back Go Back [Chart Menu] Details Log Voyage Log Go back Go Back Voyage Log Danger Target Log Permits Activate S57 Chart Danger Target Log... -
Page 576: Chart Menu, S57 Mode
Appendix 7: Menu Tree Chart menu, S57 mode Go Back Ignore Scale S57 mode Sync Scale [Chart Menu] Go Back Activate ARCS chart [Load and Update Charts] Load and Update Charts Go Back SENC Convert from CDROM Remove Charts Manual C-Map Ed 3 Chart Catalogue Set Chart viewing dates... -
Page 577: Appendix 8: Digital Interface
Appendix 8: Digital Interface A8.1 Data Sentences A8.1.1 Input sentences ACK, ALR, DBT, DPT, DTM, GGA, GLL, GNS, HDT, MTW, MWV, NRX, OSD, RMC, ROT, THS, TTM, VBW, !AIVDM, !AIVDO, VHW, VTG, ZDA A8.1.2 Output sentences ABM, BBM, DTM, GLL, MWV, RTE, SSD, VSD, WPL A8.1.3 Data reception Data is received in serial asynchronous form in accordance with the standard referenced in IEC 61162-2. -
Page 578: A8.1.4 Sentence Structure
Appendix 8: Digital Interface A8.1.4 Sentence structure Input sentences Data used is shown bold italics. ACK - Acknowledge alarm Recipient of sentences: Expected nominal interval of sentences: 60 s Alarm generated if message not received: 130 s ALR - Set alarm state Recipient of sentences: Expected nominal interval of sentences: 60 s Alarm generated if message not received: 130 s... - Page 579 Appendix 8: Digital Interface DPT – Depth Recipient of sentences: Expected nominal interval of sentences: 5 s Alarm generated if message not received: 22 s ±2 s DTM - Datum reference Recipient of sentences: Expected nominal interval of sentences: 15 s Alarm generated if message not received: 60 s ±10 s AP-99...
- Page 580 Appendix 8: Digital Interface GGA - Global positioning system (GPS) fix data Recipient of sentences: Expected nominal interval of sentences: 1 - 5 s Alarm generated if message not received: 22 s ±2 s AP-100...
- Page 581 Appendix 8: Digital Interface GLL - Geographic position - latitude/longitude Recipient of sentences: Expected nominal interval of sentences: 1 - 5 s Alarm generated if message not received: 22 s ±2 s GNS - GNSS fix data Recipient of sentences: Expected nominal interval of sentences: 1 - 5 s Alarm generated if message not received: 22 s ±...
- Page 582 Appendix 8: Digital Interface HDT – Heading, True Recipient of sentences: Expected nominal interval of sentences: 0.2 - 1 s Alarm generated if message not received: 12 s ±2 s MTW - Water temperature Recipient of sentences: Expected nominal interval of sentences: 5 s Alarm generated if message not received: 22 s ±2 s MWV - Wind speed and angle Recipient of sentences:...
- Page 583 Appendix 8: Digital Interface NRX - NAVTEX received data AP-103...
- Page 584 Appendix 8: Digital Interface OSD - Own ship data Recipient of sentences: Expected nominal interval of sentences: 5 s Alarm generated if message not received: 22 s ±2 s ROT - Rate of turn Recipient of sentences: Expected nominal interval of sentences: 1 s Alarm generated if message not received: 12 s ±2 s AP-104...
- Page 585 Appendix 8: Digital Interface RMC - recommended minimum specific GNSS data Recipient of sentences: Expected nominal interval of sentences: 1 - 5 s Alarm generated if message not received: 22 s ±2 s THS - True heading and status Recipient of sentences: Expected nominal interval of sentences: 0.2 - 1 s Alarm generated if message not received: 12 s ±1 s AP-105...
- Page 586 Appendix 8: Digital Interface TTM - Tracked target message AP-106...
- Page 587 Appendix 8: Digital Interface VBW - Dual ground/water speed Recipient of sentences: Expected nominal interval of sentences: 5 s Alarm generated if message not received: 22 s ±2 s !AIVDM – AIS VHF data link message Expected nominal interval between sentences: as specified by IMO for AIS transponder AP-107...
- Page 588 Appendix 8: Digital Interface !AIVDO – UAIS VHF data-link Own-vessel report Expected nominal interval between sentences: as specified by IMO for AIS transponder VHW – Water speed and heading Expected nominal interval of sentences: 1 - 5 s Alarm generated if message not received: 12 s ±2 s AP-108...
- Page 589 Appendix 8: Digital Interface VTG - Course over ground and ground speed Recipient of sentences: Expected nominal interval of sentences: 1 - 5 s Alarm generated if message not received: 22 s ±2 s ZDA - Time and date Recipient of sentences: Expected nominal interval of sentences: 5 s AP-109...
- Page 590 Appendix 8: Digital Interface Output sentences Data used is shown bold italics. ACK – Acknowledge alarm Transmit of sentences: Expected nominal interval of sentences: 30 s ALR - Set alarm state Transmit of sentences: Expected nominal interval of sentences: 30 s ABM - UAIS addressed binary and safety related message Transmit of sentences: Expected nominal interval of sentences: on demand...
- Page 591 Appendix 8: Digital Interface BBM - AIS broadcast binary message Transmit of sentences: Expected nominal interval of sentences: on demand DPT – Depth Transmit of sentences: Expected nominal interval of sentences: 5 s AP-111...
- Page 592 Appendix 8: Digital Interface DTM - Datum reference Transmit of sentences: Expected nominal interval of sentences: 26 s GLL - Geographic position - latitude/longitude Transmit of sentences: Expected nominal interval of sentences: 2 s AP-112...
- Page 593 Appendix 8: Digital Interface MWV - Wind speed and angle Transmit of sentences: Expected nominal interval of sentences: 5 s OSD - Own ship data Transmit of sentences: Expected nominal interval of sentences: 5 s AP-113...
- Page 594 Appendix 8: Digital Interface RTE – Routes Transmit of sentences: Expected nominal interval of sentences: on demand AP-114...
- Page 595 Appendix 8: Digital Interface SSD -AIS ship static data Transmit of sentences: Expected nominal interval of sentences: on demand AP-115...
- Page 596 Appendix 8: Digital Interface VSD - UAIS voyage static data Transmit of sentences: Expected nominal interval of sentences: on demand WPL - Waypoint location Transmit of sentences: Expected nominal interval of sentences: on demand AP-116...
-
Page 597: A8.2 Serial Interface
Appendix 8: Digital Interface A8.2 Serial Interface A8.2.1 Input ports Log, wind, depth and navigation sensors Photo Coupler 330 ohm RD-A HCPL061N RD-B AIS transponder, heading Photo Coupler 82 ohm RD-A HCPL061N RD-B Absolute maximum rating Input Forward current: 50mA Reverse voltage: 3V Output Supply voltage: 7V... -
Page 598: A8.2.2 Input/Output Ports
Appendix 8: Digital Interface A8.2.2 Input/output ports Input port (RD-A, RD-B) Isolated RS485 Transceiver RD-A SP487 RD-B Logical High: A-B> +0.2V Logical Low: A-B< -0.2V Output port (TD-A, TD-B) Isolated RS485 Transceiver TD-A SP487 TD-B Logical High: A-B> +4.0V Logical Low: A-B> -4.0V AP-118... - Page 599 Appendix 9: Parts List and Parts Location A9.1 Parts List FEA-2807/FEA-2107/ FURUNO Model FEA-2107-BB/ Unit Chart Processor Unit EC-1000C Control Unit RCU-018 Control Unit RCU-015 Monitor Unit MU-201CE Monitor Unit MU-231CE ELECTRICAL PARTS LIST Ref.Dwg. Blk.No. 2013/8 SYMBOL PRINTED CIRCUIT B OARD/ REMARKS ASSY.
-
Page 600: Appendix 9: Parts List And Parts Location
Appendix 9: Parts List and Parts Location ELECTRICAL PARTS Model FEA-2807 Unit Monitor Unit MU-231 PRINTED CIRCUIT BOARD Code No. OZP-120-12/15-J06 26P0023 (PSW board) ESSIP33A-1C (AD board) 26P0013 Code No. LQ231U1LW32, 26S0062 Code No. MFB52A-12HA-001, 26S0028 (FAN1) 109P0612H755, 26S0063 (FAN2/FAN3) -
Page 601: A9.2 Parts Location
Appendix 9: Parts List and Parts Location A9.2 Parts Location A9.2.1 Chart processor unit EC-1000C Power Supply (UPF250-AA-BG) Hard Disk* Chassis Fan* MHW2040AC or (AD0812LB-A73GL or MK8050GACY) 109R0812M4071 DVD-ROM Drive (iHAS524-T07), or Floppy DIsc Drive* AC Filter (FD-235HF) (FN 2080-6/06) PWR ON Board (24P0092) Processor Cooler Assy.*... -
Page 602: A9.2.3 Control Unit Rcu-015
Appendix 9: Parts List and Parts Location A9.2.3 Control unit RCU-015 Trackball Assy. (TA4726N) PNL Board (03P9344) A9.2.4 Monitor unit MU-231CE (F62LM-012-K) FAN Drive Board (FAN CONTROLLER) Noise Filter (5220.0123.1) DVI I/F Board Power Supply (FPI NO SW) (HYPERION OBL03131) Display unit MU-231CE, inside rear cover LCD Unit (FLC59UXC8V-04) -
Page 603: A9.2.6 Monitor Unit Mu-201Ce
Appendix 9: Parts List and Parts Location A9.2.5 Monitor unit MU-231 109P0612H755, 26S0063 (Motor fan (FAN2/FAN3), Wind direction: upward) MFB52A-12HA-001 (Motor fan (FAN1), Wind direction: top-left) LQ231U1LW32, OZP-120-12/15-J06 26S0062(LCD) 26P0023 ESSIP33A-1C (AD board) 26P0013 Monitor unit MU-231 A9.2.6 Monitor unit MU-201CE Noise Filter (5220.0123.1) DVI I/F Board... - Page 604 Appendix 9: Parts List and Parts Location A9.2.7 Monitor unit MU-190 MFB52A-12HA-001, 26S0028 (Motor fan (FAN1), Wind direction: top-left) LQ0DDB0094, 26S0048 (Motor fan (FAN4), Wind direction: upward) OZP-120-12/15-J06 LQ190E1LX51, 26S0027(LCD) ESSIP33A-1C 26P0023 (AD board) 26P0013 Monitor unit MU-190 AP-124...
-
Page 605: Appendix 10: Admiralty Information Overlay (Aio
Appendix 10: Admiralty Information Overlay AP10.1 Introduction The Admiralty Information Overlay (AIO) is a digital data set that is designed to be displayed over ENCs in ECDIS to provide additional information to the navigator. The AIO contains all Admiralty Temporary & Preliminary Notices to Mariners (hereafter referred to as T&P NMs) and provides additional preliminary information that is specific to ENCs, such as reported navigational hazards that have been incorporated on paper charts but have not yet been included in ENCs. -
Page 606: Ap10.2.2 How To Install The Aio Data
Appendix 10: Admiralty Information Overlay 1. Copy the AIO permit file (Permit.txt) to a USB flash memory. 2. Set the USB flash memory to the USB port on the EC-1000C. 3. Open the Main menu then select Chart Menu and Chart Permits to show the Chart Permits dialog box. 4. -
Page 607: Ap10.3 How To Show, Hide The Aio
Appendix 10: Admiralty Information Overlay AP10.3 How to Show, Hide the AIO To show the AIO, do the following: 1. Open the Main menu then select Chart Display. Check to show the 2. Click the ► button several times to show the AIO page. Check to show the overlay;... - Page 608 Appendix 10: Admiralty Information Overlay NM area (red) Example of Preliminary NM including EP NMs EP Notice to Mariners (NM) ENC P (EP) NMs contain additional information that is specific to ENCs and cannot be published as a standard Admiralty T&P NM. These NMs are displayed in the same way as T&P NMs – a red polygon with red hatched fill indicates the area affected by the NM.
-
Page 609: Specifications
Processor with Local Area Network (LAN) of ETHERNET type. Display Unit Characteristics Type: FEA-2107: Type MU-201CE, 21.1-inch LCD, Type MU-190, 19-inch LCD FEA-2807: Type MU-231CE, 23.1-inch LCD, Type MU-231, 23.1-inch LCD Pixel: MU-190: 1280x1024 pixel (SXGA) MU-201CE: 1280X1024 pixel (SXGA) - Page 610 FURUNO FEA-2107/2807 Series Others: Own ship position in lat/lon, speed, course, waypoint information, route monitoring Information, chart Information in use, several alarm Information 4. Display Mode True motion north up, True motion, course up, Relative motion north up, Relative motion course up, Relative motion head up Relative motion route up 5.
- Page 611 FURUNO FEA-2107/2807 Series Optional interface - Gyrocompass: analog signal (synchro or step) - Speed log: analog signal (200 p/m) - Navigational echosounder: serial data (IEC 61162-1 DBT) - Wind indicator: serial data (IEC 61162-1 MWV) - Position sensor: serial data - 2 lines of alarm output, alarm output selection 15.
- Page 612 FURUNO FEA-2107/2807 Series This page intentionally left blank. E4122S02E SP-4...
-
Page 613: Index
Index radar overlay ..........30-39 A radar overlay ............23-9 Access server ............18-4 ROT..............19-10 human interface log........18-12 route monitoring..........14-12 log ..............18-11 sensor related..........19-22 troubleshooting ..........18-10 SOG..............19-10 steering calculation...........30-2 EP NM ............AP-126 tracked target............20-6 installation of ..........AP-125 Alerts page ..........13-7, 14-6 no overlay............AP-130 Anchor watch preliminary NM ..........AP-129 activating............25-1... - Page 614 Index Chart legend combined wind, depth and destination window29-7 C-MAP CM-93/2..........67 depth window ..........29-7 raster charts............9-1 drift and radius window ........29-4 vector charts............8-3 ECDIS display as........... 29-15 Chart legend sidebar ..........3-9 fuel consumption window........ 29-8 Chart menu heading window..........
- Page 615 Index information area ..........3-5 E overview.............3-1 EBL..............12-2 palette..............3-4 ECDIS display electronic chart area ...........3-2 sidebar ..............3-6 chart viewing dates...........10-3 user interface............3-4 history of ............10-22 Event recording............24-1 manual update editor ........10-4 manually updated chart objects, F editing properties........10-19 Failed SENC conversions window orange symbols, deleting........10-8 (vector charts) ..........8-20 orange symbols, editing position......10-9...
- Page 616 Index record position modification......16-8 clear ..............23-5 view record page..........16-5 echo average ............ 23-5 echo averaging ..........23-5 O echo overload........... 23-5 Optimization parameters........27-7 echo stretch ............23-5 Orientation ............12-1 error sources ............ 23-7 Other 1 page gain ..............
- Page 617 Index targets page ............9-41 new route creation ..........13-5 tracking page............9-40 other waypoint data in existing route, update status.............9-23 changing .............13-12 updating by active group........9-21 parameters page..........13-9 updating by permit ...........9-20 passage plan report.........13-19 updating manually..........9-22 prepare page .............13-9 WGS shift............9-5 route optimization ........
- Page 618 Index SPD/CRS page............. 19-2 line page............15-11 Speed modes............... 15-2 alert ..............19-10 monitoring mode..........15-6 source............... 19-7 object addition and modification ....15-15 Standard page object deletion..........15-16 raster charts............9-36 object import..........15-16 vector charts............. 8-69 object position in..........15-16 Standby mode ............
- Page 619 Index RENC, authentication ........8-39 RENC, base CD-ROM........8-50 RENC, CD-ROM service.........8-47 RENC, coverage of ..........8-41 RENC, messages..........8-60 RENC, permit loading........8-58 RENC, permit management ......8-44 RENC, permits ..........8-39 RENC, product list........8-39, 8-43 RENC, public key ..........8-45 RENC, service types ........8-40 RENC, subscription types ........8-40 RENC, subscription warnings......8-45 RENC, update CD-ROM .........8-54 RENC, up-to-date status ........8-42...
Need help?
Do you have a question about the FEA-2807 and is the answer not in the manual?
Questions and answers