AEMC PowerPad III 8336 User Manual
3-phase power quality analyzer
Hide thumbs
Also See for PowerPad III 8336:
- Quick start user manual (13 pages) ,
- User manual (4 pages)

Subscribe to Our Youtube Channel
Related Manuals for AEMC PowerPad III 8336


Summary of Contents for AEMC PowerPad III 8336
- Page 1 8336 3-PHASE POWER QUALITY ANALYZER ® PowerPad IMPORTANT WARRANTY NOTE: By registering online within 30 days from the date of purchase, your warranty will be extended to 3 years E N G L I S H User Manual...
- Page 2 Chauvin Arnoux , Inc, AEMC , DataView , AmpFlex , MiniFlex and PowerPad are registered trademarks of AEMC Instruments. ® ® ® ® ®...
- Page 3 Thank you for purchasing a PowerPad III Model 8336 ® For best results from your instrument and for your safety, read the enclosed operating instructions carefully and comply with the precautions for use. These products must be only used by qualified and trained users. WARNING, risk of DANGER! The operator must refer to Useful information or hint to read.
- Page 4 Your instrument is equipped with a NiMH battery. This technology offers several advantages: ● Long battery charge life for a limited volume and weight. ● Possibility of quickly recharging your battery. ● Significantly reduced memory effect: you can recharge your battery even if it is not fully discharged. ●...
-
Page 5: Table Of Contents
TABLE OF CONTENTS 1. BEFORE YOU BEGIN ............................. 7 1.1 RECEIVING YOUR SHIPMENT ..............................7 1.2 ORDERING INFORMATION ............................... 7 1.2.1 ACCESSORIES ................................7 1.2.2 REPLACEMENT PARTS ..............................7 1.3 INSTALLING THE BATTERY ............................... 8 1.4 CHARGING THE BATTERY ................................ 8 1.5 SETTING THE LANGUAGE ................................ - Page 6 4.1.5.1 CURRENT PROBES ............................29 4.1.5.2 VOLTAGE RATIOS ............................... 30 4.1.6 CAPTURE MODE................................31 4.1.6.1 TRANSIENT VOLTAGE THRESHOLDS ....................... 31 4.1.6.2 TRANSIENT CURRENT THRESHOLDS ......................32 4.1.6.3 INRUSH CURRENT THRESHOLDS ........................33 4.1.7 TREND MODE ................................34 4.1.8 ALARM MODE CONFIGURATION ..........................37 4.1.9 ERASING MEMORY ..............................
- Page 7 5.4.3 STARTING AN ALARM CAMPAIGN ..........................71 5.4.4 MANUALLY STOPPING AN ALARM CAMPAIGN ......................72 5.4.5 DISPLAYING A LIST OF ALARM CAMPAIGNS ......................72 5.4.6 LIST OF ALARMS ................................. 73 5.4.7 DELETING ALARM CAMPAIGNS ..........................74 5.4.7.1 DELETING A SINGLE ALARM CAMPAIGN ......................74 5.4.7.2 DELETING ALL ALARM CAMPAIGNS .........................
- Page 8 6.6.2 WAVEFORM ................................105 6.6.3 HARMONICS................................106 6.6.4 POWER ..................................106 6.6.5 ENERGY ..................................107 6.7 DOWNLOADING DATA ................................107 6.7.1 RECORDINGS ................................108 6.7.2 SCREEN SNAPSHOTS .............................. 108 6.7.3 ALARMS ..................................108 6.7.4 TRANSIENTS ................................108 6.7.5 INRUSH ..................................108 6.7.6 EDITING DOWNLOADED DATA ..........................
- Page 9 A.1.4 FOUR-QUADRANT DIAGRAM ........................... 133 A.1.5 MECHANISM FOR TRIGGERING TRANSIENT SENSORS ..................134 A.1.6 CAPTURE CONDITIONS IN INRUSH CURRENT MODE ..................134 GLOSSARY OF TERMS ..........................135 REPAIR AND CALIBRATION .......................... 138 TECHNICAL AND SALES ASSISTANCE ....................... 138 LIMITED WARRANTY ............................. 139 WARRANTY REPAIRS ............................
-
Page 10: Before You Begin
1. BEFORE YOU BEGIN 1.1 RECEIVING YOUR SHIPMENT Make sure the contents shipped are consistent with the packing list. Notify your distributor of any missing items. If the equipment appears damaged, file a claim immediately with the carrier and notify your distributor at once. Save the damaged packing container to substantiate your claim. -
Page 11: Installing The Battery
1.3 INSTALLING THE BATTERY WARNING: ● For safety reasons, replace the battery only with the original replacement model (see § 1.2.2). ● Do not expose the battery to heat exceeding 212°F (100°C). ● Do not short-circuit the battery terminals. ● To eliminate all risk of electric shock, disconnect the power supply cord and measurement leads of the instrument. -
Page 12: Introduction
2. INTRODUCTION 2.1 DESCRIPTION The PowerPad III Model 8336 is a 3-phase network analyzer with a color graphic display and built-in rechargeable ® battery. This instrument can be used to: ● Measure the RMS values, powers, and perturbations on electric distribution networks ●... -
Page 13: Display
2.3 DISPLAY ■ Waveforms (voltages and currents) ■ Frequency Bar Chart (voltages and currents) ■ Inrush Current Function: displays parameters useful for study of the starting of a motor ● Instantaneous current and voltage at the instant designated by the cursor ●... -
Page 14: Overall View
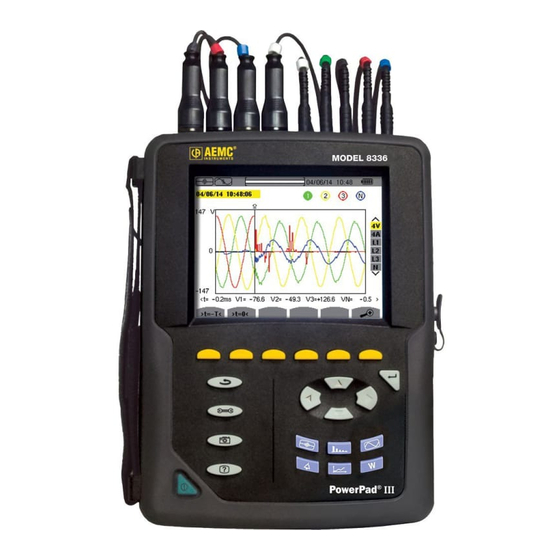
2.5 OVERALL VIEW Figure 2-1 1. Over molded protective case. 2. Color TFT 320 X 240 (1/4 OFT) display with graphic representation of system parameters and measurements. 3. Six (6) function buttons used to modify the display mode. 4. Four (4) function buttons. 5. -
Page 15: On/Off Button
2.6 ON/OFF BUTTON The Model 8336 can operate on either battery or on AC power. Pressing the button powers up the instrument. If the instrument is shut OFF suddenly (line power outage in the absence of the battery) or automatically (battery low), an information message is displayed when it is next started up. -
Page 16: Connection Terminals
3. Values of signals at an instant “t” at the intersection of cursor and the waveforms. The cursor can be moved along the time scale by pressing the ◄ and ► buttons. 4. Measurement selection (refer to § 8). Calculation of DPF, Tan, KF, Φ, UNB, Min, Max, VAR, Harmonics, PST, and DF parameters and the frequency mea- surement can only be performed if voltage or current with a frequency of 40 to 70Hz is applied to the Ch1 voltage input or the A1 current input. -
Page 17: Power Supply
2.9 POWER SUPPLY The battery icon in the top right corner of the screen shows the battery level. The number of bars is proportional to the charge level. Icon Battery Charge Status Battery charged Low battery Battery charging Red bar: Condition of the battery is unknown because it had never been fully charged. The instrument is connected to AC power using the power cord. -
Page 18: Use
3. USE 3.1 START-UP To turn the Model 8336 ON, press the button. The button lights up when initially pressed; it then goes OFF if the power cord is not connected to AC power. During startup, several informational screens appear, displaying data such as the firmware version and serial number of the instrument. -
Page 19: Connection Procedure
E/GND L2/B L1/A L3/C L1/A L2/B L3/C 1000V CAT III 600V CAT IV Figure 3-3 1. Four (4) current input terminals on the top of the instrument to enable the use of current sensors (MN, SR, AmpFlex ® MiniFlex , MR, SL & J93 probes). ®... -
Page 20: Functions
3.4 FUNCTIONS Any screen can be saved (screen snapshot) by pressing the button for three seconds (see § 5.7). You can press the Help button at any time. The Help screen will inform you about the functions and the symbols used for the current display mode. -
Page 21: Configuration
4. CONFIGURATION 4.1 CONFIGURATION (SET-UP MENU) The Configuration button displays the Configuration menu. This menu enables you to configure the instrument. This must be done before each new type of measurement. The configuration settings remain in memory, even after the instrument is turned OFF. -
Page 22: Date/Time
Probes and Ratios Defines the type of current probe to connect (see § 4.1.5) • MN93: 200A • MN193: 100A or 5A (with variable ratio) • SR193: 1000A • SL261: 10A and 100A range • AmpFlex Sensors: 3000A (measures up to 10kA) ®... -
Page 23: Display
4.1.2 DISPLAY 4.1.2.1 BRIGHTNESS The Brightness button initiates a menu that sets the brightness of the display. Figure 4-3 Use the ◄ or ► buttons to change the brightness. To return to the Configuration menu, press 4.1.2.2 COLORS The Colors menu is used to define the colors of the voltage and current traces on the graph. -
Page 24: Display Shutdown
4.1.2.3 DISPLAY SHUTDOWN The Display Status button displays a menu that defines the display shutdown process. Figure 4-5 Use the ▲ and ▼ buttons to choose Automatic or Never. ■ In Automatic mode the display turns OFF automatically after: ● 5 minutes of inactivity when the instrument is powered by the battery and a recording is in progress. ●... -
Page 25: Calculation Methods
4.1.3 CALCULATION METHODS The Calculation Methods menu X defines: ■ Breakdown or no breakdown of the non-active quantities ■ Unit of energy ■ Reference for the level of harmonics of the phases ■ Coefficients of calculation for the K factor ■... -
Page 26: Unit Of Energy
4.1.3.2 UNIT OF ENERGY The Wh menu defines the unit of energy for displayed data. Figure 4-8 Use the up and down arrow buttons to select the unit: ● Wh: watt-hour ● J: joule ● toe (nuclear): nuclear tonne oil equivalent ●... -
Page 27: Phase Harmonic Ratios
The default values (q = 1.7 and e = 0.10) are suitable for most applications. Press to confirm the selection and return to the Configuration menu. NOTE: This setting cannot be modified when the instrument is recording, and/or searching for alarms. 4.1.3.4 PHASE HARMONIC RATIOS The %f-%r Phase Harmonics menu defines the reference for the level of harmonics of the phases. -
Page 28: Electrical Hook-Up
Use the ▲ and ▼ buttons to choose sliding or non-sliding. ● Sliding: The PLT is calculated every 10 minutes. The first value is available 2 hours after the instrument is switched on because it takes 12 values of PST to calculate the PLT. ●... - Page 29 Distribution System Source Split-phase 2-wire (L1 and L2) Split-phase 2-wire 3-phase open star 2-wire Split-phase 3-wire non-grounded neutral Split-phase 3-wire (L1, L2 and N) 3-phase open star 3-wire non-grounded neutral 3-phase high leg delta 3-wire non-grounded neutral 3-phase open high leg delta 3-wire non-grounded neutral Split-phase 4-wire grounded neutral 3-phase open star 4-wire grounded neutral Split-phase 4-wire (L1, L2, N and ground)
- Page 30 Distribution System Source 3-phase star 3-wire 3-phase delta 3-wire 3-phase 3-wire (L1, L2 and L3) A1A2 A2A3 3-phase open delta 3-wire A3A1 Indicates which 2 current sensors will be connected: A1 and A2, or A2 and A3, or A3 and A1. 3-phase open delta 3-wire grounded junction of phases Two-wattmeter method or two-element method or Aron method.
- Page 31 Distribution System Source 3-phase star 4-wire non-grounded neutral 3-phase 4-wire (L1, L2, L3 and N) V1V2 V2V3 V3V1 3-phase open high leg delta 4-wire non-grounded neutral Indicates which voltages will be connected: all 3 (3V) or only 2 (V1 and V2, or V2 and V3, or V3 and V1).
-
Page 32: Probes And Ratios
4.1.5 PROBES AND RATIOS 4.1.5.1 CURRENT PROBES screen defines the current probes and ratios. Figure 4-13 This menu enables you to define ■ Current probes (press A) ■ Current ratios (press V or U, depending on set-up) Press A to define the current probes and ratios. This displays the current probe models detected by the instrument. If a probe is detected but not managed, an error message is displayed. -
Page 33: Voltage Ratios
4.1.5.2 VOLTAGE RATIOS A second screen, V or U (depending on set-up), defines the voltage ratios. Ratios can be different for each channel, or the same for all or some channels. These are phase-to-neutral voltage ratios when there is a neutral (indicated by V)... Figure 4-14 …and phase-to-phase voltage ratios when there is not (indicated by U). -
Page 34: Capture Mode
4.1.6 CAPTURE MODE Capture mode is used to configure the voltage thresholds, the current thresholds of the transient mode, and the current thresholds of the inrush current mode. 4.1.6.1 TRANSIENT VOLTAGE THRESHOLDS The first Thresholds screen, displayed by pressing the V icon (or U, for set-ups without a neutral), configures the voltage thresholds. -
Page 35: Transient Current Thresholds
4.1.6.2 TRANSIENT CURRENT THRESHOLDS A second Thresholds screen, displayed by pressing the A icon, configure the current thresholds (independently of the current sensors detected by the instrument). The thresholds programmed can be the same for all channels or different for some or all of them. Figure 4-17 To change the current thresholds, press . -
Page 36: Inrush Current Thresholds
4.1.6.3 INRUSH CURRENT THRESHOLDS A third Thresholds screen, displayed by pressing the button, defines the inrush current thresholds. This involves setting the triggering threshold and the inrush current capture stopping threshold (the stopping threshold being the triggering threshold less the hysteresis). Figure 4-18 To change the inrush current triggering threshold: ■... -
Page 37: Trend Mode
4.1.7 TREND MODE The instrument has a recording function (activated by the button, see § 5.5), used to record measured and calculated values (Urms, Vrms, Arms, and so on). To display the Trend Mode menu, press to display the Configuration menu, and then select Figure 4-19 The Trend Mode menu consists of two pages. - Page 38 The recordable values are: Unit Designation Urms RMS phase-to-phase voltage DC phase-to-phase voltage Upk+ Maximum peak value of phase-to-phase voltage Upk- Minimum peak value of phase-to-phase voltage Crest (peak) factor of phase-to-phase voltage Uthdf Harmonic distortion of the phase-to-phase voltage with the RMS value of the fundamental as reference Uthdr Harmonic distortion of the phase-to-phase voltage with the total RMS value without DC as reference Vrms...
- Page 39 The last four entries in the preceding table (U-h, V-h, A-h, and S-h) involve the recording of the harmonics of U, V, A, and S. You can select a range of orders of the harmonics to be recorded (between 0 and 50) for each of these quantities; and within this range (if desired) only odd harmonics.
-
Page 40: Alarm Mode Configuration
4.1.8 ALARM MODE CONFIGURATION Alarm mode menu defines the alarms used by the Alarm mode function (see § 5.4 for a complete list of alarms). To activate an alarm, highlight it using the up and down arrow buttons, then confirm the selection by pressing . -
Page 41: Erasing Memory
4.1.9 ERASING MEMORY Erase Memory menu partially or totally deletes data recorded in the instrument. Figure 4-23 ■ To select an item to be deleted, highlight it using the arrow buttons, then confirm the selection by pressing A red dot appears identifying the item to be deleted. To select all items, press . -
Page 42: About
4.1.10 ABOUT About menu displays information concerning the instrument. Figure 4-24 Power Quality Analyzer PowerPad III Model 8336 ®... -
Page 43: Display Modes
5. DISPLAY MODES To select parameters in all modes, use the ◄ ►▲▼ buttons to move to the desired parameter and use the button to confirm selections. 5.1 WAVEFORM CAPTURE MODE The Waveform capture menu enables you to display and to capture transients and inrush currents. It contains two sub- modes: ■... -
Page 44: Transient Mode
5.1.1 TRANSIENT MODE The Transient menu is used to record transients, look up the list of recorded searches and the list of transients they contain, or erase them. You can record up to 7 detections and 210 transients. When the Transient mode is selected, the display screen will depend on the following conditions: if …... -
Page 45: Displaying A Transient
After you program the search, start it by pressing the button. The icon on the status bar blinks to indicate that the search is underway. While the search is active, the button replaces the button and can be used to stop the search before it is finished. - Page 46 Figure 5-4 Item Function Transient name, number, date, time and triggering channel of transient. Activates/deactivates the choice of a transient list display filter. The displayed value indicates the page number and the number of pages. These icons let you browse through the previous and next screens. Press the yellow buttons corresponding to these icons to display the pages.
-
Page 47: Deleting A Transients Search
Item Function Location in the record of the zone displayed. Instantaneous value of the signals according to the position of the cursor on the scale. To move the cursor use the ◄ and ► buttons. Move cursor to one period of the signal before transient triggering time. Move cursor to transient triggering time. -
Page 48: Inrush Current Mode
5.1.2 INRUSH CURRENT MODE While in Waveform mode, the Inrush current sub-mode is used to capture (record) Inrush currents (voltage and current waveforms, network frequency, half-cycle RMS voltages and currents except for the neutral) and to view and delete the recordings. When Inrush Current mode is selected, the screen displayed will depend on the following conditions: if …... -
Page 49: Displaying Capture Parameters
To modify an item, move the yellow cursor to it using the ▲ and ▼ buttons, then confirm the selection with the button. Change the value using the arrow buttons, then confirm again. NOTE: For more information on the triggering filter, refer to § A.1.6. You cannot program an alarm campaign if an inrush current capture is in progress. -
Page 50: True Rms Current And Voltage
NOTE: The PEAK button is not displayed when the inrush current capture recording mode is RMS only. In the PEAK display, the available information is: ● The instantaneous current and voltage at the time indicated by the cursor (in a “waveform” representation). ●... - Page 51 - t: relative time position of the cursor (t = 0 corresponds to the start of the Inrush capture) - Values at the position of the cursor. In the example shown in Figure 5-9, A1, A2, and A3 are the RMS values of currents 1, 2, and 3. : Zoom Out - Zooms out on the graph at the current cursor position : Zoom In - Zooms in on the graph at the current cursor position 3A RMS DISPLAY SCREEN (3-PHASE CONNECTION WITHOUT NEUTRAL)
-
Page 52: Instantaneous Inrush Current
RMS DISPLAY SCREEN IN HZ FOR A THREE-PHASE CONNECTION WITHOUT NEUTRAL Figure 5-12 buttons allow you to go to the first occurrence of a minimum or maximum frequency value. 5.1.4 INSTANTANEOUS INRUSH CURRENT PEAK mode is used to display the envelopes and waveforms of the inrush current capture. The PEAK display of an inrush current capture provides two possible representations: ●... - Page 53 The following section shows two display examples. 4A PEAK DISPLAY SCREEN FOR A 5-WIRE 3-PHASE CONNECTION Figure 5-13 Item Function - MAX |PEAK|: maximum instantaneous absolute value of inrush current capture - Scale of values in amperes - Number assigned to the displayed graph. In this example circle 3 is filled indicating that channel A3 triggered capture of the inrush current.
-
Page 54: Harmonics Mode
5.2 HARMONICS MODE The Harmonics mode displays a representation of the harmonic levels of the voltage, current, and apparent power, order by order. It can be used to determine the harmonic currents produced by nonlinear loads, and analyze problems caused by harmonics according to their order (overheating of neutrals, conductors, motors, and so on). - Page 55 3L PHASE-TO-NEUTRAL VOLTAGE HARMONICS Figure 5-16 Item Function Data about harmonic indicated by cursor: V-h03: harmonic number %: level of harmonics with fundamental RMS value as reference (%f) or (total) RMS value as reference (%r). V: RMS voltage of harmonic +000°: phase shift with respect to fundamental (order 1).
-
Page 56: Current
Harmonic selection cursor; change values with the cursor using the ◄ and ►buttons Horizontal axis indicates orders of harmonics Level of harmonic is given as a percentage with respect to fundamental or to total RMS value DC: DC component 1 to 25: harmonics of order 1 to 25. When the cursor exceeds order 25, order 26 to 50 appears NOTE: Filters L2 and L3 display the harmonics of the phase-to-neutral voltage for phases 2 and 3, respectively. - Page 57 L1 CURRENT HARMONICS Figure 5-19 Item Function Data about harmonic indicated by cursor: A-h05: harmonic number %: level of harmonics with fundamental RMS value (%f) or (total) RMS value (%r) as reference A: RMS current of harmonic +178°: phase shift with respect to fundamental (order 1) max –...
-
Page 58: Apparent Power
5.2.3 APPARENT POWER The S sub-menu displays the harmonics of the apparent power, for all connections except 3-wire 3-phase. The horizontal axis indicates the orders of the harmonics. The bars of the bar chart above the horizontal center line signify harmonic power consumed, those below it harmonic power generated. -
Page 59: Phase-To-Phase Voltage
Item Function Data about harmonic indicated by cursor: S-h03: harmonic number %: level of harmonics with fundamental RMS value (%f) or (total) RMS value (%r) as reference A: RMS current of harmonic +45°: phase shift of the voltage harmonic with respect to the current harmonic max –... - Page 60 L1 PHASE-TO-PHASE VOLTAGE HARMONICS Figure 5-23 Item Function Data about harmonic indicated by cursor: U-h03: harmonic number %: level of harmonics with fundamental RMS value (%f) or (total) RMS value (%r) as reference V: RMS voltage of harmonic +000°: phase shift with respect to fundamental (order 1) max –...
-
Page 61: Expert Mode
5.2.5 EXPERT MODE Expert mode is available with a 3-phase connection only. It displays the influence of the harmonics on heating the neutral and on rotating machines. To display the expert mode press the ▲ or ▼ button. The selection is highlighted in yellow and the screen simultaneously displays the expert mode. - Page 62 CURRENT EXPERT MODE The A sub-menu displays the influence of current harmonics on heating the neutral and on rotating machines. Figure 5-25 ■ Column One: The harmonics inducing a negative sequence. ■ Column Two: Those inducing a zero sequence. ■ Column Three: Those inducing a positive sequence. ■...
-
Page 63: Waveform Mode
5.3 WAVEFORM MODE The Waveform mode displays the current and voltage graphs, along with the values measured and those calculated from the voltages and currents (except for power, energy, and harmonics). This is the screen that appears when the instrument is powered up. -
Page 64: Rms (3U)
5.3.1.1 RMS (3U) This screen displays the three phase-to-phase voltages of a 3-phase system. 02/06/14 Figure 5-27 Item Function Instantaneous value cursor; change values with the cursor using the ◄ and ► buttons RMS phase-to-phase voltages Instantaneous value of the signals at the intersection of the cursor and the curves t: time relative to the start of the period (expressed in milliseconds) U1: instantaneous phase-to-phase voltage between phases 1 and 2 (U U2: instantaneous phase-to-phase voltage between phases 2 and 3 (U... -
Page 65: Rms (4A)
Item Function Instantaneous value cursor; change values with the cursor using the ◄ and ► buttons Effective phase-to-neutral voltages Instantaneous value of the signals at the intersection of the cursor and the curves t: time relative to the start of the period (expressed in milliseconds) V1: instantaneous phase-to-neutral voltage of curve 1 V2: instantaneous phase-to-neutral voltage of curve 2 V3: instantaneous phase-to-neutral voltage of curve 3... -
Page 66: Rms (Neutral)
5.3.1.4 RMS (NEUTRAL) This screen displays the neutral voltage relative to ground and the neutral current. 02/06/14 Figure 5-30 Item Function Instantaneous value cursor; change values with the cursor using the ◄ and ► buttons Effective values of RMS voltage and current Instantaneous value of the signals at the intersection of the cursor and the graphs t: time relative to the start of the period (expressed in milliseconds) VN: instantaneous neutral voltage... -
Page 67: Thd (4V)
Item Function Instantaneous value cursor; change values with the cursor using the ◄ and ► buttons Harmonic distortion rate for each curve Instantaneous value of the signals at the intersection of the cursor and the curves t: time relative to the start of the period (expressed in milliseconds) U1: instantaneous phase-to-phase voltage between phases 1 and 2 (U U2: instantaneous phase-to-phase voltage between phases 2 and 3 (U U3: instantaneous phase-to-phase voltage between phases 3 and 1 (U... -
Page 68: Measurement Of The Peak Factor (Cf)
Item Function Instantaneous value cursor; change values with the cursor using the ◄ and ► buttons Harmonic distortion rate for each curve Instantaneous value of the signals at the intersection of the cursor and the curves t: time relative to the start of the period (expressed in milliseconds) A1: instantaneous current of phase 1 A2: instantaneous current of phase 2 A3: instantaneous current of phase 3... -
Page 69: Cf (4V)
5.3.3.2 CF (4V) This screen displays the phase-to-neutral voltage waveforms of one period and the peak factors. Figure 5-35 Item Function Instantaneous value cursor; change values with the cursor using the ◄ and ► buttons Peak factor for each curve Instantaneous value of the signals at the intersection of the cursor and the curves t: time relative to the start of the period (expressed in milliseconds) V1: instantaneous phase-to-neutral voltage of phase 1... -
Page 70: Measurement Of Extreme And Mean Voltage And Current Values
5.3.4 MEASUREMENT OF EXTREME AND MEAN VOLTAGE AND CURRENT VALUES sub-menu displays the RMS, maximum, minimum and average values for voltage and current, as well as the instantaneous positive and negative voltage and current peaks. NOTE: The display screen varies depending on which value is selected. ●... -
Page 71: Simultaneous Display
5.3.5 SIMULTANEOUS DISPLAY sub-menu displays all the voltage and current measurements (RMS, DC, THD, CF, PST, PLT, FHL and FK). NOTE: The display screen varies depending on which value is selected. ● 3U: Displays the RMS, DC, THD and CF values of the phase-to-phase voltages. ●... -
Page 72: Phasor Diagram Display
5.3.6 PHASOR DIAGRAM DISPLAY sub-menu displays a vector representation of the fundamentals of the voltages and currents. It indicates their associated quantities (modulus and phase of the vectors) and the unbalances of the voltages and currents. NOTE: The display screen varies depending on which value is selected. ●... -
Page 73: Alarm Mode
5.4 ALARM MODE The Alarm mode detects overshoots of thresholds on each of the following parameters: |Upk-| Vthdr Urms |Vpk-| Athdr Vrms |Apk-| Arms |Pdc | |Udc| |Q1| or N Vunb (or Uunb for a 3-phase source without neutral) |Vdc| Aunb |Adc| Uthdf... -
Page 74: Alarm Mode Configuration
5.4.1 ALARM MODE CONFIGURATION To program/display alarms, they must first be configured (see § 4.1.8). Alarm Mode configuration submenu displays the list of alarms configured (see § 4.1.8). This shortcut button lets you define or change alarm configurations. Press to return to the Detection Schedule (Programming a Campaign) screen. -
Page 75: Manually Stopping An Alarm Campaign
5.4.4 MANUALLY STOPPING AN ALARM CAMPAIGN An alarm can be manually stopped before the stop date and time by pressing the icon’s yellow button. The OK icon will reappear in the same location. 5.4.5 DISPLAYING A LIST OF ALARM CAMPAIGNS To display the list of campaigns performed, press the button. -
Page 76: List Of Alarms
5.4.6 LIST OF ALARMS To select a campaign, move the cursor to it using the ▲ and ▼ arrow buttons. The selected field is bolded. Then validate with the button. The instrument then displays the alarms in list form. Figure 5-43 Item Function Alarm date and time Target of alarm detected... -
Page 77: Deleting Alarm Campaigns
5.4.7 DELETING ALARM CAMPAIGNS 5.4.7.1 DELETING A SINGLE ALARM CAMPAIGN When the list of campaigns performed is displayed (see Figure 5-42), select the campaign to be deleted by moving the cursor to it using the up and down arrow buttons. The selected campaign is bolded. Then press the button. -
Page 78: Viewing The Recording List
To program a recording, set the parameters listed in the Recording Schedule screen: ● Set-up identifies the configuration through ● Start defines the time and date when the recording starts. The start date and time must be later than the current date and time. -
Page 79: Deleting Recordings
5.5.3 DELETING RECORDINGS When the list of records is displayed (see Figure 5-45), select the recording to be deleted using the ▲ or ▼ button. The selected recording is bolded. Press the button. Press the button to confirm deletion, or the button to cancel. - Page 80 Item Function Position of viewing window in the record Date indicated by the cursor position Indicates that this screen is a partial view of the trend graph. There are other screens before and after this screen. Use the ▲ and ▼ arrow buttons to move the cursor. The display period of this graph is one minute.
- Page 81 Figure 5-49 Item Function Places cursor on first occurrence of minimum value Places cursor on first occurrence of maximum value Pressing the button automatically sets “zoom in” to the highest level (the display period is identical to the recording period) and deactivates the MIN-AVG-MAX mode if previously activated. Figure 5-50 Item Function Graph of MAX...
- Page 82 Figure 5-51 For each of the phases (L1, L2, and L3), at each recording of a value over one second (recording period), the instrument also records the minimum half-cycle RMS value over one second and the maximum half-cycle RMS value over one second.
- Page 83 Figure 5-54 This graph is an example of tan Φ (L1) with MIN-AVG-MAX. Figure 5-55 Item Function Sum of powers of the three phases is presented in bar graph form. Changes the scale of display between 1 minute and 5 days. For the energy graphs, the quantities are expressed in Wh, J, toe, or BTU, depending on the unit chosen in the configuration of the instrument (see §...
- Page 84 The MIN-AVG-MAX mode can be activated for the powers to be displayed (above the graph) the mean power value at the cursor date along with the maximum and minimum power values. Note that, in contrast with the other quantities, only the bar chart of mean values is represented.
- Page 85 Figure 5-59 Item Function Position of viewing window in record. Date defined by cursor position. Indicates that this screen is a partial view of the trend graph. There are other screens before and after this visible screen. Use the ◄ and ► buttons to move the cursor. The period of display of this graph is two hours.
- Page 86 Figure 5-61 Item Function You can stop the loading of recorded values and calculation of the values displayed at any time by pressing this button. Figure 5-62 Item Function Dashes indicate that the value is not available at the cursor position because it was not calculated. Display of the record is not complete because construction was stopped before the end.
- Page 87 The display has not been stopped and is therefore complete. The following table indicates the time needed to display the graph on screen as a function of the width of the display window for a recording period of one second: Typical waiting time for Typical waiting time for display Width of display window...
-
Page 88: Power And Energy Mode
5.6 POWER AND ENERGY MODE Power and Energy button displays power and energy measurements. The sub-menus available depend on which filter is selected: ■ For 2- and 3-wire single-phase connections and for the 2-wire 2-phase connection, only L1 is available. The filter is therefore not displayed;... -
Page 89: Quantities Associated With Power
5.6.1.2 QUANTITIES ASSOCIATED WITH POWER The PF... sub-menu displays the quantities associated with power. Figure 5-65 The values in this screen are as follows: Item Function Power factor cos Φ Fundamental power factor (also called DPF - displacement factor) tan Φ Tangent of phase shift Φ- Phase shift of voltage with respect to current... -
Page 90: Energy Generated
Item Function Ph (Wh) Active energy consumed Pdch (Wh) DC energy (only if a DC current sensor is connected) h (varh) Reactive energy consumed Dh (varh) Distortion energy. Sh (VAh) Apparent energy consumed Inductive reactive effect Capacitive reactive effect 5.6.1.4 ENERGY GENERATED Energy Generated screen displays the meters of the energy generated by the load. -
Page 91: L1, L2, And L3 Filters
5.6.2 L1, L2, AND L3 FILTERS 5.6.2.1 POWERS AND ASSOCIATED QUANTITIES The W... sub-menu displays the power and associated quantities. Figure 5-68 The values in this screen are as follows: Item Function P (W) Active power Pdc (W) DC power (var) Reactive power D (var) -
Page 92: Energy Meters
5.6.2.2 ENERGY METERS The Wh... sub-menu displays the energy meters. Figure 4-69 The values in this screen are as follows: Item Function Meters of the energy consumed by the load Meters of the energy generated by the load Filters L2 and L3 display the same information for phases 2 and 3. 5.6.3 Σ... -
Page 93: Total Energy Meters
Item Function P (W) Total active power Pdc (W) Total DC power (var) Total reactive power D (var) Total distortion power S (VA) Total apparent power Total power factor cos Φ Total fundamental power factor (also called DPF - displacement factor) tan Φ... -
Page 94: Starting And Stopping Energy Measurements
5.6.5 STARTING AND STOPPING ENERGY MEASUREMENTS To start a measurement: 1. Press the , or Wh...). The date and time at which the measuring button while in an energy display ( starts will appear in the upper left corner of the screen, and the icon on the screen blinks to indicate that energy metering is in progress. -
Page 95: Viewing A Snapshot
5.7.1 VIEWING A SNAPSHOT ■ A short press (about 1s) on the button gives access to the menu of snapshots that have been saved. ■ Use the arrow buttons to select the snapshot. ■ The date and time of the selected snapshot are bolded. Press to display the selected snapshot. -
Page 96: Dataview Software
6. DATAVIEW SOFTWARE DataView is a software program that enables a PC to connect to and interact with a variety of AEMC instruments, including the Model 8336. As its name implies, a primary purpose of DataView is to view data that has been recorded by the instrument and displayed on the PC. - Page 97 3. In the AutoPlay window, select Open Folder to view files. 4. Double-click on Setup.exe from the opened folder view to launch the DataView setup program. NOTE: Depending on your operating system, the User Account Control dialog box may be displayed. Confirm when prompted to proceed.
- Page 98 Figure 6-3 Select Power & Quality Analyzers and any other instrument control panel(s) that you want to install. You can also deselect any Control Panel that you do not need. Then click Next. NOTE: The PDF-XChange option must be selected to be able to generate PDF reports from within DataView. 12.
-
Page 99: Connecting The Model 8336 To Your Computer
17. Restart your computer, then connect the instrument to the USB port on the computer. 18. After the instrument is connected to the computer, the Found New Hardware dialog box appears. Windows will complete the driver installation process automatically. The DataView folder containing shortcuts for DataView and each Control Panel selected during the installation process appears on your desktop. -
Page 100: Configuring The Instrument
The Control Panel user interface consists of multiple components for displaying, modifying, saving, and navigating data recorded on the Model 8336. Figure 6-6 The Control Panel user interface consists of multiple components for displaying, modifying, saving, and navigating data recorded on the Model 8336. ■... -
Page 101: Setup
Figure 6-7 The Configure Instrument dialog box consists of eight tabs: Setup, Sensors and Ratios, Instrument Display, Alarm Conditions, Recordings, Transients, Inrush, and Schedule. At the bottom of each of these tabs are a set of buttons that perform the following tasks: ●... -
Page 102: Sensors And Ratios
6.4.2 SENSORS AND RATIOS The Sensors and Ratios tab defines the voltage ratios and current ratios (when available) so final values can be adjusted, recorded, and displayed with correct magnitudes. The ability to set the current probe ratio is dependent on the type of probe used. -
Page 103: Alarm Conditions
6.4.4 ALARM CONDITIONS The Alarm Conditions tab allows you to set up 40 alarm configurations. Figure 6-10 ■ Prev Page & Next Page: Move between the 3 pages of alarms with 16 alarms per page. ■ Data to Capture: The alarm will be triggered based on the value of the selected parameter. Choices include: None: no alarm Hz: frequency VΦ-Φ... -
Page 104: Recordings
D (var): VΦ-Φ DC: DC phase-to phase VΦ-N THDr: harmonic distortion of voltage the phase-to-neutral voltage with the total RMS value without DC as reference DPF (cos Φ): displacement factor VΦ-Φ Hf: phase-to-phase VΦ-N unb (2): phase-to-neutral voltage harmonic factor voltage unbalance FHL: harmonic loss factor VΦ-Φ... -
Page 105: Transients
Four different configurations are available. More configurations can be saved by pressing Save to File and recalled later by pressing Load From File. 1. Select the configuration to set up: 1, 2, 3, or 4. 2. Check the box for each parameter desired in the Data to Record section. 3. -
Page 106: Inrush
6.4.7 INRUSH The Inrush tab shows the dialog box used to configure the parameters for an Inrush search. Figure 6-13 Inrush current is measured when the power is first turned on. Depending on the type of load, the Inrush current may be very high for some time when compared with steady state current later on. -
Page 107: Schedule
6.5 SCHEDULE The Schedule Tab allows you to choose Start/Stop times and define other parameters related to recording sessions and searching for alarms. Figure 6-14 ■ Record Now immediately begins a recording session or search, depending on selections. The process can start without a name. -
Page 108: Real-Time Data
6.6 REAL-TIME DATA When your setup is completed, you can display different views on the screen of real-time data and waveforms. 6.6.1 TREND This display shows a real-time trend of data from the Model 8336. The data is an average of waveforms downloaded to the PC whose scale adjusts constantly to fit all the data it has received. -
Page 109: Harmonics
6.6.3 HARMONICS This screen displays harmonic data up to the 50th harmonic for voltage or current for selected phase(s) of the available channels or neutral (N). Figure 6-17 The voltage harmonics can be selected for phase-to-phase voltage or phase-to-neutral voltage or neutral-to-ground voltage. -
Page 110: Energy
6.6.5 ENERGY Real-time Data Energy resembles the Power display. Figure 6-19 This displays accumulated energy data, and can be started or stopped; the results can be downloaded to a database and viewed on the screen, selected by phase. 6.7 DOWNLOADING DATA To download recorded data, select Instrument from the menu bar and click Download Recorded Data. -
Page 111: Recordings
6.7.1 RECORDINGS The Recordings folder in the navigation frame on the left side of the Control Panel lists all recordings downloaded from the Model 8336. A recording can be downloaded to a database on the PC by selecting it and clicking Save or Save As from the File menu. - Page 112 Figure 6-21 The Session Properties dialog box allows you to specify the Operator, Site, and Custom parameters that are to be saved with recorded data. These parameters are used when generating reports. The Operator and Site tabs allow you to maintain lists of operators and sites, saving you time when specifying parameters for reports.
-
Page 113: Maintenance
7. MAINTENANCE Use only factory specified replacement parts. AEMC will not be held responsible for any accident, incident, or malfunction ® following a repair done other than by its service center or by an approved repair center. 7.1 CLEANING Disconnect the instrument from any source of electricity. -
Page 114: Updating Software & Firmware
7.3 UPDATING SOFTWARE & FIRMWARE To provide our customers the best possible service in terms of performance and technical upgrades, AEMC offers free ® software and firmware updates on our website. ● Visit us at: www.aemc.com ● Click on the TECH INFO tab, then click on the Software & Firmware Updates button. -
Page 115: Icons, Button & Symbols
8. ICONS, BUTTON & SYMBOLS 8.1 FUNCTION BUTTON ICONS The Model 8336 display includes the following icons for the yellow function buttons: Icon Function Icon Function Phase-to-neutral voltage mode Energy calculation Phase-to-neutral current mode Zoom in Power mode Zoom out Phase-to-phase voltage mode Contrast Non-active quantities... -
Page 116: Keypad Buttons
8.2 KEYPAD BUTTONS 8.2.1 FUNCTION BUTTONS (YELLOW BUTTONS) These six buttons activate the function or tool represented by the corresponding icon on the screen. 8.2.2 NAVIGATION BUTTONS A block of four arrow buttons, a select button and a return button are available for navigating menus. Button Function Up direction or navigation button. -
Page 117: Other Buttons
8.2.4 OTHER BUTTONS The other buttons have the following functions: Button Function Configuration button § 4.1 Snapshot of current screen and retrieval of screens already stored § 5.7 Help information about functions and the symbols used for current display mode. §... - Page 118 Minimum peak value of the phase-to-phase volt- Aunb Upk- Current unbalance age. Mean value (arithmetic mean) Urms True RMS phase-to-phase voltage. Total phase-to-phase voltage harmonic distortion Peak factor (current or voltage) Uthdf in %f. Cosine of the phase shift of voltage with Total phase-to-phase voltage harmonic distortion cos Φ...
-
Page 119: Specifications
9. SPECIFICATIONS 9.1 REFERENCE CONDITIONS Parameter Reference Conditions Ambient temperature 73°F ± 5°F (23°C ± 3°C) Humidity (relative humidity) [45%; 75%] Atmospheric pressure [860 hPa; 1060 hPa] Phase-to-neutral voltage [50Vrms; 1000Vrms] without DC (< 0.5%) [30mVrms; 1Vrms] without DC (< 0.5%) Standard current circuit input voltage ⇔... -
Page 120: Electrical Specifications
9.2 ELECTRICAL SPECIFICATIONS 9.2.1 VOLTAGE INPUTS Range for use: 0 to 1000Vrms AC+DC phase-to-neutral and neutral-to-ground 0 to 2000Vrms AC+DC phase-to-phase (on condition of compliance with 1000Vrms with respect to ground in CAT III) Input Impedance: 1195kW (between phase and neutral and between neutral and ground) Admissible Overload: 1200Vrms constant 2000Vrms for one second 9.2.2 CURRENT INPUTS... -
Page 121: Accuracy Specifications (Excluding Current Probes)
9.2.5 ACCURACY SPECIFICATIONS (EXCLUDING CURRENT PROBES) Quantities concerning currents and voltages Measurement range without ratio Display resolution (with unity ratio) Measurement Accuracy (with unity ratio) Minimum Maximum Frequency 40Hz 70Hz 10mHz ±10mHz 100mV ±(0.5% + 200mV) V < 1000V simple 1000V ±(0.5% + 1V) V ≥... - Page 122 Measurement range without ratio Display resolution (with unity ratio) Measurement Accuracy (with unity ratio) Minimum Maximum J93 clamp 3500A ±(0.5% + 1A) 100mA ±(0.5% + 200mA) A < 1000A SR193 clamp 1000A MR193 clamp ±(0.5% + 1A) A ≥ 1000A MN93 clamp 200mA 200A...
- Page 123 Measurement range without ratio Display resolution (with unity ratio) Measurement Maximum intrinsic accuracy (with unity ratio) Minimum Maximum J93 clamp 3500A ± (1% + 1A) 100mA A < 1000A SR193 clamp 1200A ±(1% + 1A) MR193 clamp A ≥ 1,000A MN93 clamp 200mA 240A...
- Page 124 Quantities concerning powers and energies Measurement range without ratio Display resolution (with unity ratio) Measurement Maximum intrinsic accuracy (with unity ratio) Minimum Maximum ±(1%) Excluding cos Φ ≥ 0.8 AmpFlex ±(1.5% + 10cts) MiniFlex 0.2 ≤ cos Φ < 0.8 Active 10mW 10MW...
- Page 125 (6) The energy is equivalent to more than 114 years of the associated maximum power (unity ratios). (7) n is the highest order for which the harmonic ratio is non-zero. (8) With SL261 clamp (100mV/A) (9) With J93 clamp, for a 2-wire single-phase connection (phase-to-ground voltage). (10) The energy corresponds to more than 190 years at maximum power Pdc (unit ratios).
- Page 126 ±(2.5% + 5cts) si ∀ n ≥ 1. τ ≤ (100 ÷ n) [%] Total current harmonic distortion (THD) (referred to the signal without 100% 0.1% ±(2% + (n × 0.2%) + 5cts) DC) of current ≤ 25 (excluding AmpFlex & MiniFlex) ±(2% + (n ×...
- Page 127 Measurement range Display resolution (with unity ratio) Measurement Maximum intrinsic accuracy (with unity ratio) Minimum Maximum 100 mV V < 1000V simple 1000V ±(2.5% + 1V) V ≥ 1000V harmonic voltage 100 mV (order n ≥ 2) U < 1000V compound 2000V ±(2.5% + 1V)
- Page 128 Measurement range Display resolution (with unity ratio) Measurement Maximum intrinsic accuracy (with unity ratio) Minimum Maximum J93 clamp 3500A ±((n x 0.4%) + 1A) 100 mA A < 1000A SR193 clamp 1000A ±((n x 0.4%) + 1A) MR193 clamp A ≥ 1000A MN93 clamp 200mA 200A...
- Page 129 Measurement ranges after application of the ratios Measurement range Measurement Minimum Maximum with minimum ratio(s) with maximum ratio(s) simple 120mV 170GV & RMS ½ voltage compound 120mV 340GV simple 120mV 200GV Direct voltage (DC) compound 120mV 400GV simple 160mV 240GV Peak voltage (PK) compound 320mV...
-
Page 130: Current Probe Accuracy (To Be Added To The Model 8336'S Accuracy)
9.2.6 CURRENT PROBE ACCURACY (TO BE ADDED TO THE MODEL 8336’S ACCURACY) Sensor errors are offset by a typical correction inside the device. This typical correction, applied to the phase and amplitude, depends on the type of sensor connected (detected automatically) and the gain in the current acquisition channel used. The RMS current measurement error and phase error are additional errors (which must therefore be added to the device errors), indicated as influences on the calculations carried out by the analyzer (powers, energies, power factors, tangents, etc.). -
Page 131: Current Probes And Sensors
9.2.7 CURRENT PROBES AND SENSORS When installing probes, face the arrow on the probe in the direction of the load. Note that only AmpFlex sensors are ® watertight; all other probes and sensors are non-watertight. Model SR193 Nominal Range 1000A for f ≤1kHz Measurement Range 1A to 1200A... -
Page 132: Class B Under Standard Iec 61000-4-30
MiniFlex Sensors ® Nominal Range 3000A Measurement Range 100mA to 3000A Probe Output Signal* 47mV /1000A at 60Hz (39.1 at 1000A 50Hz) Sensor Length = 10" (250mm); Ø = 2.75" (70mm) Safety EN 61010-2-032, Pollution Degree 2, 600V CAT IV, 1000V CAT III *Output is proportional to the amplitude and frequency of the measured current. -
Page 133: Accuracy And Measurement Ranges
9.3.2 ACCURACY AND MEASUREMENT RANGES Parameter Range Accuracy Industrial frequency [42.5Hz ; 69Hz] ±10mHz [50V ; 1000V] Supply voltage amplitude [50V ; 1000V] ±1% of U [50V ; 1000V] V ∈ {120V ; 230V} Flicker [0.25 ; 12] See the corresponding tables U ∈... -
Page 134: Environmental Specifications
9.5 ENVIRONMENTAL SPECIFICATIONS Reference Temperature: 20 to 26°C (68 to 78.8°F) from 45 to 75% RH Operating Temperature: 0 to 42.5°C (32 to 108.5°F) from 10 to 85% RH 0 to 50°C (32 to 122°F) from 45 to 75% RH Storage Temperature: With batteries: -20 to 35°C (-4 to 95°F) from 0 to 95% RH... -
Page 135: Appendix
APPENDIX A.1 HYSTERESIS A.1.1 Surge detection With a hysteresis of 2%, for example, the return level for surge detection is equal to (100% - 2%) or 98% of the reference voltage threshold. A.1.2 Undervoltage or blackout detection With a hysteresis of 2%, for example, the return level for undervoltage detection is equal to (100% + 2%) or 102% of the Uref voltage threshold. -
Page 136: Minimum Scale Values For Waveforms And Minimum Rms Values
A.1.3 Minimum scale values for waveforms and minimum RMS values Minimum scale value Type Min RMS values [waveform mode] Phase-to-neutral and phase-to-phase voltages AmpFlex & MiniFlex ® ® SR193 MR193 MN93 0.2A MN193 (100A) 0.8A 0.1A SL261 (10mV/A) 0.8A 0.1A SL261 (100mV/A) 0.08A 0.01A... -
Page 137: Mechanism For Triggering Transient Sensors
A.1.5 Mechanism for triggering transient sensors The sampling rate is a constant 256 samples per cycle. When a transient capture is started, each sample is compared to the sample from the preceding cycle. The preceding cycle defines the mid-point of the trigger envelope and is used as reference. -
Page 138: Glossary Of Terms
GLOSSARY OF TERMS AC and DC components AC component only DC component only Inductive phase shift Capacitive phase shift ° Degree Expert mode Absolute value Σ Values of the system Percentage Fundamental value as reference Total value as reference Φ Phase shift of the voltage with respect to the current Current or the unit “ampere”... - Page 139 Giga (10 In electrical systems, voltages and currents at frequencies that are multiples of the fundamental Harmonics frequency Hysteresis Difference between thresholds for reciprocal changes of state Frequency of the network Joule kilo (10 Channel (Line) milli (10 millisecond Mega (10 Maximum value Minimum value Non-active power...
- Page 140 Unbalanced Upk+ Maximum peak value of phase-to-phase voltage Upk- Minimum peak value of phase-to-phase voltage Urms Phase-to-phase RMS voltage Uthd Total harmonic distortion of the phase-to-phase voltage Harmonic distortion of the phase-to-phase voltage with the RMS value of the fundamental as Uthdf reference Harmonic distortion of the phase-to-phase voltage with the total RMS value without DC as...
-
Page 141: Repair And Calibration
If the instrument is returned for calibration, we need to know if you want a standard calibration, or a calibration traceable to N.I.S.T. (Includes calibration certificate plus recorded calibration data). Ship To: Chauvin Arnoux , Inc. d.b.a. AEMC Instruments ®... -
Page 142: Limited Warranty
This warranty is void if the unit has been tampered with, abused or if the defect is related to service not performed by AEMC Instruments. ® Full warranty coverage and product registration is available on our website at: www.aemc.com/warranty.html. Please print the online Warranty Coverage Information for your records. What AEMC Instruments will do: ®... - Page 143 06/17 99-MAN 100405 v5 Chauvin Arnoux , Inc. d.b.a. AEMC Instruments ® ® 15 Faraday Drive • Dover, NH 03820 USA • Phone: (603) 749-6434 • Fax: (603) 742-2346 www.aemc.com...
Need help?
Do you have a question about the PowerPad III 8336 and is the answer not in the manual?
Questions and answers