
Related Manuals for AEMC PowerPad IV 8345


Summary of Contents for AEMC PowerPad IV 8345
- Page 1 User Manual ENGLISH PowerPad ® Model 8345 POWERP D IV POWERP D IV Class POWER QUALITY ANALYZER WITH AEMC INSTRUMENTS ®...
- Page 2 Copyright Chauvin Arnoux , Inc. d.b.a. AEMC Instruments. All rights reserved. © ® ® No part of this documentation may be reproduced in any form or by any means (including electronic storage and retrieval or translation into any other language) without prior agreement and written consent from Chauvin Arnoux , Inc., as governed by United States and International copyright laws.
-
Page 3: Statement Of Compliance
Statement of Compliance Chauvin Arnoux , Inc. d.b.a. AEMC Instruments ® ® certifies that this instrument has been calibrated using standards and instruments traceable to international standards. We guarantee that at the time of shipping your instrument has met the instrument’s published specifications. -
Page 4: Table Of Contents
TABLE OF CONTENTS 1. INTRODUCTION..............1.1 INTERNATIONAL ELECTRICAL SYMBOLS ....... 1.2 DEFINITION OF MEASUREMENT CATEGORIES (CAT) ............1.3 PRECAUTIONS FOR USE 1.4 RECEIVING YOUR SHIPMENT ........... 1.5 ORDERING INFORMATION ............1.5.1 Accessories .................. 1.5.2 Replacement Parts ..............1.6 CHARGING THE BATTERY ............1.7 CHOOSING A LANGUAGE FOR THE DISPLAY ...... - Page 5 3.4 CONFIGURING THE INSTRUMENT ........... 3.4.1 Lock Configuration ............... 3.4.2 Language ..................3.4.3 Date and Time ................3.4.3.1 Manual Mode ................29 3.4.3.2 GPS Mode ................... 29 3.4.3.3 NTP Mode ................... 30 3.4.4 Display ..................3.4.4.1 Colors of the Voltage Curves ............31 3.4.4.2 Colors of the Current Curves ............
- Page 6 3.10.6 Energy Mode ................3.10.6.1 Energy Basic Tariff ..............55 3.10.6.2 Energy Specific Tariffs ............... 55 3.10.7 Monitoring Mode ................ 3.10.8 Flagging..................4. OPERATION ................4.1 TURNING THE INSTRUMENT ON ..........4.2 NAVIGATION ................. 4.2.1 Keypad ..................4.2.2 Touch Screen................4.2.3 Remote User Interface ..............
- Page 7 8. ENERGY .................. 8.1 DISPLAY FILTER ................8.2 EXAMPLES OF SCREENS ............9. TREND MODE ................ 9.1 START OF A RECORDING ............9.2 THE LIST OF RECORDINGS ............9.3 READING A RECORDING ............10. TRANSIENT MODE ............. 10.1 START OF A RECORDING ............10.2 THE LIST OF RECORDINGS .............
- Page 8 17.2 ELECTRICAL SPECIFICATIONS ..........17.2.1 Input Voltage Specifications ............ 17.2.2 Current Input Specifications ............ 17.2.3 Bandwidth and Sampling ............17.2.4 Instrument Specifications (Without Current Sensors) .... 17.2.4.1 Currents and Voltages ............. 109 17.2.4.2 Power and Energy ..............113 17.2.4.3 Quantities Associated with Power Values ........116 17.2.4.4 Harmonics.................116 17.2.4.5 Current and Voltage Ratios .............
- Page 9 19. APPENDICES ..............19.1 NOTATION .................. 19.2 AGGREGATIONS IN TREND MODE ........19.3 FORMULAS ................19.3.1 RMS Values ................19.3.2 Peak Values ................19.3.3 Crest Factor ................19.3.4 Definitions Relating to Harmonics ........... 19.3.5 Effective Value Harmonic and Inter-Harmonics Subgroup ..19.3.6 Levels of Harmonics and Interharmonics ........
-
Page 10: Introduction
1. INTRODUCTION Instruments PowerPad IV Model 8345. Thank you for purchasing an AEMC ® ® For best results from your instrument and for your safety, read the enclosed operating instructions carefully and comply with the precautions for use. Only qualified and trained operators should use this product. -
Page 11: Precautions For Use
1.3 PRECAUTIONS FOR USE This instrument complies with safety standard IEC/EN 61010-2-030 or BS EN 61010-2-030. The leads comply with IEC/EN 61010-031 or BS EN 61010-031. The current sensors comply with IEC/EN 61010-2-032 or BS EN 61010-2-032 for up to 600 V in CAT IV. Failure to observe the precautions for use may create a risk of electric shock, fire, explosion, or destruction of the instrument and installations. -
Page 12: Ordering Information
1.5 ORDERING INFORMATION PowerPad IV Model 8345 (No Probes) ........Cat. #2136.35 ® Includes meter, extra-large tool bag, internal carrying pouch, hand strap, USB cable, five 10 ft black voltage leads with alligator clips, twelve color-coded input ID markers, power adapter (PA32ER) with US power cord, two 6 ft stackable leads, two 10 ft black voltage leads with alligator clips for power adapter PA32ER, SD Card, one power plug adaptor for PA32ER, 5.8 A·h Li-ion battery pack, quick start guide, and USB drive with DataView... -
Page 13: Replacement Parts
1.5.2 Replacement Parts Carrying Bag..................Cat. #2133.76 Lead - Set of five, 10 ft (3 m) Black Leads w/ five Black Alligator Clips ............... Cat. #2140.43 Lead - One 10 ft (3 m) Black Lead w/ one Black Alligator Clip ..Cat. #2140.44 Cable - Replacement 10 ft USB Cable .......... -
Page 14: Choosing A Language For The Display
1.7 CHOOSING A LANGUAGE FOR THE DISPLAY You must choose a language for the display before using the instrument. The Model 8345 has more than 20 languages available from which to choose. 1. Press the ON/OFF button to turn the instrument on. 2. -
Page 15: Product Features
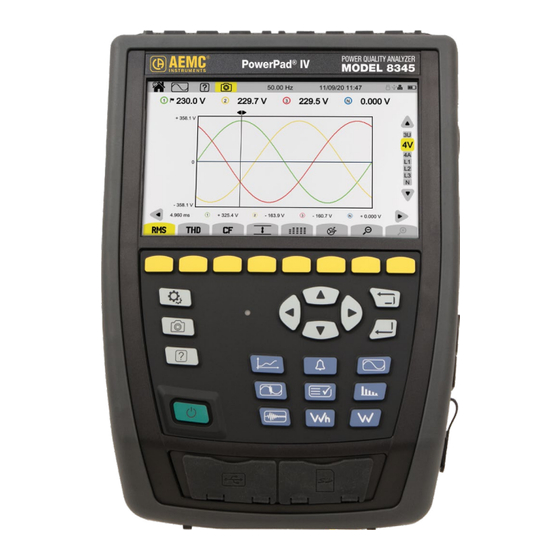
2. PRODUCT FEATURES 2.1 DESCRIPTION The PowerPad IV Model 8345 is a portable, three-phase power quality analyzer ® that complies with the standards governing the methods of power quality measurement, IEC 61000-4-30, Class A. The Model 8345 can be used to: ■... -
Page 16: Display Functions
Current and voltage crest factors (neutral included) ■ Harmonic loss factor (FHL) for application to transformers in the presence ■ of harmonic currents ■ K factor (FK) for application to transformers in the presence of harmonic currents ■ 40 alarms per user profile ■... -
Page 17: Measurement Functions
2.1.3 Measurement Functions The trend recording (data logging) function offers the following features: ■ Time-stamping ■ Programming the recording’s beginning and end ■ Representation, in barcharts or curves, of mean values for many parameters as a function of time, with or without the MIN-MAX ■... -
Page 18: Overall View
■ Choose the calculation methods: whether non-active quantities are broken down, the unit of energy, the K factor calculation’s coefficients, the reference for levels of harmonics, and the calculation of PLT (sliding window or not) ■ Choose the distribution system: single-phase, two-phase, or three-phase with or without neutral ■... -
Page 19: Measurement Terminals
2.3 MEASUREMENT TERMINALS 4 current input terminals 5 voltage input terminals (for current sensors) 1000V CAT IV 2.4 SIDE CONNECTORS Strap attachment point Theft-proofing device for securing the instrument with a Kensington lock RJ45 connector for Ethernet connection USB type B connector for connection to a PC Special 4-point connector for the power supply. -
Page 20: Battery
2.5 BATTERY The instrument can operate on battery power or wall power. While the battery charges, the instrument can operate on wall power. The battery contributes to the operator’s safety, so do not use the instrument without its battery. The instrument’s display has a battery indicator icon that shows the battery’s status and remaining charge. -
Page 21: On/Off Button
2.7 ON/OFF BUTTON Use the button to turn the instrument ON. The button will blink orange ■ while the instrument is turning on. ■ When the battery is charging, the button will blink green. The button will show steady green when the battery is fully charged. ■... -
Page 22: Navigation Buttons
2.8.2 Navigation Buttons Button Function Directional buttons Confirm button Return button 2.8.3 The Other Buttons Button Function See § Configuration button § 4 Screenshots button § 14 Help button § 15 2.8.4 The Function Buttons (8 Yellow Buttons) The functions of the yellow buttons depend on the selected mode and context. A button’s function for each screen is shown at the bottom of the display. -
Page 23: Memory Card
2.10 MEMORY CARD The instrument is delivered with a formatted SD card that is essential for recording measurements. The instrument accepts SD (SDSC), SDHC, and SDXC memory cards in FAT16, FAT32, or exFAT format. To install a new SD card, you will need to: 1. -
Page 24: Stand
2.11 STAND The back of the instrument has a retractable stand to hold it at a 60 ° angle. NOTE: Do not insert the leads into the terminals while the instrument is supported by the stand, or the stand could become damaged. The stand is designed only for viewing the display and interacting with the interface from different angles. -
Page 25: Configuration
3. CONFIGURATION NOTE: You must configure your instrument before use. The configuration screen allows you to set up specific configurations for the instrument’s parameters and every measurement mode. ■ Press the button to access the configuration screen ■ Press the button to configure the measurements ■... -
Page 26: Input Keyboard
3.2 INPUT KEYBOARD When a text entry is required, the instrument displays a virtual keyboard. The available characters depend on the context. 3.3 USERS The Model 8345 allows three different users to configure the instrument and measurements. The configuration for each user profile is saved, so multiple users can use the Model 8345 without reconfiguring the instrument for each user. -
Page 27: Configuring The Instrument
3. Press to access the details of the user profile. Use the (◄, ►) directional buttons to select the user name field, and press again to enable the field name. Now you can edit the name. 4. Enter your desired username (up to 8 characters long) using upper- and lower-case letters (A-Z), numbers (0-9), and symbols (@, -, _, and . -
Page 28: Lock Configuration
3.4.1 Lock Configuration Once your instrument is configured, you can lock the configuration by pressing and entering a password. No further configuration parameters can be modified. NOTE: Keep your password safe, as you will no longer be able to configure your instrument without your password. To unlock configuration, press again and enter the password. -
Page 29: Date And Time
3.4.3 Date and Time ■ Press to set the date and time ■ Press to choose from 73 available time zones ■ For Time source, choose between NTP server, GPS, and Manual for your desired method to set the date and time For Date/Time, enter the date and time if on Manual mode;... -
Page 30: Gps Synchronization
The instrument will maintain accuracy in the following situations, even if the satellites are no longer accessible. Satellites in View Maximum Drift (Class A) Drift (Model 8345) None ±1 s / 24 h ±24 ms / 24 h ±16.7 ms vs UTC ±60 ns / 1 s One or more at all times... -
Page 31: Display
3.4.4 Display Press to open the configuration menu for the display ■ 3.4.4.1 Colors of the Voltage Curves 1. Press to choose the colors of the voltage curves. 2. Choose a color for each of the 3 phases and neutral. In night mode, the background changes from white to black. - Page 32 The screen indicates the content of the SD card or USB drive The bars at the top and at the right side of the screen show the SD card’s used space in black and the remaining space in white. The SD card’s total size is to the right of the bar.
-
Page 33: Information
3.6 INFORMATION Information about the instrument can be found in the instrument configuration. Press the button then the second function button Select to view information about the instrument. The instrument’s connection status is indicated in the top right of the display. Connection status The information pages ( , etc.) allow you to look up complete... -
Page 34: Ethernet Link
The following screen will be displayed: Connection status Press to enable connection via an Ethernet connection Press to enable configuration of the Wi-Fi access point (WAP) Press to enable Wi-Fi connection Press to configure email Press to connect to the DataViewSync NOTE: Only one link (Ethernet, Wi-Fi or Wi-Fi access point) can be activated at a time. -
Page 35: Wi-Fi Access Point (Wap) Link
3.7.2 Wi-Fi Access Point (WAP) Link The instrument creates a local Wi-Fi network that allows it to connect to a PC, smartphone or tablet. Select the security To select an access type: point operating ■ WPA2-PSK frequency secure protocol and enter the password ■... -
Page 36: Email
■ If selected, the instrument will request the IP address and other parameters from a DHCP server and will generate an IP address automatically if no DHCP server replies. ■ If deselected, you must assign the IP address and parameters manually. ■... -
Page 37: Updating The Embedded Software
■ Connection to DataViewSync™ is automatic as soon as an Ethernet, Wi-Fi or Wi-Fi access point link is activated. When the connection is made, symbol is displayed above the button. ■ The connection to DataViewSync™ will be used to launch a remote measurement campaign. -
Page 38: Configuring The Measurement
From the update screen shown below, select the method to use to update the software. Select: to update from the AEMC Instruments web site via Ethernet link ® to update from the SD card to update from USB drive When the update method has been selected, press to download the file (this may take several minutes). -
Page 39: Calculation Methods
3.9.1 Calculation Methods Press the button to determine the calculation methods. 3.9.1.1 Nominal Values to specifiy the nominal values. ■ The nominal frequency (50 or 60) Hz ■ The nominal voltage The nominal voltage between phases ■ NOTE: Single-phase and phase-to-phase voltage ratings can be set independently. -
Page 40: Real Time Values
3.9.1.2 Real Time Values ■ Press the button to configure the real-time values. ■ For Real-Time values, choose either 10/12 cycles and 200 ms or 150/180 cycles and 3 s. This choice will apply to the value’s calculation and display in most modes. -
Page 41: Harmonic Mode
■ For FK Coefficient: q, choose a value between 1.5 and 1.7 to use for the K factor calculation. The exponential constant q depends on the type of winding and the frequency. ■ A value of 1.7 is suitable for transformers where the conductor cross sections are round or square. -
Page 42: Msv Template
3.9.1.5 MSV Template ■ Press the button to configure the curve of maximum MSV voltages as a function of the frequency. There are 5 modifiable preset points to define the curve. This curve will be displayed with the MSV versus frequency curve. 3.9.2 The Distribution Network and the Type of Connection ■... - Page 43 Distribution System Network Electrical Diagram Split-phase 2 wires Split-phase Three-phase 2 wires 2 wires (L1 and L2) in open star Split-phase 3 wires with neutral without earth Split-phase 3 wires in open star with neutral without earth Split-phase 3 wires Split-phase in high leg delta 3 wires...
- Page 44 Distribution System Network Electrical Diagram Split-phase 4 wires with neutral and earth Three-phase 4 wires in open star with neutral and earth Three-phase Split-phase 4 wires 4 wires in high leg delta (L1, L2, N, and earth) with neutral and earth Three-phase 4 wires in open high leg delta...
- Page 45 Distribution System Network Electrical Diagram Three-phase 3 wires in star Three-phase 3 wires in delta Three-phase 3 wires Three-phase in open delta 3 wires (L1, L2, and L3) Indicate the current sensors that will be connected: all 3 Three-phase sensors (3A) or only 2 (A1 and 3 wires A2, A2 and A3, or A3 and A1).
- Page 46 Distribution System Network Electrical Diagram Three-phase 4 wires with neutral without earth Three-phase Three-phase 4 wires 4 wires in open high leg delta (L1, L2, L3, and N) with neutral Indicate which voltages will without earth be connected: all 3 voltages (3V) or only 2 (V1V2, V2V3, or V3V1).
-
Page 47: Sensors And Ratios
3.9.3 Sensors and Ratios ■ Press to select the voltage ratios and current sensor’s ratios and range. 3.9.3.1 Voltage Ratio Voltage ratios are used when the voltages are too high for the instrument and voltage transformers are used to lower them. The ratio lets you display the true voltage and use it in the calculations. -
Page 48: Current Sensors
3.9.3.2 Current Sensors Select A in function bar to choose the ratios and ranges of the current sensors. ■ The instrument will automatically display the detected current sensor models. The different current sensors are: MN93 clamp (200 A) MN193 clamp (100 A) MN193 clamp (5 A) [1 to 60,000] / {1;... -
Page 49: Reversing The Current
3.9.3.3 Reversing the Current If your current sensors are connected and you notice that one or more sensors are not correctly oriented during the measurement, you can easily reverse them without physically reorienting them. Press to reverse a current sensor. ■... -
Page 50: Trend Mode
In this way, you can quickly start a recording without having to program the date and time for the start and end of the recording. The recording will start: ■ in the next 10 seconds for inrush mode ■ at the end of the current minute + one minute for trend, transient, alarm and monitoring modes 3.10.2 Trend Mode The Trend mode... -
Page 51: Transient Mode
For repeated recordings, press the (QuickStart) button, which can be used to set the recording’s length, setup, recording period, and name. For Duration, enter the trend recording’s duration between 1 min and 2 hr. ■ ■ For Set-up, choose a configuration from four user-defined configurations. ■... -
Page 52: Current Thresholds
3.10.3.2 Current Thresholds Select A to configure the current thresholds. ■ For Number of cycles before trigger event, choose the number of cycles ■ between 1 and 4 that will occur before the transient recording is triggered. For Threshold set-up, define the relationship between the thresholds and ■... -
Page 53: Inrush Current Mode
3.10.4 Inrush Current Mode The Inrush Current mode is used to capture inrush currents. Select to configure the inrush current mode. ■ The threshold takes into account the present current, in order to detect the appearance of an additional current For Triggering filter, determine whether the inrush current threshold will ■... - Page 54 The instrument can save up to 40 possible alarms. 1. Select to configure the alarms. 2. Select the quantities and parameters to monitor. The order of the harmonic (between 0 and 63) for U-h, V-h, A-h, U-ih, ƒ V-ih, and A-ih only. The value’s period of calculation.
-
Page 55: Energy Mode
3.10.6 Energy Mode The Energy mode is used to calculate the energy consumed or produced during a specified time period. ■ Select to configure the Energy mode. 3.10.6.1 Energy Basic Tariff ■ Select to configure the parameters for the basic tariff. For Displayed energy unit, select the energy unit to use in the calculations. - Page 56 3.10.7 Monitoring Mode The Monitoring mode is used to check the voltage’s conformity for a specified duration. Each monitoring recording contains a trend record, transients record, alarm detection, log of events, and statistical analysis of a set of measurements. Allows the current configuration to be deleted and replaced by the default configuration (that of the...
-
Page 57: Operation
4. OPERATION 4.1 TURNING THE INSTRUMENT ON To turn the instrument on, press the button ■ The Model 8345 will display a start-up screen before displaying the waveform screen. 4.2 NAVIGATION You can use the buttons, touch screen, or remote user interface (VNC) to navigate the instrument’s menus. - Page 58 4. Press to enter the network configuration screen. 5. Press to enter the Ethernet link screen. 6. Check that the link is active. If it is active, the display will be shaded and will show in the bottom right. If it is inactive, the display will show in the bottom right, and you will have to check the physical connection between the Ethernet cable, instrument, and PC.
-
Page 59: Single-Phase Network
4.3 CONFIGURATION Before making any measurement, remember to specify the: ■ connection type (§ 3.4.2) ■ current sensors, the voltage ratio, and the current ratio (§ 3.4.3) ■ calculation method, if necessary (§ 3.9.1) For the recording modes, remember to specify the: quantities to record ■... -
Page 60: Three-Phase Network
4.4.3 Three-Phase Network For three-phase, 3-wire networks, indicate the current sensors that will be ■ connected: all 3 sensors (3A) or only 2 (A1 and A2, A2 and A3, or A3 and A1). ■ For three-phase, 4-wire and 5-wire networks, indicate the voltage sensors that will be connected: all 3 sensors (3V) or only 2 (V1 and V2, V2 and V3, or V3 and V1). -
Page 61: Instrument Functions
4.5 INSTRUMENT FUNCTIONS 4.5.1 Measurements There are 4 possible real-time modes: waveform , harmonics , power , and energy There are 5 possible recording modes: trend , transients , inrush currents , alarms , and network monitoring 1. Ensure that the instrument’s configuration is correct for the desired measurements. -
Page 62: Turning The Instrument Off
4.5.3 Help ■ Press the help button at any time for information about the functions and symbols used for the in-progress display mode. 4.6 TURNING THE INSTRUMENT OFF To turn the instrument off, press the button. ■ The instrument will request confirmation if it is recording or metering energy (even if metering is suspended), recording transients, recording alarms, or capturing inrush current. -
Page 63: Display Filter
5. WAVEFORM The Waveform mode screen is the initial screen when the instrument turns on. ■ Press the button to enter waveform mode. Cursor Display of voltages or currents with saturation Selected display indicators filter Values at the cursor’s position Functions Waveform mode displays voltage curves, current curves, and values calculated from the voltage and currents (except harmonics, powers, and energies). - Page 64 5.2 ROOT MEAN SQUARE (RMS) FUNCTION The RMS function displays the signals measured over a period and their RMS values averaged over 200 ms or 3 s, depending on the configuration. The configuration is explained in detail in § 3.9.1.2. Press the RMS button to access the RMS function screen.
- Page 65 RMS 4V Display Filter The 4A display filter displays the instantaneous curves of currents and their RMS values. RMS L3 Display Filter The L3 display filter displays the instantaneous phase 3 voltage curves, current curves, and their RMS values. Cursor Max and min of the voltages and currents Values at the cursor's...
-
Page 66: Min-Max Function
5.4 CREST FACTOR (CF) FUNCTION The CF function displays the measured signals and their crest factors. Press the CF button to access the CF function screen. ■ The CF function screens are similar to the RMS screens and depend on the selected display filter. - Page 67 4A Display Filter The 4A display filter displays the extreme values of the currents. L1 Display Filter The L1 display filter displays the extreme values of the voltage and current of phase 1. The L2, L3, and N display filters are similar but concern phase 2, phase 3, and the neutral.
- Page 68 Displayed Values RMS value DC component Total harmonic distortion referred to the RMS value of the fundamental (THD %f) Total harmonic distortion referred to the RMS value without DC (THD %r) currents Total harmonic distortion referred to the RMS value without DC (THD %r) Crest factor (CF) Harmonic loss factor (FHL) K factor (FK)
- Page 69 4A Display Filter The 4A display filter displays the extreme values of the currents. The DC value is only displayed if the current sensor is able to measure direct current. L2 Display Filter The L2 display filter displays the voltage and current data of phase 2. The L1, L3, and N display filters are similar but concern phase 1, phase 3, and the neutral.
- Page 70 3V Display Filter The 3V display filter displays the phasor diagram of the currents and the phase- to-neutral voltages. V1 is the reference. Inverse unbalance ratio Zero sequence unbalance ratio 3A Display Filter The 3A display filter displays the phasor diagram of the currents and the phase- to-neutral voltages.
- Page 71 6. HARMONIC The voltages and currents can be analyzed as sum of sine waves at the network frequency and multiples thereof. Each multiple is a harmonic of the signal that is characterized by its frequency, amplitude, and phase difference with respect to the fundamental frequency (network frequency).
- Page 72 ■ Press A to display: The harmonics of the currents listed order-by-order. ƒ The total harmonic distortion referred to either the RMS value of the ƒ fundamental (%f) or the RMS value without DC (%r), depending on the configuration (see § 3.9.1). The distorting currents.
- Page 73 6.1 DISPLAY FILTER The available display filters depend on your selected connection: Display filter Display filter Display filter Display filter Connection for V for A for U for MSV Single-phase L1 on V 2 wires Single-phase L1, N L1, N L1 on V 3 wires Split-phase...
- Page 74 The period displayed by the bargraphs is either 200 ms or 3 s, depending on the selected configuration (see § 3.9.1). U function with the L1 Display Filter Cursor Information about harmonic number 5 at the cursor’s position U and Inter-harmonic Function with the L2 Display Filter Cursor Information about...
- Page 75 7. POWER The Power mode displays power measurements (W) and power factor calculations (PF). Press the button to access the Power mode screen. ■ 7.1 DISPLAY FILTER The available display filters depend on the selected connection. Connection Display filter Single-phase, 2 wires Single-phase, 3 wires Split-phase, 2 wires Split-phase, 3 wires...
- Page 76 PF Function with the 3L Display Filter PF: power factor = P/S DPF or PF1 or cos φ: fundamental power factor The name is chosen in the configuration (see § 3.9.1) tan φ: tangent of the phase difference φVA: phase difference of the voltage with respect to the current.
- Page 77 8. ENERGY The Energy mode is used to meter generated and consumed energy over a period and indicate the corresponding price. Display filter ■ Press the button to access the Energy mode screen. Press to access the energy configuration. To change the configuration, there ■...
- Page 78 8.2 EXAMPLES OF SCREENS ■ To change the display filter, use the ▲ ▼ buttons. The available display filters depend on the chosen distribution network and connection type. ■ Press the button to start energy metering. Wh Function with the 3L Display Filter Energy metering is in progress Start date and time...
-
Page 79: Trend Mode
9. TREND MODE The Trend mode records the evolution of the quantities selected in the configuration (see § 3.10.2) for a specified duration. The number of trend recordings is limited only by the SD card’s capacity. ■ Press the button to access the Trend mode screen. The home screen will display a list of the previously-completed recordings. - Page 80 ■ Press the button to start the recording at the programmed date and time. ■ Press the button to suspend the in-progress recording. symbol to the right of the camera icon indicates that a recording has ■ been programmed. symbol to the right of the camera icon indicates that a recording is ■...
- Page 81 9.3 READING A RECORDING Select a recording from the list, and press the confirm button to open. ■ To change the display filter, use the ▲ ▼ buttons. The available display filters ■ depend on the chosen distribution network and connection type. ■...
- Page 82 Phase-to-Neutral Voltages (V ) for an L1 Display Filter and The display window’s position in the recording Active Power (P) for a Display Filter Σ The power, like energy, is displayed in bargraph form. Each bar’s duration is either 1 s or one recording period (if longer than 1 s). Press the Σ...
- Page 83 Power Factor (PF) for an L1 Display Filter Power Quality Analyzer PowerPad IV Model 8345 - User Manual ®...
-
Page 84: Transient Mode
10. TRANSIENT MODE The Transient mode records voltage or current transients for a specified duration determined by the selected configuration (see § 3.10.3). It also records shock waves, which are very high voltages for a very short time. The trigger mechanisms are explained in §... - Page 85 ■ Press the button to start recording a transient programmed in the configuration (§ 3.10.3) at the end of the current minute plus one minute. ■ Press the button to suspend the in-progress recording. ■ Press the button to adjust the voltage, current, or shock wave thresholds. symbol to the right of the cameral icon indicates that a recording has ■...
-
Page 86: Press The Button
1. Select a recording from the list. 2. Press the confirm button to open. 3. Press the button. 4. Use the ▲ ▼ buttons to change the display filter. The available display filters depend on the chosen distribution network and connection type. Display Filter Description Ɐ... - Page 87 Zoom on the Triggering Event Reminder of the Location of the zoom channel that triggered in the recording the transient capture Envelope of the The cursor goes preceding period automatically to the When the curve triggering event passes outside of the envelope, it triggers the transient capture Shock waves in the Voltage Channels...
- Page 88 Zoom on the Triggering Event or the Maximum Value ■ Press to place the cursor as close as possible to the triggering element. ■ Press to place the cursor on the maximum. Since shock waves build up quickly, these two points are often close together. ■...
-
Page 89: Inrush Current Mode
11. INRUSH CURRENT MODE The Inrush Current mode is used to capture and record inrush currents for a duration specified by the selected configuration (see § 3.10.4). Capture conditions are explained in § 19.11. The Model 8345 can record a large number of inrush current captures that is limited only by the SD card’s capacity. - Page 90 ■ For Name, enter the recording’s name (up to 8 characters long). The name can include capital letters (A-Z), numbers (0-9), and symbols (&, _, and -). ■ Press the button to start the capture at the programmed time, if the SD card has enough space.
- Page 91 11.3 READING A CAPTURE ■ Select the capture from the list, and press the confirm button to open it Captures with red end dates may be unusable. Each entry in the capture list includes the capture’s name, number of inrush current detections, start date, start time, duration, and the channel that triggered the capture.
-
Page 92: Instantaneous Values
NOTE: The maximum duration of an RMS recording is 30 minutes. In this case, it can take up to about ten seconds to display the curves at the maximum duration. Capture of Inrush Current in RMS on 3A Maximum values The display Disc 2 is solid, which window’s position... - Page 93 ■ Use the ◄ ► buttons to move the cursor. The cursor allows you to view the values along the displayed curves. ■ Use the buttons to stretch or shrink the time scale. NOTE: The maximum duration of an RMS+WAVE recording is 10 minutes.
-
Page 94: Alarm Mode
12. ALARM MODE The Alarm mode detects and records overshoots of the selected quantities in configuration (see § 3.10.5) for a specified duration. The Model 8345 can record a large number of alarm recordings and is limited only by the SD card’s capacity. Each alarm recording can contain up to 20,000 alarms. - Page 95 For Max Count, you can have up to 20,000 alarms. ■ For Name, enter the recording’s name (up to 8 characters long). The name ■ can include capital letters (A-Z), numbers (0-9), and symbols (&, _, and -). Press to start the alarm recording at the programmed time. ■...
- Page 96 12.3 STARTING AN ALARM RECORDING Select an alarm recording from the list, and press the confirm button ■ open. To change the display filter, use the ▲ ▼ buttons. The available display filters ■ depend on the chosen distribution network and connection type. The alarm’s duration Beginning of the alarm...
-
Page 97: Monitoring Mode
13. MONITORING MODE The Monitoring mode monitors electrical networks per standard EN 50160. In this mode, the Model 8345 detects: ■ Slow variations ■ Rapid variations and interruptions ■ Voltage dips Temporary voltage swells ■ Transients ■ Therefore, a monitoring recording will trigger a trend recording, a search for transients, an alarm recording, and a log of events. - Page 98 2. Select the Configure monitoring option. The configuration window will open with 5 tabs: Monitoring ƒ Slow variations thresholds ƒ Interruptions and Rapid Voltage Changes (RVC) ƒ Voltage Dips and Swells ƒ Transients ƒ 3. In the Monitoring tab, indicate the nominal voltage, the frequency, and the name of the file that will contain the monitoring recording.
- Page 99 The Transients tab is used to configure a search for transients (see § 3.10.3). 1. Press OK to confirm the configuration and transfer it to the instrument. 2. Then, start the monitoring recording on the instrument by specifying its start time and duration. Press to program a monitoring recording.
- Page 100 13.2 THE LIST OF MONITORING RECORDINGS ■ Press to view a list of the previous monitoring recordings. Each entry in the list includes the recording's name, start date, start time, end date, and end time. Used memory To view different pages ■...
-
Page 101: Taking A Screenshot
14. SCREENSHOTS button is used to take screenshots and view recorded screenshots. The screenshots are recorded on the SD card in the directory 8345\Photograph. You can read the screenshots on a PC via the application software or an SD card reader (not provided). - Page 102 14.2.1 Display of a Screenshot ■ To display a screenshot, select it and press the confirm button The instrument will display the selected screenshot. To view the different The mode icon and screenshots that make alternate blinking up the photograph To erase the File name screenshot...
- Page 103 15. HELP button will give you information about the various button functions and symbols used for the in-progress display mode. Some modes, like Power mode, have three available help screens, while others, like Waveform mode, only have two help screens. Examples of a help screen in Power mode are below.
-
Page 104: Application Software
16.1 OBTAINING THE SOFTWARE The application software is available on the provided USB drive or on our website at www.aemc.com/dataview-software. To install the software 1. Insert the USB drive into your PC. An AutoPlay window will appear. If the AutoPlay window does not appear, use your PC’s file browser to locate... -
Page 105: Technical Specifications
17. TECHNICAL SPECIFICATIONS The Model 8345 complies with standard IEC 61000-4-30, Class A. 17.1 REFERENCE CONDITIONS Quantity of Influence Reference Conditions Ambient temperature 23 °C ± 3 °C Relative humidity (40 to 75) % RH Atmospheric pressure (860 to 1060) hPa Environmental <... - Page 106 Quantity of Influence Reference Conditions 3 phases available Phases (for three-phase systems) DC components of voltage and current Waveform Sine wave Electrical network frequency 50 Hz ± 0.5 Hz or 60 Hz ± 0.5 Hz ± 1 % Phase-to-neutral voltage Voltage amplitude between 100 V and 400 V Phase-to-phase voltage...
- Page 107 Nominal current (A ) depending on the sensor Nominal Full-Scale Full-Scale Technical Commercial Current Sensor Current RMS per Class A per Class A 100 A (14.14 to 16.97) A 30 A AmpFlex 1000 A (141.42 to 169.71) A 300 A ®...
-
Page 108: Electrical Specifications
17.2 ELECTRICAL SPECIFICATIONS 17.2.1 Input Voltage Specifications Range of Use (0 to 1000) V phase-neutral and neutral-earth (0 to 1700) V phase-phase without exceeding 1000 V with respect to earth Input Impedance 2 MΩ between phase and neutral 2 MΩ between neutral and earth Permanent Overload 1200 V phase-neutral and neutral-earth Temporary Overload... - Page 109 Waveform - Min-Max: ■ RMS measurements: 512 spc stream ■ Min, Max measurements: 40 kS/s stream ■ Pk+, Pk- measurements: 40 kS/s stream Transients: ■ 3U, 4V, 4A filters: 512 spc stream ■ L1, L2, L3, N filters: 512 spc stream ■...
- Page 110 Measurement Range Display without ratio Measurement Resolution Max Intrinsic Error (with unity ratio) (unity ratio) 2.000 V 999.9 V 4 digits ±(1.5 % + 500 mV) phase-to- Distorting neutral 1000 V 1414 V 4 digits ±(1.5 % + 1 V) Voltage 2.000 V 999.9 V...
- Page 111 Measurement Range Display without ratio Max Intrinsic Measurement Resolution (with unity ratio) Error (unity ratio) 1.000 A 47.09 A 4 digits ±(0.5 % + 200 mA) SR193 clamp 47.10 A 566.0 A 4 digits ±0.5 % MR193 clamp 566.1 A 1000 A 4 digits ±(0.5 % + 200 mA)
- Page 112 Measurement Range Display without ratio Max Intrinsic Measurement Resolution (with unity ratio) Error (unity ratio) SR193 clamp 1.000 A 1000 A 4 digits ±(1 % + 1 A) MR193 clamp MN93 clamp 200.0 mA 200.0 A 4 digits ±(1 % + 1 A) E94 clamp (10 mV/A) 200.0 mA...
- Page 113 Measurement Range Display without ratio Max Intrinsic Measurement Resolution (with unity ratio) Error (unity ratio) SR193 clamp 1.000 A 1414 A 4 digits ±(1 % + 2 A) MR193 clamp MN93 clamp 200.0 mA 282.8 A 4 digits ±(1 % + 2 A) E94 clamp (10 mV/A) 200.0 mA 141.4 A...
- Page 114 Measurement Range Display without ratio Max Intrinsic Measurement Resolution (11) (with unity ratio) Error (unity ratio) ±(1 % + 10 cts) |sin φ| ≥ 0.5 Without and THD ≤ 50 % AmpFlex ® 1.000 var 10.00 Mvar 4 digits ±(1.5 % + 10 cts) Reactive power MiniFlex ®...
- Page 115 Measurement Range Display without ratio Max Intrinsic Measurement Resolution (11) (with unity ratio) Error (unity ratio) ±(1 % + 10 cts) |sin φ| ≥ 0.5 Without and THD ≤ 50 % AmpFlex 9,999,999 up to ® 1 var·h Mvar·h 7 digits ±(1.5 % + 10 cts) Reactive energy MiniFlex...
- Page 116 17.2.4.3 Quantities Associated with Power Values Measurement Range Display Measurement Max Intrinsic Error Resolution Fundamental phase -179 ° 180 ° 0.1 ° ±2 ° differences cos φ (DPF, PF 4 digits ±5 cts tan φ -32.77 32.77 4 digits ±1 ° if THD < 50 % ±3 cts if u ≤...
- Page 117 Measurement Range Display Measurement Max Intrinsic Error Resolution 0.1 % ±(2 % + (n × 0.3 %) + 5 cts) Harmonic level of τ < 1000 % n ≤ 25 current (τ 1500 %f ±(2 % + (n × 0.6 %) + 5 cts) (with AmpFlex 100 %r ®...
- Page 118 Measurement Range Display Measurement Max Intrinsic Error Resolution ±(5 % + (n × 0.4 %) + 5 cts) ≤ 25 Harmonic loss factor 99.99 0.01 (FHL) ±(10 % + (n × 0.7 %) + 5 cts) > 25 ±(5 % + (n ×...
- Page 119 Measurement Display Range Measurement Resolution Max Intrinsic Error (with unity ratio) (unity ratio) n ≤ 25: ±(2 % + (n x 0.2 %) 4 digits SR193 clamp + 1 A) 1000 A n > 25: ±(2 % + (n x 0.5 %) MR193 clamp 4 digits + 1 A)
- Page 120 Measurement Display Range Measurement Resolution Max Intrinsic Error (with unity ratio) (unity ratio) 4 digits SR193 clamp 1000 A ±((n x 0.4 %) + 1 A MR193 clamp 4 digits MN93 clamp 200 mA 200 A 4 digits ±((n x 0.4 %) + 1 A MN193 clamp ±((n x 0.4 %) +...
- Page 121 17.2.5 Specifications of the Current Sensors You must add the measurement error on the RMS current and phase error to any instrument error for measurements that use the current measurements: powers, energies, power factors, tangents, etc. At 50/60 Hz Sensor Type Maximum RMS Current (A Maximum Error...
-
Page 122: Memory Card
Limitations of the AmpFlex and MiniFlex ® ® Like all Rogowski sensors, the AmpFlex and MiniFlex have output voltage that ® ® is proportional to the frequency. A high current at high frequency can saturate the instrument’s current input. To avoid saturation, you must meet the following condition: n=∞... -
Page 123: Power Supply
The file size will increase as the recording interval decreases and the recording duration increases. 17.4 POWER SUPPLY 17.4.1 Battery The instrument’s power supply unit is a 10.9 V, 5700 mA·h, Li-ion battery pack. Voltage 10.86 V Nominal capacity 5700 mA·h Minimum capacity 5500 mA·h 11 % after 200 charge-discharge cycles... -
Page 124: External Power Supply
17.4.2 External Power Supply You can connect the Model 8345 to an external power supply to charge the battery or conserve battery life. The instrument can operate while charging. The instrument has one compatible charger: PA32ER Nominal voltage and 1000 V CAT IV overvoltage category (100 to 1000) V Input voltage... -
Page 125: Display Conditions
17.5 DISPLAY CONDITIONS The display unit is an active matrix LCD (TFT) with the following specifications: Diagonal: 7 in (18 cm) Resolution: 800 pixels x 480 pixels (WVGA) Colors: 262,144 colors used for display Backlight: LED Field of view: 85 ° in all directions 17.6 ENVIRONMENTAL CONDITIONS The instrument must be used in the following environmental conditions. -
Page 126: Mechanical Specifications
17.7 MECHANICAL SPECIFICATIONS Dimensions (L x D x H): (7.87 x 11.22 x 2.17) in (200 x 285 x 55) mm Weight: 4.41 lb (2 kg) Display unit: (5.98 x 3.58) in (152 x 91) mm Display unit (diagonal): 7 in (178 mm) Index of protection: IP54 per IEC 60529 when the five elastomer caps are closed and no leads are ■... - Page 127 17.8.2 Standard IEC 61000-4-30, Class A All of the measurement methods, measurement uncertainties, measurement ranges, aggregations of measurements, flagging, and markings comply with the requirements of IEC 61000-4-30, edition 3.0, Amendment 1 (2021), for instruments of Class A. The Model 8345 performs measurements and calculations for the following. ■...
- Page 128 17.8.3 Measurement Uncertainties and Ranges Measurement Range of Quantity Parameter Uncertainty Range of Influence 50 Hz 42.5 Hz to 57.5 Hz network ∈ [100 V; 400 V] (V) Line frequency ± 10 mHz ∈ [200 V; 1000 V] (U) 60 Hz 51 Hz to 69 Hz network ∈...
-
Page 129: Electromagnetic Compatibility (Emc)
Measurement Range of Quantity Parameter Uncertainty Range of Influence Beginning ½ cycle Rapid voltage Duration 1 cycle changes ∈ [100 V; 400 V] (V) (RVC) ∈ [200 V; 1000 V] (U) ΔU ± 0.2 % U [1 % ; 6 %] U ½... - Page 130 17.10 RADIO EMISSIONS The instrument complies with directive RED 2014/53/EU and FCC regulations. The Wi-Fi module is certified in compliance with the FCC regulations under number XF6-RS9113SB. 17.11 GPL CODE The source codes are available under GNU GPL (General Public License). Power Quality Analyzer PowerPad IV Model 8345 - User Manual ®...
-
Page 131: Cleaning The Housing
18. MAINTENANCE Except for the batteries, the instrument contains no parts that can be replaced by untrained or unaccredited personnel. Any unapproved work or part replacement using equivalents may gravely compromise safety. 18.1 CLEANING THE HOUSING 1. Disconnect anything connected to the instrument. 2. -
Page 132: Replacing The Battery Pack
Precautions for replacing the battery pack: NOTE: Without a battery, the instrument's internal clock will continue to operate for at least 17 Stand hours. Only use the same model of ■ battery as a replacement. Battey Do not use a battery with a ■... -
Page 133: Updating The Firmware
The red indicator will light up. 4. Then, put the elastomer cap back in place. 18.5 UPDATING THE FIRMWARE To provide our customers the best possible service for performance and technical upgrades, AEMC Instruments offers free software and firmware updates on our ® website. -
Page 134: Repair And Calibration
If the instrument is returned for calibration, we need to know if you want a standard calibration or a calibration traceable to N.I.S.T. (includes calibration certificate plus recorded calibration data). Ship To: Chauvin Arnoux , Inc. d.b.a. AEMC Instruments ® ®... -
Page 135: Limited Warranty
Instruments, not by the distributor from whom it was purchased. This ® warranty is void if the unit has been tampered with, abused, or if the defect is related to service not performed by AEMC Instruments. ® Full warranty coverage and product registration is available on our website at www.aemc.com/warranty.html. - Page 136 19. APPENDICES This section has the formulas used to calculate the different parameters and the definitions for abbreviations. The formulas comply with standard IEC 61000-4-30, edition 3.0, Amendment 1 (2021), for Class A instruments and comply with IEEE 1459, 2010 edition, for the power formulas.
- Page 137 19.2 AGGREGATIONS IN TREND MODE Measurements recorded in trend mode come from sources sampled in two distinct ways, which are re-aggregated into a common flow intended for trend recordings. The source flows of measurements are: ■ The 40 kS/s flow (fixed sampling at 40 kHz) includes the measurements: Network frequency ƒ...
-
Page 138: Crest Factor
Furthermore, complying with Class A, every 10 minutes round, the intervals of 10/12 cycles and 150/180 cycles are resynchronized, with overlap of the 10/12 cycle interval which ends with the new one (overlap 1) and with overlap of the 150/180 cycle interval which ends with the new one (overlap 2). Synchronization of Aggregation Intervals for Class A (IEC 61000-4-30) 19.3 FORMULAS 19.3.1 RMS Values... - Page 139 19.3.4 Definitions Relating to Harmonics Rank of a Harmonic, h Ratio (integer) of a harmonic frequency to the fundamental frequency of the power supply network. In relation to the analysis carried out using a Fourier Transform and a synchronization between f and f (sampling frequency), the rank h of a harmonic corresponds to the spectral component: k = h ×...
- Page 140 19.3.6 Levels of Harmonics and Interharmonics The quantities are calculated in accordance with standard IEC 61000-4-7, edition 2.0 A1, Amendment 1 (2021), § 5.6. Level of harmonics referred to the RMS value of the fundamental (%f): Level of harmonics referred to the RMS value without DC (%r): Level of interharmonics referred to the RMS value of the fundamental (%f): Level of interharmonics referred to the RMS value without DC (%r): Where:...
- Page 141 Zero sequence voltage component: Inverse current component: Zero sequence current component: With: Voltage zero (or homopolar) Current zero (or homopolar) sequence unbalance sequence unbalance Voltage positive (or direct) Current positive (or direct) sequence sequence unbalance unbalance Voltage negative (or inverse) Current negative (or inverse) sequence unbalance sequence unbalance...
-
Page 142: Power Frequency
19.3.10 Distortion 19.3.11 K Factor and Harmonic Loss Factor These quantities concern only the current and are calculated in accordance with standard IEEE C57.110, 2004 edition, § B.1 and § B.2. The K-factor (KF) is a nominal value applied to a transformer to indicate its ability to be used with loads that consume non-sinusoidal currents: With IR = nominal current of the transformer Harmonic loss factor (FHL):... -
Page 143: Fundamental Active Power
19.3.14 Active Power (P) This quantity is calculated in accordance with standard IEEE 1459, 2010 edition, § 3.1.2.3. Active power, per phase: With V (n) and I (n) = instantaneous values of the V or I sample having index n in channel L. - Page 144 19.3.17 Harmonic Active Power (P This quantity is calculated in accordance with standard IEEE 1459, 2010 edition, § 3.1.2.5. The harmonic active power includes the DC component. Harmonic active power, per phase: Total harmonic active power: 19.3.18 DC Power (P DC power, per phase: With V and I...
- Page 145 19.3.21 Distorting Power (D) Distorting power, per phase: Total distorting power: 19.3.22 Power Factor (PF), Power Factor of Fundamental (PF1) These quantities are calculated in accordance with standard IEEE 1459, 2010 edition, § 3.1.2.16 and § 3.1.2.15. Power factor (PF), per phase: Total power factor (PF): Displacement Factor (DPF) or cos φ...
- Page 146 19.4 FLICKER The quantities are calculated in accordance with class F3 of standard IEC 61000-4-15, edition 2.0, § 4.7.3, § 4.7.4, and § 4.7.5. Flicker measures the human perception of the effects of fluctuations in the amplitude of the voltage supplying a lamp. These variations are caused mainly by reactive power fluctuations in the network caused by the connection and disconnection of devices.
- Page 147 19.6.1 Voltage Swell Detection At a hysteresis of 2 % for example, the reset point for a voltage swell detection will be (100 % - 2 %), or 98 % of the threshold voltage. Maximum Threshold Reset point Duration 19.6.2 Voltage Dip and Voltage Interruption Detection For a hysteresis of 2 % for example, the reset point in the context of dip detection will be (100 % + 2 %), or 102 % of the threshold voltage.
-
Page 148: Four-Quadrant Diagram
Minimum Scale Values Minimum RMS Values (Waveform mode) E94 clamp (100 mV/A) 80 mA 10 mA MN193 clamp (5 A) 40 mA 5 mA 5 A and Essailec adapters 40 mA 5 mA ® Value to be multiplied by the ratio in effect (if not unity) Scale value = (dynamic full scale) / 2 = (Max - Min) / 2 19.8 FOUR-QUADRANT DIAGRAM This diagram is used for power and energy measurements (see §... - Page 149 The cycle that precedes the event and the three cycles that follow it are stored in memory. The half-width of the virtual tube, for voltage or current, is equal to the threshold programmed in the Transient mode’s configuration (see § 3.10.3). Reference cycle (precedes monitored cycle) Top of virtual reference tube...
- Page 150 The triggering and stop conditions of captures are below: Filter Triggering and stop conditions Triggering condition <=> [half-cycle RMS value of A1] > [Triggering threshold] Stop condition <=> [half-cycle RMS value of A1] < [Stop; threshold] Triggering condition <=> [half-cycle RMS value of A2] > [Triggering threshold] Stop condition <=>...
- Page 151 19.13 GLOSSARY AC and DC components AC component only DC component only Inductive phase shift Capacitive phase shift ° Degree Expert mode Absolute values Phase difference of the phase-to-earth voltage (phase voltage) with φ respect to the phase-to-earth current (line current) Phase difference of the phase-to-phase voltage (line voltage) with φ...
- Page 152 Frequency range within which the response of an instrument is Bandwidth greater than minimum British thermal unit Crest factor for current or voltage: the ratio of peak current to RMS current A measurement channel corresponds to a difference of potential between two conductors.
- Page 153 A voltage reduction in the electrical network to below the Interruption interruption threshold Joule (unit) Kilo (10 K factor calculated per IEEE C57.110. A transformer’s ability to be used with loads that consume non-sinusoidal currents Line (channel) Milli (10 Mega (10 Maximum value calculated over either 10 cycles or 12 cycles depending on whether the frequency is 50 Hz or 60 Hz Minimum value calculated over either 10 cycles or 12 cycles...
- Page 154 Ton of oil equivalent (nuclear or non-nuclear) Total harmonic distortion is the percentage of harmonics in a signal, referred to the RMS value of the fundamental (%f) or to the total RMS value without DC (%r) Phase-to-phase voltage or voltage between phases Voltage zero (or homopolar) sequence unbalance ratio Voltage negative (or inverse) sequence unbalance ratio (neutral connected) or phase-to-phase voltage (neutral disconnected)
- Page 155 Phase-to-phase RMS voltage Coordinated Universal Time Total harmonic distortion of the phase-to-phase voltage Harmonic distortion of the phase-to-phase voltage referred to the thdf RMS value of the fundamental Harmonic distortion of the phase-to-phase voltage referred to the thdr total RMS value without DC Volt (unit), phase-to-earth voltage, or phase-to-neutral voltage Phase-to-earth voltage on phase 1 Phase-to-earth voltage on phase 2...
-
Page 156: Unit Prefixes
19.14 UNIT PREFIXES SI Unit Prefixes Prefix Symbol: Multiplies by Milli- Kilo- Mega- Giga- Tera- Peta- Exa- Power Quality Analyzer PowerPad IV Model 8345 - User Manual ®... - Page 157 NOTES:...
- Page 158 NOTES: Power Quality Analyzer PowerPad IV Model 8345 - User Manual ®...
- Page 159 NOTES: Power Quality Analyzer PowerPad IV Model 8345 - User Manual ®...
- Page 160 99-MAN 100563 v08 AEMC Instruments ® 15 Faraday Drive • Dover, NH 03820 USA Phone: +1 (603) 749-6434 • +1 (800) 343-1391 • Fax: +1 (603) 742-2346 www.aemc.com © 2022 Chauvin Arnoux , Inc. d.b.a. AEMC Instruments. All Rights Reserved. ® ®...
Need help?
Do you have a question about the PowerPad IV 8345 and is the answer not in the manual?
Questions and answers