Table of Contents
Advertisement
Quick Links
Power Debugger
Power Debugger
Preface
®
®
The Microchip Power Debugger is a powerful development tool for debugging and programming ARM
Cortex
-M
®
based Microchip SAM and Microchip AVR
microcontrollers using JTAG, SWD, PDI, UPDI, debugWIRE, aWire, TPI,
or SPI target interfaces.
In addition, the Microchip Power Debugger has two independent current sensing channels for measuring and
optimizing the power consumption of a design.
Microchip Power Debugger also includes a CDC virtual COM port interface as well as Microchip Data Gateway
Interface channels for streaming application data to the host computer from a SPI, USART, TWI, or GPIO source.
®
The Power Debugger is a CMSIS-DAP compatible debugger which works with MPLAB
X IDE, Atmel Studio 7.0, or
other front-end software capable of connecting to a generic CMSIS-DAP unit. The Power Debugger streams power
measurements and application debug data to Data Visualizer for real-time analysis.
A quick-start guide is included in the Power Debugger kit for convenience.
User Guide
DS40002201A-page 1
©
2020 Microchip Technology Inc.
Advertisement
Table of Contents

Related Manuals for Microchip Technology Power Debugger


Summary of Contents for Microchip Technology Power Debugger
-
Page 1: Preface
Microchip Power Debugger also includes a CDC virtual COM port interface as well as Microchip Data Gateway Interface channels for streaming application data to the host computer from a SPI, USART, TWI, or GPIO source. -
Page 2: Kit Contents
Power Debugger Info: Frequent updates of the Power Debugger firmware are provided in order to improve its features, and to provide support for new MCUs. If required, refer to Appendix A to upgrade the Power Debugger firmware. Kit Contents The Power Debugger kit contains: •... -
Page 3: Table Of Contents
Power Debugger Table of Contents Preface................................1 Kit Contents..........................2 Getting Started with the Power Debugger....................5 Connecting the Power Debugger......................7 ® 2.1. Connecting to AVR and SAM Target Devices................7 Detailed Use Cases..........................9 3.1. Low-Power Application.........................9 3.2. USB-Powered Application......................29 On-chip Debugging.......................... - Page 4 Power Debugger Quality Management System........................88 Worldwide Sales and Service........................89 User Guide DS40002201A-page 4 © 2020 Microchip Technology Inc.
-
Page 5: Getting Started With The Power Debugger
Getting Started with the Power Debugger Getting Started with the Power Debugger Getting started with the Power Debugger is simple, especially if one is familiar with the Atmel-ICE programmer and debugger or any of the Microchip Xplained Pro kits. User Guide DS40002201A-page 5 ©... - Page 6 Tip: The Quick Start Guide shown here is included with the kit for convenience. The use case section contains descriptions of how the Power Debugger can be put to use analyzing power consumption in a number of scenarios. For a quick and easy introduction to Power Debugging, select the use case which closest matches your current project or available boards.
-
Page 7: Connecting The Power Debugger
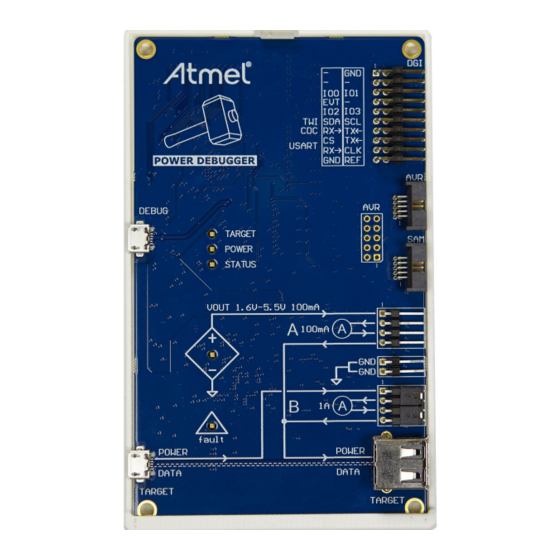
10-pin ARM Cortex debug pinout. VOUT: Optionally provide power from the Power Debugger to the target in the range 1.6V to 5.5V. Up to 100 mA can be sourced. Voltage output is configured using the software front-end, and current is sourced from the DEBUG USB connector. - Page 8 Power Debugger Connecting the Power Debugger Figure 2-1. Power Debugger Connection Options 10-pin 50-mil JTAG/SWD 20-pin 100-mil SAM 10-pin 50-mil AVR JTAG header (Cortex debug header) header (for EVKs etc) 6-pin 50-mil AVR ISP/PDI/ debugWIRE/aWire/TPI header 6-pin 100-mil AVR ISP/PDI/ debugWIRE/aWire/TPI header...
-
Page 9: Detailed Use Cases
Detailed Use Cases A collection of use cases for the Power Debugger are outlined here. Each use case sets out to solve a given problem in a certain scenario, and then provides a detailed account of how this can be achieved using the Power Debugger. - Page 10 To do: Mount power rail header on the Xplained Mini board. We will make use of code instrumentation to send data from the Xplained Mini board to the Power Debugger DGI. To do this we need access to PORTD features on the target MCU.
- Page 11 Once the hardware modifications have been made we are ready to connect the Power Debugger to the target. To measure the current on the ATmega328PB device you will have to route its supply through the Power Debugger. With the FET switch set to OFF, the ATmega328PB device has no target power source. To route the 5V Xplained Mini supply voltage through the A channel and into the ATmega328PB device’s supply rail:...
- Page 12 OR the output value with 0x40 (DWEN is bit 6) • Write the value back to the high fuse (offset 1) atprogram.exe -t powerdebugger -i isp -d atmega328pb write -fs -o 1 --values <new_fuse_value> User Guide DS40002201A-page 12 © 2020 Microchip Technology Inc.
- Page 13 DDRB = (1 << 5); // Do forever: while (1) { // PORTB5 on PORTB = (1 << 5); // Short delay delay(50); // PORB5 off PORTB = 0x00; // Long delay delay(5000); User Guide DS40002201A-page 13 © 2020 Microchip Technology Inc.
- Page 14 Toolchain → AVR/GNU C Compiler → Optimization. To do: Build the project/solution (F7). To do: Program the application into the target by selecting Start Without Debugging (Ctrl+Alt+F5). LED0 on the mEDBG kit should now start to blink. User Guide DS40002201A-page 14 © 2020 Microchip Technology Inc.
- Page 15 If the stand-alone version of the Data Visualizer has been installed, look for the shortcut in the Windows start menu. The stand-alone version is available for download from gallery.microchip.com. 3.1.8 Basic Current Measurement To do: Select the correct tool in the DGI Control Panel. User Guide DS40002201A-page 15 © 2020 Microchip Technology Inc.
- Page 16 Power Debugger Detailed Use Cases To do: Connect to the DGI on the selected tool. To do: Enable the Power interface and modify its settings to monitor the relevant channels. User Guide DS40002201A-page 16 © 2020 Microchip Technology Inc.
- Page 17 The kit draws about 17 mA with the LED OFF • Current draw increases to about 20 mA when the LED is pulsed ON • The 1% duty cycle seems approximately correct User Guide DS40002201A-page 17 © 2020 Microchip Technology Inc.
- Page 18 • Is debugWIRE (DWEN) disabled? • If the ‘Fault’ LED on the Power Debugger is ON, check your wiring and soldering one more time 3.1.10 Reducing the Clock Frequency Now let’s look at how we can reduce the power consumption of the application, and verify that it is improved.
- Page 19 Current draw increases to about 9 mA when the LED is pulsed ON • The 1% duty cycle still seems approximately correct Result: Power consumption has been significantly improved by clocking the device slower. User Guide DS40002201A-page 19 © 2020 Microchip Technology Inc.
- Page 20 // Timer2 DIV 1024 TCCR2B = (1 << CS22) | (1 << CS21) | (1 << CS20); // Overflow interrupt enable TIMSK2 = (1 << TOIE2); // Interrupts on sei(); while (1) { set_sleep_mode(SLEEP_MODE_PWR_SAVE); User Guide DS40002201A-page 20 © 2020 Microchip Technology Inc.
- Page 21 Current draw increases to about 7 mA when the LED is pulsed ON • The 1% duty cycle still seems approximately correct Result: Power consumption has again been improved by using Sleep mode and disabling unused peripherals. User Guide DS40002201A-page 21 © 2020 Microchip Technology Inc.
- Page 22 DDRB = (1 << 5); // Watchdog reset wdt_reset(); // Start timed sequence WDTCSR |= (1<<WDCE) | (1<<WDE); // Set new prescaler(time-out) value = 64K cycles (~0.5s) WDTCSR = (1<<WDIE) | (1<<WDP2) | (1<<WDP1); User Guide DS40002201A-page 22 © 2020 Microchip Technology Inc.
- Page 23 Important: Because the previous example prescaled the clock to 8 MHz/64, the ISP programming clock must be set to less than 32 kHz to be below 1/4 of the main clock. Important: Remember to disable on-board power on the Xplained Mini. User Guide DS40002201A-page 23 © 2020 Microchip Technology Inc.
- Page 24 DIV64 CLKPR, and DIV32 on TIMER2, giving it a 128 μs tick. With overflow every 256 cycles the LED on period is thus 32.7 ms, close to our measurement. So to achieve a 1% duty-cycle TIMER2 preload value can be increased from 0x00 to 0xB2. User Guide DS40002201A-page 24 © 2020 Microchip Technology Inc.
- Page 25 Finally, in this section we will look at some other tricks which the Data Visualizer is capable of. Aside from taking current measurements, the Power Debugger has a full Data Gateway Interface (DGI) port for streaming data from the target to the host computer. We will hook this up to the USART for simple console output.
- Page 26 = 0; void usart_send (const char data) // Send a character to the USART UDR0 = data; // Wait for the character to be sent while (!(UCSR0A & (1 << TXC0))) User Guide DS40002201A-page 26 © 2020 Microchip Technology Inc.
- Page 27 Switch to Data Visualizer to see the results 3.1.13.1 Enable USART Interface To do: • Check the USART checkbox • Open the USART Configuration dialog by pushing the gear button next to the USART checkbox User Guide DS40002201A-page 27 © 2020 Microchip Technology Inc.
- Page 28 • Add a Terminal view to the Visualizer • Drag the source connector from the interface in the DGI Control Panel into the sink for the Terminal to make a connection User Guide DS40002201A-page 28 © 2020 Microchip Technology Inc.
-
Page 29: Usb-Powered Application
USB-Powered Application This use case will show you how to make use of the USB “pass-through” connectors on the Power Debugger. We will use a SAM L21 Xplained Pro kit as an example of a USB-powered product, where the designer is interested in both total power consumed over the USB port and that consumed by the target device on the board. - Page 30 To do: • Connect VCC_TARGET on the target board to the input of the A channel • Connect the output of the A channel to the VCC_MCU pin of the target board User Guide DS40002201A-page 30 © 2020 Microchip Technology Inc.
- Page 31 Detailed Use Cases To make use of GPIO instrumentation: The Power Debugger has four GPIO channels, which can be monitored in Data Visualizer. We can then add pin toggles into the application code and view these events in Data Visualizer.
- Page 32 VOUT Target Supply The Power Debugger can supply voltage to a target in the range of 1.6V to 5.5V, up to 100 mA. The voltage will be applied to the pin as shown in the silkscreen, and must be routed to the appropriate load by the user. VOUT can be set in a number of ways.
- Page 33 The VOUT set-point can be read back using: atprogram.exe -t powerdebugger parameters -tssp 3.2.4.3 Setting VOUT Using Data Visualizer VOUT can be set using Data Visualizer by opening the configuration for the Power interface. User Guide DS40002201A-page 33 © 2020 Microchip Technology Inc.
- Page 34 3.2.5 Using Both Measurement Channels The two current measurement channels of the Power Debugger are useful when analyzing current consumption of two different domains. For example, both board-level current draw and MCU-only current draw can be plotted. To best demonstrate a USB hardware device, we will make use of a Mass Storage Device example from ASF.
- Page 35 (unless disabled in the Power Configuration). On the Control panel on the right of the module the user can show or hide the current and voltage plots as well as range information when available. User Guide DS40002201A-page 35 © 2020 Microchip Technology Inc.
- Page 36 The red graph is channel B, and represents the current drawn by the entire board. It appears to toggle between two modes at about 1-second intervals. This is the LED toggling ON and OFF. User Guide DS40002201A-page 36 © 2020 Microchip Technology Inc.
- Page 37 Goto Implementation option on the context menu. Add instrumentation as shown here, which toggles GPIO0 for read accesses and GPIO1 for write accesses: void ui_start_read(void) // GPIO0 high User Guide DS40002201A-page 37 © 2020 Microchip Technology Inc.
- Page 38 Program the application into the target device using Start Without Debugging (Ctrl + Alt + F5) • Switch to Data Visualizer to see the results • Select both the Power interface and GPIO and start visualizing User Guide DS40002201A-page 38 © 2020 Microchip Technology Inc.
- Page 39 Tip: Read caching by the operating system might cause read access not to be executed until the cache is flushed after a write. 3.2.11 Code Correlation We will now demonstrate how program counter polling can be used to correlate code execution to power consumption. User Guide DS40002201A-page 39 © 2020 Microchip Technology Inc.
- Page 40 Detailed Use Cases The Power Debugger can be instructed by Data Visualizer to repeatedly poll the Program Counter (PC) as fast as possible during execution. While this will yield a very low percentage of code lines traced, it can be useful in trapping areas of code which use more power than intended.
- Page 41 Hovering over one of the samples shows the location of that sample in the Code Location Details box below the graph, as well as the value of the current consumption sample at that point. Zooming in on one of the larger current peaks, we might see something like this: User Guide DS40002201A-page 41 © 2020 Microchip Technology Inc.
- Page 42 CPU briefly. The interrupt is executed too quickly to be caught on all executions. The larger current spikes are often associated with another USB function (csw_send / receive). Double clicking on one of the Program Counter samples will open the editor and highlight the line corresponding to that sample. User Guide DS40002201A-page 42 © 2020 Microchip Technology Inc.
- Page 43 First, add a few lines of code containing variables to poll. To do: Open ui.c and add two global variables to the top of the file. volatile uint32_t write_count = 0; volatile uint32_t read_count = 0; User Guide DS40002201A-page 43 © 2020 Microchip Technology Inc.
- Page 44 Launch the debug session using Start Debugging and Break (Alt + F5) Data polling operates on SRAM locations, so to find out where variables are located in SRAM we need to use the Atmel Studio Watch window. User Guide DS40002201A-page 44 © 2020 Microchip Technology Inc.
- Page 45 3.2.12.2 Add Data Polling Locations To do: • Click the Add Memory Location button for each memory location to be added • Fill in the address and format of each location User Guide DS40002201A-page 45 © 2020 Microchip Technology Inc.
- Page 46 There are now sources (variables) and sinks (axes), to be connected together. To do: Drag each of the source plugs on the Code Profiling interface into the New plot (sink) jack of each axis. User Guide DS40002201A-page 46 © 2020 Microchip Technology Inc.
- Page 47 Look at the output in the graph in Data Visualizer. Format the disk and watch how the write cycles counter increments. Both values are plotted on independent axes, so they can be scaled accordingly. The output should look something like this: User Guide DS40002201A-page 47 © 2020 Microchip Technology Inc.
- Page 48 Launch a debug session using Start Debugging and Break (Alt + F5) • Find the location of the variable uint32_t frame_comparator To do: • Open Data Visualizer • Connect • Add the location of the frame_comparator in the Code Profiling Configuration window User Guide DS40002201A-page 48 © 2020 Microchip Technology Inc.
- Page 49 3.2.13.2 Configure Dashboard A slider control can now be added to the dashboard. To do: • Select the Edit checkbox • Open the Elements tab • Drag a Slider element onto the dashboard User Guide DS40002201A-page 49 © 2020 Microchip Technology Inc.
- Page 50 A segment display control can now be added to the dashboard. To do: • Select the Edit checkbox • Open the Elements tab • Drag a Segment Display element onto the dashboard User Guide DS40002201A-page 50 © 2020 Microchip Technology Inc.
- Page 51 To do: • Deselect the Edit checkbox • Select the Show Endpoints checkbox • Connect sources to sinks by dragging each source plug and drop it on a sink User Guide DS40002201A-page 51 © 2020 Microchip Technology Inc.
- Page 52 LED blink frequency changes. Any change in the slider position will be sent to the target device through the debug interface, and a new value stored in the variable. At the same time, the value is also read back from the target and displayed on the segment display. User Guide DS40002201A-page 52 © 2020 Microchip Technology Inc.
-
Page 53: On-Chip Debugging
Run Mode When in Run mode, the execution of code is completely independent of the Power Debugger. The Power Debugger will continuously monitor the target device to see if a break condition has occurred. When this happens the OCD system will interrogate the device through its debug interface, allowing the user to view the internal state of the device. - Page 54 Reset (optional). Used to reset the target device. Connecting this pin is recommended since it allows the Power Debugger to hold the target device in a Reset state, which can be essential to debugging in certain scenarios. Target voltage reference. The Power Debugger samples the target voltage on this pin in order to power the level converters correctly.
- Page 55 TMS and TCK are connected in parallel; TDI and TDO are connected in a serial chain. • nSRST on the Power Debugger probe must be connected to RESET on the devices if any of the devices in the chain disables its JTAG port •...
- Page 56 Use the 50-mil 10-pin flat cable (included in some kits) to connect directly to a board supporting this header type. Use the AVR connector port on the Power Debugger for headers with the AVR pinout, and the SAM connector port for headers complying with the ARM Cortex Debug header pinout.
- Page 57 JTAG connectors are, however, not pin-compatible, so this depends upon the layout of the target board in use. When using an STK600 or a board making use of the AVR JTAG pinout, the AVR connector port on the Power Debugger must be used.
-
Page 58: Avr Uc3 Devices With Jtag/Awire
ARM core. The ERASE pin is NOT part of any debug header, and the Power Debugger is thus unable to assert this signal to unlock a device. In such cases the user should perform the erase manually before starting a debug session. - Page 59 Reset (optional). Used to reset the target device. Connecting this pin is recommended since it allows the Power Debugger to hold the target device in a Reset state, which can be essential to debugging in certain scenarios. Target voltage reference. The Power Debugger samples the target voltage on this pin in order to power the level converters correctly.
- Page 60 TMS and TCK are connected in parallel; TDI and TDO are connected in a serial chain. • nSRST on the Power Debugger probe must be connected to RESET on the devices if any of the devices in the chain disables its JTAG port •...
- Page 61 Use the 50-mil 10-pin flat cable (included in some kits) to connect directly to a board supporting this header type. Use the AVR connector port on the Power Debugger for headers with the AVR pinout, and the SAM connector port for headers complying with the ARM Cortex Debug header pinout.
- Page 62 Use the adapter board (included in some kits) to connect to a standard 50-mil aWire header. Connection to a custom 100-mil Header The 10-pin mini-squid cable should be used to connect between the Power Debugger AVR connector port and the target board. Three connections are required, as described in the table below.
- Page 63 4.3.7 EVTI / EVTO Usage The EVTI and EVTO pins are not accessible on the Power Debugger. However, they can still be used in conjunction with other external equipment. EVTI can be used for the following purposes: •...
-
Page 64: Tinyavr ® , Megaavr ® , And Xmega ® Devices
4.4.2 Connecting to a JTAG Target The Power Debugger is equipped with two 50-mil 10-pin JTAG connectors. Both connectors are directly electrically connected, but conform to two different pinouts; the AVR JTAG header and the ARM Cortex Debug header. The... - Page 65 Use the 50-mil 10-pin flat cable (included in some kits) to connect directly to a board supporting this header type. Use the AVR connector port on the Power Debugger for headers with the AVR pinout, and the SAM connector port for headers complying with the ARM Cortex Debug header pinout.
- Page 66 Use the adapter board (included in some kits) to connect to a standard 50-mil SPI header. Connection to a Custom 100-mil Header The 10-pin mini-squid cable should be used to connect between the Power Debugger AVR connector port and the target board. Six connections are required, as described in the table below.
- Page 67 When designing an application PCB, which includes an Microchip AVR with the PDI interface, the pinout shown in the figure below should be used. One of the 6-pin adapters provided with the Power Debugger kit can then be used to connect the Power Debugger probe to the application PCB.
- Page 68 When designing an application PCB, which includes an Microchip AVR with the UPDI interface, the pinout shown below should be used. One of the 6-pin adapters provided with the Power Debugger kit can then be used to connect the Power Debugger probe to the application PCB.
- Page 69 Use the adapter board (included in some kits) to connect to a standard 50-mil UPDI header. Connection to a Custom 100-mil Header The 10-pin mini-squid cable should be used to connect between the Power Debugger AVR connector port and the target board. Three connections are required, as described in the table below.
- Page 70 Power Debugger On-chip Debugging Table 4-15. Power Debugger TPI Pin Mapping Power Debugger AVR PORT Pins Target Pins Mini-Squid Pin TPI Pinout Pin 1 (TCK) CLOCK Pin 2 (GND) Pin 3 (TDO) DATA Pin 4 (VTG) Pin 5 (TMS) Pin 6 (nSRST)
- Page 71 If such code is already executing on the Microchip AVR device when starting a debug session, the Power Debugger will assert the RESET line while connecting. If this line is wired correctly, it will force the target AVR device into Reset, thereby allowing a JTAG connection.
- Page 72 Be sure to check the “use external reset” checkbox in both the programming dialog and debug options dialog in Atmel Studio in order to allow the Power Debugger to assert the RESET line and re-enable the JTAG interface on devices which are running code which disables the JTAG interface by setting the JTAG disable bit.
- Page 73 If such code is already executing on the Microchip AVR device when starting a debug session, the Power Debugger will assert the RESET line while connecting. If this line is wired correctly, it will force the target AVR device into Reset, thereby allowing a JTAG connection.
- Page 74 • Try to minimize on the number of breakpoint additions and removals, as each one require a FLASH page to be replaced on the target User Guide DS40002201A-page 74 © 2020 Microchip Technology Inc.
- Page 75 On devices which include the CRCSCAN module (Cyclic Redundancy Check Memory Scan), this module should not be used in Continuous Background mode while debugging. The OCD module has limited hardware breakpoint User Guide DS40002201A-page 75 © 2020 Microchip Technology Inc.
- Page 76 If the UPDI pin is used as RESET or GPIO pin, all external drivers on the line must be disconnected during programming or debugging since they may interfere with the correct operation of the interface User Guide DS40002201A-page 76 © 2020 Microchip Technology Inc.
-
Page 77: Hardware Description
TARGET TARGET Power is supplied to the Power Debugger from the USB bus connected to the DEBUG port, regulated to 3.3V by a step-down switch-mode regulator. The VTG pins are used as a reference input-only, and a separate power supply feeds the variable-voltage side of the on-board level converters. -
Page 78: Programming And Debugging
ESD protection diodes. All signal channels can be operated in the range 1.62 to 5.5V, although the Power Debugger hardware itself can not drive out a higher voltage than 5.0V. Maximum operating frequency varies according to the target interface in use. -
Page 79: Target Voltage Supply (Vout)
Power Debugger. Target Voltage Supply (VOUT) The Power Debugger has an on-board voltage supply capable of providing up to 100 mA in the range 1.6V to 5.5V from the USB DEBUG connector. -
Page 80: Cdc Interface
Power Debugger. CDC Interface The Power Debugger includes a standard CDC virtual COM port interface. The CDC header is part of the 20-pin DGI header, although logically it is a separate interface. Important: The arrows on the silkscreen shows data directions. The arrow pointing to the left is a receiver channel to which the user connects the target’s TX. - Page 81 Routing USB power from the TARGET USB connector through the A channel for measurement Use a single wire to connect POWER to the A channel and a jumper to connect the output as shown here. User Guide DS40002201A-page 81 © 2020 Microchip Technology Inc.
- Page 82 Sourcing USB power from the DEBUG USB connector through the variable voltage source through the B channel Use a single wire to connect POWER to the B channel and a jumper to connect the output as shown here. User Guide DS40002201A-page 82 © 2020 Microchip Technology Inc.
-
Page 83: Leds
Hardware Description LEDs The Power Debugger has five LEDs, which indicate the status of the tool. The debug LEDs are identical in function to those on Atmel-ICE and previous debugger hardware. For those familiar with the Atmel-ICE debugger, the entire central section of the Power Debugger resembles the Atmel-ICE. -
Page 84: Product Compliance
The Power Debugger and all accessories are manufactured in accordance to both the RoHS Directive (2002/95/EC) and the WEEE Directive (2002/96/EC). CE and FCC The Power Debugger unit has been tested in accordance to the essential requirements and other relevant provisions of Directives: •... -
Page 85: Firmware Release History And Known Issues
Running current measurements in Data Visualizer while programming or debugging at low interface frequencies/ baud rates might result in Data Visualizer disconnecting from the Power Debugger. The lower limit of the interface speed varies depending on target type, Flash size, and interface type, but is typically in the range 100-300 kHz. -
Page 86: Revision History
Updated quick start guide • Added debug cable pinout • Reworked firmware revision history table • Several minor updates and corrections 42696B 03/2015 Internal version not published. 42696A Initial document release. User Guide DS40002201A-page 86 © 2020 Microchip Technology Inc. -
Page 87: The Microchip Website
Information contained in this publication regarding device applications and the like is provided only for your convenience and may be superseded by updates. It is your responsibility to ensure that your application meets with User Guide DS40002201A-page 87 © 2020 Microchip Technology Inc. -
Page 88: Trademarks
The Adaptec logo, Frequency on Demand, Silicon Storage Technology, and Symmcom are registered trademarks of Microchip Technology Inc. in other countries. GestIC is a registered trademark of Microchip Technology Germany II GmbH & Co. KG, a subsidiary of Microchip Technology Inc., in other countries. - Page 89 New York, NY Tel: 46-31-704-60-40 Tel: 631-435-6000 Sweden - Stockholm San Jose, CA Tel: 46-8-5090-4654 Tel: 408-735-9110 UK - Wokingham Tel: 408-436-4270 Tel: 44-118-921-5800 Canada - Toronto Fax: 44-118-921-5820 Tel: 905-695-1980 Fax: 905-695-2078 User Guide DS40002201A-page 89 © 2020 Microchip Technology Inc.
Need help?
Do you have a question about the Power Debugger and is the answer not in the manual?
Questions and answers