Table of Contents
Advertisement
Quick Links
Advertisement
Table of Contents

Related Manuals for AEMC PowerPad 8436


Summary of Contents for AEMC PowerPad 8436
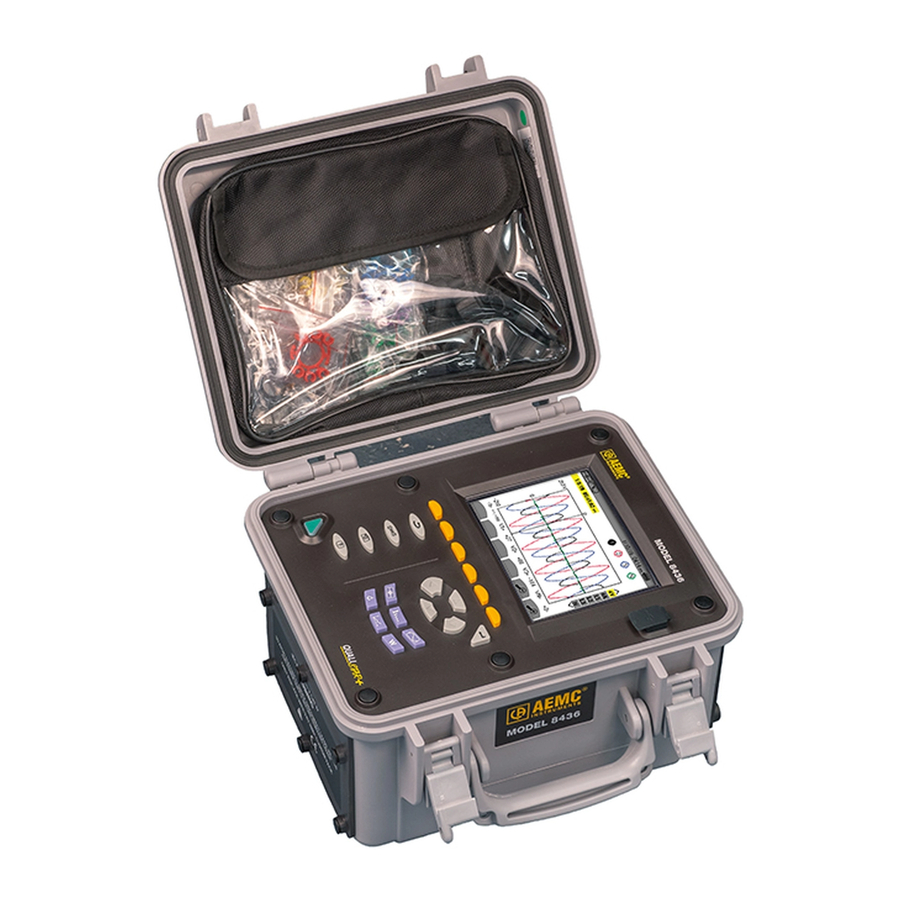
- Page 1 8436 3-PHASE POWER QUALITY ANALYZER ® PowerPad E N G L I S H User Manual...
- Page 2 The recommended calibration interval for this instrument is 12 months and begins on the date of receipt by the customer. For recalibration, please use our calibration services. Refer to our repair and calibration section at www.aemc.com. Serial #: Catalog #: 2136.43/2136.44...
- Page 3 ® Thank you for purchasing a PowerPad III Model 8436. For best results from your instrument and for your safety, read the enclosed operating instructions carefully and comply with the precautions for use. These products must be only used by qualified and trained users.
-
Page 4: Table Of Contents
CONTENTS 1. INTRODUCTION ........................................7 1.1. DELIVERY CONDITION ....................................7 1.2. ORDERING INFORMATION ....................................7 1.3. ACCESSORIES .......................................7 1.4. REPLACEMENT PARTS ....................................7 1.5. BATTERY CHARGING .....................................8 1.6. LANGUAGE SELECTION ....................................9 2. DESCRIPTION......................................... 10 2.1. FUNCTIONS ........................................10 2.1.1. MEASUREMENTS ..................................... 10 2.1.2. DISPLAY FUNCTIONS ..................................11 2.1.3. - Page 5 5. WAVEFORM CAPTURE ......................................40 5.1. TRANSIENT MODE ....................................... 40 5.1.1. CONFIGURING AND STARTING A SEARCH ............................. 41 5.1.2. DISPLAYING A TRANSIENT ................................41 5.1.3. DELETING A SEARCH FOR TRANSIENTS ............................42 5.1.4. DELETE A TRANSIENT ..................................42 5.2. INRUSH CURRENT MODE .................................... 43 5.2.1.
- Page 6 10. POWER AND ENERGY MODE ....................................74 10.1. 3L FILTER ........................................74 10.1.1. POWERS DISPLAY SCREEN................................74 10.1.2. QUANTITIES ASSOCIATED WITH THE POWERS DISPLAY SCREEN ..................... 74 10.1.3. ENERGIES CONSUMED DISPLAY SCREEN ............................. 75 10.1.4. ENERGIES GENERATED DISPLAY SCREEN ........................... 75 10.2.
-
Page 7: Introduction
INTRODUCTION 1.1. DELIVERY CONDITION ® NOTE: After receiving your PowerPad III Model 8436, charge and discharge the instrument one or two cycles to ensure the battery indicator is accurate. Ensure the contents shipped are consistent with the packing list. Notify your distributor of any missing items. If the equipment appears damaged, file a claim immediately with the carrier and notify your distributor at once. -
Page 8: Battery Charging
1.5. BATTERY CHARGING Before first use, fully charge the battery. 120 V ± 10 %, 60 Hz Remove the connector cover on the instrument (see Figure 1-1). 230 V ± 10 %, 50 Hz Connect the AC power cord and screw it in place. Plug the power cord into a power outlet. -
Page 9: Language Selection
1.6. LANGUAGE SELECTION Before using the instrument, choose the language in which you want the instrument to display its messages. 1. Press the button to turn the instrument ON. 2. Press the Configuration button. This displays the Configuration menu (Figure 1-4). 3. -
Page 10: Description
DESCRIPTION 2.1. FUNCTIONS The Model 8436 a three-phase network analyzer with color graphic display and built-in rechargeable battery. The instrument: ■ measures RMS values, powers, and perturbations of electric distribution networks ■ delivers a snapshot of the principal characteristics of a three-phase network ■... -
Page 11: Display Functions
2.1.2. DISPLAY FUNCTIONS ■ Waveforms (voltages and currents). ■ Frequency bar chart (voltages and currents). ■ Inrush Current function: displays parameters useful for study of the starting of a motor. • Instantaneous current and voltage at the instant designated by the cursor. •... -
Page 12: Instrument Interface
2.2. INSTRUMENT INTERFACE Figure 2-1 Cover ON/OFF button LCD display Help button Measurement connection terminals Screen snapshot button USB socket Configuration button Confirm/Enter button Return /previous button Navigation buttons Function (yellow) buttons Battery compartment and memory card slot cover Battery charging connector Mode buttons... -
Page 13: On/Off Button
2.3. ON/OFF BUTTON The instrument can operate either on its battery or on external power. Pressing the button powers ON the instrument. If the instrument is shut off suddenly (line power outage in the absence of the battery) or automatically (battery low), an information message is displayed the next time it is started. -
Page 14: Function Buttons
2.4.2. FUNCTION BUTTONS The display uses the following icons for the yellow function buttons: Icon Function Icon Function Phase-to-neutral voltage mode. Transient list display filter activate/deactivate. Phase-to-neutral current mode. Maximum/minimum display. Move the cursor to the first occurrence of the Power mode. -
Page 15: Keypad Buttons
2.5. KEYPAD BUTTONS 2.5.1. FUNCTION (YELLOW) BUTTONS These six buttons activate the function or tool represented by the corresponding icon on the screen. 2.5.2. NAVIGATION BUTTONS A block of four arrow buttons, a select button and a Return button are used for navigating menus. Button Function Up arrow. -
Page 16: Other Buttons
2.5.4. OTHER BUTTONS Button Function Configuration. § 4 Snapshot of current screen and retrieval of screens already stored. § 11 Help: provides information about the currently displayed functions and symbols. § 12 2.6. CONNECTORS 2.6.1. CONNECTION TERMINALS These are located on one side of the housing. Each terminal is protected by a plug. The plugs must be removed to connect the leads, then stowed in the pouch in the cover of the instrument. -
Page 17: Side Connectors
2.6.2. SIDE CONNECTORS On the right side of the instrument is the connector used to charge the battery and operate the instrument on AC power, or supply it from the voltages on the measurement terminals. Figure 2-4 2.7. POWER SUPPLY The battery icon in the top right corner of the screen shows the battery charge level. - Page 18 Symbols used by the instrument: Symbol Definition Symbol Definition AC and DC components. Non-active power. AC component only. Non-active energy. DC component only. Active power. Inductive phase shift. DC power. Pdch Capacitive phase shift. DC energy. Maximum (+) or minimum (-) peak instantaneous °...
-
Page 19: Operation
OPERATION 3.1. START-UP To turn the instrument ON, press the button. After the software check, the home page is displayed, followed by the information screen that indicates the software version of the instrument and its serial number. The Waveform screen is then displayed: Figure 3-1 3.2. -
Page 20: Leads Installation
3.3. LEADS INSTALLATION To identify the leads and input terminals, you can mark them in accordance with the usual phase/neutral color code using the colored rings and inserts supplied with the instrument. Detach the insert and place it in the hole provided for it near the terminal (large insert for a current terminal; small insert for a voltage terminal). -
Page 21: Single-Phase Network
3.3.1. SINGLE-PHASE NETWORK Figure 3-3 (2-wire single-phase connection) Figure 3-4 (3-wire single-phase connection) 3.3.2. SPLIT-PHASE NETWORK Figure 3-5 (2-wire split-phase connection) Figure 3-6 (3-wire split-phase connection) Figure 3-7 (4-wire split-phase connection) 3.3.3. THREE-PHASE NETWORK Figure 3-8 (3-wire three-phase connection) Figure 3-9 (4-wire three-phase Figure 3-10 (5-wire three-phase connection) -
Page 22: Connection
3.3.4. CONNECTION Turn the instrument ON. Configure the instrument for the measurement to be made and the network type (see §4). Connect the leads and current sensors to the instrument. Connect the ground and/or neutral lead to the network ground and/or neutral (when it is distributed) and connect the corresponding current sensor. -
Page 23: Configuration
CONFIGURATION The Configuration button displays the Configuration menu for configuring the instrument. This must be done before each new type of measurement. The configuration remains in memory, even after the instrument is turned OFF. 4.1. CONFIGURATION MENU The arrow (, , , ) buttons let you navigate the Configuration menu and select settings. A value that can be modified is identified by arrows. -
Page 24: Display
4.4. DISPLAY Display menu lets you set options that affect the instrument display screen, including: ■ Brightness level (§4.4.1) ■ Display colors (§4.4.2) ■ Automatic shutdown of screen (§4.4.3) ■ Night mode (§4.4.4) To open Display mode, select the Display option in the Configuration screen and press . This opens the Brightness screen (Figure 4-3). -
Page 25: Night Mode
Use the arrow (, ) buttons to choose Automatic or Never. When Automatic is selected, the display screen turns OFF after five minutes without button activity (if the instrument is powered only by its battery and if recording is in progress) and after ten minutes if no recording is in progress. -
Page 26: Units Of Energy
4.5.2. UNITS OF ENERGY The Wh Energy Unit menu defines the unit of display of energies. At the Non-Active Values screen (Figure 4-7), press the Wh function button to display the Energy Unit screen. Figure 4-8 Use the arrow buttons (, ) to select the unit: ■... -
Page 27: Phase Harmonics
4.5.4. PHASE HARMONICS The %f-%r Phase Harmonic Ratios menu defines the reference for the level of harmonics of the phases. At the Non-Active Values screen, press the %f-%r function button to display the Phase Harmonic Ratios screen. Figure 4-10 Use the arrow buttons (, ) to set the reference for harmonics: ■... -
Page 28: Connection
4.6. CONNECTION Pressing Electrical Hook-up in the Configuration menu displays the Electrical Connection screen. This defines how the instrument is connected to different types of electrical networks. Figure 4-12 Several electrical diagrams can be selected. Use the arrow buttons (, , , ) to choose a connection. One or more types of network correspond to each distribution system. - Page 29 Distribution system Source Split-phase 3-wire non-grounded neutral 3-phase open star 3-wire non-grounded neutral Split-phase 3-wire (L1, L2 and N) 3-phase high leg delta 3-wire non-grounded neutral 3-phase open high leg delta 3-wire non-grounded neutral Split-phase 4-wire grounded neutral 3-phase open star 4-wire grounded neutral Split-phase 4-wire (L1, L2, N and earth) 3-phase high leg delta 4-wire grounded neutral...
- Page 30 Distribution system Source 3-phase star 3-wire 3-phase delta 3-wire 3-phase 3-wire (L1, L2 and L3) 3-phase open delta 3-wire Indicate which current sensors will be connected: all 3 (3A) or only 2 (A1 and A2, or A2 and A3, or A3 and A1). Three-wattmeter method with 3-phase open delta 3-wire grounded junction of phases virtual neutral (with 3 sensors...
- Page 31 Distribution system Source 3-phase star 4-wire non-grounded neutral 3-phase 4-wire (L1, L2, L3 and N) Indicate which voltages will 3-phase open high leg delta 4-wire non-grounded be connected: all 3 (3V) or neutral only 2 (V1 and V2, or V2 and V3, or V3 and V1).
-
Page 32: Sensors And Ratios
4.7. SENSORS AND RATIOS NOTE: The ratios cannot be changed if the instrument is recording, metering energy, or searching for transients, alarms, and/or inrush current acquisitions. 4.7.1. CURRENT SENSORS AND RATIOS Pressing Probes and Ratios at the Configuration menu displays a menu for defining the current sensors and ratios. It automatically displays the current sensor models detected by the instrument. -
Page 33: Capture Mode
Figure 4-14 (Voltage Ratios screen without neutral) Figure 4-15 (Voltage Ratios screen with neutral) Use the arrow buttons (, ) to choose the configuration of the ratios. ■ 3U 1/1 or 4V 1/1: all channels have the same 1/1 ratio. ■... -
Page 34: Transient Current Thresholds
■ 4V or 3U: all channels have the same threshold. • Press the button, then use the , buttons to highlight the value of the threshold in yellow. • Press the button, then use the , , and buttons to change the threshold. The unit can be the V or the kV. ■... -
Page 35: Inrush Current Thresholds
4.8.3. INRUSH CURRENT THRESHOLDS Pressing the function button in the Voltage Threshold menu displays the Current Thresholds Setup menu. This defines the inrush current thresholds. To do this, you must configure the triggering threshold and the inrush current capture stopping threshold (triggering threshold less hysteresis). - Page 36 Recordable values are: Unit Definition Urms RMS phase-to-phase voltage. RMS phase-to-neutral voltage. Upk+ Maximum peak value of phase-to-phase voltage. Upk- Minimum peak value of phase-to-phase voltage. Crest (peak) factor of phase-to-phase voltage. Uthdf Harmonic distortion of the phase-to-phase voltage with the RMS value of the fundamental as reference. Uthdr Harmonic distortion of the phase-to-phase voltage with the total RMS value without DC as reference.
-
Page 37: Alarm Mode
The values U-h, V-h, A-h, and S-h involve the recording of harmonics of U, V, A, and S. You can select a range of orders of harmonics to be recorded (0 to 50) for each of these quantities. You can also specify that only odd harmonics within the selected range be recorded. -
Page 38: Erase Memory
To set an alarm, select the following values: ■ Type of alarm. ■ Order of the harmonic (between 0 and 50), for |S-h|, A-h, U-h and V-h only. ■ Target of the alarm: • 3L: 3 phases monitored individually • N: monitoring of neutral •... -
Page 39: About
4.12. ABOUT About screen displays information concerning the instrument. Figure 4-24 To return to the Configuration menu, press... -
Page 40: Waveform Capture
WAVEFORM CAPTURE Waveform capture mode displays and captures transients and inrush currents. It contains two sub-modes: ■ Transient mode (§5.1) ■ Inrush current mode (§5.2) Figure 5-1 To select a sub-mode, move the yellow cursor to it using the and buttons, then validate with the button. To return to the Waveform capture screen, press 5.1. -
Page 41: Configuring And Starting A Search
5.1.1. CONFIGURING AND STARTING A SEARCH To configure a search for a transient, enter: ■ Start date and time ■ Stop date and time ■ Number of transients to search for ■ Name of search To change an item, move the yellow cursor to it using the and buttons, then validate with the button. Change the value using the , , ... -
Page 42: Deleting A Search For Transients
To select a search for transients, move the cursor to it using the and buttons. The selected search is bolded. Then validate with the button. The instrument then displays a list of transients. Transients display filter: Triggering channel of the transient. : all transients are displayed. -
Page 43: Inrush Current Mode
5.2. INRUSH CURRENT MODE Inrush Current sub-mode lets you capture (record) inrush currents (voltage and current waveforms, network frequency, half-cycle RMS voltages and currents except for the neutral), view, and delete the recordings. When you open Inrush Current mode: ■ If no capture has been made, the Capture Schedule screen (Figure 5-6) is displayed. -
Page 44: Capture Parameters
5.2.2. CAPTURE PARAMETERS To display the characteristics of the capture, press . The Capture Parameters screen is displayed. Display in PEAK mode (see §5.2.4). Display in RMS mode (see §5.2.3). Figure 5-7 If a capture duration is displayed in red, it has been cut short due to one of the following: ■... - Page 45 5.2.3.2. 3A RMS display screen for a three-phase connection without neutral Figure 5-9 5.2.3.3. L1 RMS display screen for a three-phase connection with neutral MAX: maximum half-cycle RMS Time cursor of the graph. Use the value of the inrush current capture. or ...
-
Page 46: Instantaneous Inrush Current
5.2.4. INSTANTANEOUS INRUSH CURRENT PEAK mode displays the envelopes and waveforms of the inrush current capture. The PEAK display of an inrush current capture provides two possible representations: ■ envelope ■ waveform The change from one of these representations to the other is automatic, as a function of the zoom level. If the zoom in is high enough, the representation is of the “waveform”... - Page 47 5.2.4.3. A1 PEAK display screen for a three-phase connection without neutral In the example below, the image is zoomed out to the point the envelope type of display appears. MAX |PEAK|: maximum Time cursor of the graph. Use the instantaneous absolute value of the ...
-
Page 48: Harmonics
HARMONICS Harmonics mode displays harmonic levels of voltage, current, and apparent power, order by order. This lets you determine the harmonic currents produced by nonlinear loads, and analyze problems caused by harmonics according to their order (overheating of neutrals, conductors, motors, etc.). Filters and expert mode (§6.5). -
Page 49: L1 Phase Voltage Harmonics Display Screen
6.1.2. L1 PHASE VOLTAGE HARMONICS DISPLAY SCREEN Information about the harmonic at Display of the 3 phases 3L, of L1, L2, the cursor position. L3, N, or of the expert mode (three- V-h03: harmonic number. phase connection only - see §6.5). To %: level of harmonics with the select the display press ... -
Page 50: L1 Current Harmonics Display Screen
6.2.2. L1 CURRENT HARMONICS DISPLAY SCREEN Information about the harmonic Display of the 3 phases 3L, of L1, L2, at the cursor position. L3, N, or of the expert mode (three- A-h05: harmonic number. phase connection only - see §6.5). To %: level of harmonics with the select the display press ... -
Page 51: L1 Apparent Power Harmonics Display Screen
6.3.2. L1 APPARENT POWER HARMONICS DISPLAY SCREEN Information about the harmonic at the cursor position. Display of the 3 phases 3L, of L1, L2 or S-h03: harmonic number. %: level of harmonics with the L3. To select the display press the or fundamental apparent power as button reference (%f) or the (total) -
Page 52: L1 Phase-To-Phase Voltage Harmonics Display Screen
6.4.2. L1 PHASE-TO-PHASE VOLTAGE HARMONICS DISPLAY SCREEN Information about the harmonic at the cursor position. Uh 03: harmonic number. Display of the 3 phases 3L, of L1, L2 or %: level of harmonics with the L3. To select the display press the or fundamental RMS value as ... -
Page 53: Current Expert Mode Display Screen
6.5.2. CURRENT EXPERT MODE DISPLAY SCREEN The A sub-menu displays the influence of the harmonics of the current on the heating of the neutral and on rotating machines. Harmonics inducing a negative Harmonics inducing a positive sequence. sequence. Harmonics inducing a zero %: level of harmonics with the sequence. -
Page 54: Waveform
WAVEFORM The Waveform button displays current and voltage graphs, along with the values measured and those calculated from the voltages and currents (except for power, energy, and harmonics). This is the first display screen that appears when the instrument is powered ON. Maximum and minimum RMS Display filters. -
Page 55: Rms Display Screen
7.1.1. 3U RMS DISPLAY SCREEN This screen displays the three phase-to-neutral voltages of a three-phase system. RMS phase-to-phase voltages. Instantaneous values of the signals at the position of the cursor. t: time relative to the start of the period. U1: instantaneous phase-to-phase Voltage axis with automatic voltage between phases 1 and 2 (U scaling. -
Page 56: Rms Display Screen For The Neutral
7.1.4. RMS DISPLAY SCREEN FOR THE NEUTRAL This screen displays the neutral voltage with respect to earth and the neutral current. RMS voltage and current. Instantaneous values of the signals at the position of the cursor. t: time relative to the start of the Current and voltage axis with period. -
Page 57: Thd Display Screen
7.2.3. 4A THD DISPLAY SCREEN This screen displays the phase current waveforms for one period and the total harmonic distortion values. Instantaneous values of the signals at Harmonic distortion for each the position of the cursor. graph. t: time relative to the start of the period. -
Page 58: Cf Display Screen
7.3.3. 4A CF DISPLAY SCREEN This screen displays the current waveforms of one period and the peak factors. Instantaneous values of the signals at Peak factor for each graph. the position of the cursor. t: time relative to the start of the period. A1: instantaneous current of phase 1. -
Page 59: Max.-Min. Display Screen
7.4.2. 4V MAX.-MIN. DISPLAY SCREEN This screen displays the one-second mean and half-cycle maximum and minimum RMS values and the positive and negative peaks of the phase-to-neutral voltages and of the neutral. Column of values for the neutral: RMS, PEAK+ and PEAK- parameters. Columns of values for each voltage graph (1, 2 and 3). -
Page 60: Neutral Max.-Min. Display Screen
7.4.5. NEUTRAL MAX.-MIN. DISPLAY SCREEN This screen displays the RMS values and the positive and negative peaks of the neutral relative to earth. Column of voltage values. The same information as for the voltage, RMS: true RMS voltage. but for the current. PK+: maximum peak voltage since the instrument was turned ON or since the last time the ... -
Page 61: Simultaneous Display Screen
7.5.3. 4A SIMULTANEOUS DISPLAY SCREEN This screen displays the RMS, DC (only if at least one of the current sensors can measure direct current), THD, CF, FHL and FK values of the phase and neutral currents. Column of RMS values and (if the current sensor allows) DC values along with the CF and the THD (%r) concerning the neutral. -
Page 62: Phasor Diagram
7.6. PHASOR DIAGRAM Phasor sub-menu displays a vector representation of the fundamentals of the voltages and currents. It indicates their associated quantities (modulus and phase of the vectors) and the negative-sequence voltage and current unbalance rates. NOTE: To allow the display of all vectors, those of which the modulus is too small to be pictured are displayed with their names followed by an asterisk (*). -
Page 63: L1 Phasor Diagram Display Screen
7.6.4. L1 PHASOR DIAGRAM DISPLAY SCREEN In the presence of the neutral, this screen displays a vector representation of the fundamentals of the phase-to-neutral voltages and the currents of one phase. It indicates their associated quantities (modulus and phase of the current and phase-to-neutral voltage vectors). -
Page 64: Alarm Mode
ALARM MODE Alarm mode detects overshoots of thresholds on each of the following parameters: Hz, Urms, Vrms, Arms, |Udc|, |Vdc|, |Adc|, |Upk+|, |Vpk+|, |Apk+|, |Upk-|, |Vpk-|, |Apk-|, Ucf, Vcf, Acf, Uthdf, Vthdf, Athdf, Uthdr, Vthdr, Athdr, |P|, |Pdc|, |Q | or N, D, S, |PF|, |cos Φ|, |tan Φ|, PST, PLT, FHL, FK, Vunb, Uunb (for a three-phase source without neutral) Aunb, U-h, V-h, A-h and |S-h| (see the table of abbreviations in §2.8). -
Page 65: Campaigns List
8.3. CAMPAIGNS LIST To display the list of campaigns performed, press the button. The Detection List screen is displayed. The list can contain up to 7 campaigns. Name of the campaign. Start date and time of the campaign. Stop date and time of the campaign. Figure 8-2 If the stop date of the campaign is in red, it does not match the stop date initially configured, either because: ■... -
Page 66: Trend Mode
TREND MODE Trend mode records changes to parameters previously specified in the Trend Mode screen in the Configuration menu (see §4.9). This mode manages up to 2 GB of data. Memory card usage. List of records (§9.3). Rapid configuring and starting of recording (see §9.1). -
Page 67: Viewing The Recording List
9.3. VIEWING THE RECORDING LIST Recording List submenu displays a list of recordings stored in the instrument memory. Amount of memory dedicated to recordings. Recording name. Recording stop time. Recording start time. Figure 9-2 If the stop date is in red, it does not match the configured date, due to a power supply problem (battery low or disconnection of the instrument supplied by external power only). -
Page 68: Trend Graphs
9.5.2. TREND GRAPHS Date at cursor position. Position of viewing window in the record. This screen is a partial view of the trend graph. There are other screens before and after the To select the display filter, press the visible part. ... - Page 69 Graph of maxima. Values of the cursor (minimum, mean, Graph of mean. and maximum). Graph of minima. Figure 9-7 The display period of this graph is one minute. Each point of the mean graph represents the arithmetic mean of 60 values recorded every second.
- Page 70 Figure 9-10 Figure 9-11 The sum of the powers of the three phases (Σ) is presented in bar graph form. Changes the display scale between 1 minute and 5 days. Figure 9-12 For the energy graphs, the quantities are expressed in Wh, J, toe, or BTU, depending on the configured unit (see §4.5.2). Figure 9-13 This graph differs slightly from the previous one because, with the MIN-AVG-MAX mode, there is no loss of information.
- Page 71 Date of the cursor (ending date of the Starting date of the selection. selection). Use the or buttons to move the cursor. Energy calculation mode. Pressing this button lets you define the start of the selection. Figure 9-14 The display period of this bar chart is one minute.
- Page 72 This graph differs considerably from the previous one, because MIN-AVG-MAX mode is activated. Each point of the mean graph represents the arithmetic mean of 7,200 values recorded every second. Each point of the graph of the maxima represents the maximum of the 7,200 values recorded every second. Each point of the graph of the minima corresponds to the minimum of the 7,200 values recorded every second.
- Page 73 The following table indicates the time needed to display the graph on screen as a function of the width of the display window for a recording period of one second: Typical waiting time for Typical waiting time for Width of display window Grid increment display with MIN-AVG- display with MIN-AVG-...
-
Page 74: Power And Energy Mode
POWER AND ENERGY MODE button displays power- and energy-related measurements. The available sub-menus depend on the filter. ■ For 2- and 3-wire single-phase connections and for the 2-wire two-phase connection, only L1 is available. The filter therefore not displayed, but the display is the same as for L1. ■... -
Page 75: Energies Consumed Display Screen
10.1.3. ENERGIES CONSUMED DISPLAY SCREEN sub-menu displays the meters of energy consumed by the load. Active energy. DC energy (only if a DC current Inductive reactive effect sensor is connected). Reactive energy. Distortion energy. Capacitive reactive effect Apparent energy. Figure 10-3 NOTE: This screen corresponds to the choice “non-active quantities broken down”... -
Page 76: Energy Meters Display Screen
NOTE: This screen corresponds to the choice “non-active quantities broken down” in the VAR tab of the Calculation Methods menu of the Configuration mode. If “non-active quantities not broken down” is selected, D (distortion power) does not appear and Q is replaced by N. -
Page 77: Total Energy Meters Display Screen
10.3.2. TOTAL ENERGY METERS DISPLAY SCREEN The Wh... sub-menu displays the energy meters. Meters of the energy generated by Meters of the energy consumed the load. by the load. Total active energy. Total DC energy (only if a DC Total inductive reactive effect current sensor is connected). -
Page 78: Stop Energy Metering
10.5. STOP ENERGY METERING To suspend energy metering, press Stop date/time of metering are displayed next to start date/time. Figure 10-11 A disconnection of the metering is not definitive. It can be resumed by pressing the button again. NOTE: If no recording is in progress, disconnecting the energy metering leads to the appearance of the blinking symbol in the status bar (in place of the symbol). -
Page 79: Screen Snapshot Mode
SCREEN SNAPSHOT MODE button can take up to 50 screen snapshots and display recorded snapshots. Saved snapshots can then be transferred to a computer running the DataView PowerPad III Control Panel. 11.1. SCREEN SNAPSHOTS Press for approximately 3 seconds to take a snapshot of any screen. When the snapshot is taken, the icon of the active mode ) at the top of the display unit is replaced by the icon. -
Page 80: Help Button
HELP BUTTON button provides information about the button functions and symbols used in the current display mode. The following is an example of Help information displayed: Indicates active mode. Help in progress. List of information concerning the Help page 2. buttons and icons. -
Page 81: Dataview Software
To install the full DataView product, select Complete and then click Next. You are now prompted to select the Control Panel(s) you want to install. Each AEMC product family has its own specially designed Control Panel. If you are performing a Complete install, by default all available Control Panels are selected. Control Panels take up disk space on the computer;... -
Page 82: Powerpad Iii Control Panel
PowerPad III Control Panel. However, there are situations where using the core DataView icon may be more convenient for some users, such as when viewing multiple archived reports from different AEMC product families. For further information about using the PowerPad III Control Panel, consult the Help system that comes with the product. Access this Help by (1) pressing F1, or (2) clicking the option Help in the PowerPad III Control Panel’s menu bar at the top of the screen. -
Page 83: General Specifications
GENERAL SPECIFICATIONS 14.1. ENVIRONMENTAL CONDITIONS The following chart shows conditions relating to ambient temperature and humidity: 1 = Reference range. 2 = Range for use. 3 = Range for storage with batteries. 4 = Range for storage without batteries. NOTE: At temperatures above 104°F (40°C), the instrument must be powered by the battery alone OR by the external power unit alone. -
Page 84: Electromagnetic Compatibility
14.4. ELECTROMAGNETIC COMPATIBILITY Emissions and immunity in an industrial setting compliant with IEC 61326-1. For electromagnetic emissions, the instrument belongs to group 1, class A, under standard EN55011. Class A devices are intended for use in industrial environments. There may be difficulties ensuring electromagnetic compatibility in other environments, because of conducted and radiated disturbance. -
Page 85: Functional Specifications
FUNCTIONAL SPECIFICATIONS 15.1. REFERENCE CONDITIONS This table indicates the reference conditions of the quantities used by default in the specifications listed in § 15.3.4. Parameter Reference conditions Ambient temperature 73 ± 5 °F (23 ± 3 °C) Humidity (relative humidity) [45 %;... -
Page 86: Electrical Characteristics
15.3. ELECTRICAL CHARACTERISTICS 15.3.1. VOLTAGE INPUT CHARACTERISTICS Range for use: to 1000 V AC+DC phase-to-neutral and neutral-to-earth. to 2000 V AC+DC phase-to-phase. (on condition of compliance with 1000 V with respect to earth in Cat III). Input impedance: 1195 kΩ (between phase and neutral and between neutral and earth). Admissible overload: 1200 V constant. - Page 87 (1) Limitation of the MR193 and SL261 clamps (2) Two-phase (opposite phases) – same note as (1) (3) Limitation of the voltage inputs (4) 1000 x √2 ≈ 1414; 2000 x √2 ≈ 2828 (5) Total RMS value and RMS value of the fundamental (6) DC harmonic component (n= 0) (7) For voltages >...
- Page 88 Measurement range without Display resolution ratio (with unity ratio) Measurement Maximum intrinsic error (with unity ratio) Minimum Maximum J93 clamp 3500 A ± (1% + 1 A) 100 mA SR193 clamp A < 1000 A 1200 A ±(1% + 1 A) MR193 clamp A ≥...
- Page 89 Quantities concerning powers and energies Measurement range without Display resolution ratio (with unity ratio) Measurement Maximum intrinsic error (with unity ratio) Minimum Maximum ±(1%) cos Φ ≥ 0.8 Excluding Flex ® ±(1.5% + 10 ct) 0.2 ≤ cos Φ < 0.8 10 mW 10 MW 4 digits at most...
- Page 90 (1) Stated uncertainties on active power and energy measurements are maxima for |cos Φ| = 1 and typical for other phase differences. (2) Stated uncertainties on reactive power and energy measurements are maxima for |sin Φ| = 1 and typical for other phase shifts. ®...
- Page 91 Quantities concerning the spectral composition of the signals Measurement range Measurement Display resolution Maximum intrinsic error Minimum Maximum 0.1 % τ < 1000 % 1500 %f Voltage harmonic ratio (τ ±(2.5 % + 5 ct) 100 %r ≥ 1000 % τ...
-
Page 92: Measurement Range
Measurement range Display (with unity ratio) Measurement Maximum intrinsic error resolution (with unity ratio) Minimum Maximum 100 mV V < 1000 V simple 1000 V ±(2.5 % + 1 V) V ≥ 1000 V harmonic voltage 100 mV (order n ≥ 2) U <... - Page 93 Measurement range Display (with unity ratio) Measurement resolution Maximum intrinsic error (with unity ratio) Minimum Maximum ±((n x 0.4%) + 1 A) J93 clamp 3500 A 100 mA A < 1000 A SR193 clamp MR193 ±((n x 0.4%) + 1 A) 1000 A clamp A ≥...
- Page 94 Measurement ranges after application of the ratios Measurement range Measurement Minimum Maximum with minimum ratio(s) with maximum ratio(s) RMS & RMS ½ voltage simple 120 mV 170 GV compound 120 mV 340 GV Direct voltage (DC) simple 120 mV 200 GV compound 120 mV 400 GV...
-
Page 95: Current Sensor Specifications (After Linearization)
15.3.5. CURRENT SENSOR SPECIFICATIONS (AFTER LINEARIZATION) Sensor errors are offset by a typical correction inside the instrument. This typical correction, applied to the phase and amplitude, depends on the type of sensor connected (detected automatically) and the gain in the current acquisition channel used. The RMS current measurement error and phase error are additional errors (which must therefore be added to the instrument errors), indicated as influences on the calculations carried out by the analyzer (powers, energies, power factors, tangents, etc.). -
Page 96: Class B Under Standard Iec 61000-4-30
15.4. CLASS B UNDER STANDARD IEC 61000-4-30 15.4.1. INSTRUMENT CONFORMITY The instrument and DataView PowerPad III Control Panel software are compliant with class B of standard IEC61000-4-30 for the following parameters: ■ Industrial frequency ■ Supply voltage amplitude ■ Flicker ■... -
Page 97: Maintenance
16. MAINTENANCE Except for the battery and the memory card, the instrument contains no parts that can be replaced by personnel who have not been specially trained and accredited. Any unauthorized repair or replacement of a part by an “equivalent” may seriously impair safety. 16.1. - Page 98 Remove the cover. Figure 16-2 Tilt the top of the battery outward and remove it from its compartment. Figure 16-3 Disconnect the battery connector without pulling on the wires. The instrument retains the date-time function for approximately 24 hours without the battery. Spent batteries must not be treated as ordinary household waste.
-
Page 99: Memory Card
16.4. MEMORY CARD The instrument accepts SD (SDSC), SDHC, and SDXC type memory cards. The card supplied with the instrument can store up to 8GB. (Note, however, that the maximum size of a trend recording is 2GB.) Before removing or inserting the memory card, ensure the instrument is disconnected and powered OFF. Write-protect the memory card when you remove it from the instrument. -
Page 100: Firmware Update
About option. This displays the About screen (see Figure 4-24), which includes the firmware version number currently running on the instrument. Compare this number against the firmware version posted on the AEMC Downloads site to determine whether or not your instrument should be updated. -
Page 101: Repair And Calibration
Instruments, not by the distributor from whom it was purchased. This ® warranty is void if the instrument has been tampered with, abused, or if the defect is related to service not performed by AEMC Instruments. The warranty does not apply in the following cases: ■... - Page 102 NOTES...
- Page 103 NOTES...
- Page 104 03/19 99-MAN 100480 v1 Chauvin Arnoux , Inc. d.b.a. AEMC Instruments ® ® 15 Faraday Drive • Dover, NH 03820 USA • Phone: (603) 749-6434 • Fax: (603) 742-2346 www.aemc.com...
Need help?
Do you have a question about the PowerPad 8436 and is the answer not in the manual?
Questions and answers