Table of Contents
Advertisement
Quick Links
Advertisement
Table of Contents

Related Manuals for AEMC PowerPad 3945


Summary of Contents for AEMC PowerPad 3945
- Page 1 3945 3-PHASE POWER QUALITY ANALYZER E N G L I S H User Manual...
-
Page 2: Table Of Contents
ABLE OF ONTENTS 1. INTRODUCTION ............... 5 International Electrical Symbols ..............5 Receiving Your Shipment ..............5 Ordering Information ................6 1.2.1 Accessories and Replacement Parts ........6 2. PRODUCT FEATURES............... 7 Description ..................7 Control Functions ................8 Display ....................10 Battery Charge Status............... - Page 3 4. OPERATION ................24 Instrument Confi guration (set-up mode) ........... 24 4.1.1 Date / Time................25 4.1.2 Contrast / Brightness ............25 4.1.3 Colors................... 26 4.1.4 Calculation Parameters ............26 4.1.5 Electrical Hookup (electrical network)........27 4.1.6 Current Sensors..............28 4.1.7 Baud Rate ................
- Page 4 Recording Mode................49 5.6.1 Saving the Selected Parameters ......... 49 5.6.2 Selecting or Deleting a Record ..........50 5.6.3 Selecting a Graphic Display for Recorded Measurements .. 51 Saving a Display ................54 Opening a Previously Saved Snapshot ..........55 Printing ....................
- Page 5 MAINTENANCE................79 Recharging and Changing the Battery ..........79 Cleaning .................... 79 APPENDIX ..................80 Mathematical Formulas for Various Parameters ....... 80 8.1.1 Half-period Voltage and Current RMS Values...... 80 8.1.2 MIN / MAX Values for Voltage and Current......80 8.1.3 Peak Values for Voltage and Current........
-
Page 6: Introduction
HAPTER NTRODUCTION Warning • Never use on circuits with a voltage higher than 600V and an overvoltage category higher than Cat. III. • Use in indoor environments only. • Only use accessories that are compliant with the safety standards (IEC 664-1 Ed. 92) 600V max and overvoltage Cat. III. •... -
Page 7: Ordering Information
1.2 Ordering Information PowerPad™ Model 3945 ..............Cat. #2130.74 Includes: Meter, (4) 10 ft color-coded voltage leads, (4) color-coded alligator clips, RS-232 DB9F ® optical cable, NiMh battery, US power cord, DataView Pro Software, carrying bag, user manual and warranty card. PowerPad™... -
Page 8: Product Features
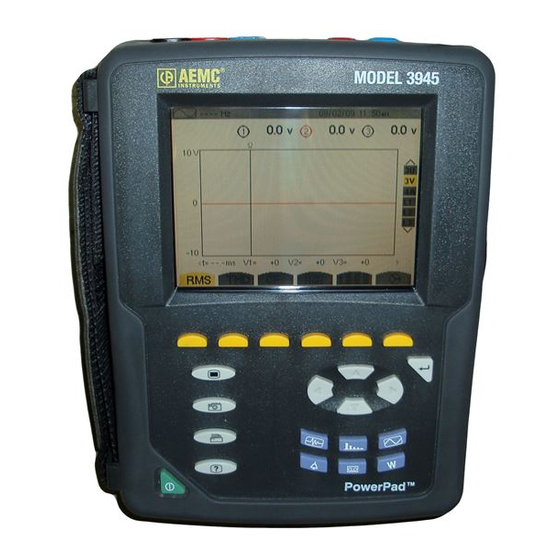
HAPTER RODUCT EATURES 2.1 Description The PowerPad™ Model 3945 is a three-phase power quality analyzer that is easy-to- use, compact and shock-resistant. It is intended for technicians and engineers to mea- sure and carry out diagnostic work on one, two or three phase low voltage networks. Users are able to obtain instant waveforms of an electrical network’s principal char- acteristics, and also monitor their variation over a period of time. -
Page 9: Control Functions
2.2 Control Functions MODEL 3945 49.99Hz 07/25/02 10:26 100% 0.3 v 0.3 v 0.3 v 300V - 300 <t= 5.0ms V1= +0 > ™ PowerPad Figure 2-1 Œ Over molded protective case. Color LCD display with graphic representation of system parameters and measurements Ž... - Page 10 ON / OFF button. ‘ Three (3) current inputs on the top of the instrument to enable the use of current sensors (MN, SR, AmpFlex™, and MR probes). ’ Four (4) voltage inputs. “ RS-232 bidirectional optical output for transferring data to a PC (bidirectional) or printing to a dedicated printer (DPU 414 - SEIKO).
-
Page 11: Display
Alarm: • provides a list of the alarms recorded according to the thresholds programmed during confi guration • logging of interruption with half-cycle resolution • determination of energy consumption exceedences 2.3 Display 49.99Hz 07/25/02 10:26 100% 202.5 v 202.0 v 202.7 v 300V - 300... - Page 12 Measurement selection: True RMS Measurement Total Harmonic Distortion Crest Factor max/min Maximum and Minimum values Simultaneous display of the various measurements in alphanumeric form Phasor diagram The calculation of the DPF, Tan, KF, Φ, UNB, Min, Max, VAR, Harmonics, PST, and DF parameters and the frequency mea- surement can only be performed if voltage is applied to the Ch1 voltage input.
-
Page 13: Battery Charge Status
2.4 Battery Charge Status NOTE: Line cord is plugged in Battery Charging • Battery capacity level relative to full charge • % of total capacity already charged (between 0 and 99%) • Battery sign and % are blinking NOTE: Line cord may or may not 100% be plugged in Battery Full... -
Page 14: Specifications
HAPTER PECIFICATIONS 3.1 Reference Conditions Parameter Reference Conditions Ambient temperature 73°F ± 5°F (23°C ± 3°C) Humidity 45% to 75% RH Atmospheric pressure 25.4" Hg to 31.3" Hg (860 to 1060 hPa) Phase voltage 230Vrms and 110Vrms ±2% without DC Clamp current circuit input voltage 0.01V to 1Vrms without DC (<0.5%) AmpFlex™... -
Page 15: Accuracy Specifi Cations (Excluding Current Probes)
3.2.3 Accuracy Specifi cations (excluding current probes) Display Function Range Accuracy Resolution Frequency 40 to 69Hz 0.01Hz ±0.01Hz Single phase RMS voltages 6V to 480V 0.1V ±0.5% ± 2cts (Vrms, Vdem) Phase-to-phase RMS voltages 10V to 830V 0.1V ±0.5% ± 2cts (Urms, Udem) DC voltage component 6V to 100V... -
Page 16: Nominal Range Of Use
Display Function Range Accuracy Resolution Unbalance (Vunb, Aunb) 0% to 100% 0.1% ±1% ± 1ct three phase supply Phase angle (V/I; I/I; V/V) -179° to +180° 1° ±2° ± 1ct Harmonics ratios F = 40 to 69Hz 0% to 999% 0.1% ±1% + 5cts (Vrms >... -
Page 17: Mechanical Specifi Cations
3.3 Mechanical Specifi cations Dimensions: 9.5 x 7.0 x 2.0" (240 x 180 x 55mm) Weight: 4.6 lb (2.1kg) Altitude: Operating: 0 to 2000 meters (6560 ft) Non-Operating: 0 to 10,000 meters (32800 ft) Temperature and % RH: Reference Range Operating Range Storage Range Temperature in °F... -
Page 18: Ac Current Probe Model Sr193 (With Model 3945)
3.5 AC Current Probe Model SR193 (with Model 3945) for f ≤1kHz Nominal Range: 1000A Measurement Range: 3A to 1200A (I >1000A not continuously) NOTE: Currents below X will be displayed as zero on the PowerPad™ with this probe Probe Output Signal: 1mV Maximum Clamping Diameter: 2"... -
Page 19: Ac Current Probe Mn93 Probe (With Model 3945)
3.6 AC Current Probe MN93 Probe (with Model 3945) for f ≤ 1kHz Nominal Range: 200A Measurement Range: 2A to 240A (I > 200A not permanent) NOTE: Currents below X will be displayed as zero on the PowerPad™ with this probe Probe Output Signal: 5mV Maximum Clamping Diameter: 0.8”... -
Page 20: Ac Current Probe Mn193 Probe (With Model 3945)
3.7 AC Current Probe MN193 Probe (with Model 3945) The MN193 is designed to work with secondary current transformers. Best accuracy is available when entering the transformer ratio (e.g. 1000/5A) Nominal Range: 5A and 100A Measurement Range: 5A: 0.005A to 5A 100A: 0.1A to 100A NOTE: Currents below X on the 5A range and Y on the 100A range will be dis- played as zero on the PowerPad™... -
Page 21: Ac Current Probe Ampflex™ Probe (With Model 3945)
Factors affecting accuracy (% of the output signal) Conditions Range Error ≤150 ppm/K or Ambient temperature 14° to 131°F (-10° to 55°C) 0.15% per 10K Relative humidity 10 to 35°C 85% < 0.2% 40Hz to 1kHz: < 0.7% Frequency response 40Hz to 3kHz 1 to 3kHz: <... -
Page 22: Ac Current Probe Mr Probe (With Model 3945)
Factors affecting accuracy (% of the output signal) Conditions Range Error Temperature -4 to 140°F (-20 to 60°C) 0.2% per 10°C Relative humidity 10 to 90% RH 0.5% Frequency response 10Hz to 20kHz 0.5% Any position on internal Position of conductor perimeter of the undeformed in clamp (4% near latching system) -
Page 23: Three Phase 5A Adapter
Factors affecting accuracy (% of the output signal) Conditions Range Error Ζerο: ≤2 A/°C Scale: ≤300ppm/°C or Temperature 64 to 82°F (18 to 28°C) 0.3%/10°C Relative humidity 10 to 90% RH 0.5% of Reading ≤1 A/V Battery voltage 6.5 to 10V DC at 440Hz <0.5% of Reading Position of a... -
Page 24: Specifi Cations (Add Powerpad™ Accuracy ±0.5% ± 1Ct)
3.10.2 Specifi cations (add PowerPad™ accuracy ±0.5% ± 1ct) Range: Output / Input Ratio: 0.2mV/mA AC Dimensions: 6.00 x 3.75 x 3.40” (153 x 95 x 86mm) Weight: 2 lbs (900g) Impermeability: IP50 per EN 60529 (electrical IP2X for the terminals) Electrical safety: Double Insulation, Category III 300V Pollution Degree 2 per IEC 61010-1... -
Page 25: Operation
HAPTER PERATION The instrument is turned ON by pressing the green button. The startup screen will appear and indicate the instrument’s software version and serial number. If there is no AC power supply, the instrument will operate on batteries. The instrument’s batteries are charged when it is connected to a 120/240;... -
Page 26: Date / Time
• Choose the language by pressing the function button below the chosen lan- guage. Your choice will remain highlighted in yellow. • Select the confi guration settings you wish to modify, with the buttons. As you scroll through the choices, they will be highlighted. •... -
Page 27: Colors
4.1.3 Colors • Highlight COLORS with the buttons, then press the button. The following screen will appear: 07/25/02 10:26 100% Phase voltage < > Phase current < > Phase voltage < > Phase current < > Phase voltage < > Phase current <... -
Page 28: Electrical Hookup (Electrical Network)
4.1.5 Electrical Hookup (electrical network) • Highlight ELECTRICAL HOOKUP with the buttons, then press the button. The following screen will appear: 07/25/02 10:26 100% Single-phase Two-phase 3 phase-3 wire 3 phase-4 wire (DELTA) (WYE) Figure 4-3 • Choose the hookup type with the buttons. -
Page 29: Current Sensors
4.1.6 Current Sensors • Highlight CURRENT SENSORS with the buttons, then press the button. The following screen will appear: 07/25/02 10:26 100% 200A MN clamp C clamp AmpFLEX PAC clamp 1000 / 5A Adapter Figure 4-4 Œ Current transducer ratio •... -
Page 30: Baud Rate
• Press the button to apply the current sensor selection. The Confi guration menu will once again be displayed on the screen. NOTE: In addition to the 4 current probe choices, there is an adapter selection. This selection allows the operator to use current probes that have a current output with PowerPad™. - Page 31 • To activate the selected parameter for recording, use the buttons. The selected parameters will have a fi lled in and those not selected will have an unfi lled . • There are two user-defi ned parameters at the bottom of the window. At fi rst, they will be listed as a question mark “?”.
-
Page 32: Alarm
4.1.9 Alarm • Highlight ALARM with the buttons, then press the button. The following screen will appear: 07/25/02 10:26 100% Hysteresis 10 % Vrms < 2 1 0 V 01 s Arms < 0 0 2 0 A 02 s Vthd >... -
Page 33: Clear Memory
NOTE: The programmed hysteresis is common to all alarms. • Highlight Alarm with the buttons, then press the button. • Select the modifi able fi eld using the buttons. • Activate or adjust the threshold values using the buttons. (The fi eld to be modifi... -
Page 34: Display Modes
HAPTER ISPLAY ODES The screen presentations in this section depict three-phase setups for the purpose of explaining the various choices. Your actual screens will appear differently based upon your particular set up. 5.1 Waveform Mode Press the waveform display mode button - 5.1.1 RMS Voltage Measurement on a Three-phase System 49.99Hz 07/25/02... -
Page 35: Rms Voltage Measurement On 3 Phases
Ž The measurement type is selected using one of the six variable function but- tons. All of these measurements are valid in 3U, 3V, 3A, L1, L2 and L3. The waveforms are selected by pressing the buttons: - 3U displays the three phase-phase voltages of a three-phase system - 3V displays the three voltages of a three-phase system - 3A displays the three phase currents of a three phase-3 wire system The neutral current is not a direct measurement, but the resulting total... -
Page 36: Rms Current Measurement On The 3 Phases And Neutral Current Of A Three Phase-4 Wire System
5.1.3 RMS Current Measurement on the 3 Phases and Neutral Current of a Three Phase -4 Wire System 60.00Hz 07/25/02 10:26 100% 19.1 18.5 17.1 - 27 <t= 5.0ms l1= +26 12= -13 13= -13 IN= +1 > Figure 5-3 5.1.4 Total Harmonic Distortion Measurement on One Phase 60.00Hz 07/25/02... -
Page 37: Minimum And Maximum Current Value Measurements
5.1.5 Minimum and Maximum Current Value Measurements 59.99Hz 07/25/02 10:26 100% 21.7 18.8 17.6 18.5 17.1 15.0 +11.4 +25.8 +24.0 PEAK+ –11.0 –25.8 –24.8 PEAK - Figure 5-5 Œ Crest Factor - refreshed every 250ms Select 3V or 4A with to obtain the MIN, AVG, MAX, or PEAK values for current or voltage. -
Page 38: Phasor Diagram Display (Fresnal Diagram)
NOTE: K factor is only available when current (4A, 3A or 2A depending on hook up) is selected from the choices on the right side of the screen. Flicker is only available when voltage (3V or 2V depending on hook up) is selected from the choices on the right side of the screen. -
Page 39: Harmonics Mode
5.2 Harmonics Mode Press the harmonic display mode button - Use the function buttons to select the type of harmonic analysis: V - Single phase voltage analysis A - Current analysis VA - Power and direction fl ow analysis U - Phase-to-phase voltage analysis buttons allow the user to zoom in or out, in increments of 2%, 5%, 10%, 20%, 50% and 100%. -
Page 40: Single Phase And Phase-To-Phase Current Analysis
Cursor enables selection up to 50 harmonic, with the buttons. As soon as the 25 harmonic is reached, the 25 to 50 range appears (0 represents the DC component). Ž Selection of expert mode -.+ is available for 3-phase hookups by pressing the buttons (see §5.2.4 for description). -
Page 41: Power And Direction Flow Analysis
5.2.3 Power and Direction Flow Analysis 59.98Hz 07/25/02 10:26 100% VAh03 - 122 ° min - 22 % max - 22 % -100 9 11 13 15 17 19 21 23 25 Figure 5-10 Harmonics on this screen are shown with either a positive or negative orientation. Since the bar selected in this example is negative, it indicates that it is a harmonic from load to source. -
Page 42: Harmonic Analysis In Expert Mode
5.2.4 Harmonic Analysis in Expert Mode button to select “-.+” and then either the “V” or “A” variable Press on the function button “V” or “A”. Example of a typical display: 59.98Hz 07/25/02 10:26 100% 15.5 Figure 5-11 • First column: The harmonics inducing a negative sequence are displayed. •... -
Page 43: Power / Energy Mode
5.3 Power / Energy Mode Press the power display mode button - This will enable: • Measurement of the real power (generated and consumed) • Measurement of reactive power (capacitive or inductive) • Measurement of apparent power W... - Choice of power parameters PF... -
Page 44: Button
5.3.2 Button This function key is used to display generated or consumed power, or real, reactive and apparent energy. This button toggles the display between generated energy (from load to supply) and consumed energy (from supply to load) each time it is pressed. When the is highlighted (yellow background) the display shows generated energy. -
Page 45: Transient Mode
5.4 Transient Mode Press the transient display mode button - Transients are displayed in the form of waveforms. All channels (up to 6, based upon confi guration) are stored in memory for each transient. Up to 50 transients can be captured. The function buttons have the following functions in this mode: - Starts capture search programming for a new transient... - Page 46 The table below lists the capture threshold levels, based on the probe in use (for the current channels) and voltage at the different percent selections. Thresholds 100% MN clamp 200A 100A SR clamp 1000A 500A 200A 100A AmpFlex™ 2900A 1400A 580A 290A 140A...
-
Page 47: Opening Previously Stored Transients
5.4.1 Opening Previously Stored Transients The screen below can be accessed with the retrieve button. It displays a list transients previously stored in the memory. 07/25/02 10:56 100% SELECTION OF TRANSIENT TEST 05 05/07/02 14:31:41 TEST 04 05/07/02 14:31:41 TEST 03 05/07/02 14:31:21 TEST 02 05/07/02 14:31:04... - Page 48 The display below shows the transient selected in Fig. 5-16 on the previous page. 07/25/02 11:22 100% 07/25/02 11:24:21 - 30 <t=45.3ms I1= -26 12= +9 I3= +15 > Figure 5-17 The screen displays 4 cycles of 256 points/cycle, with 1 cycle before the trigger and 3 cycles after.
-
Page 49: Alarm Mode
5.5 Alarm Mode Press the alarm display mode button - Figure 5-18 presents the various alarms stored. NOTE: The threshold values must fi rst have been programmed in the mode. - Starts alarm capture - Stops alarm capture - Deletes all stored alarms 07/25/02 11:27 100% <... -
Page 50: Recording Mode
5.6 Recording Mode This mode enables all the parameters previously confi gured in the setup mode to be recorded (see § 4.1.8). Press the record display mode button - The variable function buttons have the following functions in this mode: - Creates a new recording - Opens a previous recording - Deletes recording... -
Page 51: Selecting Or Deleting A Record
5.6.2 Selecting or Deleting a Record 07/25/02 10:56 100% SELECTION OF RECORDING TEST 07/25/02 17:58 > In progress PUMP 07/18/02 17:58 > 07/18/02 11:45 MOTORA 07/12/02 14:41 > 07/12/02 16:40 Figure 5-20 The status bar at the top displays the memory occupied by previous records. To Select a Recording: •... -
Page 52: Selecting A Graphic Display For Recorded Measurements
5.6.3 Selecting a Graphic Display for Recorded Measurements Recorded data can be displayed in graphic form. • Select the recording to be displayed using the buttons. Then, open the recording by pressing the button. A screen similar to fi gure 5-21 will appear. 07/25/02 10:56 100% TEST... - Page 53 Œ Display of the average voltage for each of the 3 voltages. Moving the cursor with the buttons updates the values to refl ect the new cursor position. Selection of the 3 phases or each phase separately with the buttons.
- Page 54 Graphic Display of Average Power After returning to the Measurement Selection Screen (see Fig. 5-21) use the “../..” button to view more recorded parameters, if necessary. Pressing the “W” button, will bring up a screen similar to Fig. 5-24 below. 07/25/02 10:38 100% 07/25/02 10:13:21...
-
Page 55: Saving A Display
The energy over a selected period can be calculated from the average power records: • Move the cursor to the start time. • Press the function button. • Move the cursor with buttons to the desired end time • The energy value is displayed, with end date and end time It is possible to make an energy measurement over several recording ranges in the 4 quadrants. -
Page 56: Opening A Previously Saved Snapshot
5.8 Opening a Previously Saved Snapshot A short press (about 1s) on the button gives access to the menu of snapshots that have been saved. The small icon to the left of each snapshot (date and time) tells you what type of data was stored. -
Page 57: Printing
5.9 Printing The print button allows a screen to be printed directly to a dedicated printer con- nected to the serial port. 59.99Hz 07/25/02 10:26 100% 202.5 v 202.0 v 202.7 v 300V - 300 <t= 5.0ms V1= +276 V2= -140 V3= -145 >... -
Page 58: Using Dataview Pro
The ability to store test results and print out reports of any test. The ability to view and store real-time data. ® ® ® DataView software is a copyright of Chauvin Arnoux , Inc. d.b.a. AEMC Instruments Power Quality Analyzer Model 3945... -
Page 59: Features
6.2 Features ® The DataView Program has a simple, easy-to-use interface for confi guring and running tests with the Model 3945 Power Quality Analyzer, as well as printing reports of the test results. There are many features that are available through this program. -
Page 60: Connecting The Model 3945 To Your Computer
6.5 Connecting the Model 3945 to your Computer The Model 3945 is supplied with an optically isolated serial interface cable required for connecting the instrument to the computer. This cable (Cat. #2140.18) is equipped with a 9-pin connector on one end, and an optical connector on the other end. - Page 61 Figure 6-1 The Quick Start Dialog Box contains the following options: • Open Instrument Control Panel: Facilitates creation of a confi guration for the PowerPad™. • Create View from Template: Facilitates creation of a printable report from existing data already stored on the computer or from previous downloads. •...
-
Page 62: Confi Guring The Instrument
6.7 Confi guring the Instrument To confi gure the instrument, perform the following steps. 1. Click the Confi gure Instrument button. A dialog box will open, allowing you to select the Communication Rate (baud rate) and the Communica- tions Port (serial port) for communicating with the PowerPad™. Figure 6-2 2. - Page 63 Figure 6-3 This screen shows: • The status of PowerPad™. ® • If DataView is connected to the PowerPad™ • The communications port and speed of the connection. • The model number, serial number, and fi rmware revision. • If a database is open, and if so, its name, the battery charge level, whether the battery is charging or discharging, and the time on the clock.
-
Page 64: General Functions
6.7.1 General Functions ® The buttons described below appear on several DataView Setup Screens. • Re-Read from PowerPad: Reads the current confi guration of the Power- Pad™ attached via the serial cable. • Save to File: Saves the current confi guration. This fi le will reside on the computer’s disk drive. -
Page 65: Set-Up Confi Guration
6.7.2 Set-up Confi guration The Setup dialog box (Fig. 6-4) lets you confi gure every aspect of the Model 3945 PowerPad™. Each fi eld is identical to the programmable features available from the instrument’s front panel itself. Several of the functions are confi gured by typing the appropriate value in the fi eld provided. -
Page 66: Powerpad™ Display Confi Guration
6.7.3 PowerPad™ Display Confi guration The PowerPad Display window (Fig. 6-5) allows you to customize the PowerPad™ display (colors, clocks, language and contrast). Figure 6-5 NOTE: For detailed instructions and descrip- tions for any feature in a dialog box, click on the Help Button (at lower right side of the dialog box), or right-click on the feature you want information about. -
Page 67: Alarm Conditions Confi Guration
6.7.4 Alarm Conditions Confi guration The Alarm Conditions window allows you to set up 10 alarm confi gurations. Figure 6-6 Hysteresis: This value for alarms is set to prevent multiple recordings of an event that goes above the threshold and a certain percentage below it at times. Disable All Alarms: When this box is checked, all alarms will be disabled even if the individual alarm enable box is checked. - Page 68 Duration: The Alarm will only be recorded if the duration of the parameter meeting the threshold criteria exceeds the duration. The minimum alarm duration can be in minutes or seconds. In the case of Vrms , Urms or Arms not using neutral current, can also be in hundredths of a second.
-
Page 69: Recordings Confi Guration
6.7.5 Recordings Confi guration The Recording window shows the dialog box used to confi gure the parameters for a recording session. Figure 6-7 Four different confi gurations are available. More confi gurations can be saved by pressing “Save to File” and recalled later by pressing “Load From File”. Check the confi... -
Page 70: Transients Confi Guration
recording will usually still exist but with the fi rst letter of its name changed to “@”. The start and end times requested for the recording might be adjusted by the PowerPad™ to be in even multiples of the averaging period. For instance, if an integration period of 10 minutes were requested, and the start time was 9:03, the recording might not actually begin until 9:10. -
Page 71: En50160 Confi Guration
Write Changes and Start New Transient Search: Initiates searching from new transients when the OK or Apply button is pressed. View Transients: View the PowerPad’s stored transients. Download and delete transients options are also available. 6.7.7 EN50160 Confi guration The EN50160 standard defi nes limiting values and permissible variations of the voltage quality for the European Community. -
Page 72: Running The Test
Confi gure and start an EN50160 test of line quality. It is recommended that a brief test of 10 minutes or longer be done fi rst, to verify the connections and parameters of the test are correct. Only then should the 1-week test be done. If neither of the voltage profi... -
Page 73: Real Time Windows
6.9 Real Time Windows When your setup is completed, you can display different views on the screen of real time data and waveforms. 6.9.1 Waveform, Harmonic Bar and Harmonic Text Figure 6-10 On each screen, you can: • Select the type of data to see •... -
Page 74: Downloading Data To Database
6.10 Downloading Data to Database From the Instrument menu, select “data” to download the data recorded to the PowerPad™. 1. Select the data you want to Download by clicking on the desired tab (Recordings, Photographs, Alarms, Transients, Power/Energy, EN50160), then clicking on the fi le name. 2. -
Page 75: Alarms
6.10.2 Alarms Figure 6-12 The Alarms window displays a list of alarms recorded on the PowerPad™. A subset of the list, can be viewed by the phase of the triggering event. Alarms can be selected and downloaded to a database. The downloaded alarms contain no more information than is shown in the screen display. -
Page 76: Transients
6.10.3 Transients Figure 6-13 The Transients window displays transients stored on the PowerPad. It shows the number and name of the recording, and the time it began and ended. The selected transient(s) can either be downloaded or deleted. The downloaded result contains four waveforms. The triggering event is contained in the second waveform, and within the fi... -
Page 77: Power/Energy
6.10.4 Power/Energy Figure 6-14 The Power/Energy window displays accumulated power and energy data. Accumulated energy data can be started or stopped, and the results can be down- load to a database, and viewed on the screen, selected by phase. NOTE: The data for all available phases are downloaded to a database, not just that shown on the screen. -
Page 78: En50160
6.10.5 EN50160 Figure 6-15 The EN50160 window displays recorded tests that can be downloaded and analyzed. The summary window shows the results after all the data has been downloaded to a database. It displays the name, percent of the 10-minute periods that it has been out of range, followed by the range it needed to be within. - Page 79 Figure 6-12 4. After fi lling in the appropriate information, close the Session Properties dialog box by clicking on the “X” at the top right hand corner. 5. You will then be asked if you want to open the database just downloaded. Click the “Yes”...
-
Page 80: Maintenance
HAPTER AINTENANCE ® Use only factory specifi ed replacement parts. AEMC will not be held responsible for any accident, incident, or malfunction following a repair done other than by its service center or by an approved repair center. 7.1 Recharging and Changing the Battery The battery is automatically charged when the unit is connected to AC power. -
Page 81: Appendix
HAPTER PPENDIX 8.1 Mathematical Formulas for Various Parameters 8.1.1 Half-period Voltage and Current RMS Values Next Zero [][ ] ∑ ⋅ Vdem Single rms voltage half-period i + 1 phase Zero Next Zero [][ ] ∑ ⋅ Udem Compound rms voltage half-period i + 1 phase Zero Next Zero [][ ]... -
Page 82: Peak Factors For Current And Voltage
8.1.4 Peak Factors for Current and Voltage max(Vpp Peak factor single voltage i + 1 phase − [][ ] ∑ ⋅ max(Upp Peak factor phase-phase voltage i + 1 phase − [][ ] ∑ ⋅ max(App Peak factor current i + 1 phase −... -
Page 83: Thd Calculation
8.1.7 THD Calculation ∑ ∑ ∑ Vharm [i][n] Uharm [i][n] Aharm [i][n] Vthd[i] = Uthd[i] = Athd[i] = [i][1] [i][1] [i][1] Vharm Uharm Aharm i: phase (0; 1; 2) n: range (2 to 50) 8.1.8 Calculation of Harmonic Bins Harmonic bins are calculated by FFT with 16 bit resolution (1024 samples on 4 cycles) without windowing (IEC 1000-4-7). -
Page 84: Distortion Factor Calculation (Df)
8.1.9 Distortion Factor Calculation (DF) Two global values giving the relative quantity of harmonics are computed: the THD in proportion to the fundamental and the DF in proportion to the RMS value. [][ ] [][ ] [][ ] ∑ ∑ ∑... -
Page 85: Ratios
8.1.12 Ratios W[i] PF[i] = i + 1 phase power factor VA[i] DPF[i] = cos(φ[i]) i + 1 phase displacement factor Tan[i] = tan(φ[i]) i + 1 phase tangent NSS-1 [][ ] [][ ] ∑ Cosine angle between voltage cos(φ[i]) = fundamental and i + 1 phase current NSS-1 NSS-1... -
Page 86: Hysteresis
Wh[3] = Wh[0] + Wh[1] + Wh[2] total active energy VAh[3] = VA[0] + VA[1] + VA[2] total apparent energy VARhC[3] = VARhC[0] + VARhC[1] + VARhC[2] total reactive capacitive energy VARhL[3] = VARhL[0] + VARhL[1] + VARhL[2] total reactive inductive energy 8.1.14 Hysteresis Hysteresis is a fi... -
Page 87: Repair And Calibration
N.I.S.T. (Includes calibration certifi cate plus recorded calibration data). ® Chauvin Arnoux , Inc. ® d.b.a. AEMC Instruments 15 Faraday Drive Dover, NH 03820 USA Tel: (800) 945-2362 (Ext. 360) (603) 749-6434 (Ext. 360) Fax: (603) 742-2346 or (603) 749-6309 repair@aemc.com... -
Page 88: Limited Warranty
This warranty is void if the unit has been tampered ® with, abused or if the defect is related to service not performed by AEMC Instruments. For full and detailed warranty coverage, please read the Warranty Coverage Card, which is attached to the Warranty Registration Card. - Page 89 04/03 99-MAN 100261 v2 ® ® Chauvin Arnoux , Inc. d.b.a. AEMC Instruments 15 Faraday Drive • Dover, NH 03820 USA • Phone: (603) 749-6434 • Fax: (603) 742-2346...
Need help?
Do you have a question about the PowerPad 3945 and is the answer not in the manual?
Questions and answers