
Related Manuals for AEMC PowerPad 3945-B


Summary of Contents for AEMC PowerPad 3945-B
- Page 1 3945-B 3-PHASE POWER QUALITY ANALYZER PowerPad ® IMPORTANT WARRANTY NOTE: By registering online within 30 days from the date of purchase, your warranty will be extended to 3 years E N G L I S H User Manual...
- Page 3 Statement of Compliance Chauvin Arnoux , Inc. d.b.a. AEMC Instruments ® ® certifies that this instrument has been calibrated using standards and instruments traceable to international standards. We guarantee that at the time of shipping your instrument has met its published specifications.
- Page 4 READ CAREFULLY BEFORE USING FOR THE FIRST TIME Your instrument is equipped with a NiMH battery. This technology offers several advantages: • Long battery charge life for a limited volume and weight. • Possibility of quickly recharging your battery. • Significantly reduced memory effect: you can recharge your battery even if it is not fully discharged.
-
Page 5: Table Of Contents
Table of Contents 1. INTRODUCTION ................. 7 International Electrical Symbols ............7 Definition of Measurement Categories ..........8 Receiving Your Shipment ..............8 Ordering Information ................8 1.4.1 Accessories and Replacement Parts ........9 1.4.2 Third Party Accessories ............10 2. PRODUCT FEATURES ............... 11 Description ..................11 Control Functions ................12 Display ....................14 Battery Charge Status ................16... - Page 6 4. OPERATION ..................30 Instrument Configuration (Set-up mode) ..........30 4.1.1 Date / Time ................31 4.1.2 Contrast / Brightness ............31 4.1.3 Colors ..................32 4.1.4 Calculation Parameters............32 4.1.5 Electrical Hookup (electrical network) ........33 4.1.6 Current Sensors ..............34 4.1.7 Baud Rate ................35 4.1.8 Recording................36 4.1.9 Alarm ..................37...
- Page 7 Recording Mode .................57 5.6.1 Saving the Selected Parameters ..........57 5.6.2 Selecting or Deleting a Record ..........59 5.6.3 Selecting a Graphic Display for Recorded Measurements ..60 Saving a Display ................63 Opening a Previously Saved Snapshot ..........64 Printing ....................65 5.10 Help ....................65 6.
- Page 8 7. MAINTENANCE ................90 Recharging the Battery ..............90 Battery Replacement................90 Cleaning .....................91 APPENDIX A: MATHEMATICAL FORMULAS .......... 92 Half-period Voltage and Current RMS Values ..........92 MIN / MAX Values for Voltage and Current ..........93 Peak Values for Voltage and Current ............93 Peak Factors for Current and Voltage ............93 1 sec RMS Values for Voltage and Current ..........94 Voltage and Current Unbalance ..............94...
-
Page 9: Introduction
CHAPTER 1 INTRODUCTION Warning • Never use on circuits with a voltage higher than 600V and an overvoltage category higher than CAT III or IV (probe dependant) • Use in indoor environments only. • Only use accessories that are compliant with the safety standards (IEC 664-1 Ed. -
Page 10: Definition Of Measurement Categories
1.2 Definition of Measurement Categories CAT II: For measurements performed on circuits directly connected to the electrical distribution system. Examples are measurements on household appliances or portable tools. CAT III: For measurements performed in the building installation at the distribution level such as on hardwired equipment in fixed installation and circuit breakers. -
Page 11: Accessories And Replacement Parts
serial cable, RS-232 to USB adapter, US 115V power cord, rechargeable NiMH battery pack, and a USB stick with DataView software and user manual. ® PowerPad Model 3945-B w/36" AmpFlex 193-36 ......Cat. #2130.78 ® ® Includes meter, set of three 36" AmpFlex 193-36 (6500A) sensors, extra large tool bag, soft carry- ®... -
Page 12: Third Party Accessories
115V Power Cord US ...............Cat. #5000.14 1.4.2 Third Party Accessories Converter - USB to RS-232, DB9 M/M ....available online at www.startech.com Converter - Ethernet to RS-232, Model ESP901 ...available online at www.bb-elec.com Order Accessories and Replacement Parts Online: www.aemc.com/store DataView Software Updates Available Online: www.aemc.com ® Power Quality Analyzer Model 3945-B... -
Page 13: Product Features
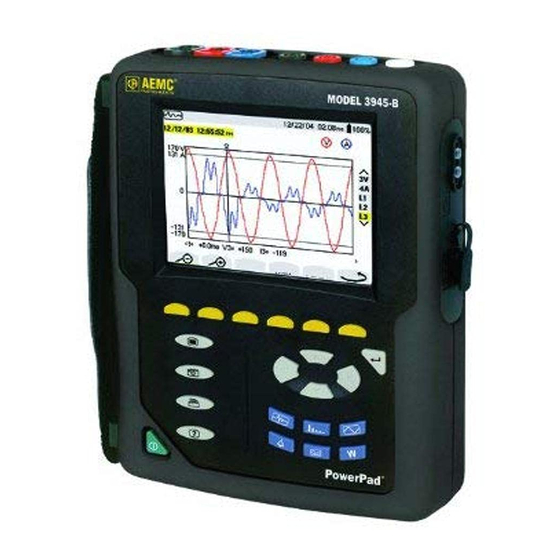
CHAPTER 2 PRODUCT FEATURES 2.1 Description The PowerPad Model 3945-B is a three-phase power quality analyzer that is ® easy-to-use, compact and shock-resistant. It is intended for technicians and engi- neers to measure and carry out diagnostic work and power quality work on one, two or three phase low voltage networks. -
Page 14: Control Functions
2.2 Control Functions MODEL 3945-B 49.99Hz 07/25/02 10:26 100% 0.3 v 0.3 v 0.3 v 300V - 300 <t= 5.0ms V1= +0 > PowerPad ® Figure 2-1 Over molded protective case. Color LCD display with graphic representation of system parameters and ... - Page 15 ON / OFF button. Three (3) current inputs on the top of the instrument to enable the use of current sensors (MN, SR, AmpFlex , and MR probes). ® Four (4) voltage inputs. RS-232 bidirectional optically isolated output for transferring data to a PC (bi- ...
-
Page 16: Display
Alarm Events: • provides a list of the alarms recorded according to the thresholds programmed during configuration • logging of interruption with half-cycle resolution • determination of energy consumption exceedences • stores value, duration, date, time and set point for up to 4096 events 2.3 Display 49.99Hz... - Page 17 Measurement selection: True RMS Measurement Total Harmonic Distortion Crest Factor max/min Maximum and Minimum values Simultaneous display of the various measurements in alphanumeric form Phasor diagram The calculation of the DPF, Tan, KF, Φ, UNB, Min, Max, VAR, Harmonics, PST, and DF parameters and the frequency measurement can only be performed if voltage with a frequency of 41 to 70 Hz is applied to the Ch1 voltage input.
-
Page 18: Battery Charge Status
2.4 Battery Charge Status NOTE: Line cord is plugged in Battery Charging • Battery capacity level relative to full charge • % of total capacity already charged (between 0 and 99%) • Battery sign and % are blinking NOTE: Line cord may or may not 100% be plugged in Battery Full... -
Page 19: Specifications
CHAPTER 3 SPECIFICATIONS 3.1 Reference Conditions Parameter Reference Conditions Ambient temperature 73°F ± 5°F (23°C ± 3°C) Humidity Atmospheric pressure 25.4" Hg to 31.3" Hg (860 to 1060 hPa) Phase voltage 230Vrms and 110Vrms ±2% without DC Clamp current circuit input voltage 0.03V to 1Vrms without DC (<0.5%) AmpFlex current circuit input voltage... -
Page 20: Current Inputs
3.2.2 Current Inputs Operating Range: 0 to 1V Input Impedance: 100kΩ for current probe circuit and 12.4kΩ for AmpFlex circuit ® Overload: 1.7V 3.2.3 Accuracy Specifications (excluding current probes) Function Range Display Resolution Accuracy Frequency 40 to 69Hz 0.01Hz ±0.01Hz Single phase RMS voltages 15V to 480V 0.1V ±0.5% ±... -
Page 21: Nominal Range Of Use
Function Range Display Resolution Accuracy Apparent Energy (Vah) 0VAh to 9999MVAh 4 digits ±1% ± 1ct Unbalance (Vunb, Aunb) 0% to 100% 0.1% ±1% ± 1ct three phase supply Phase angle (V/I; I/I; V/V) -179° to +180° 1° ±2° Harmonics ratios F = 40 to 69Hz 0% to 999% 0.1%... -
Page 22: Mechanical Specifications
3.3 Mechanical Specifications Dimensions: 9.5 x 7.0 x 2.0" (240 x 180 x 55mm) Weight: 4.6 lb (2.1kg) Shock and Vibration: per EN 61010-1 Tightness: IP 50 per EN 60529 (electrical IP2X for the terminals) 3.4 Environmental Specifications Altitude: Operating: 0 to 2000 meters (6560 ft) Non-Operating: 0 to 10,000 meters (32800 ft) Temperature and % RH: Reference Range Operating Range... -
Page 23: Ac Current Probe Model Sr193
3.6 AC Current Probe Model SR193 (3945-B accuracy included) When installing probes, face the arrow on the probe in the direction of the load. Nominal Range: 1000A for f ≤1kHz Measurement Range: 3A to 1200A max (I >1000A not continuously) Currents <0.5A will be displayed as zero with this probe. Probe Output Signal: 1mV Maximum Clamping Diameter: 2"... -
Page 24: Ac Current Probe Mn93 Probe
3.7 AC Current Probe MN93 Probe (3945-B accuracy included) When installing probes, face the arrow on the probe in the direction of the load. Nominal Range: 200A for f ≤ 1kHz Measurement Range: 2A to 240A max (I > 200A not permanent) Currents <0.5A will be displayed as zero with this probe. Probe Output Signal: 5mV Maximum Clamping Diameter: 0.8"... -
Page 25: Ac Current Probe Mn193 Probe
3.8 AC Current Probe MN193 Probe (3945-B accuracy included) When installing probes, face the arrow on the probe in the direction of the load. The 5A range of the MN193 is designed to work with secondary current transform- ers. Best accuracy is available when entering the transformer ratio (e.g. 1000/5A). When used to measure 5A direct, the resolution will be limited to 0.1A max. -
Page 26: Ac Current Probe Ampflex ® Probe
Factors affecting accuracy (% of the output signal) Conditions Range Error ≤200 ppm/K or Ambient temperature 14° to 131°F (-10° to 55°C) 0.2% per 10K Relative humidity 10° to 35°C 85% < 0.2% 40Hz to 1kHz: < 0.7% Frequency response 40Hz to 3kHz 1 to 3kHz: <2% Positions of the cable in the jaws... -
Page 27: Ac Current Probe Miniflex ® Sensor
Accuracy Primary current (A 10 to 100A 100 to 6500A Accuracy (% of the output signal) ≤3% ± 1ct ≤2% Phase shift (°) ≤0.5° ≤0.5° Factors affecting accuracy (% of the output signal) Conditions Range Error Temperature -4 to 140°F (-20 to 60°C) 0.2% per 10°C Relative humidity 10 to 90% RH... -
Page 28: Ac Current Probe Mr193 Probe
Accuracy Primary current (A 20 to 100A 100 to 1000A Accuracy (% of the output signal) ≤3% ≤2% Phase shift (°) -90° ±0.5° Factors affecting accuracy (% of the output signal) Conditions Range Error Temperature -4 to 140°F (-20 to 60°C) 0.2% per 10°C Relative humidity 10 to 90% RH... - Page 29 Accuracy 800 to 1000A Primary current 10 to 100A 100 to 800A 800 to 1300A PEAK Accuracy ≤1.5% + 1ct ≤3% + 1ct ≤5% + 1ct Primary current 10 to 100Α 100 to 1000A – Phase angle ≤2.0° ≤15° – Factors affecting accuracy (% of the output signal) Conditions...
-
Page 30: Three-Phase 5A Adapter Box
3.12 Three-phase 5A Adapter Box This adapter is a three-phase adapter with three 5A inputs L1, L2, L3 and three AC voltage outputs. All circuits are independent and isolated between input and output. The outputs are equipped with connectors to mate with the PowerPad ®... -
Page 31: Connecting To Secondary Current Transformer
3.12.1 Connecting to Secondary Current Transformer (CT) WARNING: Use caution when connecting to a secondary current trans- former. Short the two leads of each secondary current measurement transformer. Never open a secondary circuit of a CT if its primary circuit is connected to a supply voltage. -
Page 32: Operation
CHAPTER 4 OPERATION NOTE: Charge the instrument fully before use. The instrument is turned ON by pressing the green button. The startup screen appears and indicates the instrument’s software version and serial number. If there is no AC power supply, the instrument operates on batteries. The instru- ment’s batteries are charged when it is connected to a 120/240;... -
Page 33: Date / Time
WARNING: When “CLEAR MEMORY” is selected, all configurations are deleted. • Choose the language by pressing the function button below the desired language. Your choice will remain highlighted in yellow. • Select the configuration settings you wish to modify, with the buttons. -
Page 34: Colors
4.1.3 Colors • Highlight COLORS with the buttons, then press the button. The following screen will appear: 07/25/02 10:26 100% Phase voltage < > Phase current < > Phase voltage < > Phase current < > Phase voltage < > Phase current <... -
Page 35: Electrical Hookup (Electrical Network)
4.1.5 Electrical Hookup (electrical network) • Highlight ELECTRICAL HOOKUP with the buttons, then press the button. The following screen will appear: 07/25/02 10:26 100% Single-Phase Two-Phase 3 Phase 3-Wire 3 Phase 4-Wire Figure 4-3 • Choose the hookup type with the buttons. -
Page 36: Current Sensors
Synchronization of the Display in “Waveform” mode: Display selection Reference channel (vertical right menu) for synchronization 4A / 3A 4.1.6 Current Sensors • Highlight CURRENT SENSORS with the buttons, then press the button. The following screen will appear: 07/25/02 10:26 100% 200A MN clamp SR clamp AmpFlex MR clamp 1000 / 5A... -
Page 37: Baud Rate
buttons to select the desired measurement range of 200, 100 or 5 Amps. If the 5 Amp range is selected, a choice for programming the ratio is offered. To change the ratio, press the button to highlight the secondary value. Pressing either of the buttons will toggle this value to either 1 or 5. -
Page 38: Recording
4.1.8 Recording • Highlight RECORDING with the buttons, then press the button. The following screen will appear: SET-UP If these options are not selected, all the harmonics (odd and even) will be recorded. Figure 4-5 • Four recording set-ups are available. •... -
Page 39: Alarm
Press the button again to move to the right to modify the last value needed to complete the definition. Here you will choose whether to include all harmonics or only the odd harmonics. Use the buttons to make this selection. The diamond preceding the Odd Only choice will appear filled in for selected and unfilled for not selected. - Page 40 A programmed alarm must be set to “ON” to function properly (general activation or deactivation of alarms is generated in the alarm mode). Modifying one or several characteristics of an alarm set to “ON”, auto- matically switches it to “OFF”. ...
-
Page 41: Clear Memory
4.1.10 Clear Memory When CLEAR MEMORY is selected, the following question is displayed: Are you sure you want to delete all the data? • Choose the answer with the buttons. • Press the button to apply your choice. The Configuration menu will once again be displayed on the screen. -
Page 42: Display Modes
CHAPTER 5 DISPLAY MODES The screen presentations in this section depict three-phase setups for the purpose of explaining the various choices. Your actual screens will appear differently based upon your particular set up. 5.1 Waveform Mode Press the waveform display mode button - 5.1.1 RMS Voltage Measurement on a Three-phase System 49.99Hz... -
Page 43: Rms Voltage Measurement On 3 Phases
The measurement type is selected using one of the six variable function but- tons. All of these measurements are valid in 3U, 3V, 3A, L1, L2 and L3. The waveforms are selected by pressing the buttons: 3U displays the three phase-phase voltages of a three-phase system 3V displays the three voltages of a three-phase system 3A displays the three phase currents of a three phase-3 wire system The neutral current is not a direct measurement, but the resulting total of the... -
Page 44: Rms Current Measurement
5.1.3 RMS Current Measurement on the 3 Phases and Neutral Current on a Three Phase- 4 Wire System 60.00Hz 07/25/02 10:26 100% 19.1 18.5 17.1 - 27 <t= 5.0ms l1= +26 12= -13 13= -13 IN= +1 > Figure 5-3 5.1.4 Total Harmonic Distortion Measurement on One Phase 60.00Hz... -
Page 45: Minimum And Maximum Current Value Measurements
5.1.5 Minimum and Maximum Current Value Measurements 59.99Hz 07/25/02 10:26 100% 21.7 18.8 17.6 18.5 17.1 15.0 +11.4 +25.8 +24.0 PEAK+ –11.0 –25.8 –24.8 PEAK - Figure 5-5 Crest Factor - refreshed every 250ms (but calculated every second). Select 3V or 4A with to obtain the MIN, AVG, MAX, or PEAK values for current or voltage. -
Page 46: Simultaneous Display Of Current Measurements
5.1.6 Simultaneous Display of the Different Current Measurements 59.99Hz 07/25/02 10:26 100% 10.4 18.4 16.9 11.6 +0.0 +0.0 –0.3 –0.3 27.7 1.61 1.40 1.45 1.92 1.03 1.00 25.9 Figure 5-6 As seen on the bar on the right, K factor is only available for currents 4A, 3A or 2A, depending on hook up of leads. -
Page 47: Phasor Diagram Display (Fresnel Diagram)
5.1.7 Phasor Diagram Display (Fresnel Diagram) 59.99Hz 07/25/02 10:26 100% 202.8 v 198.7 v 203.2 v +122 ° +118 ° +120 ° UNBALANCE Figure 5-7 Absolute value of voltage or current, depending on display selection. Φ 12 corresponds to phase angle between channel 1 and channel 2 Φ... -
Page 48: Harmonics Mode
5.2 Harmonics Mode Press the harmonic display mode button - Use the function buttons to select the type of harmonic analysis: V - Single phase voltage analysis A - Current analysis VA - Power and direction flow analysis U - Phase-to-phase voltage analysis buttons allow the user to zoom in or out, in increments of 2%, 5%, 10%, 20%, 50% and 100%. -
Page 49: Single Phase And Phase-To-Phase Current Analysis
Cursor enables selection up to 50 harmonic, with the buttons. As soon as the 25 harmonic is reached, the 25 to 50 range appears (0 represents the DC component). Selection of expert mode -.+ is available for 3-phase hookups by pressing the buttons (see §5.2.4 for description). -
Page 50: Power And Direction Flow Analysis
5.2.3 Power and Direction Flow Analysis 59.98Hz 07/25/02 10:26 100% VAh03 - 122 ° min - 22 % max - 22 % -100 9 11 13 15 17 19 21 23 25 Figure 5-10 Harmonics on this screen are shown with either a positive or negative orientation. Since the bar selected in this example is negative, it indicates that it is a harmonic from load to source. -
Page 51: Harmonic Analysis In Expert Mode
5.2.4 Harmonic Analysis in Expert Mode Press on the button to select “-.+” and then either the “V” or “A” variable function button “V” or “A”. Example of a typical display: 59.98Hz 07/25/02 10:26 100% 15.5 Figure 5-11 • First column: The harmonics inducing a negative sequence are displayed. •... -
Page 52: Power / Energy Mode
5.3 Power / Energy Mode Press the power display mode button - . This will enable: • Measurement of the real power (generated and consumed) • Measurement of reactive power (capacitive or inductive) • Measurement of apparent power W... - Choice of power parameters PF... -
Page 53: G Button
5.3.2 Button This function key is used to display generated or consumed power, or real, reactive and apparent energy. This button toggles the display between generated energy (from load to supply) and consumed energy (from supply to load) each time it is pressed. When the is highlighted (yellow background) the display shows generated energy. -
Page 54: Transient Mode
5.4 Transient Mode Press the transient display mode button - Transients are displayed in the form of waveforms. All channels (up to 6, based upon configuration) are stored in memory for each transient. Up to 50 transients can be captured, which include the pre-tripped waveform, the tripped waveform and two post trip waveforms for each active input. - Page 55 The table below lists the capture threshold levels, based on the probe in use (for the current channels) and voltage at the different percent selections. Thresholds 100% MN93 200A 100A MN193 (100A) 100A MN193 (5A) [ (primary x 5) ÷ (secondary) ] x (percent x 100) SR193 1000A 500A...
-
Page 56: Opening Previously Stored Transients
5.4.1 Opening Previously Stored Transients The screen below can be accessed with the retrieve button. It displays a list transients previously stored in the memory. 07/25/02 10:56 100% SELECTION OF TRANSIENT TEST 05 05/07/02 14:31:41 TEST 04 05/07/02 14:31:41 TEST 03 05/07/02 14:31:21 TEST 02 05/07/02 14:31:04... - Page 57 The display below shows the transient selected in Fig. 5-16 on the previous page. 07/25/02 11:22 100% 07/25/02 11:24:21 -30A <t= +0.0ms I1= -1 12= +0 I3= -20 > Figure 5-17 The screen displays 4 cycles of 256 points/cycle, with 1 cycle before the trigger and 3 cycles after.
-
Page 58: Alarm Mode
5.5 Alarm Mode Press the alarm display mode button - Figure 5-18 presents the various alarms stored. NOTE: The threshold values must first have been programmed in the mode. Also, the alarm event, or alarm capture, must end before an alarm will be dis- played. -
Page 59: Recording Mode
5.6 Recording Mode After a recording is set, the instrument will go into sleep mode (no display) to save the batteries. The recording will start as programmed. Press any button other than the ON/OFF button to turn ON the display again. Turning off the PowerPad clears the schedule, even if turned on again, the recording will ®... - Page 60 Select a recording storage rate using the buttons. NOTE: The possible storage rates are 1, 5 or 20 sec; 1, 2, 5, 10 or 15 min. Enter the record name with the buttons, which scroll through the alphabet and numbers. Up to 7 characters may be entered. Save the changes with the button.
-
Page 61: Selecting Or Deleting A Record
5.6.2 Selecting or Deleting a Record 07/25/02 10:56 100% SELECTION OF RECORDING TEST 07/25/02 17:58 > In progress PUMP 07/18/02 17:58 > 07/18/02 11:45 MOTORA 07/12/02 14:41 > 07/12/02 16:40 Figure 5-20 If the “@” symbol appears as the first letter of the recording name (e.g. @EST), the data may be corrupted and should be checked carefully. -
Page 62: Selecting A Graphic Display For Recorded Measurements
5.6.3 Selecting a Graphic Display for Recorded Measurements Recorded data can be displayed in graphic form. • Select the recording to be displayed using the buttons. Then, open the recording by pressing the button. A screen similar to figure 5-21 will appear. 07/25/02 10:56 100% TEST... - Page 63 Display of the average voltage for each of the 3 voltages. Moving the cursor with the buttons updates the values to reflect the new cursor position. Selection of the 3 phases or each phase separately with the buttons. ...
- Page 64 Graphic Display of Average Power After returning to the Measurement Selection Screen (see Fig. 5-21) use the “../..” button to view more recorded parameters, if necessary. Pressing the “W” button, will bring up a screen similar to Fig. 5-24 below. 07/25/02 10:38 100% 07/25/02 10:13:21...
-
Page 65: Saving A Display
The energy over a selected period can be calculated from the average power records: • Move the cursor to the start time. • Press the function button. • Move the cursor with buttons to the desired end time. • The energy value is displayed, with end date and end time. It is possible to make an energy measurement over several recording ranges in the 4 quadrants. -
Page 66: Opening A Previously Saved Snapshot
5.8 Opening a Previously Saved Snapshot A short press (about 1s) on the button gives access to the menu of snapshots that have been saved. The small icon to the left of each snapshot (date and time) tells you what type of data was stored. -
Page 67: Printing
5.9 Printing The print button allows a screen to be printed directly to a dedicated printer con- nected to the serial port. 59.99Hz 07/25/02 10:26 100% 202.5 v 202.0 v 202.7 v 300V -300 <t= 5.0ms V1= +276 V2= -140 V3= -145 >... -
Page 68: Dataview ® Software
CHAPTER 6 DATAVIEW SOFTWARE ® 6.1 Installing DataView ® DO NOT CONNECT THE INSTRUMENT TO THE PC BEFORE INSTALLING THE SOFTWARE AND DRIVERS. NOTE: When installing, the user must have Administrative access rights during the installation. The users access rights can be changed after the installation is complete. - Page 69 NOTE: If installing onto a Vista based computer the User Account Control dialog box will be displayed. Select the Allow option to proceed. A Set-up window, similar to the one below, will appear. Figure 6-1 There are several different options to choose from. Some options require an internet connection.
- Page 70 In the Customer Information window, enter a Name and Company, then click Next. 10. In the Setup Type window that appears, select the “Complete” radio button option, then click Next. 11. In the Select Features window that appears, select the instrument’s control panel that you want to install, then click Next.
-
Page 71: Connecting The Model 3945-B To Your Computer
NOTE: The installation of the drivers may take a few moments. Windows may even indicate that it is not responding, however it is running. Please wait for it to finish. 14. When the drivers are finished installing, the Installation Successful dialog box will appear. -
Page 72: Opening The Control Panel
6.3 Opening the Control Panel To open the Power Analyzer Control Panel: • Double-click the PowerPad Icon that was created during installation, located on the desktop. • The Connection window will appear (see Figure 6-4). Figure 6-4 • Make sure that the serial port displayed in the dialog box matches the port you plugged the serial cable into. - Page 73 Figure 6-5 This Control Panel displays: • Recorded Data from the instrument • Real-time Data • Connection status • The communications port and speed of the connection • The model number, serial number, and firmware revision • The battery charge level, whether the battery is charging or discharging, and the time on the clock •...
-
Page 74: Common Functions
6.4 Common Functions The buttons described below appear on several DataView Setup Screens. ® Re-Read from Instrument: Reads the current configuration of the • PowerPad attached via the serial cable. ® • Save to File: Saves the current configuration. This file will reside on the computer’s disk drive. Saving different configuration setups can be useful for future functions and tests. -
Page 75: Setup
6.5.1 Setup Figure 6-6 • Reactive Values Calculation: With or without harmonics. Applies to VAR cal- culation. • Nominal Frequency: 50 or 60Hz. This parameter determines the correction coefficients used for calculating power and energy. • Current Sensor: MN93, MN193, SR193, MR193, A193 AmpFlex , MiniFlex ®... -
Page 76: Instrument Display
6.5.2 Instrument Display The PowerPad display window allows you to customize the display (colors, clocks, ® language and contrast). Figure 6-7 For detailed instructions and descriptions for any feature in a dialog box, click on the Help Button (lower right-side of the dialog box), or right-click on the feature you want information about. -
Page 77: Alarm Conditions Configuration
6.5.3 Alarm Conditions Configuration The Alarm Conditions window allows you to set up 10 alarm configurations. Figure 6-8 • Hysteresis: This value for alarms is set to prevent multiple recordings of an event that goes above the threshold and a certain percentage below it at times. - Page 78 • Capture Parameter: The Alarm will be triggered based on the value of the selected parameter. Choices include: None: no alarm Vrms: voltage root mean squared Vunb: v oltage unbalance Urms: voltage phase minus phase root Aunb: current unbalance mean squared frequency Arms: current root mean squared Akf: current K factor VPST: voltage short term flicker Vthd: voltage total harmonic distortion...
-
Page 79: Recordings Configuration
6.5.4 Recordings Configuration The Recording window shows the dialog box used to configure the parameters for a recording session. Figure 6-9 Four different configurations are available. More configurations can be saved by pressing “Save to File” and recalled later by pressing “Load From File”. Check the configuration you wish to set up: 1, 2, 3 or 4. -
Page 80: Transients
6.5.5 Transients The Transients window allows you to set up the criteria for capturing transients. Figure 6-10 Type a name for the session, up to seven characters. Select the date and time to begin and end the search for transients. Select the percent deviation for voltage and current transients. -
Page 81: Monitoring
6.5.6 Monitoring The EN50160 standard defines limiting values and permissible variations of the voltage quality for the European Community. It defines which parameters are relevant, and how are they measured. Continuous or random sampling control of the voltage quality provides the supplier of electric energy with a reliable basis when dealing with network problems, and it contributes to quality assurance. -
Page 82: Running The Test
6.5.7 Running the Test After configuring the instrument, press “OK”. The status window will display if a recording is ready to start. Select Yes to schedule a recording, select No to bring you back to the Configure dialog box. 6.6 Real-time Windows When your setup is completed, you can display different views on the screen of real-time data and waveforms. -
Page 83: Power/Energy
Figure 6-12c On each screen, you can: • Select the type of data to see. • Stop the update with the Hold function. • Print the screen selected. • Save it to disk. There is a choice of a database to be viewed in DataView or a .csv file to view in a spreadsheet program. -
Page 84: Trend
The data for all available phases are downloaded to a database or spreadsheet, not just what is shown on the screen. 6.6.3 Trend Figure 6-14 Shows a real-time trend of data from the PowerPad . The data is an average of ®... -
Page 85: Recordings
Following are examples of each tab listed in the display window. 6.7.1 Recordings Figure 6-15a Figure 6-15b The Recording window displays a list of recordings within the PowerPad ® These recordings can be selected and downloaded to a database. Power Quality Analyzer Model 3945-B... -
Page 86: Photographs
6.7.2 Photographs Figure 6-16a Figure 6-16b The Photographs window displays a list of photographs (snapshots), with the date and time, taken when the camera button was pressed. When “View” is selected, it shows the waveforms, power data and Bitmap image of the PowerPad screen from the time the camera button was pressed. -
Page 87: Alarms
6.7.3 Alarms Figure 6-17 The Alarms window displays a list of alarms recorded on the PowerPad . A subset ® of the list, can be viewed by the phase of the triggering event. Alarms can be selected and downloaded to a database. The downloaded alarms contain no more information than is shown in the screen display. - Page 88 The Transients window displays transients stored on the PowerPad It shows the ® number and name of the recording, and the time it began and ended. The selected transient(s) can either be downloaded or deleted. Figure 6-18b The downloaded result contains many waveforms. Use the controls “><” and “<>”, located at the lower right corner of the window, to zoom in or out of the data.
-
Page 89: Monitoring
6.7.5 Monitoring The Monitoring window displays recorded tests that can be downloaded and ana- lyzed. Figure 6-19a After selecting a recording and clicking “View”, the summary window appears showing the results after all the data has been downloaded to a database. It dis- plays the name, percent of the 10-minute periods that it has been out of range, followed by the range it needed to be within. -
Page 90: Saving Real-Time Measurements
6.7.6 Saving Real-time Measurements Real-time data received from an instrument can be saved directly into a record- ing session database. This differs from the process of downloading and saving recorded data in that the measurements are stored on the computer as the instru- ment measures them. - Page 91 The Operator and Site tabs allow you to maintain lists of operators and sites, saving you time when specifying parameters for reports. On the left of the Operator and Site tabs is the list of previously defined Operators and Sites. On the right of the Operator and Site tabs is the individual parameters that will be saved in an associated database.
-
Page 92: Maintenance
CHAPTER 7 MAINTENANCE Use only factory specified replacement parts. AEMC will not be held responsible ® for any accident, incident, or malfunction following a repair done other than by its service center or by an approved repair center. After receiving your PowerPad shipment, charge and discharge the instru- ®... -
Page 93: Cleaning
7.2 Cleaning Disconnect the instrument from any source of electricity. • Use a soft cloth, lightly dampened with soapy water • Wipe with a damp cloth and then dry with a dry cloth • Do not splash water directly on the clamp •... -
Page 94: Appendix A: Mathematical Formulas
APPENDIX A MATHEMATICAL FORMULAS FOR VARIOUS PARAMETERS NOTE the following abbreviations used in this section: NSHC = number of samples per half cycle (between two consecutive zeros) NSC = number of samples per cycle NSS = number of samples in a second (multiple of NSC) V = voltage phase to neutral U = voltage phase to phase Half-period Voltage and Current RMS Values Half-cycle RMS phase-to-neutral voltage of phase (i+1) with i X [0;... -
Page 95: Min / Max Values For Voltage And Current
MIN / MAX Values for Voltage and Current Vmax[i] = max (Vdem[i]), Vmin[i]= min (Vdem[i]) Umax[i] = max (Udem[i]), Umin[i] =min (Udem[i]) Amax[i] = max (Adem[i]), Amin[i]=min (Adem[i]) (Avg calculation on 1s) Peak Values for Voltage and Current (Updated on each waveform refresh) ∈... -
Page 96: Sec Rms Values For Voltage And Current
1 sec RMS Values for Voltage and Current − Vrms [][ ] Single rms voltage i + 1 phase ∑ ⋅ − Urms [][ ] Compound rms voltage i + 1 phase ∑ ⋅ − Arms [][ ] Rms current i + 1 phase ∑... -
Page 97: Calculation Of Harmonic Bins
Calculation of Harmonic Bins Harmonic bins are calculated by FFT with 16 bit resolution (1024 samples on 4 cycles) without windowing (IEC 1000-4-7). From real and imaginary compo- nents, each bin ratio is calculated on each phase Vharm[3][51], Uharm[3][51] and Aharm[3][51] in proportion to the fundamental value and the phase angles Vph[3][51], Uph[3][51] and Aph[3][51] between each bin and the fundamental. -
Page 98: K Factor
K Factor n=50 [][ ] ∑ Aharm K factor for the i + 1 phase n=50 [][ ] ∑ Aharm Different Power Levels 1 Sec NSS-1 [][ ] [][ ] ∑ Active power i + 1 phase VA[i] = Vrms[i] Arms[i] Apparent power i + 1 phase NSS-1 [][ ] ∑... -
Page 99: Ratios
Ratios W[i] PF[i] = i + 1 phase power factor VA[i] DPF[i] = cos(φ[i]) i + 1 phase displacement factor Tan[i] = tan(φ[i]) i + 1 phase tangent NSS-1 [][ ] [][ ] ∑ Cosine angle between voltage cos(φ[i]) = fundamental and i + 1 phase current NSS-1 NSS-1... - Page 100 Total reactive capacitive energy consumed: VARhC[0][3] = VARhC[0][0] + VARhC[0][1] + VARhC[0][2] Total reactive inductive energy consumed: VARhL[0][3] = VARhL[0][0] + VARhL[0][1] + VARhL[0][2] W[i] ∑ Wh [ 1 ][ i ] = Active energy generated phase i + 1 3600 Tint VA[i]...
-
Page 101: Hysteresis
Hysteresis Hysteresis is a filtering principle, often used after the threshold detection has occurred. A correct setting of hysteresis value will avoid repeated triggering when the measure is varying close to the threshold. The event detection is activated when the measure is going over the threshold but it can only be deactivated if the measure goes under the threshold minus the value of the hysteresis. -
Page 102: Appendix B: Glossary
APPENDIX B GLOSSARY OF TERMS Symbol Definition Frequency Vrms Volts rms Arms Amps rms Watts (Real Power) Power Factor Urms Volts (phase-to-phase rms) Vthd Volts total harmonic distortion Athd Amps total harmonic distortion VARS VARS (reactive power) Displacement power factor Uthd Volts total harmonic distortion (phase-to-phase) Volts crest factor... - Page 103 Σ/3 Average value of three-phase capture Three phases of voltage (phase-to-phase) Three phases of voltage (phase-to-neutral) Three phases of current Three phases of current including derived neutral current Phase one of voltage (phase-to-neutral) plus current Phase two of voltage (phase-to-neutral) plus current Phase three of voltage (phase-to-neutral) plus current Up/Down buttons Enter button...
- Page 104 Battery charging or discharging Battery full 100% Battery empty discharging New battery discharging Power On/Off Validate the setting W... Power parameters PF... Power factor Starts energy accumulation Stops current activity Resets counter to zero Displays each type of energy (real, reactive, apparent) Starts capture or recording search Displays a captured transient Deletes a captured transient...
-
Page 105: Repair And Calibration
If the instrument is returned for calibration, we need to know if you want a standard calibration, or a calibration traceable to N.I.S.T. (Includes calibration certificate plus recorded calibration data). Ship To: Chauvin Arnoux , Inc. d.b.a. AEMC Instruments ® ®... -
Page 106: Limited Warranty
Instruments, not by the distributor from ® whom it was purchased. This warranty is void if the unit has been tampered with, abused or if the defect is related to service not performed by AEMC ® Instruments. Full warranty coverage and product registration is available on our website at www.aemc.com/warranty.html. - Page 108 10/15 99-MAN 100261 v37 Chauvin Arnoux , Inc. d.b.a. AEMC Instruments ® ® 15 Faraday Drive • Dover, NH 03820 USA • Phone: (603) 749-6434 • Fax: (603) 742-2346 www.aemc.com...
Need help?
Do you have a question about the PowerPad 3945-B and is the answer not in the manual?
Questions and answers