Table of Contents
Advertisement
Quick Links
CellAdvisor JD700B Series
Product Name/Family Brand
Attribute/Descriptor
Type of Manual
User's Guide
JD785B/JD745B Base Station Analyzer
JD786B/JD746B RF Analyzer
JD788B/JD748B Signal Analyzer
Network and Service Enablement
One Milestone Center Court
Germantown, Maryland 20876-7100 USA
Toll Free 1-855-ASK-JDSU • Tel +1-240-404-2999 • Fax +1-240-404-2195
www.jdsu.com
Advertisement
Table of Contents

Related Manuals for JDS Uniphase CellAdvisor JD700B Series


Summary of Contents for JDS Uniphase CellAdvisor JD700B Series
- Page 1 CellAdvisor JD700B Series Product Name/Family Brand User’s Guide Attribute/Descriptor JD785B/JD745B Base Station Analyzer Type of Manual JD786B/JD746B RF Analyzer JD788B/JD748B Signal Analyzer Network and Service Enablement One Milestone Center Court Germantown, Maryland 20876-7100 USA Toll Free 1-855-ASK-JDSU • Tel +1-240-404-2999 • Fax +1-240-404-2195...
- Page 2 CellAdvisor JD700B Series User’s Guide JD785B/JD745B Base Station Analyzer JD786B/JD746B RF Analyzer JD788B/JD748B Signal Analyzer Network and Service Enablement One Milestone Center Court Germantown, Maryland 20876-7100 USA Toll Free 1-855-ASK-JDSU • Tel +1-240-404-2999 • Fax +1-240-404-2195 www.jdsu.com...
- Page 3 Every effort was made to ensure that the information in this document was accurate at the time of release. However, information is subject to change without notice, and JDS Uniphase reserves the right to provide an addendum to this document with information not available at the time that this document was created.
- Page 4 Foundation (http://www.apache.org/). This product used free library for JPEG image compression written and distributed by Independent JPEG Group or IJG (http://www.ijg.org/). See “Viewing OSS license” on page 40 for more information. Ordering information This document is a product of JDSU, issued as part of the JD700B Series analyzers.
- Page 5 of as unsorted municipal waste and should be collected separately and disposed of according to your national regulations. In the European Union, all equipment and batteries purchased from JDSU after 2005-08-13 can be returned for disposal at the end of its useful life. JDSU will ensure that all waste equipment and batteries returned are reused, recycled, or disposed of in an environmentally friendly manner, and in compliance with all applicable national and international waste legislation.
-
Page 6: Table Of Contents
Table of Contents About This Guide ..........................17 Purpose and scope................................18 Assumptions ..................................18 Safety and compliance information ..........................18 Conventions ..................................19 Technical assistance ................................ 20 Chapter 1 JD700B Series Overview ....................22 About the JD700B series ..............................23 Features and capabilities .............................. - Page 7 Activating StrataSync ..............................43 Setting up Internet connection ..........................43 Establishing a connection to StrataSync ......................... 44 StrataSync status indicators ............................ 45 Setting communication ..............................45 Configuring Ethernet ............................... 46 Setting for JDViewer and JDRemote ........................46 Setting USBTMC mode ............................46 Setting SCPI mode ..............................
- Page 8 Spectrum Replayer ............................... 100 Setting limit for interference analyzer ..........................101 Chapter 6 Using GSM/GPRS/EDGE Signal Analyzer ..............103 Introduction ................................... 104 Display overview ................................104 Connecting a cable ................................ 105 Direct connection ..............................105 Indirect connection ..............................105 Over the air (OTA) ..............................106 Selecting measurement mode ............................
- Page 9 Multi-ACLR ................................144 Spurious emissions ............................... 145 Setting limit for RF tests ............................147 Conducting modulation measurements .......................... 147 Constellation ................................. 147 Code domain power .............................. 148 Relative code domain power ..........................151 Codogram ................................153 RCSI ..................................155 CDP Table ................................157 Setting limit for modulation tests ...........................
- Page 10 Signal performance test ............................211 DAS test ................................212 Performing power statistics CCDF measurements ......................213 Setting measure setup ............................213 Measurement example ............................214 Performing carrier aggregation measurements ......................214 Setting measure setup ............................214 Setting display ..............................215 Measurement example ............................
- Page 11 Measurement example ............................279 Using marker ................................ 279 Conducting LTE - TDD OTA measurements ........................280 Channel scanner..............................280 ID scanner ................................281 Multipath profile ..............................283 Control channel ..............................284 Datagram ................................286 Route map ................................288 Chapter 10 Using CDMA Signal Analyzer ..................
- Page 12 Setting frequency ..............................335 Setting amplitude ..............................336 Setting average ..............................338 Setting sweep mode ............................. 338 Setting trigger source ............................338 Setting external clock ............................339 Conducting spectrum measurements ..........................340 Setting trace ................................. 340 Conducting RF measurements ............................341 Channel power ..............................
- Page 13 Setting limit for RF tests ............................388 Conducting power vs. time measurements ........................389 Power vs. time (slot) ............................. 389 Power vs. time (frame) ............................390 Power vs. time (mask) ............................391 Timogram ................................393 Setting limit for power vs. time tests ........................394 Conducting modulation measurements ..........................
- Page 14 Route map ................................443 Chapter 14 Using Cable and Antenna Analyzer ................446 Introduction ................................... 447 Display overview ................................447 Selecting measurement mode ............................448 Configuring test parameters ............................448 Setting frequency ..............................448 Setting distance ..............................449 Adjusting scale ..............................449 Setting sweep mode .............................
- Page 15 Performing interference analysis ........................... 479 Selecting measurement mode ..........................479 Setting CPRI measure setup ..........................479 Configuring test parameters ..........................481 Conducting spectrum measurements ........................485 Conducting spectrogram ............................487 Conducting RSSI ..............................488 Performing spectrum replayer ..........................490 Setting limit for interference analyzer ........................491 Performing PIM detection (single and multiple carriers) ....................
- Page 16 Chapter 18 Performing Fiber Inspection ..................518 Introduction ................................... 519 Display overview ................................519 Connecting a fiber microscope ............................519 Selecting measurement mode ............................520 Configuring test parameters ............................520 Selecting profile and tip ............................520 Setting preferences ............................... 520 Performing fiber inspection ............................
-
Page 17: About This Guide
About This Guide Topics discussed in this chapter include the following: Purpose and scope ........................18 Assumptions ..........................18 Safety and compliance information ................... 18 Conventions ..........................19 Technical assistance ........................20 Sections “Safety and compliance information” and “Conventions” in this chapter contain information in French as well. -
Page 18: Purpose And Scope
About This Guide Purpose and scope The purpose of this guide is to help you successfully operate the JD700B series (firmware version 3.020 and later) and use its features and capabilities. This document includes instructions that describe how to operate, set up, configure, and use the JD700B series, consisting of JD785B/JD745B Base Station Analyzer, JD786B/JD746B RF Analyzer, and JD788B/JD748B Signal Analyzer. -
Page 19: Conventions
About This Guide (ESD). Utilisez ESD procédures de précaution en cas de contact, la suppression ou l'insertion de pièces de l'EDD et des assemblages sensibles, ou des dommages aux composants pourraient en résulter. Un dispositif électrostatique sensible ne peut supporter des pointes de tension de 10 à 100 volts. Toute décharge supérieur à... -
Page 20: Technical Assistance
About This Guide This symbol represents hazardous voltages. It may be associated with either a DANGER, WARNING, or CAUTION message. Ce symbole signale la présence d'un risque d'électrocution. This symbol represents a risk of explosion. It may be associated with either a DANGER, WARNING, or CAUTION message. - Page 21 About This Guide Table 4 Technical assistance centers Region Phone Number E-mail Address Americas 1-855-ASK-JDSU (option #3) catvsupport@jdsu.com (1-855-275-5378, option #3) Europe, Africa, and Mid-East +49 (0) 7121 86 1345 hotline.europe@jdsu.com (JDSU Germany) Asia and the Pacific China 400 122 6542 tac.apac@jdsu.com Taiwan 008 06651950...
-
Page 22: Chapter 1 Jd700B Series Overview
Chapter 1 JD700B Series Overview This chapter provides a general description of the JD700B series. Topics discussed in this chapter include the following: About the JD700B series ......................23 Features and capabilities ......................23 Options ............................24 Specifications .......................... -
Page 23: About The Jd700B Series
Chapter 1 JD700B Series Overview About the JD700B series JDSU wireless RF and fiber test solutions for the field include base station analyzers, cable and antenna analyzers, and signaling analyzers for the installation and maintenance of modern wireless communication systems. RF and fiber test is critical for wireless operators facing challenges of signal quality and signaling interference, and maintaining quality high-bandwidth services. -
Page 24: Options
Chapter 1 JD700B Series Overview Key Features Table 5 Key functions Functionality JD785B/JD745B JD786B/JD746B JD788B/JD748B Spectrum Analyzer Cable and Antenna Analyzer RF Power Meter Optical Power Meter Fiber Inspection ... -
Page 25: Chapter 2 Getting Started
Chapter 2 Getting Started This chapter provides general guides of how to get started with your JD700B series instrument. Topics discussed in this chapter are as follows: Unpacking the JD700B series ....................26 Exploring the JD700B series ..................... 26 ... -
Page 26: Unpacking The Jd700B Series
Chapter 2 Getting Started Unpacking the JD700B series Unpack and inspect the shipping package thoroughly to ensure that nothing was damaged during the shipment. Also, check that your delivered package includes all of your ordered items in the shipment. If contents in the package are damaged or defective or if there are any missing items, keep the shipping list and materials for carrier’s inspection and contact your nearest JDSU's authorized sales and service office. -
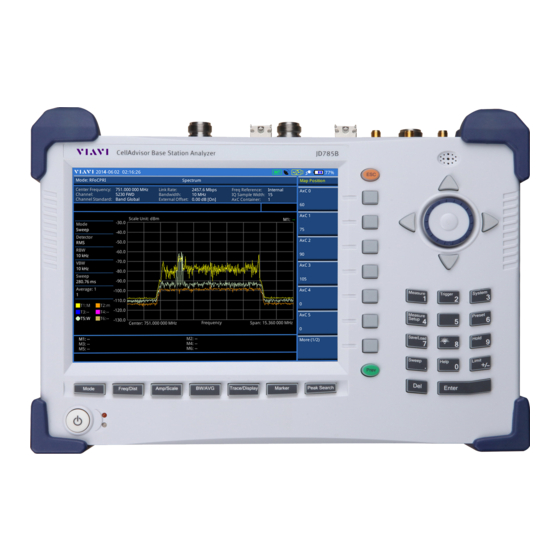
Page 27: Front Panel
Chapter 2 Getting Started Front panel The JD700B series analyzers have the same front panel look as like Figure 1, except for the bumpers in different colors. Power on/off button Description POWER ON/OFF – You can turn your instrument on or off. Two LEDs indicate power source and status. -
Page 28: Top Panel
Chapter 2 Getting Started PRESET – You can use this key to return to a known state and make measurements. HOLD – You can change the sweep mode: Continue or Single. LIMIT – You can set limit settings such as display line, multi segment line, save limits, recall limits, or test specification limits. - Page 29 Chapter 2 Getting Started Figure 2 Top view of JD785B with optical hardware option Figure 3 Top view of JD785B without optical hardware option Reflection/RF Out (Cable and Antenna Analyzer) The Reflection/RF Out port of the Cable and Antenna Analyzer is a precise 50 Ω N-type female connector that is used as the output signal port for the Cable and Antenna Analyzer mode.
- Page 30 Chapter 2 Getting Started RF In (Spectrum Analyzer) The RF In port is a precise 50 Ω N-type female connector that is used as the input signal port for spectrum analysis, signal analysis, and RF power measurement. CAUTION The maximum power allowed to the RF In port is +25 dBm for JD780B series and +20 dBm for JD740B series.
-
Page 31: Installing Battery Pack
Chapter 2 Getting Started Installing battery pack You need to install the Lithium Ion battery pack provided with your instrument. Follow the instruction to install or remove the battery pack as needed. Procedure To install the battery pack: Loosen the latching screw of the battery cover by turning counter clockwise. Slide out the battery cover to open. -
Page 32: Managing Files
Chapter 2 Getting Started Managing files The JD700B series lets you save and load screen, result, setup, limit, logging data, or Fail events depending on your selected measurement mode and option. NOTE If you see greyed-out menus as you change measurement modes, this indicates that the menu(s) are not available to be used. - Page 33 Chapter 2 Getting Started desired keyword, and then tap the Keyboard button. See “Appending a keyword” on page 552 for more information. – To change the file location in the internal memory or to your USB memory drive, tap the Location button, select your desired file path using the touch screen or the rotary knob, and then press the Apply soft key.
-
Page 34: Using Load
Chapter 2 Getting Started Press the Save soft key. Press the Save Logging Data soft key. The on-screen keyboard appears. Type the name of the file in the File Name field with or without using a keyword. Optional. – To create or edit keywords, touch the Edit Keywords button, select your desired keyword button in the upper screen, type a keyword, and then tap the Save button on the keyboard. -
Page 35: Using File Manager
Chapter 2 Getting Started NOTE A RFoCPRI spectrum can be recorded and replayed in the RFoCPRI Interference Analyzer (IA) mode only. It is not compatible with a standard IA spectrum logging file. Select the name of the file to be loaded from the internal memory or from your USB drive. Information of your selected file appears in the File Information pane. -
Page 36: Setting Language
Chapter 2 Getting Started Select System Configuration > Date/Time. The current time zone information box appears. To change the standard time zone, complete the following steps: Press the Std Time Zone soft key. Select your time zone by using the rotary knob or arrow keys. You can also use the Top/Bottom or Page Up/Down soft keys. -
Page 37: Setting Sleep Time
Chapter 2 Getting Started Procedure Press the SYSTEM hot key. Select System Configuration > Display Mode. Select a display mode from the choices: Indoor, Outdoor, and Night. The instrument optimizes screen colors to each choice. Setting sleep time You can set the amount of time up to 255 minutes to let the instrument automatically turn the backlight off and enter into power saving mode after no actions or data entries. -
Page 38: Upgrading Firmware
Chapter 2 Getting Started Upgrading firmware It is recommended that you maintain your instrument up-to-date with its latest firmware in order to achieve the instrument’s optimal performance. Checking installed firmware version Procedure Press the SYSTEM hot key. Press the HW/FW Info soft key. Find the installed version number in the Firmware field. -
Page 39: Managing Licenses
Chapter 2 Getting Started WARNING Do not remove the USB drive while upgrading the firmware. Upgrading from FTP server Procedure Power your instrument via the AC-DC adapter to prevent any severe damage to your instrument caused by a power-off in the middle of the upgrade, which may require a repair in the factory. Press the SYSTEM hot key. -
Page 40: Installing Options
Chapter 2 Getting Started Installing options Procedure To install an option that you have purchased: Press the SYSTEM hot key. Select More (1/2) > License Manager. The License Manager menu bar appears. Select the Install an Option soft key. The Installable Options window appears. Highlight the name of the option from the list by using the rotary knob. -
Page 41: Viewing System Log
Chapter 2 Getting Started Viewing system log Procedure Press the SYSTEM hot key. Select More (1/2) > Svc Diagnostic > System Logging. Optional. Press the Save soft key to save the system log as a .log file type. Press the PREV hard key to return to the previous screen. Running self-test You can run a self-test on your instrument boards and modules. -
Page 42: Using System Administration
Chapter 2 Getting Started The white screen with a plus sign (+) in the upper-left corner appears. Touch the plus sign and repeat until the previous screen is back on. Using system administration The Administration is used to disable editing limits, enable modifying online help, or change administration password. -
Page 43: Running Ip Test
Chapter 2 Getting Started Running IP test You can test an Internet Protocol (IP) configuration of the cell site’s backhaul. Procedure Press the SYSTEM hot key. Select More (1/2) > Utility > IP Test. Select the command option, from the following choices: –... -
Page 44: Establishing A Connection To Stratasync
Chapter 2 Getting Started mobile’s data network, you need to connect your instrument to your mobile device. Procedure Connect one of the Parani-UD100 Bluetooth adapters to the USB port of your JD780B or JD740B series. Turn on Bluetooth on your mobile device, and then activate its tethering or hotspot. –... -
Page 45: Stratasync Status Indicators
Chapter 2 Getting Started The input dialog box appears. Enter <port number> in the Port field. Enter <proxy server address> in the Proxy Server address, if necessary. Contact your system administrator for your proxy server information. Tap the Apply button to save and exit. Tap the Start Sync button. -
Page 46: Configuring Ethernet
Chapter 2 Getting Started Configuring Ethernet You can configure a network to connect your JD700B series and PC with JDViewer or JDRemote via Ethernet. Procedure Press the SYSTEM hot key. Select System Configuration > Ethernet Config. The Ethernet Configuration box appears. Select the IP addressing option, from the following choices: –... -
Page 47: Setting Scpi Mode
Chapter 2 Getting Started The confirmation dialog box appears. Press the USBTMC soft key again to confirm the mode change and reboot the instrument. NOTE After using the USBTMC mode, you may want to set this setting back to App SW if you use JDViewer mainly for remote controlling your JD700B series. -
Page 48: Chapter 3 Analyzing Measurement Results
Chapter 3 Analyzing Measurement Results This chapter provides instructions on how to use JD700B series’ capabilities for measurement analysis. Topics discussed in this chapter are as follows: Using marker ..........................49 Using peak search ........................50 ... -
Page 49: Using Marker
Chapter 3 Analyzing Measurement Results Using marker Marker Marker is used to get the information about a specific trace. Six markers can be set on the display and each marker can be used independently. The X and Y coordinates of the trace are displayed when the marker is placed on any position of the trace. -
Page 50: Using Peak Search
Chapter 3 Analyzing Measurement Results disable the noise marker function for the selected active marker. NOTE Frequency Count and Noise Marker functions are used only in the Spectrum Analyzer mode. Using peak search Peak search Each time the Peak Search soft key is pressed, the active marker is positioned at the highest peak of the trace. -
Page 51: Chapter 4 Using Spectrum Analyzer
Chapter 4 Using Spectrum Analyzer This chapter provides instructions for using the Spectrum Analyzer function. Topics discussed in this chapter are as follows: Introduction ..........................52 Display overview ........................52 Connecting a cable ........................53 Selecting measurement mode ....................54 ... -
Page 52: Introduction
Chapter 4 Using Spectrum Analyzer Introduction The advantage of using the Spectrum Analyzer is easy to verify the presence of unwanted signals such as spurious and harmonics, which are normally very hard to identify in time domain analysis. Performance assurance in wireless communication systems includes the observation of the out-of- band signal characteristics in order to identify the presence of harmonic signals. -
Page 53: Connecting A Cable
Chapter 4 Using Spectrum Analyzer Figure 5 Spectrum measurement screen Connecting a cable There are two ways that you can make a connection of your instrument and the base station to be tested: direct or indirect. Procedure To make a direct connection: Connect the Spectrum Analyzer RF In port of the JD700B series and the PA output port of BTS as shown in Figure 6. -
Page 54: Selecting Measurement Mode
Chapter 4 Using Spectrum Analyzer Figure 7 Indirect connection JD788B/JD748B JD785B/JD786B/JD745B/JD746B CAUTION The maximum power for the Spectrum Analyzer RF In port is +25 dBm (0.316 W) for JD780B series and +20 dBm (0.1 W) for JD740B series. If the level of the input signal to be measured is greater than this, use a High Power Attenuator to prevent damage when you directly connect the signal to the instrument or connect the signal from the coupling port of a directional coupler. - Page 55 Chapter 4 Using Spectrum Analyzer Procedure To set the center frequency and span: Press the FREQ/DIST hard key. Toggle the Unit soft key and select Freq. Press the Center Frequency soft key. Enter a value by using the numeric keys. You can also use the rotary knob or the arrow keys. Select the unit: GHz, MHz, kHz, or Hz.
-
Page 56: Setting Amplitude
Chapter 4 Using Spectrum Analyzer Optional. To define the amount of frequency increment for the rotary knob: Press the Frequency Step soft key, if the Freq is selected. Enter a value by using the numeric keys. Press the unit: GHz, MHz, kHz, or Hz. Optional. - Page 57 Chapter 4 Using Spectrum Analyzer Select the unit of the display scale: dBm, dBV, dBmV, dBµV, V, or W. The scale unit on the screen changes accordingly. NOTE For the Field Strength mode, the units change to dBµV/m, dBmV/m, dBV/m, Volt/m, Watt/m^2, and dBm/m^2.
-
Page 58: Setting Bandwidth
Chapter 4 Using Spectrum Analyzer Procedure To set the scale per division: Press the AMP/SCALE hard key. Select More (1/2) > Scale/Div. Enter a value between 1 and 20 by using the numeric keys. Press the dB soft key to complete the entry. Setting bandwidth You can manually set the Resolution Bandwidth (RBW), Video Bandwidth (VBW), and the proportional VBW based on the designated RBW. -
Page 59: Setting Average
Chapter 4 Using Spectrum Analyzer Setting average You can set the number of measurements to be averaged for the trace presentation. A maximum of 100 times of averaging can be set. When the averaging reaches to your setting, a new measurement value replaces the measurement value in sequence from the earliest. - Page 60 Chapter 4 Using Spectrum Analyzer NOTE Selecting Sweep Mode > Fast may reduce the measurement accuracy, but it is useful to identify the existence of interfering signals. To return to the continuous sweep mode: Toggle the Sweep Mode soft key and select Continue. You can also use the HOLD hot key. The letter HOLD in red disappears and the sweeping resumes.
-
Page 61: Using Rf Source
Chapter 4 Using Spectrum Analyzer NOTE This setting is not used in the in the Spurious Emissions mode, the Field Strength mode, and the Route Map mode. Using RF source You can turn the RF Source feature on to provide different power levels as like using a CW signal generator. -
Page 62: Setting Trace
Chapter 4 Using Spectrum Analyzer Figure 9 Gate sweep measurement with spectrum analyzer Setting trace You can display up to six traces on the measurement chart simultaneously. Procedure Press the TRACE/DISPLAY hard key. Press the Select Trace soft key, and then select the trace number: T1, T2, T3, T4, T5, or T6. The legend shape of the selected trace changes from square to round to indicate that the trace is the active one now. -
Page 63: Setting Limit
Chapter 4 Using Spectrum Analyzer To select the detection option, press the More (1/2) > Detectors, and then do one of the following: To display Select Random noise better than the peak without missing signals Normal The highest value in each data point Peak The root mean squared average power across the spectrum The lowest value in each data point... -
Page 64: Conducting Rf Measurements
Chapter 4 Using Spectrum Analyzer – To hide the line for the selected segment, toggle the Line soft key and select Off. – To add a new point, press the Add Point soft key. – To delete the selected point, press the Delete Point soft key. –... -
Page 65: Occupied Bandwidth
Chapter 4 Using Spectrum Analyzer Press the Channel Power soft key to set the limit parameters. Toggle the Test Limits soft key between On and Off to enable or disable the Pass/Fail indication. Set the upper threshold: Press the High Limit soft key. Enter a value for the upper limit. - Page 66 Chapter 4 Using Spectrum Analyzer Procedure Configure test parameters as described in the “Configuring test parameters” on page 54. Press the MEASURE SETUP hot key. Set the percentage of power within the bandwidth to be measured: Press the Occupied BW % Power soft key. Enter a value by using the numeric keys.
-
Page 67: Spectrum Emission Mask (Sem)
Chapter 4 Using Spectrum Analyzer Figure 11 Occupied bandwidth measurement with spectrum analyzer Spectrum emission mask (SEM) The Spectrum Emission Mask (SEM) measurement is to identify and determine the power level of out- of-band spurious emission outside the necessary channel bandwidth and modulated signal. It measures the power ratio between in-band and adjacent channels. - Page 68 Chapter 4 Using Spectrum Analyzer Press the Offset soft key, and then select the number for the active offset to configure. Toggle the Offset soft key and select On to display or Off to hide the active offset. Press the Offset Frequency soft key to set the center frequency of the offset. Enter a value by using the numeric keys.
-
Page 69: Adjacent Channel Power (Acp)
Chapter 4 Using Spectrum Analyzer Adjacent channel power (ACP) The Adjacent Channel Power (ACP) is the power contained in a specified frequency channel bandwidth relative to the total carrier power. It may also be expressed as a ratio of power spectral densities between the carrier and the specified offset frequency band. -
Page 70: Multi-Acp
Chapter 4 Using Spectrum Analyzer Setting limit Procedure Press the LIMIT hot key. Press the ACP soft key. Toggle the Test Limits soft key between On and Off to enable or disable the Pass/Fail indication. Optional. Go to SAVE/LOAD > Save, and then select Limit to save the limit settings. See “Using save”... - Page 71 Chapter 4 Using Spectrum Analyzer Press the Highest Frequency soft key. Enter a value by using the numeric keys. You can also use the rotary knob. Select the unit: GHz, MHz, kHz, or Hz. – For the channel setting, complete the following steps: Press the Channel Std soft key.
-
Page 72: Spurious Emissions
Chapter 4 Using Spectrum Analyzer Setting limit Procedure Press the LIMIT hot key. Press the Multi-ACP soft key. Toggle the Test Limits soft key between On and Off to enable or disable the Pass/Fail indication. Optional. Go to SAVE/LOAD > Save, and then select Limit to save the limit settings. See “Using save”... - Page 73 Chapter 4 Using Spectrum Analyzer Press the Enter soft key. Press the Start Frequency soft key to set up the frequency range. Enter a value by using the numeric keys. You can also use the rotary knob. Select the unit: GHz, MHz, kHz, or Hz. Press the Stop Frequency soft key to set up the frequency range.
-
Page 74: Am/Fm Audio Demodulation
Chapter 4 Using Spectrum Analyzer Measurement example Figure 15 Spurious emissions measurement with spectrum analyzer AM/FM audio demodulation The AM/FM Audio Demodulator operates using the power received from radio waves and it serves as an alternative to identify interfering signals easily. The instrument sounds demodulated signals that can be heard through the built-in speaker or plugged-in headphones. - Page 75 Chapter 4 Using Spectrum Analyzer Optional. You can use the Save On Event soft key to let the instrument automatically save measurement screen or result that falls outside the defined limit settings or the Fail indicator is on. You can also set to save the first event and hold the measurement or to save all the events continuously.
-
Page 76: Field Strength Meter
Chapter 4 Using Spectrum Analyzer See “Using save” on page 32 for more information. Measurement example Figure 16 AM/FM audio demodulation with spectrum analyzer Field strength meter The Field Strength Meter measures the field strength over the frequency range of a connected antenna, which is known with its specific bandwidth and gain characteristics. - Page 77 Chapter 4 Using Spectrum Analyzer Hz. You can also use the rotary knob. Press the Gain soft key to enter the gain information for the antenna. Enter a value by using the numeric keys, and then select the Enter soft key. Setting limit You can show or hide the display line on the screen that is used as a visual reference only.
-
Page 78: Route Map
Chapter 4 Using Spectrum Analyzer Measurement example Figure 17 Field strength measurement with spectrum analyzer Route map The JD700B Series provides indoor and outdoor mapping function that allows a user to collect data of points in an indoor or outdoor environment and track the received signals and coverage of RF transmitters plotting real time directly on top of a loaded floor plan or a map. - Page 79 Chapter 4 Using Spectrum Analyzer With the Full setting, you can view all the collected points of the route without the loaded map. – To collect data/plot points manually without a GPS antenna, select Position. – To collect data/plot points based on time, select Time. You do not need a GPS antenna as you would usually use this option indoor.
-
Page 80: Dual Spectrum
Chapter 4 Using Spectrum Analyzer Press the Poor soft key to set its threshold. Enter a value, and then press the dBm soft key. You can also use the rotary knob. Optional. Go to SAVE/LOAD > Save, and then select Limit to save the limit settings. See “Using save”... -
Page 81: Pim Detection (Single And Multiple Carriers)
Chapter 4 Using Spectrum Analyzer Measurement example Figure 19 Dual spectrum measurement with spectrum analyzer PIM detection (single and multiple carriers) The Passive Intermodulation (PIM) Detection allows you to detect Uplink PIM across the full spectrum for any technology. When PIM is detected, the normal repair mode is to replace the offending cable and what you need to do is replacing the whole cable irrespective of the location of the fault. - Page 82 Chapter 4 Using Spectrum Analyzer Press the Channel Number soft key. Enter a value by using the numeric keys and then press the Enter soft key. The instrument automatically displays the corresponding center frequency value for the selected channel number. Press the Uplink Span soft key.
-
Page 83: Chapter 5 Using Interference Analyzer
Chapter 5 Using Interference Analyzer This chapter provides instructions for using the Interference Analyzer function (option 011). Topics discussed in this chapter are as follows: Introduction ..........................84 Display overview ........................84 Connecting a cable ........................85 Selecting measurement mode .................... -
Page 84: Introduction
Chapter 5 Using Interference Analyzer Introduction Interference is becoming more prevalent in the wireless community with the increasing number of transmitters coming on the air. Wireless service providers have traditionally used spectrum analyzers to monitor service channels, frequencies, and adjacent spectrum and to locate sources of interference. A spectrum analyzer can only show you an interfering signal and you require determining the source of the interference. -
Page 85: Connecting A Cable
Chapter 5 Using Interference Analyzer Figure 22 Interference measurement screen Connecting a cable Procedure Connect an Omni/directional RF antenna to the Spectrum Analyzer RF In port of the JD700B series. Connect a GPS antenna to the GPS port of the JD700B series. Figure 23 Interference measurement connection JD785B/JD786B/JD745B/JD746B... -
Page 86: Selecting Measurement Mode
Chapter 5 Using Interference Analyzer CAUTION If the input signal level to be measured is less than 0 dBm, set it to 0 dB attenuation or turn on the preamp to have better dynamic range for the testing. Selecting measurement mode Procedure Press the MODE hard key. -
Page 87: Setting Amplitude
Chapter 5 Using Interference Analyzer To set the channel number and span: Press the FREQ/DIST hard key. Toggle the Unit soft key and select Channel. To select the standard channel, complete the following steps: Press the Channel Std soft key. The standard channel window appears. See “Appendix C –... - Page 88 Chapter 5 Using Interference Analyzer Press the AMP/SCALE hard key. To set the maximum reference value on the Y-axis manually, complete the following steps: Press the Reference Level soft key. Enter a value by using the numeric keys or the rotary knob with 10 dB increments. Press the dBm soft key or the ENTER hard key.
-
Page 89: Setting Bandwidth
Chapter 5 Using Interference Analyzer NOTE You can turn the Preamp on when the input attenuation range is from 0 dB to 10 dB. If the attenuation value is manually set to greater than 10 dB, the instrument will automatically turn off the pre-amplifier to display low-level signal properly on the chart. External offset You can turn the External Offset on and manually set the external offset value. -
Page 90: Setting Average
Chapter 5 Using Interference Analyzer Table 10 VBW/RBW ratio example Ratio (VBW/RBW) 30 kHz 30 kHz 1:0.3 10 kHz 1:0.1 3 kHz 1:0.03 1 kHz 1:0.01 300 Hz 1:0.003 100 Hz Setting average You can set the number of measurements to be averaged for the trace presentation. A maximum of 100 times of averaging can be set. - Page 91 Chapter 5 Using Interference Analyzer Procedure To select the single sweep mode: Press the SWEEP hot key. Toggle the Sweep Mode soft key and select Single. You can also use the HOLD hot key. The letter HOLD in red appears and the sweeping is paused. Optional.
-
Page 92: Conducting Spectrum Measurements
Chapter 5 Using Interference Analyzer Select the unit: Sec, mSec, or µSec. Press the PREV hard key to enable gated sweeping. Toggle the Gated Sweep soft key and select On. NOTE This setting is not used in the Spectrum Replayer mode. Conducting spectrum measurements The spectrum measurement with an audible indicator is especially useful for locating interferer sources with a directional antenna. -
Page 93: Sound Indicator
Chapter 5 Using Interference Analyzer To display Select Random noise better than the peak without missing signals Normal The highest value in each data point Peak The root mean squared average power across the spectrum The lowest value in each data point Negative Peak The center value in each data point Sample... -
Page 94: Interference Id
Chapter 5 Using Interference Analyzer Procedure Configure test parameters as described in the “Configuring test parameters” on page 86. Press the MEASURE SETUP hot key. Toggle the Audio Demod soft key between On and Off to turn the AM/FM audio demodulation on and off. - Page 95 Chapter 5 Using Interference Analyzer Setting measure setup Procedure Configure test parameters as described in the “Configuring test parameters” on page 86. Press the MEASURE SETUP hot key. To set the amount of time between each trace measurement: Press the Time Interval soft key. Enter a value by using the numeric keys.
-
Page 96: Dual Spectrogram
Chapter 5 Using Interference Analyzer Figure 25 Interference measurement in spectrogram with gated sweep on NOTE You can use the LIMIT hot key to analyze your measurements with the display line, multi- segment line, and channel limit. See “Setting limit for interference analyzer” on page 101 for more information. -
Page 97: Rssi
Chapter 5 Using Interference Analyzer Measurement example Figure 26 Interference measurement in dual spectrogram view RSSI The Received Signal Strength Indicator (RSSI) is a multi-signal tracking metric that is particularly useful for measuring power-level variations over time. The RSSI measurement lets you assign power limit line for audible alarms and increase alarm counters every time a signal exceeds a defined limit line. -
Page 98: Interference Finder
Chapter 5 Using Interference Analyzer Press the Demod Mode soft key, and then select the demodulation mode: AM, FM, and CW. Press the Dwell Time soft key, and then turn the rotary knob to set the demodulation interval between 1 and 20. Toggle the Auto Gain soft key between On and Off to enable or disable the automatic gain feature to adjust the interval gain of the demodulator. - Page 99 Chapter 5 Using Interference Analyzer Plug in your USB drive that has a map file in .mcf file type created in JDMapCreator. NOTE The JDMapCreator converts and resizes a map to fit onto your instrument’s display. You must save your map file (.mcf) into the “SavedMap” folder of your USB drive so that you can load them onto your instrument.
-
Page 100: Spectrum Replayer
Chapter 5 Using Interference Analyzer Circumscribed Inscribed Double Toggle the Screen Mode soft key and select the display option: Map or Full. – Map: Displays points on the loaded map. – Full: Displays points without the map. Measurement example Figure 28 Interference finder measurement in map view Spectrum Replayer The Spectrum Replayer lets you retrieve and replay recorded spectrum analyzer traces in interference... -
Page 101: Setting Limit For Interference Analyzer
Chapter 5 Using Interference Analyzer Select a file to be loaded, and then press the Load soft key. The Measure Setup screen menus appear. Toggle the Replay Direction soft key between FWD and REV to change play direction to forward or reverse. - Page 102 Chapter 5 Using Interference Analyzer Press the # of Line soft key. Enter a value between 1 and 50 by using the numeric keys. Press the Enter soft key. Press the Autoset soft key to let the instrument set the limit for each segment and display the line.
-
Page 103: Chapter 6 Using Gsm/Gprs/Edge Signal Analyzer
Chapter 6 Using GSM/GPRS/EDGE Signal Analyzer This chapter provides instructions for using the GSM/GPRS/EDGE Signal Analyzer function (option 022) with GSM//GPRS/EDGE OTA Analyzer function (option 042). Topics discussed in this chapter are as follows: Introduction ..........................104 Display overview ........................104 ... -
Page 104: Introduction
Chapter 6 Using GSM/GPRS/EDGE Signal Analyzer Introduction The Global System for Mobile Communications (GSM) is a digital cellular standard that uses Time Division Multiple Access (TDMA) multiplexing scheme and Gaussian Minimum Shift Keying (GMSK) modulation. The Enhanced Data Rates for GSM Evolution (EDGE) is an enhancement to GSM that promises to deliver multimedia and other broadband applications. -
Page 105: Connecting A Cable
Chapter 6 Using GSM/GPRS/EDGE Signal Analyzer Figure 29 GSM signal analyzer measurement screen Connecting a cable Direct connection Procedure Connect the Spectrum Analyzer RF In port of the JD700B series and the power amplifier output port of BTS. Figure 30 Direct connection JD785B/JD745B JD788B/JD748B... -
Page 106: Over The Air (Ota)
Chapter 6 Using GSM/GPRS/EDGE Signal Analyzer Figure 31 Indirect connection JD788B/JD748B JD785B/JD745B CAUTION The maximum power for the Spectrum Analyzer RF In port is +25 dBm (0.316 W) for JD780B series and +20 dBm (0.1 W) for JD740B series. If the level of the input signal to be measured is greater than this, use a High Power Attenuator to prevent damage when you directly connect the signal to the instrument or connect the signal from the coupling port of a directional coupler. -
Page 107: Selecting Measurement Mode
Chapter 6 Using GSM/GPRS/EDGE Signal Analyzer Selecting measurement mode Procedure Press the MODE hard key. Press the Signal Analyzer soft key. Press the GSM soft key. The Spectrum mode is set by default. Press the MEASURE hot key, and then select the measurement mode option from the following choices: –... -
Page 108: Setting Amplitude
Chapter 6 Using GSM/GPRS/EDGE Signal Analyzer Enter a value by using the numeric keys. You can also use the rotary knob. Press the Enter soft key. The instrument automatically displays the corresponding center frequency value for the selected channel number. Optional. - Page 109 Chapter 6 Using GSM/GPRS/EDGE Signal Analyzer Select the unit of the display scale: dBm, dBV, dBmV, dBµV, V, or W. The scale unit on the screen changes accordingly. NOTE This Units menu is available in the Spectrum and RF Analysis modes. Scale per division You can use the Scale/Div feature available for the spectrum and RF analysis.
-
Page 110: Setting Average
Chapter 6 Using GSM/GPRS/EDGE Signal Analyzer Setting average You can set the number of measurements to be averaged for the trace presentation. A maximum of 100 times of averaging can be set. When the averaging reaches to your setting, a new measurement value replaces the measurement value in sequence from the earliest. -
Page 111: Conducting Spectrum Measurements
Chapter 6 Using GSM/GPRS/EDGE Signal Analyzer Conducting spectrum measurements If you have configured test parameters as described in the “Configuring test parameters” on page 107, your measurement result is displayed on the screen as like the following example, Figure 33. Figure 33 Spectrum measurement screen with GSM signal analyzer Setting measure setup... -
Page 112: Conducting Rf Measurements
Chapter 6 Using GSM/GPRS/EDGE Signal Analyzer Select Trace Legend Clear current data and display with new Clear Write measurements Display the input signal’s maximum response only Max Hold (unlimited or for a certain amount of time) Display the input signal’s minimum response only Min Hold (unlimited or for a certain amount of time) Capture the selected trace and compare traces... -
Page 113: Occupied Bandwidth
Chapter 6 Using GSM/GPRS/EDGE Signal Analyzer NOTE The Delay setting is used only when there is a time offset in the signals to be measured. Measurement example Figure 34 Channel power measurement with GSM signal analyzer Channel power measurement result shows channel power and spectrum density in a user specified channel bandwidth. -
Page 114: Spectrum Emission Mask (Sem)
Chapter 6 Using GSM/GPRS/EDGE Signal Analyzer NOTE The Delay setting is used only when there is a time offset in the signals to be measured. Measurement example The Occupied Bandwidth measurement shows both of power across the band and power bandwidth in a user specified percentage to determine the amount of spectrum used by a modulated signal. -
Page 115: Spurious Emissions
Chapter 6 Using GSM/GPRS/EDGE Signal Analyzer Enter a value by using the numeric keys. You can also use the rotary knob. Press the µs soft key. NOTE The Delay setting is used only when there is a time offset in the signals to be measured. Measurement example Figure 36 SEM measurement with GSM signal analyzer... - Page 116 Chapter 6 Using GSM/GPRS/EDGE Signal Analyzer Press the Enter soft key. Press the Start Frequency soft key to set up the frequency range. Enter a value by using the numeric keys. You can also use the rotary knob. Select the unit: GHz, MHz, kHz, or Hz. Press the Stop Frequency soft key to set up the frequency range.
-
Page 117: Setting Limit For Rf Tests
Chapter 6 Using GSM/GPRS/EDGE Signal Analyzer Measurement example Figure 37 Spurious emissions measurement with GSM signal analyzer NOTE You can use the LIMIT hot key to analyze your measurements with the user-definable limit and Pass/Fail indication. See “Setting limit for RF tests” on page 117 for more information. -
Page 118: Conducting Power Vs. Time Measurements
Chapter 6 Using GSM/GPRS/EDGE Signal Analyzer Conducting power vs. time measurements The Power vs. Time measurement measures the mean transmission power during the useful part of GSM bursts and verifies that the power ramp fits within the defined mask. It also lets you view the rise, fall, and useful part of the GSM burst. -
Page 119: Power Vs. Time (Frame)
Chapter 6 Using GSM/GPRS/EDGE Signal Analyzer Measurement example Figure 38 Power vs. time (slot) measurement with GSM signal analyzer Figure 39 Power vs. time (slot) measurement with GSM signal analyzer Power vs. time (frame) Setting measure setup After configuring test parameters as described in the “Configuring test parameters” on page 107, you can continue your measurement. - Page 120 Chapter 6 Using GSM/GPRS/EDGE Signal Analyzer Press the Miscellaneous soft key. Press the Delay soft key to set the amount of delay in µs. Enter a value by using the numeric keys. You can also use the rotary knob. Press the µs soft key. NOTE The Delay setting is used only when there is a time offset in the signals to be measured.
-
Page 121: Conducting Constellation Measurements
Chapter 6 Using GSM/GPRS/EDGE Signal Analyzer Conducting constellation measurements The Constellation is used to observe some aspects of modulation accuracy and can reveal certain fault mechanisms such as I/Q amplitude imbalance or quadrature imbalance. It displays constellation diagram by modulation types. Setting measure setup After configuring test parameters as described in the “Configuring test parameters”... -
Page 122: Measurement Example
Chapter 6 Using GSM/GPRS/EDGE Signal Analyzer Toggle the Beep soft key between On and Off to enable or disable the beep sound. Optional. Go to SAVE/LOAD > Save, and then select Limit to save the limit settings. See “Using save” on page 32 for more information. Measurement example Figure 41 Constellation measurement (PSK off) with GSM signal analyzer... -
Page 123: Performing Auto Measurements
Chapter 6 Using GSM/GPRS/EDGE Signal Analyzer Performing auto measurements The Auto Measure function of the JD700B series allows a complete signal profiling covering RF characterization and modulation quality parameters of up to 10 different carriers, particularly useful on an overlay architecture where base stations are transmitting in different frequencies. The Auto Measure can be easily executed either by selecting a menu in the instrument or by running a programmed scenario in the PC-based application so that the instrument automatically configure and perform tests on every aspect of all the carriers. -
Page 124: Setting Display
Chapter 6 Using GSM/GPRS/EDGE Signal Analyzer Press the Time Interval soft key. Enter the amount of time in minutes, and then press the Enter soft key. To set external offset, complete the following steps: Toggle the External Offset soft key and select On. Enter a value by using the numeric keys, and then press the dB soft key. - Page 125 Chapter 6 Using GSM/GPRS/EDGE Signal Analyzer Press the Channel Std soft key. The standard channel window appears. See “Appendix C – Band, frequency & channel standard” on page 530 for more information. Highlight the band to be measured by using the rotary knob, the arrow keys, or the Page Up/Page Down soft keys.
-
Page 126: Frequency Scanner
Chapter 6 Using GSM/GPRS/EDGE Signal Analyzer Measurement example Figure 43 Channel scanner measurement with GSM OTA signal analyzer Frequency scanner Setting frequency Procedure Press the FREQ/DIST hard key. To set the starting frequency to be scanned, complete the following steps: Press the Start Frequency soft key. -
Page 127: Multipath Profile
Chapter 6 Using GSM/GPRS/EDGE Signal Analyzer Setting limit for OTA frequency scanner Procedure Press the LIMIT hot key. Press the Limit Line soft key to set a threshold for the limit line and Pass/Fail indication. Enter a value, and then press the dBm unit soft key. Toggle the Limit Line soft key between On and Off to display or dismiss the limit line. -
Page 128: Modulation Analyzer
Chapter 6 Using GSM/GPRS/EDGE Signal Analyzer Press the Miscellaneous soft key. Press the Delay soft key to set the amount of delay in µs. Enter a value by using the numeric keys. You can also use the rotary knob. Press the µs soft key. Optional. - Page 129 Chapter 6 Using GSM/GPRS/EDGE Signal Analyzer Setting limit for modulation analyzer Procedure Press the LIMIT hot key. Select the test item(s) and set the limit(s): To set the limit for Select Frame average power Frame Average Power High Limit, Low Limit Frequency error Frequency Error High Limit, Low Limit...
-
Page 130: Chapter 7 Using Wcdma/Hspa+ Signal Analyzer
Chapter 7 Using WCDMA/HSPA+ Signal Analyzer This chapter provides instructions for using the WCDMA/HSPA+ Signal Analyzer function (option 023) with the WCDMA/HSPA+ OTA Analyzer function (option 043). Topics discussed in this chapter are as follows: Introduction ..........................131 Display overview ........................131 ... -
Page 131: Introduction
Chapter 7 Using WCDMA/HSPA+ Signal Analyzer Introduction This WCDMA/HSPA+ Signal Analyzer can be used to test a WCDMA transmitter including HSDPA/HSPA+ signals to check the base station’s compliance with following standards documentation. 3GPP TS 25.104 Base Station radio transmission and reception ... -
Page 132: Connecting A Cable
Chapter 7 Using WCDMA/HSPA+ Signal Analyzer Figure 47 WCDMA/HSPA+ signal analyzer measurement screen Connecting a cable Direct connection Procedure Connect the Spectrum Analyzer RF In port of the JD700B series and the power amplifier output port of BTS. Figure 48 Direct connection JD785B/JD745B JD788B/JD748B... -
Page 133: Over The Air (Ota)
Chapter 7 Using WCDMA/HSPA+ Signal Analyzer Figure 49 Indirect connection JD788B/JD748B JD785B/JD745B CAUTION The maximum power for the Spectrum Analyzer RF In port is +25 dBm (0.316 W) for JD780B series and +20 dBm (0.1 W) for JD740B series. If the level of the input signal to be measured is greater than this, use a High Power Attenuator to prevent damage when you directly connect the signal to the instrument or connect the signal from the coupling port of a directional coupler. -
Page 134: Selecting Measurement Mode
Chapter 7 Using WCDMA/HSPA+ Signal Analyzer Selecting measurement mode Procedure Press the MODE hard key. Press the Signal Analyzer soft key. Press the WCDMA soft key. The Spectrum mode is set by default. Press the MEASURE hot key, and then select the measurement mode option from the following choices: –... -
Page 135: Setting Amplitude
Chapter 7 Using WCDMA/HSPA+ Signal Analyzer Press the Channel Number soft key. Enter a value by using the numeric keys. You can also use the rotary knob. Press the Enter soft key. The instrument automatically displays the corresponding center frequency value for the selected channel number. - Page 136 Chapter 7 Using WCDMA/HSPA+ Signal Analyzer Couple. As you increase the reference setting, the attenuation level also increases acoordingly. Optional. To change the scale unit: Select More (1/2) > Units. Select the unit of the display scale: dBm, dBV, dBmV, dBµV, V, or W. The scale unit on the screen changes accordingly.
-
Page 137: Setting Average
Chapter 7 Using WCDMA/HSPA+ Signal Analyzer Press the dB soft key to complete the entry. To turn the external offset off: Press the AMP/SCALE hard key. Toggle the External Offset soft key and select Off. Setting average You can set the number of measurements to be averaged for the trace presentation. A maximum of 100 times of averaging can be set. - Page 138 Chapter 7 Using WCDMA/HSPA+ Signal Analyzer can use the TRIGGER hot key to set the external clock. Table 11 Standards of external clock operation Clock Type Reference Port Switching Standard External Internal Internal 10 MHz Default Reference External External Ref Clock Ext Ref (SMA) Manual switching (Input signal level >-3 dBm)
-
Page 139: Conducting Spectrum Measurements
Chapter 7 Using WCDMA/HSPA+ Signal Analyzer (yellow) The yellow GPS antenna icon indicates that a GPS antenna is connected and locking is in progress. (grey) The grey GPS antenna icon indicates that a GPS antenna is not connected, failed, or unable to be locked. Conducting spectrum measurements If you have configured test parameters as described in the “Configuring test parameters”... -
Page 140: Conducting Rf Measurements
Chapter 7 Using WCDMA/HSPA+ Signal Analyzer Capture the selected trace and compare traces Capture Load a saved trace More (1/2) > Load Hide the selected trace Trace View > Off Remove all the traces and initialize the trace More (1/2) > Trace settings Clear All NOTE... -
Page 141: Occupied Bandwidth
Chapter 7 Using WCDMA/HSPA+ Signal Analyzer Figure 53 Channel power measurement with WCDMA/HSPA+ signal analyzer NOTE You can use the LIMIT hot key to analyze your measurements with the user-definable limit and Pass/Fail indication. See “Setting limit for RF tests” on page 147 for more information. -
Page 142: Spectrum Emission Mask (Sem)
Chapter 7 Using WCDMA/HSPA+ Signal Analyzer Figure 54 Occupied bandwidth measurement with WCDMA/HSPA+ signal analyzer NOTE You can use the LIMIT hot key to analyze your measurements with the user-definable limit and Pass/Fail indication. See “Setting limit for RF tests” on page 147 for more information. -
Page 143: Aclr
Chapter 7 Using WCDMA/HSPA+ Signal Analyzer Figure 55 SEM measurement with WCDMA/HSPA+ signal analyzer NOTE You can use the LIMIT hot key to analyze your measurements with the user-definable limit and Pass/Fail indication. See “Setting limit for RF tests” on page 147 for more information. -
Page 144: Multi-Aclr
Chapter 7 Using WCDMA/HSPA+ Signal Analyzer NOTE You can use the LIMIT hot key to analyze your measurements with the user-definable limit and Pass/Fail indication. See “Setting limit for RF tests” on page 147 for more information. Multi-ACLR The Multi-ACLR measurement is used to perform multi-channel ACLR measurements with as many channels as possible. -
Page 145: Spurious Emissions
Chapter 7 Using WCDMA/HSPA+ Signal Analyzer Figure 57 Multi-ACLR measurement with WCDMA/HSPA+ signal analyzer NOTE You can use the LIMIT hot key to analyze your measurements with the user-definable limit and Pass/Fail indication. See “Setting limit for RF tests” on page 147 for more information. - Page 146 Chapter 7 Using WCDMA/HSPA+ Signal Analyzer Select the dBm soft key. Press the Stop Limit soft key. Enter a value by using the numeric keys. You can also use the rotary knob. Select the dBm soft key. To set up the other parameters, complete the following steps: Select More (1/2) >...
-
Page 147: Setting Limit For Rf Tests
Chapter 7 Using WCDMA/HSPA+ Signal Analyzer Setting limit for RF tests By default, test limits specified in the standard are set for you. You can change thresholds if you desire. Procedure Press the LIMIT hot key. Press the RF Test Limits soft key. Select the test item(s) and set the limit(s) depending on your selected measurement mode: To set the limit for Select... -
Page 148: Code Domain Power
Chapter 7 Using WCDMA/HSPA+ Signal Analyzer Measurement example Figure 59 Constellation measurement with WCDMA/HSPA+ signal analyzer NOTE You can use the LIMIT hot key to analyze your measurements with the user-definable limit and Pass/Fail indication. See “Setting limit for modulation tests” on page 158 for more information. - Page 149 Chapter 7 Using WCDMA/HSPA+ Signal Analyzer 128, or 256. Press the Spread Code soft key to set the spread code. Enter a value by using the numeric keys. Press the Enter soft key. To set the PICH information of the system to be tested, complete the following steps: Press the PICH soft key.
- Page 150 Chapter 7 Using WCDMA/HSPA+ Signal Analyzer 2) Full screen with constellation 3) Zoomed screen (Width 64) 4) Zoomed screen with constellation (Width 64) JD700B Series User’s Guide...
-
Page 151: Relative Code Domain Power
Chapter 7 Using WCDMA/HSPA+ Signal Analyzer NOTE You can use the LIMIT hot key to analyze your measurements with the user-definable limit and Pass/Fail indication. See “Setting limit for modulation tests” on page 158 for more information. Setting display You can view your measurement results in a different view option. Procedure Press the TRACE/DISPLAY hard key. - Page 152 Chapter 7 Using WCDMA/HSPA+ Signal Analyzer To set the S-CCPCH information of the system to be tested, complete the following steps: Press the S-CCPCH soft key. Toggle the S-CCPCH soft key between On and Off to enable or disable the S-CCPCH. Press the Spread Factor soft key, and then select the spread factor option: 4, 8, 16, 32, 64, 128, or 256.
-
Page 153: Codogram
Chapter 7 Using WCDMA/HSPA+ Signal Analyzer Procedure Press the TRACE/DISPLAY hard key. Toggle the View soft key and select the display option: – Zoom: You can view the result in detail with zoom-in window. The Position and Width menus become activated. –... - Page 154 Chapter 7 Using WCDMA/HSPA+ Signal Analyzer Press the PICH soft key. Toggle the PICH soft key between On and Off to enable or disable the PICH. Press the Spread Factor soft key, and then select the spread factor option: 4, 8, 16, 32, 64, 128, or 256.
-
Page 155: Rcsi
Chapter 7 Using WCDMA/HSPA+ Signal Analyzer Procedure Press the TRACE/DISPLAY hard key. Toggle the View soft key and select the display option: – Zoom: You can view the result in detail with zoom-in window. The Position and Width menus become activated. –... - Page 156 Chapter 7 Using WCDMA/HSPA+ Signal Analyzer Enter a value by using the numeric keys. Press the Enter soft key. Optional. To set the threshold, complete the following steps: Press the Threshold soft key. Enter a value by using the numeric keys. Press the Enter soft key.
-
Page 157: Cdp Table
Chapter 7 Using WCDMA/HSPA+ Signal Analyzer To define the zoom start position and width, complete the following steps: Press the Position soft key. Enter a value of the position by using the numeric keys. Press the Enter soft key. Press the Width soft key, and then select the Walsh code option: 32, 64, 128, or 256. CDP Table The CDP Table is used to look at a numeric and textual description of all the active code channels in the signal. -
Page 158: Setting Limit For Modulation Tests
Chapter 7 Using WCDMA/HSPA+ Signal Analyzer Measurement example Figure 64 CDP Table measurement with WCDMA/HSPA+ signal analyzer Setting display If the CDP table spans over to the next page(s), you can change pages up and down to view your measurement results. Procedure Press the TRACE/DISPLAY hard key. -
Page 159: Performing Auto Measurements
Chapter 7 Using WCDMA/HSPA+ Signal Analyzer High Limit (16 QAM) High Limit (64 QAM) Optional. You can enable alarm sound that goes off if the measurement falls outside of the limit. Toggle the Beep soft key between On and Off to enable or disable the beep sound. Optional. -
Page 160: Setting Display
Chapter 7 Using WCDMA/HSPA+ Signal Analyzer To load a scenario, press the Scenario soft key, and then select a scenario file to load. Toggle the Test Time soft key and select the test time option: – Now: Lets the instrument run a test only once. –... -
Page 161: Setting Measure Setup
Chapter 7 Using WCDMA/HSPA+ Signal Analyzer Setting measure setup After configuring test parameters as described in the “Configuring test parameters” on page 134, you can continue your measurement. The measurement settings can be saved and recalled as a file. You can also use JDViewer, PC application software to configure a measure setup, save as a file, and load the file on to the instrument. -
Page 162: Channel Scanner
Chapter 7 Using WCDMA/HSPA+ Signal Analyzer Channel scanner Setting channel/frequency Procedure To set the channels to be scanned: Press the FREQ/DIST hard key. Toggle the Unit soft key and select Channel. Press the Index soft key, and then enter an index number by turning the rotary knob or using the numeric keys. -
Page 163: Scramble Scanner
Chapter 7 Using WCDMA/HSPA+ Signal Analyzer Toggle the Limit Line soft key between On and Off to display or dismiss the limit line. Optional. You can enable alarm sound that goes off if the measurement falls outside of the limit. Toggle the Beep soft key between On and Off to enable or disable the beep sound. -
Page 164: Multipath Profile
Chapter 7 Using WCDMA/HSPA+ Signal Analyzer Measurement example Figure 67 Scramble scanner measurement with WCDMA/HSPA+ OTA signal analyzer Multipath profile The Multipath Profile enables you to determine RF environmental conditions of testing area. It indicates the amount of power of the dominant pilot signal that is dispersed outside the main correlation peak due to multipath echoes that are expressed in dB. -
Page 165: Code Domain Power
Chapter 7 Using WCDMA/HSPA+ Signal Analyzer Code domain power Channels with high correlation factors are determined to be active channels and are indicated as such on the display. Once the channels are decoded, the analyzer determines the power of each channel relative to the total signal power. -
Page 166: Route Map
Chapter 7 Using WCDMA/HSPA+ Signal Analyzer Press the CPICH soft key. Enter a value by using the numeric keys. Press the dBm soft key. To set the threshold for CPICH dominance, complete the following steps: Press the CPICH Dominance > soft key. Enter a value by using the numeric keys. - Page 167 Chapter 7 Using WCDMA/HSPA+ Signal Analyzer Setting measure setup Procedure If required, connect a GPS receiver to your JD700B series for outdoor mapping. Indoor mapping does not necessarily need a GPS antenna. Configure test parameters as described in the “Configuring test parameters” on page 134. To load your map file, complete the following steps: Plug in your USB drive that has a floor map or .mcf file type created in JDMapCreator.
- Page 168 Chapter 7 Using WCDMA/HSPA+ Signal Analyzer Select the plot items and set the limits as needed: To set the limit for Select CPICH Power CPICH Power Excellent, Very Good, Good, Fair, Poor (dBm) CPICH Ec/Io Ec/Io Good, Fair, Poor (dB) Optional.
-
Page 169: Chapter 8 Using Lte - Fdd Signal Analyzer
Chapter 8 Using LTE - FDD Signal Analyzer This chapter provides instructions for using the LTE - FDD Signal Analyzer (option 028) and LTE- Advanced FDD Analyzer (option 030) with the LTE - FDD OTA Analyzer (option 048). Topics discussed in this chapter are as follows: Introduction .......................... -
Page 170: Introduction
Chapter 8 Using LTE - FDD Signal Analyzer Introduction The LTE (Long-Term Evolution) Signal Analyzer of the JD700B series performs power and spectrum measurements as well as modulation analysis to test the proper transmitter performance of FDD LTE systems. It performs conformance testing according to the following standards providing a simple Pass/Fail indication on each test. -
Page 171: Display Overview
Chapter 8 Using LTE - FDD Signal Analyzer Power Statistics CCDF Carrier Aggregation Over The Air (OTA) Channel Scanner ID Scanner Multipath Profile Control Channel Datagram Route Map Display overview Figure 71 provides descriptions for each segment of the measurement screen. Figure 71 LTE - FDD signal analyzer measurement screen Connecting a cable... -
Page 172: Indirect Connection
Chapter 8 Using LTE - FDD Signal Analyzer Figure 72 Direct connection JD785B/JD745B JD788B/JD748B Indirect connection Procedure Connect the Spectrum Analyzer RF In port of the JD700B series and the monitor (test) port of BTS. Figure 73 Indirect connection JD785B/JD745B JD788B/JD748B CAUTION The maximum power for the Spectrum Analyzer RF In port is +25 dBm (0.316 W) for... -
Page 173: Selecting Measurement Mode
Chapter 8 Using LTE - FDD Signal Analyzer Figure 74 OTA connection JD785B/JD745B JD788B/JD748B CAUTION If the input signal level to be measured is less than 0 dBm, set 0 dB attenuation or turn on the preamp to have better dynamic range for the OTA testing. Selecting measurement mode Procedure Press the MODE hard key. -
Page 174: Configuring Test Parameters
Chapter 8 Using LTE - FDD Signal Analyzer Configuring test parameters Setting frequency You can set the frequency with either frequency or channel number. If a frequency to be set matches to the frequency corresponding to the selected channel standard, the instrument calculates its channel number and updates the screen with it automatically. - Page 175 Chapter 8 Using LTE - FDD Signal Analyzer Procedure To automatically set the reference and attenuation level: Press the AMP/SCALE hard key. Press the Auto Scale soft key. Each time you press this key, both of the Y-axis scale and input attenuation level change to be optimized with some margin.
-
Page 176: Setting Average
Chapter 8 Using LTE - FDD Signal Analyzer Press the dB soft key to complete the entry. Pre-amplifier You can turn the internal pre-amplifier on to correct and compensate for the gain of the preamp so that amplitude readings show the value at the input connector. Procedure Press the AMP/SCALE hard key. -
Page 177: Setting Sweep Mode
Chapter 8 Using LTE - FDD Signal Analyzer Setting sweep mode The default setting is Continue to sweep continuously for most on-going measurements. If you want to hold the measurement or get a single sweep, you can change the sweep mode. Procedure To select the single sweep mode: Press the SWEEP hot key. -
Page 178: Conducting Spectrum Measurements
Chapter 8 Using LTE - FDD Signal Analyzer Table 13 External reference indicators Type Indicator Description Internal The green INT icon indicates that the instrument uses the built-in (green) internal time base. External The green EXT icon indicates that an external reference is connected (green) and locked and that the instrument uses the same reference clock as the signal source. -
Page 179: Setting Trace
Chapter 8 Using LTE - FDD Signal Analyzer Setting trace You can display up to six traces on the measurement chart simultaneously. Procedure Press the TRACE/DISPLAY hard key. Press the Select Trace soft key, and then select the trace number: T1, T2, T3, T4, T5, or T6. The legend shape of the selected trace changes from square to round to indicate that the trace is the active one now. -
Page 180: Occupied Bandwidth
Chapter 8 Using LTE - FDD Signal Analyzer Setting measure setup After configuring test parameters as described in the “Configuring test parameters” on page 173, you can continue your measurement. Procedure Press the MEASURE SETUP hot key. Press the Bandwidth soft key. Select the nominal channel bandwidth to be measured, from the choices: 1.4 MHz, 3 MHz, 5 MHz, 10 MHz, 15 MHz, and 20 MHz. -
Page 181: Spectrum Emission Mask (Sem)
Chapter 8 Using LTE - FDD Signal Analyzer 5 MHz, 10 MHz, 15 MHz, and 20 MHz. Measurement example Figure 78 Occupied bandwidth measurement with LTE - FDD signal analyzer NOTE You can use the LIMIT hot key to analyze your measurements with the user-definable limit and Pass/Fail indication. -
Page 182: Aclr
Chapter 8 Using LTE - FDD Signal Analyzer To select the mask type, complete the following steps: Press the Mask Type soft key. Select the mask type option, from the following choices: – Wide Area BS Category A – Wide Area BS Category B –... -
Page 183: Multi-Aclr
Chapter 8 Using LTE - FDD Signal Analyzer Measurement example Figure 80 ACLR measurement with LTE - FDD signal analyzer NOTE You can use the LIMIT hot key to analyze your measurements with the user-definable limit and Pass/Fail indication. See “Setting limit for RF tests” on page 186 for more information. -
Page 184: Spurious Emissions
Chapter 8 Using LTE - FDD Signal Analyzer – To set the channel number, complete the following steps: Toggle the Unit soft key and select Channel. NOTE Selecting Channel sets the standard channel to Band Global automatically so that you can set the Channel Number without choosing a standard channel band from the list. - Page 185 Chapter 8 Using LTE - FDD Signal Analyzer Procedure Press the MEASURE SETUP hot key. To set up the range table and frequency range, press the Range Table soft key and then complete the following steps: Press the Range soft key, and then enter the range number to add a new range or change an existing one.
-
Page 186: Setting Limit For Rf Tests
Chapter 8 Using LTE - FDD Signal Analyzer Measurement example Figure 82 Spurious emissions measurement with LTE - FDD signal analyzer NOTE You can use the LIMIT hot key to analyze your measurements with the user-definable limit and Pass/Fail indication. See “Setting limit for RF tests” on page 186 for more information. -
Page 187: Conducting Power Vs. Time (Frame) Measurements
Chapter 8 Using LTE - FDD Signal Analyzer Conducting power vs. time (frame) measurements The Power vs. Time (Frame) measures the modulation envelope in the time domain, showing the power of each time slot in an LTE signal. Setting measure setup After configuring test parameters as described in the “Configuring test parameters”... -
Page 188: Measurement Example
Chapter 8 Using LTE - FDD Signal Analyzer Measurement example Figure 83 Power vs. time (frame) measurement with LTE – FDD signal analyzer Conducting modulation measurements Constellation The Constellation is used to observe some aspects of modulation accuracy and can reveal certain fault mechanisms such as I/Q amplitude imbalance or quadrature imbalance. - Page 189 Chapter 8 Using LTE - FDD Signal Analyzer – Manual: Sets a specific Cell ID for the LTE signal manually in order to speed up the synchronization with a BTS. Optional. Toggle the CFI soft key and select Auto or Manual as desired: –...
-
Page 190: Data Channel
Chapter 8 Using LTE - FDD Signal Analyzer Measurement example Figure 84 Constellation measurement with LTE - FDD signal analyzer Figure 85 Constellation measurement with LTE - FDD signal analyzer (MBMS On) NOTE You can use the LIMIT hot key to analyze your measurements with the user-definable limit and Pass/Fail indication. - Page 191 Chapter 8 Using LTE - FDD Signal Analyzer can continue your measurement. The measurement settings can be saved and recalled as a file. Procedure Press the MEASURE SETUP hot key. To set the nominal channel bandwidth to be measured, complete the following steps: Press the Bandwidth soft key.
- Page 192 Chapter 8 Using LTE - FDD Signal Analyzer Auto, QPSK, 16 QAM, 64 QAM, E-TM3.3, E-TM3.2, E-TM3.1, E-TM2, E-TM1.2, and E- TM1.1. If two or more modulation types are used in a frame, select Auto. If the PDSCH uses the same modulation type in a frame or in a subframe, select a specific modulation type to get more accurate EVM.
-
Page 193: Control Channel
Chapter 8 Using LTE - FDD Signal Analyzer NOTE You can use the LIMIT hot key to analyze your measurements with the user-definable limit and Pass/Fail indication. See “Setting limit for modulation tests” on page 206 for more information. Using marker You can use the MARKER hard key to place a marker on a resource block and display the IQ diagram for the selected resource block. - Page 194 Chapter 8 Using LTE - FDD Signal Analyzer in a subframe. – Manual: Sets the number of OFDM symbols manually. The set of OFDM symbols that can be used for PDCCH in a subframe is given by 0, 2, 3 or 4 in 1.4 MHz bandwidth and 1, 2, or 3 in other bandwidths.
- Page 195 Chapter 8 Using LTE - FDD Signal Analyzer Measurement example Figure 88 Control channel measurement with LTE - FDD signal analyzer Figure 89 Control channel measurement with LTE - FDD signal analyzer (MBMS On) NOTE You can use the LIMIT hot key to analyze your measurements with the user-definable limit and Pass/Fail indication.
-
Page 196: Subframe
Chapter 8 Using LTE - FDD Signal Analyzer Procedure Press the MARKER hard key. Press the Channel soft key to select the channel to be displayed in the IQ diagram. The channel P-SS is selected by default. Turn the rotary knob to move the highlight from one to another in the channel summary table. Toggle the Marker View soft key between On and Off to display or dismiss the result of the selected channel. - Page 197 Chapter 8 Using LTE - FDD Signal Analyzer Optional. Press the Miscellaneous soft key, and then do the following as needed: – To select the number of antenna ports, toggle the MIMO soft key and select 2x2 or 4x4. This MIMO (Multiple Input Multiple Output) setting is activated only if the option 030 LTE- Advanced FDD is installed with a license number.
- Page 198 Chapter 8 Using LTE - FDD Signal Analyzer Measurement example Figure 90 Subframe measurement with LTE - FDD signal analyzer 1) Regular view 2) Chart view JD700B Series User’s Guide...
-
Page 199: Frame
Chapter 8 Using LTE - FDD Signal Analyzer Figure 91 Subframe measurement with LTE - FDD signal analyzer (MBMS On) NOTE You can use the LIMIT hot key to analyze your measurements with the user-definable limit and Pass/Fail indication. See “Setting limit for modulation tests” on page 206 for more information. - Page 200 Chapter 8 Using LTE - FDD Signal Analyzer Setting measure setup After configuring test parameters as described in the “Configuring test parameters” on page 173, you can continue your measurement. The measurement settings can be saved and recalled as a file. Procedure Press the MEASURE SETUP hot key.
- Page 201 Chapter 8 Using LTE - FDD Signal Analyzer – To set the threshold for PDSCH, complete the following steps: Press the PDSCH Threshold soft key. Enter a value by using the numeric keys. Press the dB soft key. – To set the threshold for PDCCH, complete the following steps: Press the PDCCH Threshold soft key.
-
Page 202: Time Alignment Error
Chapter 8 Using LTE - FDD Signal Analyzer Figure 93 Frame measurement with LTE - FDD signal analyzer (MBMS On) NOTE You can use the LIMIT hot key to analyze your measurements with the user-definable limit and Pass/Fail indication. See “Setting limit for modulation tests” on page 206 for more information. -
Page 203: Data Allocation Map
Chapter 8 Using LTE - FDD Signal Analyzer – To assign a antenna port number automatically or manually, press the Antenna Port soft key and select the option: Auto, 0, 1, 2, and 3. If the option 030 LTE-Advanced FDD is not installed or if the MIMO is set to 2x2, the antenna ports 2 and 3 are disabled. - Page 204 Chapter 8 Using LTE - FDD Signal Analyzer Press the Subframe No soft key. Enter a value by using the numeric keys. You can also use the rotary knob. NOTE For MBMS testing, this subframe number must be neither 0 nor 5 as these subframes 0 and 5 are not available for MBMS and it must be set to the MBMS transmitted channel’s subframe number.
- Page 205 Chapter 8 Using LTE - FDD Signal Analyzer Measurement example Figure 95 Data allocation map measurement with LTE - FDD signal analyzer Figure 96 Data allocation map measurement with LTE - FDD signal analyzer (MBMS On) NOTE You can use the LIMIT hot key to analyze your measurements with the user-definable limit and Pass/Fail indication.
-
Page 206: Setting Limit For Modulation Tests
Chapter 8 Using LTE - FDD Signal Analyzer chart. To select the resource block number, complete the following steps: Press the RB Number soft key. Enter the resource block number to select by using the numeric keys. You can also use the rotary knob to move the marker side by side. -
Page 207: Performing Auto Measurements
Chapter 8 Using LTE - FDD Signal Analyzer Frame average power Power > Frame Avg Power High Limit Low Limit Time alignment error for MIMO Time Alignment Error > MIMO High Limit Time alignment error for Time Alignment Error > Carrier Intra Cont aggregation of component Aggregation... - Page 208 Chapter 8 Using LTE - FDD Signal Analyzer To set the limit for Select Frequency error Frequency Error > Test Limits High Limit [E-TM2|E-TM3.1|E-TM3.2|E- Low Limit TM3.3] Error vector magnitude EVM > Test Limits [E-TM2|E- High Limit (QPSK) TM3.1|E-TM3.2|E-TM3.3] High Limit (16 QAM) High Limit (64 QAM) Time alignment error Time Alignment Error...
-
Page 209: Maintenance Test
Chapter 8 Using LTE - FDD Signal Analyzer A conformance test report appears at the end of the test. Optional. To stop running the test, press the Abort soft key. Maintenance test The Auto Measure function of the JD700B series allows a complete signal profiling covering RF characterization and modulation quality parameters of up to 20 different carriers, particularly useful on an overlay architecture where base stations are transmitting in different frequencies. - Page 210 Chapter 8 Using LTE - FDD Signal Analyzer The Set Timing menu becomes activated. To define a schedule for an auto measurement, complete the following steps: Press the Set Timing soft key. Press the Start Time (HH:MM) soft key. Enter the time in the HH:MM format, and then press the Enter soft key. Press the Stop Time (HH:MM) soft key.
-
Page 211: Signal Performance Test
Chapter 8 Using LTE - FDD Signal Analyzer – Settings: You can view the measurement settings for the auto measurement. Toggle the Display Result soft key and select the display result option: – Full: You can view detailed measurement readings with the pass/fail indication. –... -
Page 212: Das Test
Chapter 8 Using LTE - FDD Signal Analyzer Press the Antenna Port soft key, and then select the option: Auto, 0, 1, 2, or 3. If the option 030 LTE-Advanced FDD is not installed or if the MIMO is set to 2x2, the antenna ports 2 and 3 are disabled. -
Page 213: Performing Power Statistics Ccdf Measurements
Chapter 8 Using LTE - FDD Signal Analyzer Press the PREV hard key. Press the Limit soft key and then set the limits and allowed percentage change for each test item. See “Maintenance test” on page 271 for more information on setting limits. Keep pressing the PREV hard key until you see the Run Test soft key. -
Page 214: Measurement Example
Chapter 8 Using LTE - FDD Signal Analyzer can continue your measurement. The measurement settings can be saved and recalled as a file. You can also use JDViewer, PC application software to configure a measure setup, save as a file, and load the file on to the instrument. -
Page 215: Setting Display
Chapter 8 Using LTE - FDD Signal Analyzer Procedure Press the MEASURE SETUP hot key. To configure parameters for up to 5 component carriers, complete the following steps: Press the CA Configuration soft key. The component carrier configuration window appears. Press the CA Range soft key. -
Page 216: Measurement Example
Chapter 8 Using LTE - FDD Signal Analyzer Measurement example Figure 99 Carrier aggregation measurement with LTE - FDD signal analyzer (MA) Figure 100 Carrier aggregation measurement with LTE - FDD signal analyzer (SA) NOTE You can use the LIMIT hot key to analyze your measurements with the user-definable limit and Pass/Fail indication. -
Page 217: Conducting Lte - Fdd Ota Measurements
Chapter 8 Using LTE - FDD Signal Analyzer Toggle the IQ Diagram soft key between On and Off to display or dismiss data on the IQ diagram for each component carrier. Press the Channel soft key to select the channel to be displayed on the IQ diagram. Use the rotary knob to move and select an item under EVM. -
Page 218: Id Scanner
Chapter 8 Using LTE - FDD Signal Analyzer To set the center frequency for the selected index, complete the following steps: Press the Center Frequency soft key. Enter a value by using the numeric keys. You can also use the rotary knob. Select the unit: GHz, MHz, kHz, or Hz. - Page 219 Chapter 8 Using LTE - FDD Signal Analyzer reselection decisions. RSRQ provides additional information when RSRP is not sufficient to make a reliable handover or cell reselection decision. All of the parameters for OTA ID scanner can be plotted on map data such as Google Maps and Google Earth by using JDViewer.
-
Page 220: Multipath Profile
Chapter 8 Using LTE - FDD Signal Analyzer Multipath profile The Multipath Profile enables you to determine RF environmental conditions of testing area. It indicates the amount of power of the dominant pilot signal that is dispersed outside the main correlation peak due to multipath echoes that are expressed in dB. -
Page 221: Control Channel
Chapter 8 Using LTE - FDD Signal Analyzer Measurement example Figure 103 Multipath profile measurement with LTE - FDD OTA signal analyzer Control channel DL RS power is the resource element power of Downlink Reference Symbol. The absolute DL RS power is indicated on the BCH. - Page 222 Chapter 8 Using LTE - FDD Signal Analyzer Press the Enter soft key. Optional. Toggle the Cell ID soft key and select Auto or Manual as desired: – Auto: Lets the instrument detect the Cell ID for the LTE signal automatically. –...
-
Page 223: Datagram
Chapter 8 Using LTE - FDD Signal Analyzer Setting display You can use the TRACE/DISPLAY hard key to select the display option. Procedure Press the TRACE/DISPLAY hard key. Toggle the Display soft key and select Power or EVM. The screen changes according to the selected option. Measurement example Figure 104 Control channel measurement with LTE - FDD OTA signal analyzer Datagram... - Page 224 Chapter 8 Using LTE - FDD Signal Analyzer and 20 MHz. To select the subframe number to be measured, complete the following steps: Press the Subframe No soft key. Enter a value by using the numeric keys. You can also use the rotary knob. Press the Enter soft key.
-
Page 225: Route Map
Chapter 8 Using LTE - FDD Signal Analyzer Measurement example Figure 105 Datagram measurement with LTE - FDD signal analyzer Route map The JD700B Series provides indoor and outdoor mapping function that allows a user to collect data of points in an indoor or outdoor environment and track the received signals and coverage of RF transmitters plotting real time directly on top of a loaded floor plan or a map. - Page 226 Chapter 8 Using LTE - FDD Signal Analyzer With the Full setting, you can view all the collected points of the route without the loaded map. – To collect data/plot points manually without a GPS antenna in an indoor environment, press the Position soft key.
- Page 227 Chapter 8 Using LTE - FDD Signal Analyzer Measurement example Figure 106 Route map measurement with LTE - FDD OTA signal analyzer 1) RSRP 2) RSRQ JD700B Series User’s Guide...
- Page 228 Chapter 8 Using LTE - FDD Signal Analyzer 3) RS-SINR 4) S-SS RSSI 5) P-SS Power JD700B Series User’s Guide...
- Page 229 Chapter 8 Using LTE - FDD Signal Analyzer 6) S-SS Power 7) S-SS Ec/Io JD700B Series User’s Guide...
-
Page 230: Chapter 9 Using Lte - Tdd Signal Analyzer
Chapter 9 Using LTE - TDD Signal Analyzer This chapter provides instructions for using the LTE - TDD Signal Analyzer (option 029) and LTE- Advanced TDD Analyzer (option 031) with the LTE - TDD OTA Analyzer (option 049). Topics discussed in this chapter are as follows: Introduction .......................... -
Page 231: Introduction
Chapter 9 Using LTE - TDD Signal Analyzer Introduction The LTE (Long-Term Evolution) Signal Analyzer of the JD700B series performs power and spectrum measurements as well as modulation analysis to test the proper transmitter performance of TDD LTE systems. It performs conformance testing according to the following standards providing a simple Pass/Fail indication on each test. -
Page 232: Display Overview
Chapter 9 Using LTE - TDD Signal Analyzer Over The Air (OTA) Channel Scanner ID Scanner Multipath Profile Control Channel Datagram Route Map Display overview Figure 107 provides descriptions for each segment of the measurement screen. Figure 107 LTE - TDD signal analyzer measurement screen Connecting a cable Direct connection Procedure... -
Page 233: Indirect Connection
Chapter 9 Using LTE - TDD Signal Analyzer Figure 108 Direct connection JD785B/JD745B JD788B/JD748B Indirect connection Procedure Connect the Spectrum Analyzer RF In port of the JD700B series and the monitor (test) port of BTS. Figure 109 Indirect connection JD785B/JD745B JD788B/JD748B CAUTION The maximum power for the Spectrum Analyzer RF In port is +25 dBm (0.316 W) for... -
Page 234: Selecting Measurement Mode
Chapter 9 Using LTE - TDD Signal Analyzer Figure 110 OTA connection JD785B/JD745B JD788B/JD748B CAUTION If the input signal level to be measured is less than 0 dBm, set 0 dB attenuation or turn on the preamp to have better dynamic range for the OTA testing. Selecting measurement mode Procedure Press the MODE hard key. -
Page 235: Configuring Test Parameters
Chapter 9 Using LTE - TDD Signal Analyzer Configuring test parameters Setting frequency You can set the frequency with either frequency or channel number. If a frequency to be set matches to the frequency corresponding to the selected channel standard, the instrument calculates its channel number and updates the screen with it automatically. - Page 236 Chapter 9 Using LTE - TDD Signal Analyzer Each time you press this key, both of the Y-axis scale and input attenuation level change to be optimized with some margin. To set the reference or attenuation level manually: Press the AMP/SCALE hard key. To set the maximum reference value on the Y-axis manually, complete the following steps: Press the Reference Level soft key.
-
Page 237: Setting Average
Chapter 9 Using LTE - TDD Signal Analyzer Pre-amplifier You can turn the internal pre-amplifier on to correct and compensate for the gain of the preamp so that amplitude readings show the value at the input connector. Procedure Press the AMP/SCALE hard key. Toggle the Preamp soft key and select On or Off as needed. -
Page 238: Setting Trigger Source
Chapter 9 Using LTE - TDD Signal Analyzer Procedure To select the single sweep mode: Press the SWEEP hot key. Toggle the Sweep Mode soft key and select Single. You can also use the HOLD hot key. The letter HOLD in red appears and the sweeping is paused. -
Page 239: Conducting Spectrum Measurements
Chapter 9 Using LTE - TDD Signal Analyzer The green EXT icon indicates that an external reference is connected External (green) and locked and that the instrument uses the same reference clock as the signal source. The red EXT icon indicates that an external reference is connect but not External (red) locked. -
Page 240: Setting Trace
Chapter 9 Using LTE - TDD Signal Analyzer Figure 112 Spectrum measurement screen with LTE - TDD signal analyzer Setting trace You can display up to six traces on the measurement chart simultaneously. Procedure Press the TRACE/DISPLAY hard key. Press the Select Trace soft key, and then select the trace number: T1, T2, T3, T4, T5, or T6. The legend shape of the selected trace changes from square to round to indicate that the trace is the active one now. -
Page 241: Conducting Rf Measurements
Chapter 9 Using LTE - TDD Signal Analyzer Optional. Press the More (1/2) > Trace Info soft key, and then select the trace number to view the trace’s parameter setting information stored at the time of the measurement or None to hide the information display. -
Page 242: Occupied Bandwidth
Chapter 9 Using LTE - TDD Signal Analyzer Measurement example Figure 113 Channel power measurement with LTE - TDD signal analyzer NOTE You can use the LIMIT hot key to analyze your measurements with the user-definable limit and Pass/Fail indication. See “Setting limit for RF tests” on page 248 for more information. -
Page 243: Spectrum Emission Mask (Sem)
Chapter 9 Using LTE - TDD Signal Analyzer Measurement example Figure 114 Occupied bandwidth measurement with LTE - TDD signal analyzer NOTE You can use the LIMIT hot key to analyze your measurements with the user-definable limit and Pass/Fail indication. See “Setting limit for RF tests” on page 248 for more information. -
Page 244: Aclr
Chapter 9 Using LTE - TDD Signal Analyzer – Wide Area BS Category A – Wide Area BS Category B – Local Area BS – Home BS To select the subframe number to be measured, complete the following steps: Press the Subframe No soft key. Enter a value by using the numeric keys. -
Page 245: Multi-Aclr
Chapter 9 Using LTE - TDD Signal Analyzer Procedure Press the MEASURE SETUP hot key. To set the nominal channel bandwidth to be measured, complete the following steps: Press the Bandwidth soft key. Select the bandwidth option from the choices: 1.4 MHz, 3 MHz, 5 MHz, 10 MHz, 15 MHz, and 20 MHz. - Page 246 Chapter 9 Using LTE - TDD Signal Analyzer Procedure Press the MEASURE SETUP hot key. To set the nominal channel bandwidth to be measured, complete the following steps: Press the Bandwidth soft key. Select the bandwidth option from the choices: 1.4 MHz, 3 MHz, 5 MHz, 10 MHz, 15 MHz, and 20 MHz.
-
Page 247: Spurious Emissions
Chapter 9 Using LTE - TDD Signal Analyzer NOTE You can use the LIMIT hot key to analyze your measurements with the user-definable limit and Pass/Fail indication. See “Setting limit for RF tests” on page 248 for more information. Spurious emissions Out-of-band emissions are unwanted emissions immediately outside the channel bandwidth resulting from the modulation process and non-linearity in the transmitter but excluding spurious emissions. -
Page 248: Setting Limit For Rf Tests
Chapter 9 Using LTE - TDD Signal Analyzer NOTE The Examine mode displays only the selected range while the Full mode lets the instrument automatically changes the selected range from one another. Set the number of measurements to be averaged: Press the Average soft key. -
Page 249: Conducting Power Vs. Time Measurements
Chapter 9 Using LTE - TDD Signal Analyzer Multi-ACLR Multi-ACLR (On/Off only) Spurious emissions Spurious Emissions (On/Off only) Optional. You can enable alarm sound that goes off if the measurement falls outside of the limit. Toggle the Beep soft key between On and Off to enable or disable the beep sound. Optional. - Page 250 Chapter 9 Using LTE - TDD Signal Analyzer installed or if the MIMO is set to 2x2, the antenna ports 2 and 3 are disabled. – To select the cyclic prefix, toggle the Cyclic Prefix soft key and select Normal or Extended.
-
Page 251: Power Vs. Time (Frame)
Chapter 9 Using LTE - TDD Signal Analyzer On to off Power vs. time (frame) The Power vs. Time (Frame) measures the modulation envelope in the time domain, showing the power of each time slot in an LTE signal. Setting measure setup After configuring test parameters as described in the “Configuring test parameters”... -
Page 252: Conducting Modulation Measurements
Chapter 9 Using LTE - TDD Signal Analyzer installed or if the MIMO is set to 2x2, the antenna ports 2 and 3 are disabled. – To select the cyclic prefix, toggle the Cyclic Prefix soft key and select Normal or Extended. - Page 253 Chapter 9 Using LTE - TDD Signal Analyzer Procedure Press the MEASURE SETUP hot key. To set the nominal channel bandwidth to be measured, complete the following steps: Press the Bandwidth soft key. Select the bandwidth option from the choices: 1.4 MHz, 3 MHz, 5 MHz, 10 MHz, 15 MHz, and 20 MHz.
- Page 254 Chapter 9 Using LTE - TDD Signal Analyzer The Delay setting is used only when there is a time offset in the signals to be measured. – To select the cyclic prefix, toggle the Cyclic Prefix soft key and select Normal or Extended.
-
Page 255: Data Channel
Chapter 9 Using LTE - TDD Signal Analyzer Figure 122 Constellation measurement with LTE - TDD signal analyzer (MBMS On) NOTE You can use the LIMIT hot key to analyze your measurements with the user-definable limit and Pass/Fail indication. See “Setting limit for modulation tests” on page 268 for more information. - Page 256 Chapter 9 Using LTE - TDD Signal Analyzer – Auto: Lets the instrument detect the Cell ID for the LTE signal automatically. – Manual: Sets a specific Cell ID for the LTE signal manually in order to speed up the synchronization with a BTS.
- Page 257 Chapter 9 Using LTE - TDD Signal Analyzer Press the PDSCH Threshold soft key. Enter a value by using the numeric keys. Press the dB soft key. – Toggle the PDSCH Precoding soft key between On and Off to enable or disable the PDSCH precoding.
-
Page 258: Control Channel
Chapter 9 Using LTE - TDD Signal Analyzer Using marker You can use the MARKER hard key to place a marker on a resource block and display the IQ diagram for the selected resource block. Procedure Press the MARKER hard key. Press the RB Number soft key to select the resource block to be marked. - Page 259 Chapter 9 Using LTE - TDD Signal Analyzer 3 in other bandwidths. Optional. Press the PHICH Ng soft key, and then select the option for the number of PHICH groups (Ng): 1/6, 1/2, 1, 2, E-1/6, E-1/2, E-1, or E-2. Toggle the EVM Detection Mode soft key and select Single or Combine as desired: –...
- Page 260 Chapter 9 Using LTE - TDD Signal Analyzer Measurement example Figure 125 Control channel measurement with LTE - TDD signal analyzer Figure 126 Control channel measurement with LTE - TDD signal analyzer (MBMS On) NOTE You can use the LIMIT hot key to analyze your measurements with the user-definable limit and Pass/Fail indication.
-
Page 261: Subframe
Chapter 9 Using LTE - TDD Signal Analyzer Press the Channel soft key to select the channel to be displayed in the IQ diagram. The channel P-SS is selected by default. Turn the rotary knob to move the highlight from one to another in the channel summary table. Toggle the Marker View soft key between On and Off to display or dismiss the result of the selected channel. - Page 262 Chapter 9 Using LTE - TDD Signal Analyzer uplink/downlink between one and six. Optional. Press the Miscellaneous soft key, and then do the following as needed: – To select the number of antenna ports, toggle the MIMO soft key and select 2x2 or 4x4. This MIMO (Multiple Input Multiple Output) setting is activated only if the option 031 LTE- Advanced TDD is installed with a license number.
- Page 263 Chapter 9 Using LTE - TDD Signal Analyzer Measurement example Figure 127 Subframe measurement with LTE - TDD signal analyzer 1) Regular view 2) Chart view JD700B Series User’s Guide...
-
Page 264: Time Alignment Error
Chapter 9 Using LTE - TDD Signal Analyzer Figure 128 Subframe measurement with LTE - TDD signal analyzer (MBMS On) NOTE You can use the LIMIT hot key to analyze your measurements with the user-definable limit and Pass/Fail indication. See “Setting limit for modulation tests” on page 268 for more information. - Page 265 Chapter 9 Using LTE - TDD Signal Analyzer between the signals from two antennas at the antenna ports. Setting measure setup After configuring test parameters as described in the “Configuring test parameters” on page 234, you can continue your measurement. The measurement settings can be saved and recalled as a file. You can also use JDViewer, PC application software to configure a measure setup, save as a file, and load the file on to the instrument.
-
Page 266: Data Allocation Map
Chapter 9 Using LTE - TDD Signal Analyzer Measurement example Figure 129 Time alignment error measurement with LTE - TDD signal analyzer NOTE You can use the LIMIT hot key to analyze your measurements with the user-definable limit and Pass/Fail indication. See “Setting limit for modulation tests” on page 268 for more information. - Page 267 Chapter 9 Using LTE - TDD Signal Analyzer To set the threshold for PDSCH, complete the following steps: Press the PDSCH Threshold soft key. Enter a value by using the numeric keys. Press the dB soft key. Optional. Toggle the Cell ID soft key and select Auto or Manual as desired: –...
-
Page 268: Setting Limit For Modulation Tests
Chapter 9 Using LTE - TDD Signal Analyzer Figure 131 Data allocation map measurement with LTE - TDD signal analyzer (MBMS On) NOTE You can use the LIMIT hot key to analyze your measurements with the user-definable limit and Pass/Fail indication. See “Setting limit for modulation tests” on page 268 for more information. - Page 269 Chapter 9 Using LTE - TDD Signal Analyzer To set the limit for Select Frequency error Frequency Error High Limit Low Limit PDSCH error vector EVM > PDSCH EVM High Limit (QPSK) magnitude if MBMS is off High Limit (16 QAM) High Limit (64 QAM) PMCH error vector magnitude EVM >...
-
Page 270: Performing Auto Measurements
Chapter 9 Using LTE - TDD Signal Analyzer Performing auto measurements Conformance test The Conformance Test is to test if eNode-B meets some specified standards that have been developed for verification. Its test procedure and test setups have been developed by 3GPP. Test results can be saved as a .csv file type. -
Page 271: Maintenance Test
Chapter 9 Using LTE - TDD Signal Analyzer following as needed: To set the limit for Select Occupied bandwidth Occupied BW High Limit Adjacent channel power ratio ACLR Spectrum emission mask Mask Type Spurious emissions Spurious Emissions Range Table Optional. You can enable alarm sound that goes off if the measurement falls outside of the limit. Toggle the Beep soft key between On and Off to enable or disable the beep sound. - Page 272 Chapter 9 Using LTE - TDD Signal Analyzer Setting limit for maintenance test You can set test limits for test item(s) in the auto measurement. Procedure Press the LIMIT hot key. Press the RF Test Limits soft key, and then enable test limits as desired. Press the PvsT Test Limits soft key, and then enable test limits as desired.
- Page 273 Chapter 9 Using LTE - TDD Signal Analyzer – Auto: Lets the instrument detect the Cell ID for the LTE signal automatically. – Manual: Sets a specific Cell ID for the LTE signal manually in order to speed up the synchronization with a BTS.
-
Page 274: Signal Performance Test
Chapter 9 Using LTE - TDD Signal Analyzer Signal performance test Unlike the other auto measurement tests, the Signal Performance Test runs measurements continuously. Setting limit for signal performance test You can set test limits for test item(s) in the auto measurement. Procedure Press the LIMIT hot key. -
Page 275: Das Test
Chapter 9 Using LTE - TDD Signal Analyzer DAS test The Distributed Antenna System (DAS) testing enables you to check the degradation of performance in the signal transmission from a radio band to antennas distributed from it. You can save measurement values at both the radio band and antennas and then compare results with percentage of changes. -
Page 276: Performing Power Statistics Ccdf Measurements
Chapter 9 Using LTE - TDD Signal Analyzer Optional. Press the Delete Test soft key to delete the selected antenna tab. Optional. Press the Retest Reference soft key to obtain reference measurement values again. Optional. To save your measurement results, go to SAVE/LOAD > Save and then perform functions as you desire. -
Page 277: Measurement Example
Chapter 9 Using LTE - TDD Signal Analyzer Measurement example Figure 133 CCDF measurement with LTE - TDD signal analyzer Performing carrier aggregation measurements Carrier aggregation enables a maximum of five multiple LTE carriers to be used together in order to provide high data rate required for LTE-Advanced. -
Page 278: Setting Display
Chapter 9 Using LTE - TDD Signal Analyzer To set more component carriers, repeat the steps c-f. Press the MEASURE SETUP hot key again. Toggle the EVM Detection Mode soft key and select Single or Combine as desired: – Single: Testing on one single antenna connected to your JD700B series with a cable. –... -
Page 279: Measurement Example
Chapter 9 Using LTE - TDD Signal Analyzer Measurement example Figure 134 Carrier aggregation measurement with LTE - TDD signal analyzer (MA) Figure 135 Carrier aggregation measurement with LTE - TDD signal analyzer (SA) NOTE You can use the LIMIT hot key to analyze your measurements with the user-definable limit and Pass/Fail indication. -
Page 280: Conducting Lte - Tdd Ota Measurements
Chapter 9 Using LTE - TDD Signal Analyzer Toggle the Marker View soft key between On and Off to display or dismiss the marker. Press the Channel soft key to select the channel to be displayed on the IQ diagram. Use the rotary knob to move and select an item under EVM. -
Page 281: Id Scanner
Chapter 9 Using LTE - TDD Signal Analyzer To set the center frequency for the selected index, complete the following steps: Press the Center Frequency soft key. Enter a value by using the numeric keys. You can also use the rotary knob. Select the unit: GHz, MHz, kHz, or Hz. - Page 282 Chapter 9 Using LTE - TDD Signal Analyzer reselection decisions. RSRQ provides additional information when RSRP is not sufficient to make a reliable handover or cell reselection decision. All of the parameters for OTA ID scanner can be plotted on map data such as Google Maps and Google Earth by using JDViewer.
-
Page 283: Multipath Profile
Chapter 9 Using LTE - TDD Signal Analyzer Multipath profile The Multipath Profile enables you to determine RF environmental conditions of testing area. It indicates the amount of power of the dominant pilot signal that is dispersed outside the main correlation peak due to multipath echoes that are expressed in dB. -
Page 284: Control Channel
Chapter 9 Using LTE - TDD Signal Analyzer Measurement example Figure 138 Multipath profile measurement with LTE - TDD OTA signal analyzer Control channel DL RS power is the resource element power of Downlink Reference Symbol. The absolute DL RS power is indicated on the BCH. - Page 285 Chapter 9 Using LTE - TDD Signal Analyzer Press the Enter soft key. Toggle the Cell ID soft key and select Auto or Manual as desired: – Auto: Lets the instrument detect the Cell ID for the LTE signal automatically. –...
-
Page 286: Datagram
Chapter 9 Using LTE - TDD Signal Analyzer Setting display You can use the TRACE/DISPLAY hard key to select the display option. Procedure Press the TRACE/DISPLAY hard key. Toggle the Display soft key and select Power or EVM. The screen changes according to the selected option. Measurement example Figure 139 Control channel measurement with LTE - TDD OTA signal analyzer Datagram... - Page 287 Chapter 9 Using LTE - TDD Signal Analyzer and 20 MHz. To select the subframe number to be measured, complete the following steps: Press the Subframe No soft key. Enter a value by using the numeric keys. You can also use the rotary knob. Press the Enter soft key.
-
Page 288: Route Map
Chapter 9 Using LTE - TDD Signal Analyzer Measurement example Figure 140 Datagram measurement with LTE - TDD signal analyzer Route map The JD700B Series provides indoor and outdoor mapping function that allows a user to collect data of points in an indoor or outdoor environment and track the received signals and coverage of RF transmitters plotting real time directly on top of a loaded floor plan or a map. - Page 289 Chapter 9 Using LTE - TDD Signal Analyzer With the Full setting, you can view all the collected points of the route without the loaded map. – To collect data/plot points manually without a GPS antenna in an indoor environment, press the Position soft key.
- Page 290 Chapter 9 Using LTE - TDD Signal Analyzer Measurement example Figure 141 Route map measurement with LTE - TDD OTA signal analyzer 1) RSRP 2) RSRQ JD700B Series User’s Guide...
- Page 291 Chapter 9 Using LTE - TDD Signal Analyzer 3) RS-SINR 4) S-SS RSSI 5) P-SS Power JD700B Series User’s Guide...
- Page 292 Chapter 9 Using LTE - TDD Signal Analyzer 6) S-SS Power 7) S-SS Ec/Io JD700B Series User’s Guide...
-
Page 293: Chapter 10 Using Cdma Signal Analyzer
Chapter 10 Using CDMA Signal Analyzer This chapter provides instructions for using the CDMA Signal Analyzer function (option 020) with the CDMA OTA Analyzer function (option 040). Topics discussed in this chapter are as follows: Introduction ..........................294 Display overview ........................295 ... -
Page 294: Introduction
Chapter 10 Using CDMA Signal Analyzer Introduction This CDMA Signal Analyzer can be used to test a CDMA transmitter including cdmaOne and cdma2000 signals to check the base station’s compliance with following standards documentation. 3GPP2 C.S0002 Physical Layer Standard for cdma2000 Spread Spectrum Systems ... -
Page 295: Display Overview
Chapter 10 Using CDMA Signal Analyzer Display overview Figure 142 provides descriptions for each segment of the measurement screen. Figure 142 CDMA signal analyzer measurement screen Connecting a cable Direct connection Procedure Connect the Spectrum Analyzer RF In port of the JD700B series and the Power amplifier output port of BTS. -
Page 296: Indirect Connection
Chapter 10 Using CDMA Signal Analyzer Indirect connection Procedure Connect the Spectrum Analyzer RF In port of the JD700B series and the monitor (test) port of BTS. Figure 144 Indirect connection JD785B/JD745B JD788B/JD748B CAUTION The maximum power for the Spectrum Analyzer RF In port is +25 dBm (0.316 W) for JD780B series and +20 dBm (0.1 W) for JD740B series. -
Page 297: Selecting Measurement Mode
Chapter 10 Using CDMA Signal Analyzer Figure 145 OTA connection JD785B/JD745B JD788B/JD748B Selecting measurement mode Procedure Press the MODE hard key. Press the Signal Analyzer soft key. Press the CDMA soft key. The Spectrum mode is set by default. Press the MEASURE hot key, and then select the measurement mode option from the following choices: –... -
Page 298: Setting Amplitude
Chapter 10 Using CDMA Signal Analyzer Press the Center Frequency soft key. Enter a value by using the numeric keys. You can also use the rotary knob. Select the unit: GHz, MHz, kHz, or Hz. Optional. To define the amount of frequency increment for the rotary knob, complete the following steps: Press the Frequency Step soft key. - Page 299 Chapter 10 Using CDMA Signal Analyzer Press the dBm soft key or the ENTER hard key. This unit key name changes according to the setting in the Units menu. NOTE In the measurements such as Code Domain Power, Codogram, and RCSI, you may need to select the reference option between Relative and Absolute before setting the reference level.
-
Page 300: Setting Average
Chapter 10 Using CDMA Signal Analyzer Toggle the Preamp soft key and select On or Off as needed. NOTE You can turn the Preamp on when the input attenuation range is from 0 dB to 10 dB. If the attenuation value is manually set to greater than 10 dB, the instrument will automatically turn off the pre-amplifier to display low-level signal properly on the chart. -
Page 301: Setting Trigger Source
Chapter 10 Using CDMA Signal Analyzer To return to the continuous sweep mode: Toggle the Sweep Mode soft key and select Continue. You can also use the HOLD hot key. The letter HOLD in red disappears and the sweeping resumes. Setting trigger source You can set the trigger source option for your measurements. -
Page 302: Conducting Spectrum Measurements
Chapter 10 Using CDMA Signal Analyzer Press the SYSTEM hot key. Press the Freq Reference soft key, and then select the reference option: Internal, External 10 MHz, External 13 MHz, External 15 MHz, or GPS. NOTE When a GPS antenna is connected and locked, GPS coordinates (longitude and latitude) are displayed on the screen and frequency reference is automatically set to GPS in the System >... -
Page 303: Setting Trace
Chapter 10 Using CDMA Signal Analyzer Setting trace You can display up to six traces on the measurement chart simultaneously. Procedure Press the TRACE/DISPLAY hard key. Press the Select Trace soft key, and then select the trace number: T1, T2, T3, T4, T5, or T6. The legend shape of the selected trace changes from square to round to indicate that the trace is the active one now. -
Page 304: Conducting Rf Measurements
Chapter 10 Using CDMA Signal Analyzer Conducting RF measurements Channel power The Channel Power measurement is a common test used in the wireless industry to measure the total transmitted power of a radio within a defined frequency channel. It acquires a number of points representing the input signal in the time domain, transforms this information into the frequency domain using Fast Fourier Transform (FFT), and then calculates the channel power. -
Page 305: Spectrum Emission Mask (Sem)
Chapter 10 Using CDMA Signal Analyzer Figure 149 Occupied bandwidth measurement with CDMA signal analyzer NOTE You can use the LIMIT hot key to analyze your measurements with the user-definable limit and Pass/Fail indication. See “Setting limit for RF tests” on page 310 for more information. -
Page 306: Acpr
Chapter 10 Using CDMA Signal Analyzer Figure 150 SEM measurement with CDMA signal analyzer NOTE You can use the LIMIT hot key to analyze your measurements with the user-definable limit and Pass/Fail indication. See “Setting limit for RF tests” on page 310 for more information. -
Page 307: Multi-Acpr
Chapter 10 Using CDMA Signal Analyzer NOTE You can use the LIMIT hot key to analyze your measurements with the user-definable limit and Pass/Fail indication. See “Setting limit for RF tests” on page 310 for more information. Multi-ACPR The Multi-ACPR measurement is used to perform multi-channel ACPR measurements with as many channels as possible. -
Page 308: Spurious Emissions
Chapter 10 Using CDMA Signal Analyzer Figure 152 Multi-ACPR measurement with CDMA signal analyzer NOTE You can use the LIMIT hot key to analyze your measurements with the user-definable limit and Pass/Fail indication. See “Setting limit for RF tests” on page 310 for more information. - Page 309 Chapter 10 Using CDMA Signal Analyzer Select the dBm soft key. Press the Stop Limit soft key. Enter a value by using the numeric keys. You can also use the rotary knob. Select the dBm soft key. To set up the other parameters, complete the following steps: Select More (1/2) >...
-
Page 310: Setting Limit For Rf Tests
Chapter 10 Using CDMA Signal Analyzer Setting limit for RF tests By default, test limits specified in the standard are set for you. You can change thresholds if you desire. Procedure Press the LIMIT hot key. Press the RF Test Limits soft key. Select the test item(s) and set the limit(s) depending on your selected measurement mode: To set the limit for Select... -
Page 311: Code Domain Power
Chapter 10 Using CDMA Signal Analyzer To set the incremental step for the PN offset, complete the following steps: Press the PN Increment soft key. Enter a value by using the numeric keys. Press the Enter soft key. Optional. Go to SAVE/LOAD > Save, and then select the save option from the choices available for your measurement mode. - Page 312 Chapter 10 Using CDMA Signal Analyzer Toggle the PN Offset soft key between Auto and Manual. Enter a value by using the numeric keys to set manually. Press the Enter soft key. To set the incremental step for the PN offset, complete the following steps: Press the PN Increment soft key.
-
Page 313: Codogram
Chapter 10 Using CDMA Signal Analyzer code power according to the assigned number in sequence. – Bit Reverse: Code number in binary bit is reversed relative to the Hadamard method. Toggle the Base Code Length soft key and select the base Walsh code number: 64 or 128. Codogram The Codogram displays how the code level is changing over time and makes it easier for you to view traffic channels as they initiate and terminate and to track traffic channels call levels over time. -
Page 314: Rcsi
Chapter 10 Using CDMA Signal Analyzer Measurement example Figure 156 Codogram in full view with CDMA signal analyzer Setting display You can view your measurement results in a different view option. Procedure Press the TRACE/DISPLAY hard key. Press the Code Order soft key, and then select the code order option from the following choices: –... - Page 315 Chapter 10 Using CDMA Signal Analyzer To set the Pseudo-Noise (PN) offset, complete the following steps: Toggle the PN Offset soft key between Auto and Manual. Enter a value by using the numeric keys to set manually. Press the Enter soft key. To set the incremental step for the PN offset, complete the following steps: Press the PN Increment soft key.
-
Page 316: Cdp Table
Chapter 10 Using CDMA Signal Analyzer Procedure Press the TRACE/DISPLAY hard key. Press the Code Order soft key, and then select the code order option from the following choices: – Hadamard: To assign the number based on Walsh code order and display the measured code power according to the assigned number in sequence. -
Page 317: Setting Limit For Modulation Tests
Chapter 10 Using CDMA Signal Analyzer Measurement example Figure 158 CDP Table measurement with CDMA signal analyzer Setting display If the CDP table spans over to the next page(s), you can change pages up and down to view your measurement results. Procedure Press the TRACE/DISPLAY hard key. -
Page 318: Performing Auto Measurements
Chapter 10 Using CDMA Signal Analyzer Carrier feed through Carrier Feed Through High Limit Pilot power Pilot Power High Limit [Abs|Rel] Low Limit [Abs|Rel] Highest level among inactive channels Max Inactive High Limit Optional. You can enable alarm sound that goes off if the measurement falls outside of the limit. Toggle the Beep soft key between On and Off to enable or disable the beep sound. -
Page 319: Setting Display
Chapter 10 Using CDMA Signal Analyzer can continue your measurement. The measurement settings can be saved and recalled as a file. You can also use JDViewer, PC application software to configure a measure setup, save as a file, and load the file on to the instrument. -
Page 320: Performing Power Statistics Ccdf Measurements
Chapter 10 Using CDMA Signal Analyzer Toggle the Display Result soft key and select the display result option: – Full: You can view detailed measurement readings with the pass/fail indication. – Quick: You can view only the Pass/Fail results. To view the measurement results for a different carrier, press the View Carrier soft key and then select the carrier number to view. -
Page 321: Conducting Cdma Ota Measurements
Chapter 10 Using CDMA Signal Analyzer Conducting CDMA OTA measurements This Over The Air (OTA) measurement has channel scanner, PN scanner, multipath profile, and Code Domain power screens. It is used to verify CDMA transmitter performance at any location providing reflective measurements and identifying signals providing from different sites. - Page 322 Chapter 10 Using CDMA Signal Analyzer Press the ESC hard key to dismiss the channel list window and view the scanning result. Setting measure setup After configuring other test parameters as described in the “Configuring test parameters” on page 297, you can continue your measurement.
-
Page 323: Pn Scanner
Chapter 10 Using CDMA Signal Analyzer Measurement example Figure 160 Channel scanner measurement with CDMA OTA signal analyzer PN scanner Each access network sector has a unique PN offset. The PN Scanner is used to identify all the active PNs in an area. Setting measure setup After configuring test parameters as described in the “Configuring test parameters”... -
Page 324: Multipath Profile
Chapter 10 Using CDMA Signal Analyzer Measurement example Figure 161 PN scanner measurement with CDMA OTA signal analyzer Multipath profile The Multipath Profile enables you to determine RF environmental conditions of testing area. It indicates the amount of power of the dominant pilot signal that is dispersed outside the main correlation peak due to multipath echoes that are expressed in dB. -
Page 325: Code Domain Power
Chapter 10 Using CDMA Signal Analyzer Measurement example Figure 162 Multipath profile measurement with CDMA OTA signal analyzer Code domain power Channels with high correlation factors are determined to be active channels and are indicated as such on the display. Once the channels are decoded, the analyzer determines the power of each channel relative to the total signal power. - Page 326 Chapter 10 Using CDMA Signal Analyzer Enter a value between -50 and zero by using the numeric keys to change the value in the Manual mode. Press the Enter soft key. Toggle the Q-Paging soft key between On and Off to enable or disable the quick page channel that indicates the power of Quick Page Walsh code 80.
-
Page 327: Route Map
Chapter 10 Using CDMA Signal Analyzer Measurement example Figure 163 Code domain power measurement with CDMA OTA signal analyzer NOTE You can use the LIMIT hot key to analyze your measurements with the user-definable limit and Pass/Fail indication. Setting display You can view your measurement results in a different view option. - Page 328 Chapter 10 Using CDMA Signal Analyzer Plug in your USB drive that has a floor map or .mcf file type created in JDMapCreator. NOTE The JDMapCreator converts and resizes any scanned floor plan or layout to fit onto your instrument’s display. You must save your map file (.mcf) into the “SavedMap” folder of your USB drive so that you can load them onto your instrument.
- Page 329 Chapter 10 Using CDMA Signal Analyzer Enter a value, and then press the dBm soft key. You can also use the rotary knob. Press the Good soft key to set its threshold. Enter a value, and then press the dBm soft key. You can also use the rotary knob. Press the Fair soft key to set its threshold.
- Page 330 Chapter 10 Using CDMA Signal Analyzer 2) Pilot Ec/Io JD700B Series User’s Guide...
-
Page 331: Chapter 11 Using Ev-Do Signal Analyzer
Chapter 11 Using EV-DO Signal Analyzer This chapter provides instructions for using the EV-DO Signal Analyzer function (option 021) with the EV-DO OTA Analyzer function (option 041). Topics discussed in this chapter are as follows: Introduction ..........................332 Display overview ........................332 ... -
Page 332: Introduction
Chapter 11 Using EV-DO Signal Analyzer Introduction The EV-DO Signal Analyzer of the JD700B series performs power and spectrum measurements as well as modulation analysis to test the proper transmitter performance of EV-DO systems. It performs conformance testing according to the following standards providing a simple Pass/Fail indication on each test. -
Page 333: Connecting A Cable
Chapter 11 Using EV-DO Signal Analyzer Figure 165 EV-DO signal analyzer measurement screen Connecting a cable Direct connection Procedure Connect the Spectrum Analyzer RF In port of the JD700B series and the Power amplifier output port of BTS. Figure 166 Direct connection JD785B/JD745B JD788B/JD748B Indirect connection... -
Page 334: Over The Air (Ota)
Chapter 11 Using EV-DO Signal Analyzer Figure 167 Indirect connection JD788B/JD748B JD785B/JD745B CAUTION The maximum power for the Spectrum Analyzer RF In port is +25 dBm (0.316 W) for JD780B series and +20 dBm (0.1 W) for JD740B series. If the level of the input signal to be measured is greater than this, use a High Power Attenuator to prevent damage when you directly connect the signal to the instrument or connect the signal from the coupling port of a directional coupler. -
Page 335: Selecting Measurement Mode
Chapter 11 Using EV-DO Signal Analyzer Selecting measurement mode Procedure Press the MODE hard key. Press the Signal Analyzer soft key. Press the EV-DO soft key. The Spectrum mode is set by default. Press the MEASURE hot key, and then select the measurement mode option from the following choices: –... -
Page 336: Setting Amplitude
Chapter 11 Using EV-DO Signal Analyzer Highlight the band to be measured by using the rotary knob, the arrow keys, or the Page Up/Page Down soft keys. Press the Select soft key or the rotary knob to confirm the selection. Press the Channel Number soft key. - Page 337 Chapter 11 Using EV-DO Signal Analyzer Press the Attenuation Value soft key to set the level. Enter a value in fives by using the numeric keys. Press the dB soft key or the ENTER hard key. – To couple the input attenuator’s level with your reference level setting, select Attenuation > Couple.
-
Page 338: Setting Average
Chapter 11 Using EV-DO Signal Analyzer Procedure To set the external offset: Press the AMP/SCALE hard key. Toggle the External Offset soft key and select On. Enter a value by using the numeric keys. Press the dB soft key to complete the entry. To turn the external offset off: Press the AMP/SCALE hard key. -
Page 339: Setting External Clock
Chapter 11 Using EV-DO Signal Analyzer Setting external clock To enhance the reliability of modulation analysis measurements the JD700B series must be synchronized with a base station. When an external clock is not supplied, the instrument works with its built-in internal high-accuracy time base and some measurement results may exhibit inaccurate values. Therefore, it is highly recommended that you use the same reference clock as the signal source. -
Page 340: Conducting Spectrum Measurements
Chapter 11 Using EV-DO Signal Analyzer The green EXT icon indicates that an external reference is connected External (green) and locked and that the instrument uses the same reference clock as the signal source. The red EXT icon indicates that an external reference is connect but not External (red) locked. -
Page 341: Conducting Rf Measurements
Chapter 11 Using EV-DO Signal Analyzer Select Trace Legend Clear current data and display with new Clear Write measurements Display the input signal’s maximum response only Max Hold (unlimited or for a certain amount of time) Display the input signal’s minimum response only Min Hold (unlimited or for a certain amount of time) Capture the selected trace and compare traces... -
Page 342: Occupied Bandwidth
Chapter 11 Using EV-DO Signal Analyzer Figure 171 Channel power measurement with EV-DO signal analyzer NOTE You can use the LIMIT hot key to analyze your measurements with the user-definable limit and Pass/Fail indication. See “Setting limit for RF tests” on page 347 for more information. -
Page 343: Spectrum Emission Mask (Sem)
Chapter 11 Using EV-DO Signal Analyzer NOTE You can use the LIMIT hot key to analyze your measurements with the user-definable limit and Pass/Fail indication. See “Setting limit for RF tests” on page 347 for more information. Spectrum emission mask (SEM) The Spectrum Emission Mask (SEM) measurement required by 3GPP2 specifications encompasses different power limits and different measurement bandwidths (resolution bandwidths) at various frequency offsets. -
Page 344: Multi-Acpr
Chapter 11 Using EV-DO Signal Analyzer After configuring test parameters as described in the “Configuring test parameters” on page 335, your measurement result is displayed on the screen as like the following example, Figure 174. Figure 174 ACPR measurement with EV-DO signal analyzer NOTE You can use the LIMIT hot key to analyze your measurements with the user-definable limit and Pass/Fail indication. -
Page 345: Spurious Emissions
Chapter 11 Using EV-DO Signal Analyzer band to be measured. Press the Lowest Channel soft key to set the starting channel. Enter a value by using the numeric keys. You can also use the rotary knob. Press the Enter soft key. Press the Highest Channel soft key to set the stopping channel. - Page 346 Chapter 11 Using EV-DO Signal Analyzer Press the Enter soft key. Press the Start Frequency soft key to set up the frequency range. Enter a value by using the numeric keys. You can also use the rotary knob. Select the unit: GHz, MHz, kHz, or Hz. Press the Stop Frequency soft key to set up the frequency range.
-
Page 347: Setting Limit For Rf Tests
Chapter 11 Using EV-DO Signal Analyzer Figure 176 Spurious emissions measurement with EV-DO signal analyzer NOTE You can use the LIMIT hot key to analyze your measurements with the user-definable limit and Pass/Fail indication. See “Setting limit for RF tests” on page 347 for more information. -
Page 348: Conducting Power Vs. Time Measurements
Chapter 11 Using EV-DO Signal Analyzer Conducting power vs. time measurements The Power vs. Time (Idle Slot and Active Slot) in EV-DO Signal Analyzer verifies that the transmitter output power has correct amplitude, shape, and timing for the EV-DO format. Idle Slot: Slot with no data in traffic channel. -
Page 349: Setting Limit For Power Vs. Time Tests
Chapter 11 Using EV-DO Signal Analyzer measurement result is displayed on the screen as like the following example, Figure 178. Figure 178 Power vs. time (active slot) measurement with EV-DO signal analyzer NOTE You can use the LIMIT hot key to analyze your measurements with the user-definable limit and Pass/Fail indication. -
Page 350: Conducting Modulation Measurements
Chapter 11 Using EV-DO Signal Analyzer Conducting modulation measurements In order to make accurate measurements of time offset and PN, you must connect an external trigger before making a modulation measurement. Constellation The Constellation is used to observe some aspects of modulation accuracy and can reveal certain fault mechanisms such as I/Q amplitude imbalance or quadrature imbalance. - Page 351 Chapter 11 Using EV-DO Signal Analyzer Measurement example Figure 179 Constellation measurement with EV-DO signal analyzer 1) Composite 64 2) Composite 128 JD700B Series User’s Guide...
- Page 352 Chapter 11 Using EV-DO Signal Analyzer 3) Pilot 4) MAC 64 5) MAC 128 JD700B Series User’s Guide...
-
Page 353: Code Domain Power
Chapter 11 Using EV-DO Signal Analyzer 6) Data Code domain power The Code Domain Power (CDP) measures the distribution of power across the set of code channels, normalized to the total EV-DO power. It helps to verify that each code channel is operating at its proper level and to identify problems throughout the transmitter design from coding to the RF section. - Page 354 Chapter 11 Using EV-DO Signal Analyzer for your measurement mode. See “Using save” on page 32 for more information. NOTE You can use the LIMIT hot key to analyze your measurements with the user-definable limit and Pass/Fail indication for the Max Inactive. See “Setting limit for modulation tests” on page 359 for more information.
-
Page 355: Mac Codogram
Chapter 11 Using EV-DO Signal Analyzer 3) MAC 128 4) Data MAC Codogram The MAC Codogram displays the power variation for every code over time, presenting a clear view of the traffic load per channels at any given time. The MAC Codogram measurements can be saved into an external USB memory so that a post-analysis can be done with the application software JDViewer. -
Page 356: Rcsi
Chapter 11 Using EV-DO Signal Analyzer Toggle the PN Offset soft key between Auto and Manual. Enter a value by using the numeric keys to set manually. Press the Enter soft key. To set the incremental step for the PN offset, complete the following steps: Press the PN Increment soft key. - Page 357 Chapter 11 Using EV-DO Signal Analyzer memory so that a post-analysis can be done with the application software JDViewer. Setting measure setup After configuring test parameters as described in the “Configuring test parameters” on page 335, you can continue your measurement. The measurement settings can be saved and recalled as a file. You can also use JDViewer, PC application software to configure a measure setup, save as a file, and load the file on to the instrument.
-
Page 358: Mac Cdp Table
Chapter 11 Using EV-DO Signal Analyzer Measurement example Figure 182 RCSI measurement with EV-DO signal analyzer MAC CDP Table The MAC CDP Table is used for the user to look at a numeric and textual description of all the active control channels in the signal. -
Page 359: Setting Limit For Modulation Tests
Chapter 11 Using EV-DO Signal Analyzer Measurement example Figure 183 MAC CDP Table measurement with EV-DO signal analyzer Setting display If the MAC CDP table spans over to the next page(s), you can change pages up and down to view your measurement results. -
Page 360: Performing Auto Measurements
Chapter 11 Using EV-DO Signal Analyzer Optional. You can enable alarm sound that goes off if the measurement falls outside of the limit. Toggle the Beep soft key between On and Off to enable or disable the beep sound. Optional. Go to SAVE/LOAD > Save, and then select Limit to save the limit settings. See “Using save”... -
Page 361: Setting Display
Chapter 11 Using EV-DO Signal Analyzer fail based on the instrument’s limit settings in Auto Measure. – Scenario: Runs a test with a programmed scenario in JDViewer. The Scenario menu becomes activated. To load a scenario, press the Scenario soft key, and then select a scenario file to load. Toggle the Test Time soft key and select the test time option: –... -
Page 362: Performing Power Statistics Ccdf Measurements
Chapter 11 Using EV-DO Signal Analyzer Performing power statistics CCDF measurements The Power Statistics Complementary Cumulative Distribution Function (CCDF) measurement characterizes the power statistics of the input signal. It provides PAR (Peak to Average power Ratio) versus different probabilities. Setting measure setup After configuring test parameters as described in the “Configuring test parameters”... -
Page 363: Channel Scanner
Chapter 11 Using EV-DO Signal Analyzer Channel scanner Setting channel/frequency Procedure To set the channels to be scanned: Press the FREQ/DIST hard key. Toggle the Unit soft key and select Channel. Press the Index soft key, and then enter an index number between one and six by turning the rotary knob or using the numeric keys. -
Page 364: Pn Scanner
Chapter 11 Using EV-DO Signal Analyzer Procedure Press the MEASURE SETUP hot key. To set the incremental step for the PN offset, complete the following steps: Press the PN Increment soft key. Enter a value by using the numeric keys. Press the Enter soft key. -
Page 365: Multipath Profile
Chapter 11 Using EV-DO Signal Analyzer Setting measure setup After configuring test parameters as described in the “Configuring test parameters” on page 335, you can continue your measurement. The measurement settings can be saved and recalled as a file. You can also use JDViewer, PC application software to configure a measure setup, save as a file, and load the file on to the instrument. -
Page 366: Code Domain Power
Chapter 11 Using EV-DO Signal Analyzer can continue your measurement. The measurement settings can be saved and recalled as a file. You can also use JDViewer, PC application software to configure a measure setup, save as a file, and load the file on to the instrument. - Page 367 Chapter 11 Using EV-DO Signal Analyzer Procedure Press the MEASURE SETUP hot key. To set the Pseudo-Noise (PN) offset, complete the following steps: Toggle the PN Offset soft key between Auto and Manual. Enter a value by using the numeric keys to set manually. Press the Enter soft key.
-
Page 368: Route Map
Chapter 11 Using EV-DO Signal Analyzer Measurement example Figure 188 Code domain power measurement with EV-DO OTA signal analyzer NOTE You can use the LIMIT hot key to analyze your measurements with the user-definable limit and Pass/Fail indication. Route map The JD700B Series provides indoor and outdoor mapping function that allows a user to collect data of points in an indoor or outdoor environment and track the received signals and coverage of RF transmitters plotting real time directly on top of a loaded floor plan or a map. - Page 369 Chapter 11 Using EV-DO Signal Analyzer With the Map setting, you can view only the collected points that can be seen within the boundary of the loaded map. If a point is off the map, the instrument displays an arrow to indicate the direction of the current location on the map and the distance from the center to the location at the top of the screen.
- Page 370 Chapter 11 Using EV-DO Signal Analyzer Measurement example Figure 189 Route map measurement with EV-DO OTA signal analyzer 1) Pilot Power 2) Pilot Ec/Io JD700B Series User’s Guide...
-
Page 371: Chapter 12 Using Td-Scdma Signal Analyzer
Chapter 12 Using TD-SCDMA Signal Analyzer This chapter provides instructions for using the TD-SCDMA Signal Analyzer function (option 025) with the TD-SCDMA OTA Analyzer function (option 045). Topics discussed in this chapter are as follows: Introduction ..........................372 Display overview ........................373 ... -
Page 372: Introduction
Chapter 12 Using TD-SCDMA Signal Analyzer Introduction The Time Division-Synchronous Code Division Multiple Access, also known as TD-SCDMA, is a 3G mobile telecommunications standard that is pursued by the Chinese Academy of Telecommunications Technology (CATT) in the People's Republic of China. The TD-SCDMA uses the TDD scheme while the WCDMA uses the FDD. -
Page 373: Display Overview
Chapter 12 Using TD-SCDMA Signal Analyzer Display overview Figure 190 provides descriptions for each segment of the measurement screen. Figure 190 TD-SCDMA signal analyzer measurement screen Connecting a cable Direct connection Procedure Connect the Spectrum Analyzer RF In port of the JD700B series and the Power amplifier output port of BTS. -
Page 374: Indirect Connection
Chapter 12 Using TD-SCDMA Signal Analyzer Indirect connection Procedure Connect the Spectrum Analyzer RF In port of the JD700B series and the monitor (test) port of BTS. Figure 192 Indirect connection JD785B/JD745B JD788B/JD748B CAUTION The maximum power for the Spectrum Analyzer RF In port is +25 dBm (0.316 W) for JD780B series and +20 dBm (0.1 W) for JD740B series. -
Page 375: Selecting Measurement Mode
Chapter 12 Using TD-SCDMA Signal Analyzer CAUTION If the input signal level to be measured is less than 0 dBm, set 0 dB attenuation or turn on the preamp to have better dynamic range for the OTA testing. Selecting measurement mode Procedure Press the MODE hard key. -
Page 376: Setting Amplitude
Chapter 12 Using TD-SCDMA Signal Analyzer See “Appendix C – Band, frequency & channel standard” on page 530 for more information. Highlight the band to be measured by using the rotary knob, the arrow keys, or the Page Up/Page Down soft keys. Press the Select soft key or the rotary knob to confirm the selection. - Page 377 Chapter 12 Using TD-SCDMA Signal Analyzer Select Attenuation > Manual. Press the Attenuation Value soft key to set the level. Enter a value in fives by using the numeric keys. Press the dB soft key or the ENTER hard key. –...
-
Page 378: Setting Average
Chapter 12 Using TD-SCDMA Signal Analyzer To set the external offset: Press the AMP/SCALE hard key. Toggle the External Offset soft key and select On. Enter a value by using the numeric keys. Press the dB soft key to complete the entry. To turn the external offset off: Press the AMP/SCALE hard key. -
Page 379: Setting External Clock
Chapter 12 Using TD-SCDMA Signal Analyzer Setting external clock To enhance the reliability of modulation analysis measurements the JD700B series must be synchronized with a base station. When an external clock is not supplied, the instrument works with its built-in internal high-accuracy time base and some measurement results may exhibit inaccurate values. Therefore, it is highly recommended that you use the same reference clock as the signal source. -
Page 380: Setting Trace
Chapter 12 Using TD-SCDMA Signal Analyzer Procedure Press the MEASURE SETUP hot key. Press the Slot Number soft key, and then select the time slot number to be displayed: TS0, TS1, TS2, TS3, TS4, TS5, or TS6. Optional. To set the delay, complete the following steps: Press the Delay soft key to set the amount of delay in µs. -
Page 381: Conducting Rf Measurements
Chapter 12 Using TD-SCDMA Signal Analyzer Display the input signal’s minimum response only Min Hold (unlimited or for a certain amount of time) Capture the selected trace and compare traces Capture Load a saved trace More (1/2) > Load Hide the selected trace Trace View >... -
Page 382: Occupied Bandwidth
Chapter 12 Using TD-SCDMA Signal Analyzer Measurement example Figure 196 Channel power measurement with TD-SCDMA signal analyzer NOTE You can use the LIMIT hot key to analyze your measurements with the user-definable limit and Pass/Fail indication. See “Setting limit for RF tests” on page 388 for more information. -
Page 383: Spectrum Emission Mask (Sem)
Chapter 12 Using TD-SCDMA Signal Analyzer Measurement example Figure 197 Occupied bandwidth measurement with TD-SCDMA signal analyzer NOTE You can use the LIMIT hot key to analyze your measurements with the user-definable limit and Pass/Fail indication. See “Setting limit for RF tests” on page 388 for more information. -
Page 384: Aclr
Chapter 12 Using TD-SCDMA Signal Analyzer Press the Delay soft key to set the amount of delay in µs. Enter a value by using the numeric keys. You can also use the rotary knob. Press the µs soft key. NOTE The Delay setting is used only when there is a time offset in the signals to be measured. -
Page 385: Multi-Aclr
Chapter 12 Using TD-SCDMA Signal Analyzer NOTE The Delay setting is used only when there is a time offset in the signals to be measured. Measurement example Figure 199 ACLR measurement with TD-SCDMA signal analyzer NOTE You can use the LIMIT hot key to analyze your measurements with the user-definable limit and Pass/Fail indication. -
Page 386: Spurious Emissions
Chapter 12 Using TD-SCDMA Signal Analyzer Select the unit: GHz, MHz, kHz, or Hz. – To set the channel number, complete the following steps: Toggle the Unit soft key and select Channel. To select the standard channel, press the Channel Std soft key and then select the band to be measured. - Page 387 Chapter 12 Using TD-SCDMA Signal Analyzer Procedure Press the MEASURE SETUP hot key. To set up the range table and frequency range, press the Range Table soft key and then complete the following steps: Press the Range soft key, and then enter the range number to add a new range or change an existing one.
-
Page 388: Setting Limit For Rf Tests
Chapter 12 Using TD-SCDMA Signal Analyzer Measurement example Figure 201 Spurious emissions measurement with TD-SCDMA signal analyzer NOTE You can use the LIMIT hot key to analyze your measurements with the user-definable limit and Pass/Fail indication. See “Setting limit for RF tests” on page 388 for more information. -
Page 389: Conducting Power Vs. Time Measurements
Chapter 12 Using TD-SCDMA Signal Analyzer Conducting power vs. time measurements The Power vs. Time (P vs T) measurement analyzes the amplitude profile and timing of the burst signal and provides a time mask for the signal. It measures the mean transmit power during the “useful part”... -
Page 390: Power Vs. Time (Frame)
Chapter 12 Using TD-SCDMA Signal Analyzer Measurement example Figure 202 Power vs. time (slot) measurement with TD-SCDMA signal analyzer NOTE You can use the LIMIT hot key to analyze your measurements with the user-definable limit and Pass/Fail indication. See “Setting limit for power vs. time tests” on page 394 for more information. -
Page 391: Power Vs. Time (Mask)
Chapter 12 Using TD-SCDMA Signal Analyzer NOTE The Delay setting is used only when there is a time offset in the signals to be measured. Optional. Press the Miscellaneous soft key, and then do the following as needed: – To select how to determine scrambling estimation, toggle the Scramble soft key and select Spec or Full. - Page 392 Chapter 12 Using TD-SCDMA Signal Analyzer Procedure Press the MEASURE SETUP hot key. Press the Slot Number soft key, and then select the time slot number to be displayed: TS0, TS1, TS2, TS3, TS4, TS5, or TS6. Press the Spread Factor soft key, and then select the spread factor option: DL Auto for auto detection of downlink, UL Auto for auto detection of uplink, SF1, SF2, SF4, SF8, or SF16 To set the number of maximum users, complete the following steps: Press the Max Users soft key.
-
Page 393: Timogram
Chapter 12 Using TD-SCDMA Signal Analyzer Measurement example Figure 204 Power vs. time (mask) measurement with TD-SCDMA signal analyzer NOTE You can use the LIMIT hot key to analyze your measurements with the user-definable limit and Pass/Fail indication. See “Setting limit for power vs. time tests” on page 394 for more information. -
Page 394: Setting Limit For Power Vs. Time Tests
Chapter 12 Using TD-SCDMA Signal Analyzer the time cursor is displayed. Optional. Press the Miscellaneous soft key, and then do the following as needed: – To set the delay, complete the following steps: Press the Delay soft key to set the amount of delay in µs. Enter a value by using the numeric keys. -
Page 395: Conducting Modulation Measurements
Chapter 12 Using TD-SCDMA Signal Analyzer Press the LIMIT hot key. Press the PvsT Test Limits soft key. Select the test item(s) and set the limit(s) depending on your selected measurement mode: To set the limit for Select Slot power Slot Power High Limit, Low Limit Downlink pilot signal power... - Page 396 Chapter 12 Using TD-SCDMA Signal Analyzer Optional. Press the Miscellaneous soft key, and then do the following as needed: – To set the delay, complete the following steps: Press the Delay soft key to set the amount of delay in µs. Enter a value by using the numeric keys.
-
Page 397: Midamble Power
Chapter 12 Using TD-SCDMA Signal Analyzer Midamble power Setting measure setup After configuring test parameters as described in the “Configuring test parameters” on page 375, you can continue your measurement. The measurement settings can be saved and recalled as a file. You can also use JDViewer, PC application software to configure a measure setup, save as a file, and load the file on to the instrument. -
Page 398: Code Power
Chapter 12 Using TD-SCDMA Signal Analyzer Measurement example Figure 207 Midamble measurement with TD-SCDMA signal analyzer Code power Setting measure setup After configuring test parameters as described in the “Configuring test parameters” on page 375, you can continue your measurement. The measurement settings can be saved and recalled as a file. You can also use JDViewer, PC application software to configure a measure setup, save as a file, and load the file on to the instrument. -
Page 399: Code Error
Chapter 12 Using TD-SCDMA Signal Analyzer NOTE The Spec searches “Sync Sequence Number” from 0 to 31 based on the TD-SCDMA specification and determines “Scrambling Code Number” by using the sync sequence number, while the Full does from 0 to 127 fully. –... - Page 400 Chapter 12 Using TD-SCDMA Signal Analyzer Procedure Press the MEASURE SETUP hot key. Toggle the Scramble soft key and select Auto or Manual to set the scramble code automatically or manually. Press the Slot Number soft key, and then select the time slot number to be displayed: TS0, TS1, TS2, TS3, TS4, TS5, or TS6.
-
Page 401: Setting Limit For Modulation Tests
Chapter 12 Using TD-SCDMA Signal Analyzer Measurement example Figure 209 Code error measurement with TD-SCDMA signal analyzer NOTE You can use the LIMIT hot key to analyze your measurements with the user-definable limit and Pass/Fail indication for the Max Inactive. See “Setting limit for modulation tests” on page 401 for more information. -
Page 402: Setting Limit
Chapter 12 Using TD-SCDMA Signal Analyzer The Auto Measure can be easily executed either by selecting a menu in the instrument or by running a programmed scenario in the PC-based application so that the instrument automatically configure and perform tests on every aspect of all the carriers. Setting limit You can set test limits for test item(s) in the auto measurement. -
Page 403: Setting Display
Chapter 12 Using TD-SCDMA Signal Analyzer Toggle the External Offset soft key and select On. Enter a value by using the numeric keys, and then press the dB soft key. To save your settings and results, go to SAVE/LOAD > Save and then perform functions as you desire. -
Page 404: Sync-Dl Id Vs. Tau
Chapter 12 Using TD-SCDMA Signal Analyzer NOTE The Delay setting is used only when there is a time offset in the signals to be measured. Optional. Go to SAVE/LOAD > Save, and then select the save option from the choices available for your measurement mode. -
Page 405: Sync-Dl Id Multipath
Chapter 12 Using TD-SCDMA Signal Analyzer Measurement example Figure 211 Sync-DL ID vs. Tau measurement with TD-SCDMA OTA signal analyzer Sync-DL ID multipath Setting measure setup After configuring test parameters as described in the “Configuring test parameters” on page 375, you can continue your measurement. -
Page 406: Sync-Dl Id Analyzer
Chapter 12 Using TD-SCDMA Signal Analyzer Measurement example Figure 212 Sync-DL ID multipath measurement with TD-SCDMA OTA signal analyzer Sync-DL ID analyzer Setting measure setup After configuring test parameters as described in the “Configuring test parameters” on page 375, you can continue your measurement. -
Page 407: Route Map
Chapter 12 Using TD-SCDMA Signal Analyzer Press the High Limit soft key, and then enter a value for the upper threshold. Press the Enter soft key. To set the limit for frequency error, complete the following steps: Press the Frequency Error soft key. Toggle the Test Limits soft key between On and Off to enable or disable the limit. - Page 408 Chapter 12 Using TD-SCDMA Signal Analyzer NOTE The JDMapCreator converts and resizes any scanned floor plan or layout to fit onto your instrument’s display. You must save your map file (.mcf) into the “SavedMap” folder of your USB drive so that you can load them onto your instrument. Press SAVE/LOAD hot key, and then select Load >...
- Page 409 Chapter 12 Using TD-SCDMA Signal Analyzer Optional. Go to SAVE/LOAD > Save, and then select Limit to save the limit settings. See “Using save” on page 32 for more information. Measurement example Figure 214 Route map measurement with TD-SCDMA OTA signal analyzer 1) Map view 2) Full view JD700B Series User’s Guide...
-
Page 410: Chapter 13 Using Mobile Wimax Signal Analyzer
Chapter 13 Using Mobile WiMAX Signal Analyzer This chapter provides instructions for using the Mobile WiMAX Signal Analyzer function (option 026) with the Mobile WiMAX OTA Analyzer function (option 046). Topics discussed in this chapter are as follows: Introduction ..........................411 ... -
Page 411: Introduction
Chapter 13 Using Mobile WiMAX Signal Analyzer Introduction The Mobile WiMAX Signal Analyzer performs power and spectrum measurements as well as modulation analysis to test the proper transmitter performance of Mobile WiMAX systems. It performs conformance testing according to the following standards providing a simple Pass/Fail indication on each test. -
Page 412: Connecting A Cable
Chapter 13 Using Mobile WiMAX Signal Analyzer Figure 215 Mobile WiMAX signal analyzer measurement screen Connecting a cable Direct connection Procedure Connect the Spectrum Analyzer RF In port of the JD700B series and the Power amplifier output port of BTS. Figure 216 Direct connection JD785B/JD745B JD788B/JD748B... -
Page 413: Over The Air (Ota)
Chapter 13 Using Mobile WiMAX Signal Analyzer Figure 217 Indirect connection JD788B/JD748B JD785B/JD745B CAUTION The maximum power for the Spectrum Analyzer RF In port is +25 dBm (0.316 W) for JD780B series and +20 dBm (0.1 W) for JD740B series. If the level of the input signal to be measured is greater than this, use a High Power Attenuator to prevent damage when you directly connect the signal to the instrument or connect the signal from the coupling port of a directional coupler. -
Page 414: Selecting Measurement Mode
Chapter 13 Using Mobile WiMAX Signal Analyzer Selecting measurement mode Procedure Press the MODE hard key. Press the Signal Analyzer soft key. Press the More (1/2) > Mobile WiMAX soft key. The Spectrum mode is set by default. Press the MEASURE hot key, and then select the measurement mode option from the following choices: –... -
Page 415: Setting Amplitude
Chapter 13 Using Mobile WiMAX Signal Analyzer Press the Channel Number soft key. Enter a value by using the numeric keys. You can also use the rotary knob. Press the Enter soft key. The instrument automatically displays the corresponding center frequency value for the selected channel number. - Page 416 Chapter 13 Using Mobile WiMAX Signal Analyzer – To couple the input attenuator’s level with your reference level setting, select Attenuation > Couple. As you increase the reference setting, the attenuation level also increases acoordingly. Optional. To change the scale unit: Select More (1/2) >...
-
Page 417: Setting Average
Chapter 13 Using Mobile WiMAX Signal Analyzer Enter a value by using the numeric keys. Press the dB soft key to complete the entry. To turn the external offset off: Press the AMP/SCALE hard key. Toggle the External Offset soft key and select Off. Setting average You can set the number of measurements to be averaged for the trace presentation. -
Page 418: Conducting Spectrum Measurements
Chapter 13 Using Mobile WiMAX Signal Analyzer Therefore, it is highly recommended that you use the same reference clock as the signal source. You can use the TRIGGER hot key to set the external clock. Figure 219 Connection ports for external reference clock Procedure Connect an external reference or a GPS antenna to the JD700B series. -
Page 419: Setting Trace
Chapter 13 Using Mobile WiMAX Signal Analyzer measured from the following choices: – 7 MHz (8/7): Sets the channel bandwidth to 7 MHz with sampling factor 8/7. In conjunction with nominal channel bandwidth – 8.75 MHz (8/7): Sets the channel bandwidth to 8.75 MHz with sampling factor 8/7 –... -
Page 420: Conducting Rf Measurements
Chapter 13 Using Mobile WiMAX Signal Analyzer Press the Select Trace soft key, and then select the trace number: T1, T2, T3, T4, T5, or T6. The legend shape of the selected trace changes from square to round to indicate that the trace is the active one now. - Page 421 Chapter 13 Using Mobile WiMAX Signal Analyzer Procedure Press the MEASURE SETUP hot key. Press the System Config soft key, and then do the following: Press the Bandwidth soft key, and then select the nominal channel bandwidth to be measured from the following choices: –...
-
Page 422: Occupied Bandwidth
Chapter 13 Using Mobile WiMAX Signal Analyzer Measurement example Figure 221 Channel power measurement with Mobile WiMAX signal analyzer NOTE You can use the LIMIT hot key to analyze your measurements with the user-definable limit and Pass/Fail indication. See “Setting limit for RF tests” on page 427 for more information. -
Page 423: Spectrum Emission Mask (Sem)
Chapter 13 Using Mobile WiMAX Signal Analyzer Enter a value by using the numeric keys, and then press the Enter soft key. Press the UL Symbols soft key to set the number of uplink symbols. Enter a value by using the numeric keys, and then press the Enter soft key. Optional. - Page 424 Chapter 13 Using Mobile WiMAX Signal Analyzer Procedure Press the MEASURE SETUP hot key. Press the System Config soft key, and then do the following: Press the Bandwidth soft key, and then select the nominal channel bandwidth to be measured from the following choices: –...
-
Page 425: Spurious Emissions
Chapter 13 Using Mobile WiMAX Signal Analyzer Measurement example Figure 223 SEM measurement with Mobile WiMAX signal analyzer NOTE You can use the LIMIT hot key to analyze your measurements with the user-definable limit and Pass/Fail indication. See “Setting limit for RF tests” on page 427 for more information. - Page 426 Chapter 13 Using Mobile WiMAX Signal Analyzer Toggle the Range soft key between On and Off to display or hide the selected range. To set up the test limits for Pass/Fail indication, complete the following steps: Press the Start Limit soft key. Enter a value by using the numeric keys.
-
Page 427: Setting Limit For Rf Tests
Chapter 13 Using Mobile WiMAX Signal Analyzer NOTE You can use the LIMIT hot key to analyze your measurements with the user-definable limit and Pass/Fail indication. See “Setting limit for RF tests” on page 427 for more information. Setting limit for RF tests By default, test limits specified in the standard are set for you. - Page 428 Chapter 13 Using Mobile WiMAX Signal Analyzer Enter a value by using the numeric keys, and then press the Enter soft key. Press the CP Ratio soft key, and then select the cyclic prefix ratio option: 1/4, 1/8, 1/16, or 1/32.
-
Page 429: Setting Limit For Power Vs. Time Tests
Chapter 13 Using Mobile WiMAX Signal Analyzer Setting limit for power vs. time tests Procedure Press the LIMIT hot key. Press the PvsT Test Limits soft key. Select the test item(s) and set the limit(s): To set the limit for Select Preamble power Preamble Power... - Page 430 Chapter 13 Using Mobile WiMAX Signal Analyzer Setting measure setup After configuring test parameters as described in the “Configuring test parameters” on page 414, you can continue your measurement. The measurement settings can be saved and recalled as a file. You can also use JDViewer, PC application software to configure a measure setup, save as a file, and load the file on to the instrument.
-
Page 431: Spectral Flatness
Chapter 13 Using Mobile WiMAX Signal Analyzer Measurement example Figure 226 Constellation measurement with Mobile WiMAX signal analyzer NOTE You can use the LIMIT hot key to analyze your measurements with the user-definable limit and Pass/Fail indication. See “Setting limit for modulation tests” on page 436 for more information. - Page 432 Chapter 13 Using Mobile WiMAX Signal Analyzer 1/32. Press the DL Symbols soft key to set the number of downlink symbols. Enter a value by using the numeric keys, and then press the Enter soft key. Press the UL Symbols soft key to set the number of uplink symbols. Enter a value by using the numeric keys, and then press the Enter soft key.
-
Page 433: Evm Vs. Subcarrier
Chapter 13 Using Mobile WiMAX Signal Analyzer NOTE You can use the LIMIT hot key to analyze your measurements with the user-definable limit and Pass/Fail indication for the Spectral Flatness. See “Setting limit for modulation tests” on page 436 for more information. EVM vs. -
Page 434: Evm Vs. Symbol
Chapter 13 Using Mobile WiMAX Signal Analyzer – To set the delay, complete the following steps: Press the Delay soft key to set the amount of delay in µs. Enter a value by using the numeric keys. You can also use the rotary knob. Press the µs soft key. - Page 435 Chapter 13 Using Mobile WiMAX Signal Analyzer measured from the following choices: – 7 MHz (8/7): Sets the channel bandwidth to 7 MHz with sampling factor 8/7. In conjunction with nominal channel bandwidth – 8.75 MHz (8/7): Sets the channel bandwidth to 8.75 MHz with sampling factor 8/7 –...
-
Page 436: Setting Limit For Modulation Tests
Chapter 13 Using Mobile WiMAX Signal Analyzer Measurement example Figure 229 EVM vs. symbol measurement with Mobile WiMAX signal analyzer NOTE You can use the LIMIT hot key to analyze your measurements with the user-definable limit and Pass/Fail indication. See “Setting limit for modulation tests” on page 436 for more information. -
Page 437: Performing Auto Measurements
Chapter 13 Using Mobile WiMAX Signal Analyzer Performing auto measurements The Auto Measure function of the JD700B series allows a complete signal profiling covering RF characterization and modulation quality parameters of up to 10 different carriers, particularly useful on an overlay architecture where base stations are transmitting in different frequencies. The Auto Measure can be easily executed either by selecting a menu in the instrument or by running a programmed scenario in the PC-based application so that the instrument automatically configure and perform tests on every aspect of all the carriers. -
Page 438: Performing Power Statistics Ccdf Measurements
Chapter 13 Using Mobile WiMAX Signal Analyzer Press the Time Interval soft key. Enter the amount of time in minutes, and then press the Enter soft key. Press the Settings soft key, and then set the following: Press the Start Symbol soft key. Enter a value by using the numeric keys, and then press the Enter soft key. -
Page 439: Measurement Example
Chapter 13 Using Mobile WiMAX Signal Analyzer Procedure Press the MEASURE SETUP hot key. Press the CCDF Length soft key to set the length of the CCDF. Enter a value between 1 and 100 by using the numeric keys. You can also use the rotary knob. Press the Enter soft key. - Page 440 Chapter 13 Using Mobile WiMAX Signal Analyzer Procedure Press the MEASURE SETUP hot key. Press the System Config soft key, and then do the following: Press the Bandwidth soft key, and then select the nominal channel bandwidth to be measured from the following choices: –...
-
Page 441: Multipath Profile
Chapter 13 Using Mobile WiMAX Signal Analyzer Multipath profile The Multipath Profile enables the user to determine RF environmental conditions of testing area. It indicates the multipath power with time delay in us up to six. The multipath profile is the result of portions of the original broadcast signal arriving at the receiving antenna out of phase. -
Page 442: Preamble Power Trend
Chapter 13 Using Mobile WiMAX Signal Analyzer Measurement example Figure 232 Multipath profile measurement with Mobile WiMAX OTA signal analyzer Preamble power trend The Preamble Power Trend shows power variations of a strongest preamble signal over time along with the relative power trend compare to total preamble power. Searching preamble index can be set auto to detect strongest or manual to search specific preamble. -
Page 443: Route Map
Chapter 13 Using Mobile WiMAX Signal Analyzer Press the UL Symbols soft key to set the number of uplink symbols. Enter a value by using the numeric keys, and then press the Enter soft key. Toggle the Preamble Index soft key and select the preamble search method: Auto or Manual. Optional. - Page 444 Chapter 13 Using Mobile WiMAX Signal Analyzer The JDMapCreator converts and resizes any scanned floor plan or layout to fit onto your instrument’s display. You must save your map file (.mcf) into the “SavedMap” folder of your USB drive so that you can load them onto your instrument. Press SAVE/LOAD hot key, and then select Load >...
- Page 445 Chapter 13 Using Mobile WiMAX Signal Analyzer See “Using save” on page 32 for more information. Measurement example Figure 234 Route map measurement with Mobile WiMAX OTA signal analyzer JD700B Series User’s Guide...
-
Page 446: Chapter 14 Using Cable And Antenna Analyzer
Chapter 14 Using Cable and Antenna Analyzer This chapter provides instructions for using the Cable and Antenna Analyzer function, which is available for the JD785B/JD745B Base Station Analyzer and the JD786B/JD746B RF Analyzer. Topics discussed in this chapter are as follows: Introduction .......................... -
Page 447: Introduction
Chapter 14 Using Cable and Antenna Analyzer Introduction The Cable and Antenna Analyzer is a diagnostic tool needed to accurately detect operational problems by performing cable and antenna measurements to verify the base station’s infrastructure, including feed lines, connectors, antennas, cables, jumpers, amplifiers, and filters. The JD785B/JD745B Base Station Analyzer and the JD786B/JD746B RF Analyzer have all of the measurement functions necessary to verify cable and antenna systems from Voltage Standing Wave Ratio (VSWR) to power measurements. -
Page 448: Selecting Measurement Mode
Chapter 14 Using Cable and Antenna Analyzer Figure 235 Reflection measurement screen Selecting measurement mode Procedure Press the MODE hard key. Press the Cable & Antenna Analyzer soft key. The Reflection (VSWR) mode is selected by default. To change the mode, press the MEASURE hot key and then select the measurement mode: –... -
Page 449: Setting Distance
Chapter 14 Using Cable and Antenna Analyzer Procedure To set the start and stop frequencies: Press the FREQ/DIST hard key. Press the Start Frequency soft key. Enter a value by using the numeric keys. You can also use the rotary knob or the arrow keys. Select the unit: GHz, MHz, kHz, or Hz. -
Page 450: Setting Sweep Mode
Chapter 14 Using Cable and Antenna Analyzer Procedure Press the AMP/SCALE hard key. Do one of the following choices: – Press the Auto Scale to optimize the display of the measured trace by letting the instrument set the minimum and maximum values for the Y-axis automatically. Each time this key is pressed, the top and bottom scales are set to the minimum and maximum values with margin on the Y-axis of the chart. -
Page 451: 1-Port Calibration
Chapter 14 Using Cable and Antenna Analyzer 1-port calibration Measurements that need the 1-port calibration are in the Reflection, DTF, Cable Loss, 1 Port Phase, or Smith Chart mode. Figure 236 illustrates the connection method when a port extension cable is used for calibration. To compensate errors caused by a port extension cable or adapters, perform an Open-Short-Load calibration including the port extension cable. -
Page 452: 2-Port Calibration
Chapter 14 Using Cable and Antenna Analyzer Reflection/RF Out port or at the end of the connected extension cable. Press the Continue soft key to continue calibration. The calibration progress bar appears. After completion, the calibration status on the screen changes to Quick calibration The Quick Calibration is useful when you want to measure only cable length in DTF measurements. -
Page 453: Calibration Status Indicators
Chapter 14 Using Cable and Antenna Analyzer The calibration progress bar appears. Connect the LOAD connector of the CAL Kit directly to the Cable and Antenna Analyzer Reflection/RF Out port or at the end of the connected test cable. Press the Continue soft key to continue calibration. The calibration progress bar appears. -
Page 454: Connecting A Cable
Chapter 14 Using Cable and Antenna Analyzer greater. It is recommended that you perform a new O-S-L calibration to obtain accurate measurement results. When the temperature comes back within the registered range, the status may be changed to CAL ON. CAL OFF Indicates that the frequency setting is changed off the frequency range registered for the calibration. -
Page 455: Connecting A Cable For Cable Loss (1 Port) Measurements
Chapter 14 Using Cable and Antenna Analyzer CAUTION The maximum input power for the Cable and Antenna Analyzer Reflection/RF Out port is +25 dBm. Do not connect this port directly to the output port of the system to prevent degraded performance or malfunctioning. WARNING Do not attempt to connect the instrument to the antenna when there is a risk of lightning. -
Page 456: Connecting A Cable For 2-Port Scalar Measurements
Chapter 14 Using Cable and Antenna Analyzer Figure 241 Connection for 2-port vector measurement CAUTION The maximum input power for the Cable and Antenna Analyzer RF In port is +25 dBm. However, a proper level of input to the Cable and Antenna Analyzer RF In port is 0 dBm. -
Page 457: Performing Reflection Measurements
Chapter 14 Using Cable and Antenna Analyzer Performing reflection measurements The Reflection measurement can be used to characterize cable and antenna system to ensure transmission line impedance performance and signal reflection characteristics of cell-site across a specific frequency range in voltage standing-wave ration (VSWR) or return loss. Making a measurement Procedure Make a proper cable connection as described in “Connecting a cable for reflection, DTF, 1-port... -
Page 458: Measurement Example
Chapter 14 Using Cable and Antenna Analyzer Measurement example Figure 243 Reflection measurement in return loss scale NOTE You can use the LIMIT hot key to analyze your measurements with the user-definable limit and Pass/Fail indication. See “Setting limit for cable and antenna analyzer” on page 470 for more information. - Page 459 Chapter 14 Using Cable and Antenna Analyzer Press the DTF Settings soft key, and then do the following: – To select a cable from the list, complete the following steps: Press the Cable List soft key, and then select Standard Cable or Custom Cable. The cable list window appears.
-
Page 460: Measurement Example
Chapter 14 Using Cable and Antenna Analyzer Measurement example Figure 244 DTF measurement NOTE You can use the LIMIT hot key to analyze your measurements with the user-definable limit and Pass/Fail indication. See “Setting limit for cable and antenna analyzer” on page 470 for more information. -
Page 461: Performing Reflection-Dtf Measurements
Chapter 14 Using Cable and Antenna Analyzer Performing reflection-DTF measurements You can view two measurement results simultaneously on the screen as you configure each measurement setting. Making a measurement Procedure Make a proper cable connection as described in “Connecting a cable for reflection, DTF, 1-port phase, and Smith Chart measurements”... -
Page 462: Performing Cable Loss (1 Port) Measurements
Chapter 14 Using Cable and Antenna Analyzer 2) Alternate sweep on: NOTE You can use the LIMIT hot key to analyze your measurements with the user-definable limit and Pass/Fail indication. See “Setting limit for cable and antenna analyzer” on page 470 for more information. -
Page 463: Measurement Example
Chapter 14 Using Cable and Antenna Analyzer NOTE The instrument’s built-in bias tee function (option 002) supplies 12-32 VDC bias to active devices through the RF In port, eliminating the need of an external power supply. NOTE See “Performing reflection measurements” for more information on how to set other measurement setup parameters for the Cable Loss (1 Port) measurement. -
Page 464: Performing 1-Port Phase Measurements
Chapter 14 Using Cable and Antenna Analyzer NOTE You can go to MEASURE SETUP > Zone to view your measurements in detail with the user-definable zoom zones. See “Setting zoom zones” on page 469 for more information. Performing 1-port phase measurements The 1-port Phase measurement is used to measure S phase to tune antennas and to phase-match cables. -
Page 465: Measurement Example
Chapter 14 Using Cable and Antenna Analyzer Measurement example Figure 249 Cable loss (1 port) measurement Figure 250 Cable loss (1 port) measurement with zoom NOTE You can use the LIMIT hot key to analyze your measurements with the user-definable limit and Pass/Fail indication. -
Page 466: Making A Measurement
Chapter 14 Using Cable and Antenna Analyzer devices. Smith chart also displays impedance-matching characteristics in cable and antenna systems or filter and duplexer devices. Making a measurement Procedure Make a proper cable connection as described in “Connecting a cable for reflection, DTF, 1-port phase, and Smith Chart measurements”... -
Page 467: Measurement Example
Chapter 14 Using Cable and Antenna Analyzer measuring wide frequency bands or requiring precise measurement data. Toggle the Display soft key and select Magnitude to view measurements in dB or Phase in degree. Optional. To turn the bias tee on, complete the following steps: Toggle the Bias Tee soft key and select On. -
Page 468: Making A Measurement
Chapter 14 Using Cable and Antenna Analyzer Making a measurement Procedure Make a proper cable connection as described in “Connecting a cable for 2-port scalar measurements” on page 456. Press the MEASURE SETUP hot key. Press the Data Points soft key to change the resolution of your measurement, and then select the data point option: 126, 251, 501, 1001, and 2001. -
Page 469: Setting Zoom Zones
Chapter 14 Using Cable and Antenna Analyzer Procedure Press the TRACE/DISPLAY hard key. Press the Select Trace soft key, and then select the trace number: T1, T2, T3, T4, T5, or T6. The legend shape of the selected trace changes from square to round to indicate that the trace is the active one now. -
Page 470: Setting Alternate Sweep
Chapter 14 Using Cable and Antenna Analyzer Setting alternate sweep You can use the Alternate Sweep in DTF measurements to scale down a specific sub-band without a need of an additional calibration. Procedure Press the MEASURE SETUP hot key. Press the Alternate Sweep Settings soft key. Toggle the Alternate Sweep soft key and select On or Off to enable or disable the alternate sweep feature. - Page 471 Chapter 14 Using Cable and Antenna Analyzer Optional. To move the limit line, complete the following steps: Select Limit Up/Down or Limit Left/Right. Turn the rotary knob to move the line as desired. You can also manually enter a value. Optional.
-
Page 472: Chapter 15 Using Rfocpri Interference Analyzer
Chapter 15 Using RFoCPRI Interference Analyzer This chapter provides instructions for using the RFoCPRI function that requires Optical Hardware (option 008) and RFoCPRI Interference Analyzer (options 060 – 065). Topics discussed in this chapter are as follows: Introduction ..........................473 ... -
Page 473: Introduction
Chapter 15 Using RFoCPRI Interference Analyzer Introduction Cell sites today have a distributed architecture of the radio that consists of the radio equipment control (REC) or base band unit (BBU) installed at the bottom of the tower and the radio equipment (RE) or remote radio head (RRH) installed at the top of the tower. -
Page 474: Connecting A Cable
Chapter 15 Using RFoCPRI Interference Analyzer Connecting a cable There are two ways of connecting a cable: monitoring mode and terminate mode. The monitoring mode lets you perform in-service testing by using coupler(s) while the terminate mode allows you to do out-of-service testing. -
Page 475: Monitoring Layer 2
Chapter 15 Using RFoCPRI Interference Analyzer – Layer 2 Monitoring – Layer 2 Term – Interference Analyzer > Spectrum, Spectrogram, RSSI, or Spectrum Replay – PIM Detection > PIM Detection Single Carrier, PIM Detection Multiple Carriers, or Calculated PIM Monitoring layer 2 The Layer 2 Monitoring is used to monitor the L1 inband protocol, for the link maintenance of the physical layer (layer 1), that resides on the layer 2 of CPRI. -
Page 476: Measurement Example
Chapter 15 Using RFoCPRI Interference Analyzer Measurement example Figure 256 CPRI layer 2 monitoring Performing layer 2 term testing The Layer 2 Term is used to test the CPRI front haul in the terminated status. CellAdvisor JD700B series can act as a BBU (Baseband Unit) to enable the RRH (Remote Radio Head) to be in the operation state. - Page 477 Chapter 15 Using RFoCPRI Interference Analyzer To set the clock reference, complete the following steps: Press the Tx Clock soft key. Select the transmission clock reference option Internal from the choices: Internal, Recovered, and External. Toggle the Port Type soft key between Master and Slave and select Master. Press the BBU Emulation soft key.
-
Page 478: Starting Layer 2 Term Test As Slave
Chapter 15 Using RFoCPRI Interference Analyzer Starting layer 2 term test as slave Procedure Press the MEASURE SETUP hot key. Press the CPRI Parameters soft key. To set the CPRI line bit rate of the front haul under test, complete the following steps: Press the Link Rate soft key. -
Page 479: Performing Interference Analysis
Chapter 15 Using RFoCPRI Interference Analyzer Figure 258 CPRI layer 2 term test as slave Performing interference analysis After checking that the link connection is good with no errors and alarms, you can proceed to the interference analysis activities including spectrum measurements, spectrogram, RSSI, and spectrum replayer. - Page 480 Chapter 15 Using RFoCPRI Interference Analyzer – None (no pre-configuration) – Ericsson (UL) – Ericsson (DL) – Alcatel-Lucent (UL/DL) – Samsung (UL/DL) – Huawei (UL) – Huawei (DL) NOTE The pre-configured information may be subject to changes at any times by NEMs. Press the CPRI Parameters soft key to set the CPRI parameters.
-
Page 481: Configuring Test Parameters
Chapter 15 Using RFoCPRI Interference Analyzer Following is an example of test configuration for a DUT. For this test configuration, IQ allocation will be like this in the CPRI basic frame. Press the PREV hard key twice to return the Measure Setup screen bar. Configuring test parameters Configuration of test parameters described in this section is used in the Interference Analyzer mode including spectrum measurements, spectrogram, and RSSI. - Page 482 Chapter 15 Using RFoCPRI Interference Analyzer To set the frequency with channel number: Press the FREQ/DIST hard key. Toggle the Unit soft key and select Channel. To select the standard channel, complete the following steps: Press the Channel Std soft key. The standard channel window appears. See “Appendix C –...
- Page 483 Chapter 15 Using RFoCPRI Interference Analyzer Procedure Press the AMP/SCALE hard key. Select More (1/2) > Scale/Div. Enter a value between 1 and 20 by using the numeric keys. Press the dB soft key to complete the entry. Setting external offset You can turn the External Offset on and manually set the external offset value.
- Page 484 Chapter 15 Using RFoCPRI Interference Analyzer Procedure Press the BW/AVG hard key. Press the Average soft key. Enter a value between one and 100 as needed by using the numeric keys. Press the Enter soft key. Setting sweep mode The default setting is Continue to sweep continuously for most on-going measurements. If you want to hold the measurement or get a single sweep, you can change the sweep mode.
-
Page 485: Conducting Spectrum Measurements
Chapter 15 Using RFoCPRI Interference Analyzer NOTE For the Max Hold and Min Hold, your instrument compares newly acquired data with the active trace and displays larger maximum values or smaller minimum values on the screen. You can set it to Unlimited to hold and view maximum or minimum data or specify a certain amount of time up to 60 seconds by using numeric keys or the rotary knob. - Page 486 Chapter 15 Using RFoCPRI Interference Analyzer Toggle the Sound soft key between On and Off and select On to enable to sound. To turn it off, select Off. Optional. To adjust the volume for alarm sound, press the Volume soft key, and then turn the rotary knob clockwise or counter clockwise.
-
Page 487: Conducting Spectrogram
Chapter 15 Using RFoCPRI Interference Analyzer Figure 260 RFoCPRI spectrum analysis on LTE Uplink 10 MHz, antenna 1 Figure 261 RFoCPRI spectrum analysis on LTE Uplink 10 MHz, antenna 2 Conducting spectrogram The Spectrogram is particularly useful when attempting to identify periodic or intermittent signals as it captures spectrum activity over time and uses various colors to differentiate spectrum power levels. -
Page 488: Conducting Rssi
Chapter 15 Using RFoCPRI Interference Analyzer Procedure Press the MEASURE SETUP hot key. To set the amount of time between each trace measurement: Press the Time Interval soft key. Enter a value by using the numeric keys. You can also use the rotary knob. Press the Sec soft key. - Page 489 Chapter 15 Using RFoCPRI Interference Analyzer line. For long-term analysis, the spectrogram and RSSI measurements can be automatically saved into an external USB memory. Post-analysis can be performed with JDViewer application software. Setting measure setup After configuring test parameters as described in the “Configuring test parameters” on page 481, you can continue to proceed to the spectrogram measurement.
-
Page 490: Performing Spectrum Replayer
Chapter 15 Using RFoCPRI Interference Analyzer segment line, and channel limit. See “Setting limit for interference analyzer” on page 491 for more information. Performing spectrum replayer The Spectrum Replayer lets you retrieve and replay recorded spectrum analyzer traces in interference analysis mode. -
Page 491: Setting Limit For Interference Analyzer
Chapter 15 Using RFoCPRI Interference Analyzer Measurement example Figure 264 RFoCPRI spectrum replay Setting display You can select the display option to view data in a different mode. Procedure Press the TRACE/DISPLAY hard key. Select the display option from the choices: Spectrum, Spectrogram, and RSSI. NOTE You can use the LIMIT hot key to analyze your measurements with the display line, multi- segment line, and channel limit. -
Page 492: Performing Pim Detection (Single And Multiple Carriers)
Chapter 15 Using RFoCPRI Interference Analyzer Press the # of Line soft key. Enter a value between 1 and 50 by using the numeric keys. Press the Enter soft key. Press the Autoset soft key to let the instrument set the limit for each segment and display the line. -
Page 493: Detecting Pim (Single And Multiple Carriers)
Chapter 15 Using RFoCPRI Interference Analyzer use. – Single: Sets the frequency of Radio 1. – Multi: Sets the frequency of Radio 1 and Radio 2. Do one of the following: – To set the frequency and span, complete the following steps: Toggle the Mode soft key between Freq and Band and select Freq. -
Page 494: Measurement Example
Chapter 15 Using RFoCPRI Interference Analyzer Measurement example Figure 265 PIM detection JD700B Series User’s Guide... -
Page 495: Chapter 16 Using Channel Scanner
Chapter 16 Using Channel Scanner This chapter provides instructions for using the Channel Scanner function (option 012). Topics discussed in this chapter are as follows: Introduction ..........................496 Display overview ........................496 Connecting a cable ........................496 Selecting measurement mode .................... -
Page 496: Introduction
Chapter 16 Using Channel Scanner Introduction A Channel Scanner is a radio receiver that can automatically tune or scan two or more discrete frequencies and multi-channels, indicating when it finds a signal on one of them and then continuing scanning when that frequency goes silent. You can measure up to 20 channels with this channel scanner. -
Page 497: Indirect Connection
Chapter 16 Using Channel Scanner Figure 267 Direct connection JD785B/JD786B/JD745B/JD746B JD788B/JD748B Indirect connection Procedure Connect the Spectrum Analyzer RF In port of the JD700B series and the monitor (test) port of BTS. Figure 268 Indirect connection JD785B/JD786B/JD745B/JD746B JD788B/JD748B CAUTION The maximum power for the Spectrum Analyzer RF In port is +25 dBm (0.316 W) for JD780B series and +20 dBm (0.1 W) for JD740B series. -
Page 498: Selecting Measurement Mode
Chapter 16 Using Channel Scanner Figure 269 OTA connection JD785B/JD786B/JD745B/JD746B JD788B/JD748B CAUTION If the input signal level to be measured is less than 0 dBm, set 0 dB attenuation or turn on the preamp to have better dynamic range for the OTA testing. Selecting measurement mode Procedure Press the MODE hard key. - Page 499 Chapter 16 Using Channel Scanner Procedure To automatically set the reference and attenuation level: Press the AMP/SCALE hard key. Press the Auto Scale soft key. Each time you press this key, both of the Y-axis scale and input attenuation level change to be optimized with some margin.
-
Page 500: Setting Average
Chapter 16 Using Channel Scanner cable loss and a user offset and the measurement result shows the value reflecting both offset values. When the external offset value is set at 40 dB in the Spectrum mode, the measurement result compensates 40 dB at both the Spectrum Analyzer and Signal Analyzer modes Procedure To set the external offset: Press the AMP/SCALE hard key. -
Page 501: Making Channel Scanner Measurements
Chapter 16 Using Channel Scanner Making channel scanner measurements Setting channel You need to set the channel to be scanned. Procedure Press the FREQ/DIST hard key. To select the standard channel, complete the following steps: Press the Channel Std soft key. The standard channel window appears. See “Appendix C –... -
Page 502: Making Frequency Scanner Measurements
Chapter 16 Using Channel Scanner Figure 270 Channel scanner measurement NOTE You can use the LIMIT hot key to analyze your measurements with the display line and channel limit. See “Setting limit for channel scanner” on page 505 for more information. Making frequency scanner measurements Setting frequency You need to set the frequency to be scanned. -
Page 503: Measurement Example
Chapter 16 Using Channel Scanner Measurement example Figure 271 Frequency scanner measurement NOTE You can use the LIMIT hot key to analyze your measurements with the display line and channel limit. See “Setting limit for channel scanner” on page 505 for more information. Making custom scanner measurements Setting channel/frequency You can customize channels or frequencies to be scanned as you desire. -
Page 504: Measurement Example
Chapter 16 Using Channel Scanner Press the Integration Bandwidth soft key. Enter a value by using the numeric keys. You can also use the rotary knob. Select the unit: GHz, MHz, kHz, or Hz. To add more channels to be scanned, repeat steps 5-7. Press the ESC hard key to dismiss the channel list window and view the scanning result. -
Page 505: Analyzing Measurements
Chapter 16 Using Channel Scanner Analyzing measurements Setting limit for channel scanner Procedure To use the display line: Press the LIMIT hot key. Press the Display Line soft key to set a threshold for the limit line and Pass/Fail indication. Enter a value, and then press the dBm unit soft key. -
Page 506: Chapter 17 Using Power Meter
Chapter 17 Using Power Meter This chapter provides instructions for using the RF Power Meter function and the Optical Power Meter function. Topics discussed in this chapter are as follows: Introduction ..........................507 Display overview ........................507 Performing internal RF power measurements ................. 507 ... -
Page 507: Introduction
Chapter 17 Using Power Meter Introduction The Power Meter of the JD700B series uses power measurement based on spectrum measurement results to provide an accurate power measurement result unlike a general spectrum analyzer, of which power accuracy may be degraded if the span is set too wide. The power meter also provides Pass/Fail indication with user-defined lower and upper limits. -
Page 508: Connecting A Cable
Chapter 17 Using Power Meter Connecting a cable Direct connection Procedure Connect the Spectrum Analyzer RF In port of the JD700B series and the Power amplifier output port of BTS as shown in Figure 274. Figure 274 Direct connection JD785B/JD786B/JD745B/JD746B JD788B/JD748B Indirect connection Procedure... -
Page 509: Setting Frequency
Chapter 17 Using Power Meter Select More (1/2) > Power Meter > Internal RF Power Meter. Setting frequency You need to set the frequency range to be measured with either the center frequency/span or the start/stop frequencies. You can also set the frequency with the channel number and span. Procedure To set the center frequency and span: Press the FREQ/DIST hard key. -
Page 510: Setting Amplitude
Chapter 17 Using Power Meter Select the span option, from the following choices: – To set the span manually, select Span, enter a value, and then select the unit. – To set the span automatically, select Full Span, Zero Span, or Last Span as needed. NOTE The Zero Span option is available only in the Spectrum mode. -
Page 511: Making A Measurement
Chapter 17 Using Power Meter Making a measurement Procedure Press the MEASURE SETUP hot key. Press the Resolution soft key, and then select the resolution option from the following choices: – 0: Displays the reading with no decimal place – 1: Displays the reading with one decimal place –... -
Page 512: Connecting A Cable
Chapter 17 Using Power Meter sensors including JD730 series power sensors. It serves as the highly accurate RF power meter and gives wider range of power measurement. Connecting a cable There are two types of power sensors. Directional power sensors are used in in-service power measurement. -
Page 513: Selecting Measurement Mode
Chapter 17 Using Power Meter Figure 277 Directional power sensor connection JD785B/JD786B/JD745B/JD746B JD788B/JD748B Selecting measurement mode Procedure Press the MODE hard key. Select More (1/2) > Power Meter > External RF Power Meter. Setting frequency You need to set the frequency to be measured depending on your connected external power sensor. Procedure Press the FREQ/DIST hard key. -
Page 514: Making A Measurement
Chapter 17 Using Power Meter Enter a value between 0 and 60 by using the numeric keys. Press the dB soft key. Making a measurement Procedure Press the MEASURE hot key. Depending your connected power sensor, do one of the following: –... -
Page 515: Performing Optical Power Measurements
Chapter 17 Using Power Meter NOTE You can use the LIMIT hot key to analyze your measurements with the user-definable limit and Pass/Fail indication. See “Setting limit for power meter” on page 517 for more information. Performing optical power measurements The optical power measurement is available in conjunction with MP-series power sensor, which measures optical power via a USB connection. -
Page 516: Setting Amplitude
Chapter 17 Using Power Meter Setting amplitude Procedure Press the AMP/SCALE hard key. Toggle the Display soft key and select the display method: Relative or Absolute. If the Relative is selected, press the Set Reference soft key to set the current value as the reference. -
Page 517: Measurement Example
Chapter 17 Using Power Meter Measurement example Figure 280 optical power measurement NOTE You can use the LIMIT hot key to analyze your measurements with the user-definable limit and Pass/Fail indication. See “Setting limit for power meter” on page 517 for more information. -
Page 518: Chapter 18 Performing Fiber Inspection
Chapter 18 Performing Fiber Inspection This chapter provides instructions for using the fiber testing function with a P5000i fiberscope. Topics discussed in this chapter are as follows: Introduction ..........................519 Display overview ........................519 Connecting a fiber microscope ....................519 ... -
Page 519: Introduction
Chapter 18 Performing Fiber Inspection Introduction Inspection of fiber optic connections is essential for the optimal performance and longevity of fiber optic connectivity. Throughout their lives, fiber connectors must be inspected, analyzed, and cleaned to maintain an acceptable level of functionality. The JD700B series makes it fast and easy to troubleshoot and certify that every connection at a cell site is optimized for a lifetime of performance. -
Page 520: Selecting Measurement Mode
Chapter 18 Performing Fiber Inspection Selecting measurement mode Procedure Press the MODE hard key. Select More (1/2) > Fiber Inspection. Configuring test parameters Selecting profile and tip You can select analysis profiles and inspection tips from the list. Procedure Press the MEASURE SETUP hot key. Press the Profile &... -
Page 521: Performing Fiber Inspection
Chapter 18 Performing Fiber Inspection Procedure To set the function of the QuickCapture button on the side of the P5000i, toggle the Test Button soft key and select the option from the following choices: – Test: Sets the capture button to function as Test. Pressing the Quickcapture button analyzes fiber image as like the Test soft key on your JD700B series. -
Page 522: Measurement Example
Chapter 18 Performing Fiber Inspection Measurement example Figure 282 Captured fiber image Testing a fiber Procedure Connect the fiber to be inspected to the tip of your microscope P5000i. The live image of the fiber is displayed on the screen. See the user manual of your fiber microscope for details on using the P5000i. -
Page 523: Measurement Example
Chapter 18 Performing Fiber Inspection Measurement example Figure 283 Analyzed fiber image and fiber inspection result Figure 284 Fiber inspection report JD700B Series User’s Guide... -
Page 524: Appendix
Appendix Topics discussed in this chapter are as follows: Appendix A – Product general information ................525 Appendix B – Cable list ......................529 Appendix C – Band, frequency & channel standard..............530 Appendix D – VSWR-Return loss conversion table ..............533 ... -
Page 525: Appendix A - Product General Information
Appendix Appendix A – Product general information JD780B series JD785B/JD786B JD788B Supplemental Information Inputs and Outputs RF In Spectrum Analyzer Connector Type-N female Type-N female Impedance 50 Ω 50 Ω Nominal Damage Level >+33 dBm, ±50 V DC >+33 dBm, ±50 V DC Nominal Reflection/RF Out Cable and Antenna Analyzer... - Page 526 Appendix JD785B/JD786B JD788B Supplemental Information Power External DC Input 18 V DC 18 V DC Power Consumption 42 W 42 W 54 W maximum when charging battery Battery 10.8 V, 7800 mA-h 10.8 V, 7800 mA-h Lithium Ion Operating Time >...
-
Page 527: Jd740B Series
Appendix JD740B series JD745B/JD746B JD748B Supplemental Information Inputs and Outputs RF In Spectrum Analyzer Connector Type-N female Type-N female Impedance 50 Ω 50 Ω Nominal Damage Level >+40 dBm, ±50 V DC >+40 dBm, ±50 V DC Nominal Reflection/RF Out Cable and Antenna Analyzer Connector Type-N female... - Page 528 Appendix JD745B/JD746B JD748B Supplemental Information Power External DC Input 18 V DC 18 V DC Power Consumption 42 W 42 W 54 W maximum when charging battery Battery 10.8 V, 7800 mA-h 10.8 V, 7800 mA-h Lithium Ion Operating Time >...
-
Page 529: Appendix B - Cable List
Appendix Appendix B – Cable list Relative Propagation Nominal Attenuation dB/m Cable Type Velocity (V¦) @ 1000 MHz FSJ1-50A 0.84 0.197 FSJ250 0.83 0.134 FSJ4-50B 0.81 0.119 HCC 12-50J 0.915 0.092 HCC 158-50J 0.95 0.023 HCC 300-50J 0.96 0.014 HCC 312-50J 0.96 0.013 HCC 78-50J... -
Page 530: Appendix C - Band, Frequency & Channel Standard
Appendix Appendix C – Band, frequency & channel standard Uplink Downlink Standard Start Freq Stop Freq Start Freq Stop Freq Valid Channels Valid Channels (MHz) (MHz) (MHz) (MHz) GSM 450 450.40 457.60 259≤n≤293 460.40 467.60 259≤n≤293 GSM 480 478.80 486.00 306≤n≤340 488.80 496.00... - Page 531 Appendix Band 21 (1500-General) 1447.9 1462.9 462≤n≤512 1495.9 1510.9 862≤n≤912 Band 22 (3500-General) 3410.0 3490.0 4437≤n≤4813 3510.0 3590.0 4662≤n≤5038 Band 25 (1900-General) 4887≤n≤5188 5112≤n≤5413 1850.0 1915.0 1930.0 1995.0 Band 25 (1900-Additional) 5212≤n≤5512 5437≤n≤5737 Band 26 (800-General) 5537≤n≤5688 5762≤n≤5913 814.0 849.0 859.0 894.0 Band 26 (800-Additional)
- Page 532 Appendix ProfR14 (7 3653) 3603.500 3696.250 0≤n≤53 3653.50 3746.25 0≤n≤53 ProfR15 (7 3753) 3703.500 3796.250 0≤n≤53 3753.50 3846.25 0≤n≤53 ProfR26 (10 5275) 5275.000 5335.000 55≤n≤67 ProfR27 (10 5740) 5740.000 5830.000 148≤n≤166 ProfR28 (10 5735) 5735.000 5845.000 147≤n≤169 ProfR29 (8.75 2304) 2304.375 2395.625 0≤n≤730...
-
Page 533: Appendix D - Vswr-Return Loss Conversion Table
Appendix Appendix D – VSWR-Return loss conversion table This information is for the Cable and Antenna Analyzer mode of the JD785B/JD745B Base Station Analyzer and the JD786B/JD746B RF Analyzer. Return Loss=20log (VSWR+1/VSWR-1) (dB) R.L./20 R.L./20 VSWR=(10 +1/10 VSWR Return Trans. -
Page 534: Appendix E - Cyclic Prefix Table
Appendix Appendix E – Cyclic prefix table This information is for the LTE – FDD Signal Analyzer mode and the LTE – TDD Signal Analyzer mode of the JD785B/JD745B Base Station Analyzer and the JD788B/JD748B Signal Analyzer. Following table shows OFDM parameter details by different bandwidth. Cyclic Prefix Length Bandwidth Configuration (Downlink) -
Page 535: Appendix F - Motorola Cdma/Ev-Do Lmf
Appendix Appendix F – Motorola CDMA/EV-DO LMF Motorola’s CDMA/EV-DO base stations (BTS) are optimized with the assistance of Local Maintenance Facility (LMF), a Motorola’s software tool that interfaces with the cell site and the instrument. The optimization process identifies the accumulated loss (or gain) for all receiving and transmitting paths at the cell site and stores that value in the system’s database. -
Page 536: Performing A Lmf Test
Appendix Figure 286 Using external power sensor Performing a LMF test Procedure Press the SYSTEM hot key. To set the IP address, complete the following steps: Select System Configuration > Ethernet Config. Toggle the Mode soft key and select Static. Press the Field >... -
Page 537: Appendix G - Bluetooth Connection
Appendix Appendix G – Bluetooth connection JD700B series’ Bluetooth mode is used for communication between the instrument and your computer with JDRemote or a storage device in order to use the following services if needed. Bluetooth Personal Area Network (PAN) profile service for JDRemote. ... -
Page 538: Setting Up Communication In Application
Appendix Plug in the Bluetooth adapters to the USB port of the computer and the instrument. The instrument detects the connected adapter and turns the Bluetooth mode on automatically. The Bluetooth icon appears in the status bar at the top of the instrument screen. Double-click the BlueSoleil Space icon on the computer desktop to launch the application if not opened already. -
Page 539: Turning Bluetooth Mode On/Off Manually
Appendix Select the TCP/IP, and then enter 192.168.10.10 without dots. Click OK to finish the communication setup. Right-click on the JDRemote window, and then click the Connect. This enables communication between the instrument and JDRemote. Right-click on the JDRemote window, and then click the Start. JD700B series and JDRemote become ready for communication. -
Page 540: Appendix H - Device Driver Installation
Appendix Appendix H – Device driver installation JD700B series can be controlled from the application software JDViewer or JDRemote installed on your computer. You must install driver software for the instrument on to the computer if USB Client connection is used for communication. Procedure Go to Control Panel >... -
Page 541: Appendix I - Ordering Information
Appendix Appendix I – Ordering information JD785B Base Station Analyzer JD785B 9 kHz to 8 GHz Spectrum Analyzer 5 MHz to 6 GHz Cable and Antenna Analyzer 10 MHz to 8 GHz RF Power Meter Internal mode Options NOTE: Upgrade options for the JD785B use the designation JD785BU before the respective last three-digit option number. JD785B001 2-Port Transmission Measurements JD785B002... -
Page 542: Jd786B Rf Analyzer
Appendix Requires calibration kit Requires dual port calibration kit Requires RFoCPRI options Highly recommended adding JD785B010 Highly recommended adding G70005035x and/or G70005036x Requires proper SFP/SFP+ transceiver and optical tap. Standard accessories can be purchased separately. JD786B RF Analyzer JD786B 9 kHz to 8 GHz Spectrum Analyzer 5 MHz to 6 GHz Cable and Antenna Analyzer... -
Page 543: Jd788B Signal Analyzer
Appendix JD788B Signal Analyzer JD788B 9 kHz to 8 GHz Spectrum Analyzer 10 MHz to 8 GHz RF Power Meter Internal mode Options NOTE: Upgrade options for the JD788B use the designation JD788BU before the respective last three-digit option number. JD788B001 2-Port Transmission Measurements (Requires option 07) -
Page 544: Jd745B Base Station Analyzer
Appendix Highly recommended adding JD788B010 Highly recommended adding G70005035x and/or G70005036x Requires proper SFP/SFP+ transceiver and optical pad Standard accessories can be purchased separately. JD745B Base Station Analyzer JD745B 100 kHz to 4 GHz Spectrum Analyzer 5 MHz to 4 GHz Cable and Antenna Analyzer 10 MHz to 4 GHz RF Power Meter... -
Page 545: Jd746B Rf Analyzer
Appendix G710550323 Automotive Cigarette Lighter 12 V DC Adapter G710550316 Stylus Pen JD700B361 JD700B Series User’s Guide and Application Software – CD Requires calibration kit Requires dual port calibration kit Requires RFoCPRI options Highly recommended adding JD745B010 Highly recommended adding G70005035x and/or G70005036x Requires proper SFP/SFP+ transceiver and optical tap. -
Page 546: Jd748B Signal Analyzer
Appendix JD748B Signal Analyzer JD748B 100 kHz to 4 GHz Spectrum Analyzer 10 MHz to 4 GHz RF Power Meter Internal mode Options NOTE: Upgrade options for the JD748B use the designation JD748BU before the respective last three-digit option number. JD748B001 2-Port Transmission Measurements (Requires option 07) -
Page 547: Jd700B Series Common Options
Appendix Requires RFoCPRI options Highly recommended adding JD748B010 Highly recommended adding G70005035x and/or G70005036x Requires proper SFP/SFP+ transceiver and optical pad Standard accessories can be purchased separately. JD700B Series Common Options Optional RF Power Sensors JD731B Directional Power Sensor. Peak and Average power 300 to 3800 MHz JD732B Terminating Power Sensor. - Page 548 Appendix G700050356 RF Omni Antenna Type-N(m), 720 MHz to 800 MHz G700050357 RF Omni Antenna Type-N(m), 2.3 GHz to 2.7 GHz Optional RF Yagi Antennas G700050363 RF Yagi Antenna Type-N(f), 1.75 GHz to 2.39 GHz, 9.8 dBd G700050364 RF Yagi Antenna Type-N(f), 806 MHz to 896 MHz, 10.2 dBd G700050365 RF Yagi Antenna Type-N(f), 866 MHz to 960 MHz, 10.2 dBd G700050366...
-
Page 549: Appendix J - Rohs Information
Appendix Appendix J – RoHS information This appendix describes the RoHS (Restriction of Hazardous Substances) information, which is a mandatory requirement from China. The RoHS directive consists in the restriction on the use of certain hazardous substances in electrical or electronic equipment sold or used in the European Union, after July 1, 2006. These substances are: lead, mercury, cadmium, hexavalent chromium, polybrominated biphenyls, and polybrominated diphenyl ethers. -
Page 550: Jd740B Series
Appendix JD740B series JD700B Series User’s Guide... -
Page 551: Appendix K - On-Screen Keyboard
Appendix Appendix K – On-screen keyboard You can use the on-screen keyboard to type in texts, file names, and folder names. Adding or deleting letters Procedure Tap keys on the on-screen keyboard. As you type, each letter is displayed in the name field. If you want to change the letter case between uppercase and lowercase, tap the Caps key. -
Page 552: Appending A Keyword
Appendix Figure 289 Edit keywords keyboard Appending a keyword You can append a factory-stored or custom-defined keyword, as you want. Procedure Tap the Append Keywords bar on the on-screen keyboard. The append keywords window appears. To append a keyword, complete the following steps: Select the keyword tag button to view available keywords for the tag. - Page 553 Appendix Figure 290 Append keywords window JD700B Series User’s Guide...
- Page 554 Network and Service Enablement Regional Sales North America Latin America Asia Pacific EMEA www.jdsu.com Toll Free: 1 855 ASK JDSU Tel: +55 11 5503 3800 Tel: +852 2892 0990 Tel: +49 7121 86 2222 Tel: +1 240 404 2999 Fax:+55 11 5505 1598 Fax:+852 2892 0770 Fax:+49 7121 86 1222 Fax:+1 240 404 2195...
Need help?
Do you have a question about the CellAdvisor JD700B Series and is the answer not in the manual?
Questions and answers