Table of Contents
Advertisement
Advertisement
Table of Contents

Subscribe to Our Youtube Channel
Related Manuals for Keysight Technologies N9322C


Summary of Contents for Keysight Technologies N9322C
- Page 1 Test Equipment Depot - 800.517.8431 - 99 Washington Street Melrose, MA 02176 - TestEquipmentDepot.com Keysight N9322C Spectrum Analyzer Notice: This document contains references to Agilent. Please note that Agilent’s Test and Measurement business has become Keysight Technologies. User’s Guide...
- Page 2 Notices © Keysight Technologies, Inc. 2012-2014 Warranty Safety Notices No part of this manual may be reproduced in The material contained in this docu- any form or by any means (including elec- ment is provided “as is,” and is subject...
-
Page 3: Table Of Contents
Contents Overview N9322C at a Glance Front Panel Overview Display Annotations Rear Panel Overview Front and rear panel symbols Getting Started Check the Shipment and Order List Options Safety Notice Power Requirements Power On and Check Environmental Requirements Electrostatic Discharge Protection... - Page 4 Contents Functions and Measurements Making a Basic Measurement Using the Front Panel Presetting the Spectrum Analyzer Viewing a Signal Measuring Multiple Signals Comparing Signals on the Same Screen Using Marker Delta Comparing Signals not on the Same Screen Using Marker Delta Resolving Signals of Equal Amplitude Resolving Small Signals Hidden by Large Signals Measuring a Low-Level Signal...
- Page 5 Contents Reflection Measurement Preparation Measuring Cable Reflection Measuring Distance to Fault Making a Power Measurement with USB Power Sensor Making an Average Power Measurement Making a Peak Power Measurement Power Meter Settings Demodulate the AM/FM signal Demodulating an AM Signal Demodulating an FM Signal Analysis the Modulated Signals AM/FM Modulation Analysis...
- Page 6 Spectrum Emission Mask MODE Tracking Generator Power Meter Spectrum Monitor Reflection Measurement AM/FM Modulation Analysis ASK/FSK Modulation Analysis Peak Search System Span Sweep Limit Trace Instrument Messages Overview Command Errors Execution Conflict Device-Specific Errors Troubleshooting Check the basics Contact Keysight Technologies...
- Page 7 Contents Menu Maps Amplitude Menu BW/Avg Menu Det/Display Menu File Menu (1 of 2) File Menu (2 of 2) Frequency Menu Marker Menu Marker-> Menu Measure Menu (1 of 2) Measure Menu (2 of 2) MODE - Tracking Generator MODE - Power Meter MODE - AM/FM Modulation Analysis MODE - ASK/FSK Modulation Analysis Name Editor Menu...
- Page 8 Contents...
-
Page 9: Overview
Keysight N9322C at a Glance Front Panel Overview Rear Panel Overview Front and rear panel symbols This chapter provides a description of the Keysight N9322C spectrum analyzer and an introduction to the buttons, features, and functions of the front and rear instrument panels. -
Page 10: N9322C At A Glance
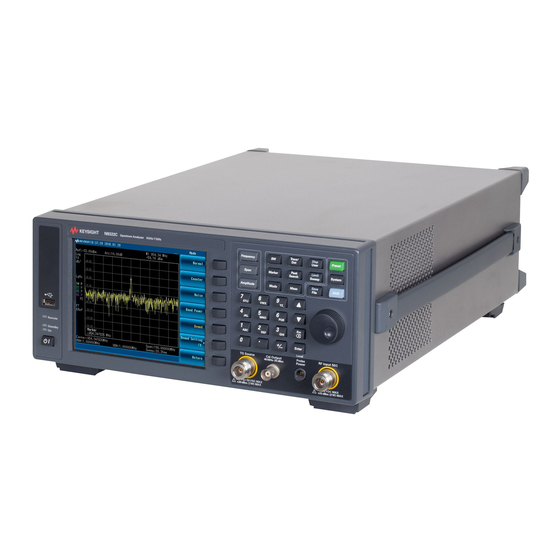
Overview N9322C at a Glance N9322C at a Glance The Keysight N9322C spectrum analyzer is a portable, swept spectrum analyzer with a frequency range of 9 kHz to 7.0 GHz. It can be widely used in an electronic manufacturing environment and in functional/final/QA test systems. - Page 11 Overview N9322C at a Glance • Modulation Analysis Function provides optional AM/FM and ASK/FSK modulation analysis function. (AM/FM: Option- AMA ASK/FSK: Option- DMA) • Tracking Generator (Option TG7) provides an RF source for scalar network analysis. • Baseband Channel (Option BB1) Provides superior DANL and SSB between 9 kHz to 10 MHz.
-
Page 12: Front Panel Overview
Overview Front Panel Overview Front Panel Overview N9322C 9kHz - 7.0 GHz Spectrum Analayzer Trace/ Disp Preset Frequency User Peak Limit System Span M arker Search Sw eep Save Shift Amplitude M ode M eas File M NO · Enter... - Page 13 Overview Front Panel Overview Disp - User accesses the submenu to recall the frequently • used user- defined state, or control what is displayed on the analyzer, including the display line, graticule and annotation after pressing Shift. • Mode selects the measurement mode according to the activated options.
- Page 14 Overview Front Panel Overview RF IN connector recieves the signal input. The maximum damage level is average continuous power +33 dBm or DC voltage 50 VDC. The impedance is 50 W. (N- type female). PROBE POWER connector provides power for high- impedance AC probes or other accessories (+15 V, –12 V, 150 mA maximum).
-
Page 15: Display Annotations
Overview Front Panel Overview Display Annotations Item Description Notes (Associated function key) Average Type [BW] > Average Type Reference Offset [Amplitude] > Ref Offset Amplitude scale [Amplitude] > Scale Type Reference level [Amplitude] > Ref Level Display Line [Disp] > Display Line Time and date display [System] >... - Page 16 Overview Front Panel Overview Softkey menu Refer to for details. “Key Reference” Dependent on current function key selection. Frequency span [SPAN] Sweep time [Sweep] > Sweep Time Fequency offset [Frequency] > Freq Offset Video bandwidth [BW] > Video BW Display status line Display status and instrument messages.
-
Page 17: Rear Panel Overview
Overview Rear Panel Overview Rear Panel Overview SERIAL LABEL ATTACH HERE HIPOT LABEL ATTACH HERE OCXO REF OUT ~100-240 V 10MHz 50/ 60 Hz 100 W MAX REF IN REF OUT TRIG IN 10MHz 10MHz T T L Kensington Lock lock the instrument and keep its safety. -
Page 18: Front And Rear Panel Symbols
Overview Front and rear panel symbols Front and Rear Panel Symbols The instruction manual symbol: indicates that the user must refer to specific instructions in the manual. The CE mark: a registered trademark of the European Community. Shows that this is an Industrial Scientific and Medical Group 1 ISM1-A Class A product. -
Page 19: Getting Started
Getting Started Getting Started Check the Shipment and Order List Safety Notice Power Requirements Power On and Check Environmental Requirements Electrostatic Discharge Protection Helpful Tips This chapter helps you in preparing the spectrum analyzer for use and provides the information to start using the spectrum analyzer correctly. -
Page 20: Check The Shipment And Order List
Retain the shipping materials for future use, as you may wish to ship the analyzer to another location or to Keysight Technologies for service. Verify that the contents of the shipping container are complete. -
Page 21: Safety Notice
Getting Started Safety Notice Safety Notice Read the following warnings and cautions carefully before powering on the spectrum analyzer to ensure personal and instrument safety. Always use a well-grounded, three-pin AC power cord to connect to WA RNING power source. Personal injury may occur if there is any interruption of the AC power cord. -
Page 22: Power Requirements
Getting Started Power Requirements Power Requirements The spectrum analyzer has an auto- ranging line voltage input. The AC power supply must meet the following requirements: Voltage: 100 to 240 VAC Frequency: 50 to 60 Hz Power: Maximum 100 W AC Power Cord The analyzer is equipped with a three- wire power cord, in accordance with international safety standards. -
Page 23: Power Requirements
Getting Started Power Requirements AC Power Cords Plug Type Cable Part For use in Plug Number Country & Region Description 8121-1703 BS 1363/A Option 900 United Kingdom, Hong Kong, Singapore, Malaysia 250V 10A 8120-0696 AS 3112:2000 Option 901 Australia, New Zealand 250V 10A 8120-1692 IEC 83 C4... -
Page 24: Power On And Check
Getting Started Power On and Check Power On and Check Connect the AC power cord into the instrument. Insert the plug into a power socket provided with a protective ground. Set the tilt adjustors for your preference. Figure 1 Plug in and angle adjustment Press the AC line switch on the rear panel. -
Page 25: Power On And Check
Getting Started Power On and Check Check for Instrument Messages The spectrum analyzer has two categories of instrument messages: error and warning messages. A error message is triggered by operation errors, for example, parameter setting conflicts or data input that is out of the range of a parameter. -
Page 26: Environmental Requirements
Getting Started Environmental Requirements Environmental Requirements Keysight Technologies has designed this product for use in Installation Category II, Pollution Degree 2, per IEC 61010- 1. Keysight has designed the spectrum analyzer for use under the following conditions: • Indoor use •... -
Page 27: Environmental Requirements
Getting Started Environmental Requirements Rack Mount It is recommended to use the Keysight rackmount kit (option 1CM) to install the spectrum analyzer into a rack. Do not attempt to rack mount the spectrum analyzer by the front panel handles only. This rackmount kit will allow mounting of the spectrum analyzer with or without handles. - Page 28 Getting Started Environmental Requirements Attach rackmount flange and front handle assembly with 3 screws per side. Attach the spectrum analyzer to the rack using the rackmount flanges with two dress screws per side. Installing the spectrum analyzers into other racks may promote shock C A U T I O N hazards, overheating, dust contamination, and inferior system performance.
-
Page 29: Electrostatic Discharge Protection
Getting Started Electrostatic Discharge Protection Electrostatic Discharge Protection Electrostatic discharge (ESD) damages or destroys electronic components (the possibility of unseen damage caused by ESD is present whenever transported, stored, or while the instrument is in use). This product contains components that are easily damaged by electrostatic discharge. -
Page 30: Bsa Pc Software
BSA PC software Keysight HSA PC software is an easy- to- use, PC- based remote control tool for the N9322C spectrum analyzer. It is able to be discretely used as a spectrum monitor to display and control the trace scans simultaneously with the analyzer, or a file manager to send/get files between the anaylzer and PC. -
Page 31: Helpful Tips
Perform Calibration The N9322C provides three manual calibration function to calibrate the time base and amplitude. The analyzer should warm up for 30 minutes before calibration. Time Base Calibration Perform a time base calibration to guarantee the frequency accuracy. -
Page 32: Using An External Reference
Getting Started Helpful Tips Amplitude Calibration The analyzer privides the internal amplitude calibration function. Please refer to the procedures below to perform an amplitude calibration: 1 Press [System] > More > Service > Calibration > Amp Alignment 2 2 Connect the CAL OUT and RF IN connector with a N- BNC cable. -
Page 33: Firmware Upgrade
Do not remove the USB storage device until the update is finished. IO Configuration The N9322C spectrum analyzer provides three types of IO connnection: USB, LAN and optional GPIB interface. Press [System] > More > Port Setting to set the corresponding interface as your need. -
Page 34: Timed Power On/Off
Pressing [System] > {Power On/Off Preset} > {Timed Pwr On} or {Timed Pwr Off} sets the time switch to power on/off the N9322C in a user- defined time and date. This function requires the power supply connected. Press {Repeat Mode Once/Everyday} to set the N9322C boot up/off in the pre- saved time everyday. -
Page 35: Data Securities
Getting Started Helpful Tips Data Securities The N9322C offers the optional memory erase function for data security. Press [System] > {More} > {Securities} > {Erase Memory} to erase all the user data in internal memory. Press Enter as a terminator to start the erase process immediately. - Page 36 Getting Started South Korea Class A EMC Declaration South Korea Class A EMC Declaration This equipment is Class A suitable for professional use and is for use in electromagnetic environments outside of the home.
-
Page 37: Functions And Measurements
Functions and Measurements Functions and Measurements Making a Basic Measurement Measuring Multiple Signals Measuring a Low-Level Signal Improving Frequency Resolution and Accuracy Tracking Drifting Signals Making Distortion Measurements Stimulus Response Transmission Measuring Stop Band Attenuation of a Lowpass Filter Channel Scanner Spectrum Monitor Reflection Measurement Making a Power Measurement with USB Power Sensor... -
Page 38: Making A Basic Measurement
Functions and Measurements Making a Basic Measurement Making a Basic Measurement This section provides information on basic operations. It assumes that you are familiar with the front and top panel buttons and keys, and display annotations of your analyzer. “Front Panel Overview” on If you are not, please refer to page 4 “Rear Panel Overview”... -
Page 39: Presetting The Spectrum Analyzer
Functions and Measurements Making a Basic Measurement Presetting the Spectrum Analyzer Preset function provides a known instrument status for making measurements. There are two types of presets, factory and user: Factory Preset When this preset type is selected, it restores the analyzer to its factory- defined state. - Page 40 Functions and Measurements Making a Basic Measurement Press System > Pwr on/off Preset > Save User, to save the current instrument settings as the ‘user preset’ state. The user preset will not affect the default factory preset settings. User preset settings can be changed and saved at any time. Figure 3-1 Factory Default Preset Setting Attenuation 20 dB(Auto)
-
Page 41: Viewing A Signal
Functions and Measurements Making a Basic Measurement Viewing a Signal Refer to the procedures below to view a signal. Press System > Pow on/off Preset > Preset Type > Factory to enable the factory- defined preset state. Press Preset to restore the analyzer to its factory- defined state. - Page 42 Functions and Measurements Making a Basic Measurement Note that the frequency and amplitude of the marker appear both in the active function block, and in the upper- right corner of the screen. Figure 3-1 10 MHz Internal Reference Signal Marker Annotation Marker 10.000000 MHz 0.43 dBm...
-
Page 43: Measuring Multiple Signals
Functions and Measurements Measuring Mul tiple Signals Measuring Multiple Signals This section provides the information on how to measure multiple signals. Comparing Signals on the Same Screen Using Marker Delta The delta marker function allows the user to compare two signals when both appear on the screen at the same time. - Page 44 Functions and Measurements Measuring Mul tiple Signals Move the second marker to another signal peak using the front- panel knob or by using Peak Search. Press Peak Search > Next Peak or Press Peak Search > Next Right Pk or Next Left Pk. Continue pressing the Next Pk softkeys until the marker is on the correct signal peak.
-
Page 45: Comparing Signals Not On The Same Screen Using Marker Delta
Functions and Measurements Measuring Mul tiple Signals Comparing Signals not on the Same Screen Using Marker Delta The analyzer will compare the frequency and amplitude differences between two signals which are not displayed on the screen at the same time. (This technique is useful for harmonic distortion tests.) In this example, the analyzer’s 10 MHz signal is used to measure frequency and amplitude differences between a... - Page 46 Functions and Measurements Measuring Mul tiple Signals Figure 3-3 shows the reference annotation for the delta marker (1R) at the left side of the display, indicating that the marker set at the 50 MHz reference signal is at a lower frequency than the frequency range currently displayed.
-
Page 47: Resolving Signals Of Equal Amplitude
Functions and Measurements Measuring Mul tiple Signals Resolving Signals of Equal Amplitude In this example a decrease in the resolution bandwidth (RBW) is used in combination with a decrease in video bandwidth (VBW) to resolve two signals of equal amplitude with a frequency separation of 100 kHz. - Page 48 Functions and Measurements Measuring Mul tiple Signals If the signal peak is not present on the display, increase the frequency span out to 20 MHz, turn signal tracking on, decrease the span back to 2 MHz and turn signal tracking off: Press Span >...
- Page 49 Functions and Measurements Measuring Mul tiple Signals Decreasing the resolution bandwidth improves the resolution of the individual signals and increases the sweep time. Figure 3-6 Resolving Signals of Equal Amplitude For fastest measurement times, use the widest possible resolution bandwidth. Under factory preset conditions, the resolution bandwidth is coupled to the span.
-
Page 50: Resolving Small Signals Hidden By Large Signals
Functions and Measurements Measuring Mul tiple Signals Resolving Small Signals Hidden by Large Signals This example uses narrow resolution bandwidths to resolve two RF signals that have a frequency separation of 50 kHz and an amplitude difference of 60 dB. Connect two sources to the RF IN as shown in Figure 3-4 Set one source to 300 MHz at –10 dBm. - Page 51 Functions and Measurements Measuring Mul tiple Signals Reduce the resolution bandwidth filter to view the smaller signal. The smaller signal will be hidden by the larger signal when the bandwidth settings are wider. Reducing the RBW setting will allow less of the larger signal to pass through the analyzer and the smaller signals peak will then rise out of the noise floor.
-
Page 52: Measuring A Low-Level Signal
Functions and Measurements Measuring a Low-Level Signal Measuring a Low-Level Signal This section provides information on measuring low- level signals and distinguishing them from spectrum noise. Reducing Input Attenuation The ability to measure a low- level signal is limited by internally generated noise of the spectrum analyzer. - Page 53 Functions and Measurements Measuring a Low-Level Signal Set the center frequency, span and reference level: Press Frequency > 300 > MHz Press Span > 2 > MHz Press Amplitude > 40 > –dBm. Move the desired peak to the center of the display: Press Peak Search Press Marker >...
-
Page 54: Decreasing The Resolution Bandwidth
Functions and Measurements Measuring a Low-Level Signal A lower attenuation value will mean that more of the signal strength will be displayed on screen: Press Amplitude > Attenuation > 0 > dB Figure 3-11 Measuring a low-level signal using 0 dB Attenuation Decreasing the Resolution Bandwidth Resolution bandwidth settings affect the level of internal noise but have little affect on the displayed level of... -
Page 55: Trace Averaging
Functions and Measurements Measuring a Low-Level Signal Figure 3-12 Decreasing Resolution Bandwidth A “#” mark appears next to the Res BW annotation in the lower left corner of the screen, indicating that the resolution bandwidth is uncoupled. Uncoupled indicates that the function is in manual control mode, not auto control mode. - Page 56 Functions and Measurements Measuring a Low-Level Signal Selecting averaging, when the analyzer is auto- coupled, changes the detection mode to Sample, smoothing the displayed noise level. This is a trace processing function and is not the same as using the N O T E average detector (as described on page 47...
-
Page 57: Improving Frequency Resolution And Accuracy
Functions and Measurements Improving Frequency Resolution and Accuracy Improving Frequency Resolution and Accuracy This section provides information on using the frequency counter function to improve frequency resolution and accuracy. Press Preset (With Preset Type of Factory) Connect a cable from the front panel CAL OUT to RF IN; Press System >... - Page 58 Functions and Measurements Improving Frequency Resolution and Accuracy The marker readout in the active frequency function changes while the counted frequency result (upper- right corner of display) does not. For an accurate count, the marker need not be placed at the exact peak of the signal response. The Frequency counter properly functions only on stable, CW signals N O T E or discrete spectral components.
-
Page 59: Tracking Drifting Signals
Functions and Measurements Tracking Drifting Signals Tracking Drifting Signals This section provides information on measuring and tracking signals that drift in frequency. Measuring a Source’s Frequency Drift The analyzer will measure source stability. The maximum amplitude level and the frequency drift of an input signal trace can be displayed and held by using the maximum hold function. - Page 60 Functions and Measurements Tracking Drifting Signals As the signal varies, maximum hold maintains the maximum responses of the input signal. Annotation on the left side of the screen indicates the trace mode. For example, M1 S2 S3 S4, indicates trace 1 is in maximum- hold mode, trace 2, trace 3, and trace 4 are in store- blank mode.
-
Page 61: Making Distortion Measurements
Functions and Measurements Making Distortion Measurements Making Distortion Measurements This section provides information on measuring and identifying signal distortion. Identifying Analyzer Generated Distortion High- level input signals may cause analyzer distortion products that could mask the real distortion measured on the input signal. - Page 62 Functions and Measurements Making Distortion Measurements The signal produces harmonic products (spaced 200 MHz from the original 200 MHz signal) in the analyzer input Figure 3-16 mixer as shown in Change the center frequency to the value of the first harmonic: Press Peak Search >...
- Page 63 Functions and Measurements Making Distortion Measurements Notice the MarkerD amplitude readout. This is the difference of the distortion product amplitude between 0 dB and 10 dB input attenuation settings. If the MarkerΔ absolute amplitude ≥ is approximately 1 dB for an input attenuator change, the analyzer is generating, at least in part, the distortion.
-
Page 64: Third-Order Intermodulation Distortion
Functions and Measurements Making Distortion Measurements Third-Order Intermodulation Distortion Two- tone, third- order intermodulation distortion is a common specification in communication systems. When two signals are present in a non- linear system, they may interact and create third- order intermodulation distortion (TOI) products that are located close to the original signals. - Page 65 Functions and Measurements Making Distortion Measurements The coupler should have a high degree of isolation between the two N O T E input ports so the sources do not intermodulate. Set one source (signal generator) to 300 MHz and the other source to 301 MHz, for a frequency separation of 1 MHz.
- Page 66 Functions and Measurements Making Distortion Measurements Measure the difference between this test signal and the Figure 3-17 second distortion product (see Press Marker > Mode > Delta Press Peak Search > Next Peak Figure 3-17 Measuring the Distortion Product...
-
Page 67: Stimulus Response Transmission
Functions and Measurements Stimulus Response Transmission Stimulus Response Transmission The procedure below describes using the built- in tracking generator of the analyzer to measure the rejection of a low pass filter. A type of transmission measurement. To measure the rejection of a low pass filter, connect the Figure 3-18 equipment as shown in . - Page 68 Functions and Measurements Stimulus Response Transmission To increase measurement sensitivity and smooth the noise: Press BW > 30 > kHz Press BW > Video BW > 300 > kHz A decrease in displayed amplitude is caused by tracking error Connect the cable from the tracking generator output to the analyzer input.
-
Page 69: Measuring Stop Band Attenuation Of A Lowpass Filter
Functions and Measurements Measuring Stop Band Attenuation of a Lowpass Fil ter Measuring Stop Band Attenuation of a Lowpass Filter When measuring filter performance, it is useful to look at the stimulus response over a wide frequency range. Setting the analyzer y- axis (amplitude) to Log scale type presents the measurement data in a usable format for determining filter characteristics. - Page 70 Functions and Measurements Measuring Stop Band Attenuation of a Lowpass Fil ter Set the resolution bandwidth to 10 kHz: Press BW > 10 > KHz Excessive signal input may damage the DUT. Do not exceed the C A U T I O N maximum power that the device under test can tolerate.
- Page 71 Functions and Measurements Measuring Stop Band Attenuation of a Lowpass Fil ter Use the front- panel knob to place the marker at the highest peak in the stop band to determine the minimum stop band attenuation. In this example, the peak occurs with Delta of Figure 3-21 563 MHz.
-
Page 72: Channel Scanner
Functions and Measurements Channel Scanner Channel Scanner The channel scanner - option SCN is a tool for coverage test, band clearance, and spectrum monitoring. It measures the channel power of multiple transmitted channels. The power is displayed via either the graphic bar chart or time bar chart. - Page 73 Functions and Measurements Channel Scanner 3 Press Meas > Scan Mode > Top N to set the scan mode to TOP N channel mode. Input the channel number you need to monitoring. Press Enter as a terminator. 4 Press Range Edit to access the submenu to edit the scan range.
-
Page 74: List N Channel Scanner
Functions and Measurements Channel Scanner List N Channel Scanner The List N channel scan is used for listing the frequency channels from specific channel standard or customized frequency bandwidth. Please refer to the procedures below to perform a List N channel scanner measurement. - Page 75 Functions and Measurements Channel Scanner 5 Press Scan Start to initiate the channel scan function. 6 Press Logging Start to start recording the scan process which includes the channel power and related channel bandwidth value to a CSV file. Press Logging Stop to end the logging.
-
Page 76: Channel Scanner Setup
Functions and Measurements Channel Scanner Channel Scanner Setup To customized the channel scan process, you can press Meas > Channel Scanner > Setup to set the measurement interval and rule in the submenu. The Meas Interval is a value of time/distance during which the every two scan process is triggered. -
Page 77: Spectrum Monitor
Functions and Measurements Spectrum Monitor Spectrum Monitor The scrolling three- dimensional display is noted for its ability to track the frequency and power behavior over the time, particularly intermittent signals. Spectrum Monitor may be used to analyze the stability of a signal over the time, or to identify intermittent interference signals in communications systems. - Page 78 Functions and Measurements Spectrum Monitor Press SPAN > 5 > MHz 3 Turn on the spectrum monitor function. Press Meas > Spectrum Monitor. 4 Set the update interval time between two frames. Press Update Int. On, rotating the knob or pressing numeric keypads to set the update interval time.
-
Page 79: Reflection Measurement
Functions and Measurements Reflection Measurement Reflection Measurement Press MODE > Reflection Measurement to access the cable and antenna measurement submenu. There are three different measurement mode for your selection: • Reflection measurement • One port cable loss • Distance to fault Preparation Before making a measurement in a specific mode, the HSA requires a calibration to make sure the measurement... -
Page 80: Measuring Cable Reflection
Functions and Measurements Reflection Measurement the RF OUT connector of the analyzer. Press ENTER to start the open calibration. 2 Follow the instruction to connect the short component of the T- combo calibrator to the RF OUT connector of the tester. - Page 81 Functions and Measurements Reflection Measurement Perform a DTF measurement To make a DTF- return loss measurement over a frequency range of 50 to 400 MHz, perform the following steps: 1 Press the MODE > Reflection Measurement > Distantce To Fault to select the DTF mode.
-
Page 82: Making A Power Measurement With Usb Power Sensor
Functions and Measurements Making a Power Measurement with USB Power Sensor Making a Power Measurement with USB Power Sensor The N9322C spectrum analyzer supports the U2000 and U2020 series USB power sensors. The U2000 Series USB power sensors do not need manual calibration and zero routines performed. -
Page 83: Making An Average Power Measurement
Functions and Measurements Making a Power Measurement with USB Power Sensor Making an Average Power Measurement The average power measurements provide a key metric in transmitter performance. Base station transmit power must be set accurately to achieve optimal coverage in wireless networks. If the transmit power is set too high due to inaccurate power measurements, undesired interference can occur. - Page 84 Connect the power sensor to the USB port of N9322C. The analyzer will recognize the power sensor automatically. To prevent damage to your sensor, do not exceed the power levels below.
- Page 85 Functions and Measurements Making a Power Measurement with USB Power Sensor Press Meas Setup > Disp Range to set the display range of the measurement. when it is set to On, the display range will be adjusted automatically according to the signal power dynamic range.
- Page 86 Functions and Measurements Making a Power Measurement with USB Power Sensor Press Meas > Meas Seup > Disp Mode to set the display in meter. chart or trace display. the measurement result will displays on the screen as shown. Figure 3-26 Power Measurement...
-
Page 87: Making A Peak Power Measurement
Follow the steps below to make a peak power measurement. Press Mode > Power Meter to access the power meter mode. Connect the power sensor to the USB port of N9322C. The sensor will automatically initialize, perform zeroing (While remianing connectored to the device under test), and calibrate without connecting to an external source. - Page 88 Functions and Measurements Making a Power Measurement with USB Power Sensor The analyzer provide the customer preset function with U2020 X- series power sensor. Press Meas > Preset and the predefined protocol list will pop up. Select the wanted item and press Preset as a terminator.
-
Page 89: Power Meter Settings
Functions and Measurements Making a Power Measurement with USB Power Sensor Power Meter Settings Please find the sections below to find the general power meter measurement settings. Setting the Power Meter Top and Bottom End-Points Setting the end points (Disk Range) close to expected measurement value changes the sensitivity of the Power Meter scale resolution. - Page 90 Functions and Measurements Making a Power Measurement with USB Power Sensor Set the Step Detection Press Meas > General Setup > Average > Step Detect to set the step Detect On and Off. When it is set to on, the filter will re- initialize upon detection of a step increase or decrease in the measured power to reduce the filter settling time after a significant step in the measured power, Step detection can...
- Page 91 Functions and Measurements Making a Power Measurement with USB Power Sensor Delay Set the delay time to be applied between the trigger event and all the gate start times. This allows you to time- shift all the gates by the same amount with one setting change.
-
Page 92: Demodulate The Am/Fm Signal
Functions and Measurements Demodulate the AM/FM signal Demodulate the AM/FM signal The N9322C provide the AM/FM demodulation function. Demodulating an AM Signal The demodulation function allows you to demodulate and hear signal information displayed on the analyzer. Simply place a marker on a signal of interest, set the analyzer in zero span, activate AM demodulation, turn the speaker on, and then listen. -
Page 93: Demodulating An Fm Signal
Functions and Measurements Demodulate the AM/FM signal Demodulating an FM Signal This section demonstrates how to demodulate and listen to an FM signal using the built- in FM demodulator. Using the built in FM demodulator you can tune to an FM signal and view the results of the detector output as displayed in the time- domain. - Page 94 Functions and Measurements Demodulate the AM/FM signal Listen to the FM signal. Press Demod Setting > Speaker Vol, rotate the knob to adjust the speaker volume. The headphone jack is availabe for the audio signal output alternatively.
-
Page 95: Analysis The Modulated Signals
Functions and Measurements Analysis the Modulated Signals Analysis the Modulated Signals The N9322C provides the optional AM/FM (Option AMA) and ASK/FSK (Option- DMA) modulation analysis function for analysis the modulated signals. These functions can be activated by license key. AM/FM Modulation Analysis... - Page 96 Functions and Measurements Analysis the Modulated Signals 5 Press Shift > Disp > Y Scale > Scale Coupling On to set the Y scale auto coupling. 6 Set the AM depth limit and turn on the limit function: Press Shift > Limit > AM Depth UP > 51 > % > AM Depth Low > 49 >...
- Page 97 Functions and Measurements Analysis the Modulated Signals 5 Press Shift > Disp > Y Scale > Scale Coupling On to set the Y scale auto coupling. 6 Set the FM deviation limit and turn on the limit function: Press Shift > Limits > FreqDev UP > 11 > % > FreqDev Low > 9.9 >...
-
Page 98: Ask/Fsk Modulation Analysis
Functions and Measurements Analysis the Modulated Signals ASK/FSK Modulation Analysis The ASK/FSK modulation analysis function supports four display modes: • Symbol • Waveform • ASK/FSK Error • Eye Diagram. User definable limits provide Pass/Fail indicators of four types: • Maximum carrier power •... - Page 99 Functions and Measurements Analysis the Modulated Signals 5 Press Filter Setup > Ref Filter > Nyquist to set the filter type. 6 Set the attenuation state to Auto (default): Press Amplitude > Attenuation Auto 7 Press Shift > Disp > Y Scale > Scale Coupling On to set the Y scale auto coupling.
- Page 100 Functions and Measurements Analysis the Modulated Signals FSK Demodulation Analysis Please refer to the procedures below to analysis the FSK demodulation. 1 Connect the signal generator to RF IN connector and turn on the signal generator’s FSK modulation and RF output. 2 Turn on the ASK demodulation analysis function.
-
Page 101: Measuring Channel Power
Functions and Measurements Measuring Channel Power Measuring Channel Power Channel Power measures the power and power spectral density in the specified channel bandwidth. A white frame on the display indicates the edge limits of the channel bandwidth. The user must specify the center frequency, reference level, and channel bandwidth to be used for the measurement. - Page 102 Functions and Measurements Measuring Channel Power Press Center Freq to change the center frequency of the current signal channel. Adjust the center frequency to measure other channel power in the same standard. Please follow the similar procedure as above to measure the channel power in the CDMA and LTE standard.
-
Page 103: Files Operation
Functions and Measurements Files Operation Files Operation The analyzer will store and retrieve data files similar to using a PC. The analyzer allows you to view and save files in the internal storage of the analyzer or to a USB storage device. - Page 104 Functions and Measurements Files Operation Saving a File The anlyzer allows you to save files (states, traces, limits or screens) to a USB storage device (USB/), or internal storage (INT/). The following is an example of how to save a trace to internal storage (INT/).
- Page 105 Functions and Measurements Files Operation HYTRACE_1, and consecutive decimal numbers appended to the alphabetic file name, such as HYSCREEN, HYSCREEN_1 and consecutive decimal numbers appended to the alphabetic file name. Saving a User State The analyzer allows you to recall the frequently used state file with User hardkey.
- Page 106 Functions and Measurements Files Operation Loading a File This feature will recall (load) onto the displayed screen a previously saved filename and type compatible with this analyzer. The file types are described above. Press File > Directory > {Memory Type} to select a directory. Rotate the knob to highlight a file.
- Page 107 Functions and Measurements Files Operation Copying a File To copy a file from internal storage to a USB storage device, follow this procedure: Connect a USB storage device to the USB connector. Press File > Directory > Memory Type to select the path to INT. Select the type of file.
- Page 108 Functions and Measurements Files Operation...
-
Page 109: Key Reference
Key Reference Key Reference This chapter describes each front panel hardkey and their associated softkeys (menus). The front panel key descriptions are organized alphabetically. The lower level softkeys are listed as they appear in the softkey menus. -
Page 110: Amplitude
Key Reference Amplitude Amplitude Press Amplitude hardkey to activate the reference level function and access the amplitude softkey menu. The softkey menu selections are described as follows: Ref Level Sets the reference level. This function is activated when Amplitude is pressed. The reference level is the amplitude power or voltage represented by the top line of the graticule on the display. - Page 111 Key Reference Amplitude Scale Type Scales the vertical graticule divisions in logarithmic units Log Lin when Log is selected. The valid logarithmic units are 1, 2, 5 and 10 dB per division. When Lin is underlined, the vertical divisions are linearly scaled with default amplitude units of volts.
- Page 112 Key Reference Amplitude Corrections Accesses the corrections submenu to enable the corrections function for amplitude compensation. The amplitude correction is used to compensate the gain/attenuation from antenna/cable. Please refer to the procedures below to use the amplitude correction function. 1 Please refer to the procedures below to create a correction file in BSA PC software.
- Page 113 Key Reference Amplitude 2 Set a folder named N932xDATA in a USB disk and put the saved correction file in. Insert the USB disk on top panel for further loading. 3 Press Amplitude > More > Corrections to acess the correction function.
- Page 114 Key Reference This hardkey activates the resolution bandwidth function and accesses the softkey menus that control the bandwidth and averaging functions. Res BW controls the 3 dB resolution bandwidth of the analyzer from Auto Man 10 Hz to 3 MHz using the knob or arrow keys. There are four available bandwidths less than 1 KHz are 10, 30, 100 Hz or 300 Hz.
- Page 115 Key Reference knob, or numeric keypad. When VBW/RBW (Auto) is selected, the ratio is determined automatically by the rules in Figure Figure 2 VBW/RBW Ratio Auto Rules Is Detector peak Is Trace Ratio=10 or Negative peak? Average On? Ratio=1 Is Detector Is Avg Type Ratio=10 Power?
- Page 116 VAvg appears on the left side of the display. There are actually four types of averaging processes within a N9322C. All, except VBW filtering, are affected by this setting. They are listed as follows: • Trace averaging Averages signal amplitudes on a trace- to- trace basis.
-
Page 117: Display
Key Reference Display Display Shift > Disp to control detector and display functions. Press Graticule Press this softkey to turn on the graticule display for the trace. Shift > Disp Key access: Y Scale Press this softkey to turn on the amplitude scale unit display on the left of the graticule. -
Page 118: Enter
Key Reference Enter Enter Terminates a front- panel keypad numeric entry and enters that value into the analyzer. (For most applications, it is better to use the units softkeys to terminate value entry.) When in File menu, the Enter key is used to terminate filename entries. -
Page 119: Frequency
Key Reference Frequency Frequency The hardkey activate the center frequency function, and access the menu softkeys for frequency functions. The center frequency, or start and stop frequency values appear below the graticule on the display. When changing both the center frequency and span, change the N O T E frequency first. - Page 120 Key Reference Frequency CF Step changes the step size for the center frequency function. On Auto Man selecting a step size and activating the center frequency function, the arrow keys change center the frequency by the step- size value. The step size function is useful for finding harmonics and sidebands beyond the current frequency span of the analyzer.
- Page 121 Key Reference Frequency Low Frequency This softkey toggles the baseband channel on and off. When Channel it is set to On, the SSB and DANL performance will be better from 3 kHz to 12 MHz. This softkey is only visible when the option BB1 has been installed and only available in Spectrum Analysis, Spectrum Monitor mode.
-
Page 122: Marker
Key Reference Marker Marker This hardkey accesses the marker control softkeys to select the type and number of markers. Markers are diamond- shaped characters that identify points of traces. Up to six pairs of markers may appear on the display simultaneously;... - Page 123 Key Reference Marker Delta activates a second marker at the position of the first marker. If no marker is present, two markers with the same identification number will appear at the center of the display. The marker number is indicated above the delta marker, and the same number is indicated with an R (for example, 1R) above the reference marker.
- Page 124 Key Reference Marker Marker To Accesses the following marker function menu keys: To Center Sets the center frequency of the analyzer to the marker frequency. In Delta mode, this softkey sets the center frequency to the marker delta value. The function is not available in zero span.
- Page 125 Key Reference Marker Marker Table Compresses the graticule and displays marker information in a table. The information includes the marker number, trace number, marker type, X axis value, and the amplitude. Key access: Marker Marker Table > Read Out Accesses the following menu keys that allow you to change the active marker readout.
- Page 126 Key Reference Marker Key access: Marker More > Delta Ref > All Off Turns off all markers, including markers used for signal track, and marker annotations. Key access: Marker More > All Off > Logging Press this softkey to start recording the marker value to a Start/Stop CSV file.
-
Page 127: Meas
Key Reference Meas Meas In the Spectrum Analyzer mode (see MODE), Meas key displays a menu for measurements such as adjacent channel power, occupied bandwidth, channel power, spectrum emission mask and TOI. Press Measure Off to turn the measurement off. Channel Power Channel Power measures the power and power spectral density in the specified channel bandwidth. - Page 128 Key Reference Meas Disp Mode This softkey toggles the display mode bwteen chart and Meter. Key access: Meas > Channel Power Disp Mode This softkey is only avaiable when the display mode is set to Meter. Pressing Auto Range toggles the display mode bwteen On and Off.
-
Page 129: Occupied Bw
Key Reference Meas Occupied BW Occupied Bandwidth integrates the power of the displayed spectrum. The power- bandwidth routine first computes all signal power contained in the trace, then calculates the span containing the power of the specified percentage. The percentage value default is 99% of the occupied bandwidth power. - Page 130 Key Reference Meas • Setting dBc Press {OBW} > {Method} > {dBc} to specify the power level used to determine the emission bandwidth as the number of dB down from the highest signal peak, within the occupied bandwidth span. This function is an independent calculation from the OBW calculation.
-
Page 131: Acpr
Key Reference Meas ACPR Adjacent Channel Power Ratio (ACPR) measures the power present in adjacent transmit channels. The span is automatically set according to the six available offsets and their associated integration bandwidths as defined by the user. Center Freq Sets the center frequency of the main channel power. -
Page 132: Spectrum Emission Mask
Key Reference Meas Spectrum Emission Mask Spectrum Emission Mask measurement includes the in- band and out- of- band spurious emissions. As it applies to W- CDMA (3GPP), this is the power contained in a specified frequency bandwidth at certain offsets relative to the total carrier power. - Page 133 Key Reference Meas Sweep Time Specifies the sweep time used in measuring Auto Man the power in the main channel. Res BW Specifies the resolution bandwidth used in Auto Man measuring and the power in the main channel. Total Pwr Ref Displays the type of power measurement (PSD Ref) reference selected by Measure Type.
- Page 134 Key Reference Meas Table 1 Offsets & Limits Defaulted for W-CDMA (3GPP) Base Station Measurements Offset Start Stop Res BW Rel Stop Meas Freq Freq (kHz) Start Stop Couple Start (dBc) (MHz) (MHz) (dBm) (dBm) (dBc) A. On 2.515 2.715 30.00 -14.00 -14.00...
- Page 135 Key Reference Meas Table 3 Offsets & Limits Defaulted for 802.11a and HiperLAN/2 Radio Standards Offset Start Stop Rel Stop Meas Freq Freq Start Stop Couple Start (dBc) Couple (MHz) (MHz) (dBm) (dBm) (dBc) A. On 9.00 11.00 16.00 -4.00 0.00 -20.00 B.
- Page 136 Key Reference Meas Start Freq Specifies the inner limit (frequency closest to the carrier) for On Off both segments of the specified offset pair. When Start Freq (Off) is selected, the offset pair is not measured. Key access: Meas > SEM > Offset/Limits Stop Freq Specifies the outer limit (frequency furthest from the carrier) for both segments of the specified offset pair.
- Page 137 Key Reference Meas Rel Stop Enters a relative level limit at Stop Freq ranging from –150.00 Couple Man to +50.00 dBc with 4 significant digits, and to toggle this function between Couple and Man. If set to Couple, this is coupled to Rel Start to make a flat limit line.
-
Page 138: Mode
Key Reference MODE MODE Selects the measurement mode of your analyzer. Spectrum Analyzer mode is the default mode and is for general purpose measurement use. Tracking Generator Accesses the tracking generator functions. (Option TG3) Key access: Mode Amplitude Toggles the tracking generator output between on and off. The power level can then be adjusted using the numeric keypad, arrow keys or knob. - Page 139 Key Reference MODE Amptd Offset offsets the displayed power of the tracking generator. Using the amplitude offset capability of the tracking generator allows you to take system losses or gains into account, thereby displaying the actual power delivered to the device under test.
- Page 140 Key Reference MODE amplifier. Now, replace the thru line with the device under test, and an accurate measurement of the gain or loss can be made. Norm Ref Lvl Sets the level (in dB) of the normalized reference. Norm Ref Offsets the displayed trace without affecting the Posn instrument gain or attenuation settings.
-
Page 141: Power Meter
Key Reference MODE Power Meter Press Mode > Power Meter to access the optional power meter functions. When this mode is selected, the power meter related softkey menu will be displayed and many of the instrument hardkeys will be disabled as they are not necessary for this mode. - Page 142 Key Reference MODE Zero Type Toggles the zeroing type of the Power Sensor between internal and external. When this type is set to EXT, pressing Zero will bring up a message which indicates the external signal need be pulled out. This setting is not affected by the preset in Power Meter menu.
- Page 143 Key Reference MODE Bottom Sets the bottom value of the power meter’ display range. Range from - 200 to (Top - 0.01) dBm. The default value is - 70 dBm. Resolution Accesses the associated Resolution submenu. 1 2 3 4 When the measurement suffix is W or %, this parameter represents the number of significant digits.
-
Page 144: Spectrum Monitor
Key Reference MODE Next View the next points of the chart. Pause/ Continues or pauses the current measurement. Continue When the measurement is in process, this softkey is displayed as “Pause”; when the measurement is paused, the softkey is displayed as “Continue”. Key access: Mode >... - Page 145 Key Reference MODE Spec View Enables you to view the details in the captured spectrogram. when the Spectrogram is running, Pressing Spec View pauses the running spectrogram. Press Home/End to view the first /last spectrogram in cache. Press Playback to playback the spectrogram process. The direction and the update interval is changeable as your need.
-
Page 146: Reflection Measurement
Key Reference MODE • File Type Toggles the saved file type between trace and CSV. • File Path Allocate the path where the file is saved. • File Size Set the number of frames for the spectrogram trace file. The allowed input range is 200 to 1500 frames. - Page 147 Key Reference MODE after changing the measurement frequency range. Normally, the selected span should be set as close to the actual swept frequency range. Key access: Freq > Cal Type Run/Hold This softkey toggles the frequency sweep between run and pause status.
-
Page 148: Am/Fm Modulation Analysis
Key Reference MODE AM/FM Modulation Analysis Use the arrow keys to highlight the mode you need and press [ENTER] as a terminator. When this mode is selected, the AM/FM modulation analysis menu will be displayed. Carrier Freq Sets the modulated carrier frequency. Key access: Mode >... - Page 149 Key Reference MODE Waveform - displays the signal waveform. AM Error - displays the AM error. Eye Diagram - Displays the Eye diagram. Key access: Mode > AM/FM Modulation Analysis X Scale Accesses the submenu to configure the X scale parametes: Scale/Div sets the number of symbols in one division.
- Page 150 Key Reference MODE Trigger Enables you to configure the trigger. When using a trigger source other than Free Run, the analyzer will begin a sweep only with the selected trigger conditions are met. A trigger event is defined as the point at which your trigger source signal meets the specified trigger level.
- Page 151 Key Reference MODE Single When the analyzer is in continuous sweep mode, pressing this softkey will change the sweep setting to single sweep. It will then begin a sweep after the trigger conditions are met. If the analyzer is already in single sweep, pressing this softkey will execute a new sweep as soon as the trigger condition is met.
-
Page 152: Ask/Fsk Modulation Analysis
Key Reference MODE ASK/FSK Modulation Analysis Use the arrow keys to highlight the mode you need and press [ENTER] as a terminator. When this mode is selected, the ASK/FSK modulation analysis menu will be displayed. Carrier Freq Sets the modulated carrier frequency. Key access: Mode >... - Page 153 Key Reference MODE X Scale Accesses the submenu to configure the X scale parametes: Scale/Div sets the number of symbols in one division. Ref Value sets the starting value in term of times at the reference position. Ref position sets the display reference position to either Left, Ctr (center), or Right.
- Page 154 Key Reference MODE Trigger Enables you to configure the trigger. When using a trigger source other than Free Run, the analyzer will begin a sweep only with the selected trigger conditions are met. A trigger event is defined as the point at which your trigger source signal meets the specified trigger level.
- Page 155 Key Reference MODE Single When the analyzer is in continuous sweep mode, pressing this softkey will change the sweep setting to single sweep. It will then begin a sweep after the trigger conditions are met. If the analyzer is already in single sweep, pressing this softkey will execute a new sweep as soon as the trigger condition is met.
-
Page 156: Peak Search
Key Reference Peak Search Peak Search Places a marker on the highest peak based on the settings of “Peak Criteria” on page 149. All peak search functions ignore the LO feed through signal. The process N O T E for determining if the Peak is the LO feed through takes into account Start Frequency, Span, Resolution Bandwidth, Resolution Bandwidth shape factor, and Frequency Accuracy. - Page 157 Key Reference Peak Search Pk-Pk Search Finds and displays the frequency (or time, if in zero span), and amplitude differences between the highest and lowest trace points. Key access: Peak Search > Pk-Pk Search To Center This is a hot key of marker to center. Key access: Peak Search >...
- Page 158 Key Reference Peak Search Peak Excursion Sets the minimum amplitude variation of signals that the marker identifies as a peak. If a value of 10 dB is selected, the marker moves only to peaks that rise and fall more than 10 dB above the peak threshold value.
-
Page 159: System
Key Reference System System This softkey accesses the submenu to set the system and utility settings. Time/Date accesses the Time/Date menu keys used to set and display the time and date. Key access: System > Time/Date Language chooses the 11 languages for softkeys display. Key access: System >... - Page 160 Key Reference System System Info Accesses the submenu to check the system information as below. Key access: System > More Show System Displays the number and description of the options installed in your analyzer. It also displays the instrument model number, product number, serial number, the date of production, etc.
- Page 161 Key Reference System Accesses the Front Panel softkey to verify the Diagnostics functionality of each front- panel key. The number next to each key name increments once each time the key is pressed. Rotating the knobs causes the number of pulses to be counted.
-
Page 162: Span
Key Reference Span Span Accesses the span function and the submenu softkeys for span functions. Pressing Span changes the frequency range symmetrically about the center frequency. The frequency- span readout describes the total displayed frequency range. To determine frequency span per horizontal graticule division, divide the frequency span by 10. -
Page 163: Sweep
Key Reference Sweep Sweep Accesses the Sweep softkeys for selection of the sweep mode and trigger mode of the analyzer. The softkey menu selections are defined as follows: Sweep Time Selects the sweep time for the analyzer to tune across the Auto Man displayed frequency span (or, in zero span, the time the analyzer take to sweep the full screen).Inputs may be made... - Page 164 Key Reference Sweep In zero span Auto- coupled does not function when in a zero span. The sweep time can only be set manually. The sweep time is selectable from 6 s to 200 s in zero span. In FFT Mode In FFT mode, the sweep time default is auto- coupled.
- Page 165 Key Reference Sweep Trigger Accesses the menu of keys that allow you to select the trigger mode of the analyzer. This softkey is only available in zero span. Free Run New sweep starts as soon as possible after the current sweep ends.
- Page 166 Key Reference Sweep Swp Time Rule The analyzer provides two sweep time rules to meet the different sweep time requirements: • Speed Activates the default fast sweep time rule. • Accuracy Activates the normal sweep time rule to ensure the measurement accuracy.
-
Page 167: Limit
Key Reference Limit Limit Limits Accesses softkeys that allow you to control and define the parameters of limit lines. Shift > Limit Key access: Limit 1 selects either of the available limits. The Limit 1 and Limit 2 Limit 2 keys access softkeys to set parameters for the selected limit. - Page 168 Key Reference Limit Test Toggles the testing of the limit lines On Off between on and off. If trace 1 is at or within the bounds of the set limit or margin, “Limit_# Pass” or “Margin_# Pass” is displayed in the upper left corner of the measurement area limit line.
- Page 169 Key Reference Limit Frequency Edits the frequency value for a limit point. After editing, the limit table will place the frequency or time in correct order. For a new point, the Amplitude default is 0 dBm, and Connected default is Yes. Shift >...
-
Page 170: Trace
Key Reference Trace Trace Accesses the trace keys to store and manipulate trace information. Each trace consists of a series of points in which amplitude data is stored. The analyzer updates the information for any active trace with each sweep. Trace Selects the trace for current use. - Page 171 Key Reference Trace Detector Softkey presents a submenu to select a specific detector (detector type) type, or allows the analyzer to select the appropriate detector for a particular measurement. Regarding detectors, it is important to understand what is a trace “bucket”. For every trace point displayed, there is a finite time during which the data for that point is collected.
- Page 172 Key Reference Trace Average measures the average value of the amplitude across each trace interval (bucket). When Average is selected, “Avg” appears on the left corner. Sample Sample detection is used primarily to display noise or noise- like signals. It should not be used to measure the accurate amplitude of non noise- like signals.
- Page 173 Key Reference Trace Average Dura. Initiates a digital averaging routine that averages the trace On Off points in an average duration resulting in trace “smoothing”. Increasing the average duration will further smooth the trace. The average is restarted when any of the following occurs: •...
- Page 174 Key Reference Trace...
-
Page 175: Instrument Messages
Instrument Messages Instrument Messages Overview Command Errors Execution Conflict Device-Specific Errors... -
Page 176: Overview
Instrument Messages Overview Overview If an improper operation occurs during the instrument configuration, a message will appear on the status line indicating the incident and the how the spectrum analyzer corrected the setting automatically. press System > System Info > Errors History to read the specific descriptions of those messages. -
Page 177: Command Errors
Instrument Messages Command Errors Command Errors The messages listed below are command errors, which are saved into local registers. -100 Command error An unrecognized command or data type was encountered. This message is used when the device cannot detect more specifics described for errors - 101 to - 109. - Page 178 Instrument Messages Command Errors -112 Program mnemonic too long The header contains more than 12 characters. -113 Undefined header The header is correct in syntax, but it is undefined for this device. -128 Numeric data not allowed A legal numeric data element was received, but the device does not accept one in this position for the header.
-
Page 179: Execution Conflict
Instrument Messages Execution Conflict Execution Conflict The system messages listed below are execution conflicts, indicating settings conflict during your operation. -200 Execution Error This is the generic syntax error for devices that cannot detect more specific errors. -222 Data out of range A legal program data element was parsed but could not be executed because the interpreted value was outside the legal range defined by the device. - Page 180 Instrument Messages Execution Conflict -330 Self-test failed A self- test failure occurred. Report this error to Keysight Technologies. -340 calibration failed An expected file was not found while trying to load internal calibration.
-
Page 181: Device-Specific Errors
1st LO Unlock The first LO on has lost phase lock. Report this error to the nearest Keysight Technologies sales or service office. 2nd LO Unlock The second LO has lost phase lock. Report this error to the nearest Keysight Technologies sales or service office. - Page 182 Instrument Messages Device-Specific Errors TG start freq is less than 1/2 res bw Tracking generator uncalibrated at start frequencies below 1/2 the current resolution bandwidth. Option not licensed The selected option requires a license. Refer to the installation procedures in the user guide provided for this particular option.
- Page 183 Instrument Messages Device-Specific Errors Connect CAL OUT to RF IN you must connect the CAL OUT to RF IN with the appropriate cable. Instrument state set to initial values While trying to load a trace or state, the state information was found to be in error.
- Page 184 Attempt to initialize the instrument state has failed. Cycle instrument power. If this fails to correct the problem, contact your nearest Keysight Technologies service center. Unable to load user state Attempt to load a state failed, because the state was...
-
Page 185: Troubleshooting
Troubleshooting Troubleshooting This chapter includes information on how to check for a problem with your Keysight Technologies spectrum analyzer, and how to return it for service. If you experience a problem or would like additional information about your analyzer, Keysight Technologies’ worldwide organization is ready... -
Page 186: Check The Basics
Troubleshooting Check the basics Check the basics Before calling Keysight Technologies, or returning an analyzer for service, perform the quick checks listed below. This check may eliminate the problem. • Is there power at the receptacle? • Is the analyzer turned on? Listen for internal fan noise to determine if the analyzer cooling fan is running. - Page 187 A button cell provides power to the real time clock of the spectrum N O T E analyzer. It is not rechargeable. If you find your N9322C encounters a clock defect, please contact your nearest Keysight Customer Contact Center (CCC) for service.
-
Page 188: Contact Keysight Technologies
Troubleshooting Contact Keysight Technologies Contact Keysight Technologies Keysight Technologies has offices around the world to provide you with complete support for your spectrum analyzer. To obtain servicing information or to order replacement parts, contact the Keysight Technologies customer contact center listed below. -
Page 189: Menu Maps
Menu Maps Menu Maps This chapter provides a visual representation of the front panel keys and their associated menu keys (in Spectrum Analyzer mode). Refer to Chapter “Key Reference,” on page 101 for key function descriptions. The name editor menu is shown separately, though it is accessed when entering data for many keys. -
Page 190: Amplitude Menu
Menu Maps Amplitude Menu Amplitude Menu Amplitude Ref level 1 dB/DIV 2 dB/DIV Attenuation Auto 5 dB/DIV Preamp 10 dB/DIV Scale/DIV > dBmV Scale Type dBuV Y Axis Unit More dBmV EMF dBuV EMF HiSensitivity V EMF Apply Ref Offset Corrections Load User Correction... -
Page 191: Bw/Avg Menu
Menu Maps BW Menu BW Menu Auto Auto VBW/RBW Log Pwr Auto Power Avg Type Voltage... -
Page 192: Det/Display Menu
Menu Maps Sweep Menu Sweep Menu Free Run Sweep RF Burst Gated Sweep Sweep Time On Off Video Auto Man Gated View On Off Sweep External View Single Cont SweepTime Video Level Single Sweep Gated Delay Trigger Slope Rise Fall Gated Length Trigger External... -
Page 193: File Menu (1 Of 2)
Menu Maps Display Menu Display Menu Graticule Disp Disp Freeze On Off Disp Mode Y Scale Bar Time On Off Display Line View Back On Off Threshold On Off *This menumap is for Spectrum Analyzer mode. Sort By Down Up *This menumap is for Channel Scanner measurement. -
Page 194: File Menu (2 Of 2)
Menu Maps File/Mode - Task Planner File/Mode - Task Planner Mode File Task Planner Media Type Deselect Save As INT SYS USB Select All Browse Folder Recall Deselect All Sort By Rename Copy To Create Folder Move To Files Operation Copy/Move Delete Directory... -
Page 195: Frequency Menu
Menu Maps Frequency Menu Frequency Menu Frequency Auto Tune Center Freq Start Freq Stop Freq Chan Standard Unit Freq Channel CF Step Auto Freq Offset LowFreqChannel *This softkey is only visible when option BB1 is installed. - Page 196 Menu Maps Limit Menu Limit Menu Limit Limit Type Points Limit 1 Upper Lower Freq Limit Line Limit 2 Amplitude Limit Limit Fixed Rel Delete Point X Axis Unit Delete All Edit Limits Freq Time Limit Beep Margin Off On Start Threshold Recall Limits Save Limits...
-
Page 197: Marker Menu
Menu Maps Marker Menu Marker Menu Normal Marker Marker 1 2 3 4 5 6 Delta Delta Pair Normal Marker Trace Ref Delta Counter Span Pair Span Center Mode Noise Relative to Band Power Function Demod Marker To Demod Type Demod Setting AM >... - Page 198 Menu Maps Peak Search Menu Peak Search Menu Peak Peak Search Next Peak Next Left PK Next Right PK Pk-Pk Search To Center Peak Table On Off More Export Table to CSV Continous Pk On Off Peak Threshold Peak Table Peak Excursion Peak Type Peak Criteria...
-
Page 199: Measure Menu (1 Of 2)
Menu Maps Measure Menu (1 of 2) Measure Menu (1 of 2) Center Freq Center Freq Meas Main Channel Int BW Adjacent Chn Disp Mode Adj Chn State Measure Off RRC Filter On Off Adj Chn BW ACPR Filter BW Auto Man Adj Chn Space Channel Power... -
Page 200: Measure Menu (2 Of 2)
Menu Maps Measure Menu (2 of 2) Measure Menu (2 of 2) Meas Play Home Stop Spectrogram Page Up Measure Off Run Pause Update Int. Page Down On Off Restart Meas ACPR Update Int. Start Save Channel Power Playback Time Setting Spectrg View File Type Spectrg... -
Page 201: Mode - Tracking Generator
Menu Maps Mode - Tracking Generator Mode - Tracking Generator Spectrum Mode Analyzer Tracking Amplitude Generaotr Power Meter Amptd Step Spectrum Amptd Offset Monitor Task Store Ref Normalize Planner 1->4 Normalize Modulation Off On Analysis Reflection Norm Ref Lvl Measurement Norm Ref Posn Ref Trace Blank View... - Page 202 Menu Maps Mode - Power Meter Mode - Power Meter Zero MODE Power Meter Zero Type Auto Range Zero/Cal Dis Range Range Meas Disp Lower Upper Resolution Meas Setup Disp Mode Limits Meter Char Preset Chart View Upper Limit Pause Lower Limit Freq Limit Beep...
-
Page 203: Mode - Am/Fm Modulation Analysis
Menu Maps Mode - AM/FM Modulation Analysis Mode - AM/FM Modulation Analysis Peak+ Auto Scale AM /FM Carrier Freq MODE M odulation Analysis Peak- Ref Value IFBW Peak+?/2 EqLPF Ref Position Scale/Div Detector Ext Gain X Scale Peak Hold Y Scale Return Return More... - Page 204 Menu Maps Mode - ASK/FSK Modulation Analysis Mode - ASK/FSK Modulation Analysis MODE Symbol Meas Filter ASK/FSK Auto Scale Carrier Freq Modulation Analysis Waveform Ref Filter Ref Value Symbol Rate ASK/FSK Error Alpha/BbT Filter Setup Ref Position Eye Diagram Filter Symbols Scale/Div View Ext Gain...
-
Page 205: Peak Search Menu
Menu Maps Mode - Reflection Measurement Mode - Reflection Measurement MODE Sweep Amplitude Marker Reflection Marker Hold Auto Scale Measurement 123456 Sweep Ref Level Normal Single Cont Return Loss Scale/Div Single Sweep Delta VSWR Cable Loss Cable Type Cable Type Continuous Max RG BTS Cust On Off... -
Page 206: Name Editor Menu
Menu Maps Name Ed itor Menu Name Editor Menu Name ABCDEFG HIJKLMN OPQRSTU VWXYZ Return... - Page 207 Menu Maps System Menu System Menu Brightness System Power Saving Time Beeper Brightness On Off Date Key Lock Keypad Setting On Off Power On Off On Time/Date Repeat Mode Once Everyday Time Pwr On Time Language Time Pwr Off Date Pwr On Setting Pwr On/Off DFT User Last...
-
Page 208: Span Menu
Menu Maps SPAN Menu SPAN Menu Span Span Full Span Zero Span Last Span... -
Page 209: Trace Menu
Menu Maps Trace/Det Menu Trace/Det Menu Trace Trace 1 2 3 4 Clear Write Max Hold Min Hold Normal Average View Pos Peak Blank Sample Neg Peak More 1 of 2 Detector Auto Average Number Variable A Variable B Average Dura. Variable C A-B->C Avg Restart... - Page 210 Menu Maps Trace/Det Menu...
-
Page 211: Index
Index Numerics ESD, external reference, 3GPP W-CDMA, Next Peak, 802.11a, 802.11b, Fail Mask, occupied BW, firmware revision, update, Offset/Limits, front panel Abs Start, options overview, Abs Stop, enable, front panel, using, adjacent channel power, order list, Amplitude key, annotation, marker, Attenuation, harmonic distortion Peak Search key,... - Page 212 measuring, tracking drifting signals, Uncoupled, definition, using frequency counter, VBW/RBW, ventilation, Video BW, View/Trace key, viewing signal, WEEE,...
- Page 214 This information is subject to change without notice. © Keysight Technologies 2012-2014 Edition 1 July 2014 N9322-90002...
Need help?
Do you have a question about the N9322C and is the answer not in the manual?
Questions and answers