Table of Contents
Advertisement
Advertisement
Table of Contents

Related Manuals for Keysight Technologies N9340B


Summary of Contents for Keysight Technologies N9340B
- Page 1 Keysight N9340B Handheld Spectrum Analyzer Notice: This document contains references to Agilent. Please note that Agilent’s Test and Measurement business has become Keysight Technologies. 99 Washington Street Melrose, MA 02176 800.517.8431 TestEquipmentDepot.com User's Guide...
-
Page 2: Safety Notices
No additional DOCUMENT THAT CONFLICT WITH government requirements THESE TERMS, THE WARRANTY beyond those set forth in the © Keysight Technologies, Inc. TERMS IN THE SEPARATE EULA shall apply, except to the 2008-2015 AGREEMENT WILL CONTROL. extent that those terms, rights, or... -
Page 3: Table Of Contents
Contents Overview Introduction Front Panel Overview Display Annotations Top Panel Overview Instrument Markings Getting Started Checking Shipment and Order List Power Requirements AC Power Cords Safety Considerations Working with Batteries Powering on the Analyzer for the First Time Preparation for Use Making a Basic Measurement System and File System Setting... - Page 4 Making Measurements Measuring Multiple Signals Measuring a Low-Level Signal Improving Frequency Resolution and Accuracy Making Distortion Measurements Making a Stimulus Response Transmission Measurement Measuring Stop Band Attenuation of a Low-pass Filter Making a Reflection Calibration Measurement Measuring Return Loss Using the Reflection Calibration Routine Making an Average Power Measurement Spectrogram...
- Page 5 Error Messages Overview Error Message List Troubleshooting Check the basics Warranty and Service Options Contact Keysight Technologies Menu Map...
-
Page 6: Documentation Conventions
2. A pair of square brackets [ ] indicates a hardkey, for example, [ENTER] refers to the ENTER hardkey. 3. “Analyzer” refers to Keysight N9340B handheld spectrum analyzer in the following chapters. 4. “DUT” refers to a device under test. - Page 7 Overview Overview...
-
Page 8: Overview Introduction
Channel Power Ratio) • Spectrogram Provides the capability to analyze the stability of a signal over time. With option INM, the N9340B can monitor the signal capturing performance or intermit- tent events unatteded over extended periods of time. • Spectrum Emission Mask Provides a Pass/Fail testing capability with a mask for out-of-channel emissions measurement. - Page 9 Overview Introduction • xDSL Measurement (Option XDM) Supports measurements on ADSL, ADSL2+ and VDSL networks. • Demodulation Analysis Function provides AM/FM and ASK/FSK demodulation analysis function. (AM/FM: Option-AMA ASK/FSK: Option-DMA) • Tracking Generator (Option TG3) Provides an RF source for scalar network analysis. •...
- Page 10 • SCPI remote control via USB and LAN port. • The PC software in the N9340B Helpkit CD is convenient for your further editing and data analysis. • 4-hour-time battery provides continuous work time in the field test.
-
Page 11: Front Panel Overview
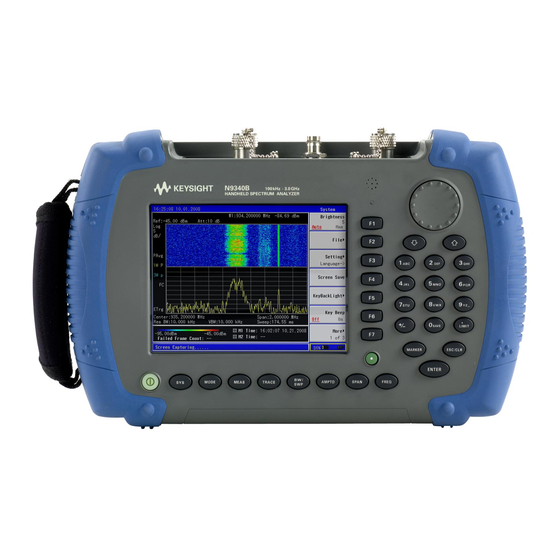
Overview Front Panel Overview Front Panel Overview N9340B 100 kHz - 3.0 GHz HANDHELD SPECTRUM ANALYZER M NO VW X SAVE LIM IT PRESET M ARKER ESC/ CLR ENTER BW / M ODE M EAS TRACE AM PTD SPAN FREQ... -
Page 12: Display Annotations
Overview Front Panel Overview Display Annotations 15:44:03 03,10,08 Description Associated Function Key Time and Date [SYS] > {Setting} > {General} Reference Level [AMPTD] Amplitude Scale [AMPTD] Detector Mode [TRACE] > {More} > {Detector} Center Frequency [FREQ] > {Center Freq} Resolution Bandwidth [BW/SWP] >... -
Page 13: Top Panel Overview
Overview Top Panel Overview Top Panel Overview 50 VDC M AX 33 dBm (2 W) M AX EXT TRIG IN/ RF INPUT 50 RF OUT 50 EXT REF IN Ext. Pow er Charging 12-18 VDC 55W MAX Caption Function 1 External DC power Provides input for the DC power source via an connector AC-DC adapter, or Automotive type DC adapter. -
Page 14: Instrument Markings
Overview Instrument Markings Instrument Markings The CE mark shows that the product complies with all relevant European Legal Directives. The CSA mark is a registered trademark of the Canadian Standards Association. All Level 1, 2 or 3 electrical equipment offered for sale in Australia and New Zealand by Responsible Suppliers must be marked with the Regulatory Compliance Mark. -
Page 15: Getting Started
Getting Started Getting Started Information on checking the analyzer when received, preparation for use, basic instrument use, familiarity with controls, defining preset conditions, updating firmware, and contacting Keysight Technologies. -
Page 16: Checking Shipment And Order List
Getting Started Checking Shipment and Order List Checking Shipment and Order List Check the shipment and order list when you receive the shipment. • Inspect the shipping container for damages. Signs of damage may include a dented or torn shipping container or cushioning material that indicate signs of unusual stress or compacting. -
Page 17: Power Requirements
Getting Started Power Requirements Power Requirements The AC power supplied must meet the following requirements: Voltage: 100 VAC to 240 Frequency: 50/60 Hz Power: Maximum 80 W The AC/DC power supply charger adapter supplied with the analyzer is equipped with a three-wire power cord, in accordance with international safety standards. -
Page 18: Ac Power Cords
Getting Started AC Power Cords AC Power Cords Plug Type Cable Part For use in Plug Number Country & Region Description 8121-1703 BS 1363/A Option 900 United Kingdom, Hong Kong, Singapore, Malaysia 250V 8120-0696 AS 3112:2000 Option 901 Australia, New Zealand 250V 1 8120-1692 IEC 83 C4... -
Page 19: Safety Considerations
Laboratory Use in accordance with Safety Requirements IEC 61010-1. The tester is supplied in a safe condition. The N9340B is also designed for use in Installation Category II and Pollution Degree 2 per IEC 61010-1. Read the following safety notices carefully before you... - Page 20 Getting Started Safety Considerations Recharge the battery only in the analyzer. If left unused, a fully CAU TI O N CAU - charged battery will discharge itself over time. Temperature extremes will affect the ability of the battery to charge. Allow the battery to cool down or warm up as necessary before use or charging.
- Page 21 Getting Started Safety Considerations Environmental Requirements The N9340B is designed for use under the following conditions: • Operating temperature: C to 40 C (using AC-DC adapter) –10 C to +50 C (using battery) • Storage temperature: –40 C to +70 •...
-
Page 22: Working With Batteries
Getting Started Working with Batteries Working with Batteries Full charge the battery before first using the analyzer. CAU TI O N CAU - Installing a Battery Step Notes 1 Open the battery cover Use a phillips type screwdriver, loosen the retaining screw, then pull the battery cover open. - Page 23 Getting Started Working with Batteries Charging a Battery You may charge the battery both in the tester and in the external battery charger (option BCG). Connect the automotive adapter to the IT power outlet of your CAU TI O N CAU - automobile (with option 1DC) for battery recharging.
-
Page 24: Powering On The Analyzer For The First Time
AC-DC adapter, then press the power switch on the front panel of your N9340B to power on the analyzer. Use only the original AC-DC adapter or originally supplied CAU TI O N CAU - battery for the power source. -
Page 25: Preparation For Use
Preparation for Use Preparation for Use Use [SYS] hardkey to check or set the system settings of your analyzer. Setting up your N9340B 1 Press [SYS] > {Setting} > {General} to set time and power saving mode: • Press {Time/Date} to set the time and date. - Page 26 Getting Started South Korea Class A EMC Declaration South Korea Class A EMC Declaration This equipment is Class A suitable for professional use and is for use in electromagnetic environments outside of the home.
-
Page 27: Making A Basic Measurement
Getting Started Making a Basic Measurement Making a Basic Measurement This section provides information on basic analyzer operations. It assumes that you are familiar with the front and top panel buttons and keys, and display annotations of your analyzer. If you are not, please refer "Front Panel Overview"... - Page 28 Getting Started Making a Basic Measurement Viewing a Signal on the Analyzer 1 Use a signal generator to generate a CW signal of 1.0 GHz, at a power level of 0.0 dBm. 2 Press [SYS] > {Setting} > {PwrOn/Preset} > {Preset Type} and select DFT to toggle the preset setting to factory-defined status.
-
Page 29: System And File
System and File System and File This chapter provides the information on basic system setting and file operation, Such as, display, option activation, calibration, firmware upgrade and test data saving/loading. -
Page 30: System Setting
System and File System Setting System Setting This section provides you the basic system configuration which is frequently used before or after the measurement operation. Please refer to the description below to get a better user experience and ease your test and measurement. -
Page 31: Factory Default Settings
System and File System Setting Factory Default Settings Parameter Defaul t Setting Center Frequency 1.5 GHz Start Frequency 0.0 Hz Stop Frequency 3.0 GHz Span 3.0 GHz Reference Level 0.0 dBm Attenuation Auto (20 dB) Scale/DIV 10 dB/DIV Scale Type Auto (1 MHz) Auto (1 MHz) Average Type... -
Page 32: Visual And Audio Adjustment
System and File System Setting Visual and Audio Adjustment Display Adjustment Press [SYS] > {Brightness} to toggles the screen brightness between Auto and Man. When it sets to Auto, the brightness will adjust according to the environment automatically with the built-in light sensor. When it sets to Man, you can set a fixed brightness value manually. -
Page 33: Switch Timer
Switch Timer Pressing [SYS] > {Switch Timer} > {Timer} sets the time switch to power on/off the N9340B in a user-defined time and date. This switch timer function requires the power supply connected or charged battery installed. Press {Repeat Mode Everyday} to set the N9340B boot up/off in the pre-saved time everyday. -
Page 34: Upgrading Firmware
Press Enter to upgrade the firmware. The analyzer will perform the update automatically. 5 Unplug the USB stick and restart the N9340B when message “All modules have been upgraded, please restart” is displayed. 6 Press [SYS] > {More} > {Show System} to find the updated MCU firmware version. -
Page 35: Adding An Option
System and File System Setting External Reference (Ref) Use the external reference function as follows: 1 Input a 10 MHz signal to the EXT TRIG IN/REF IN connector. 2 Press [SYS] > {Setting} > {Input/Output Ref} to enable the external reference signal input. The analyzer then turns off its internal reference. -
Page 36: Show System
“Error Messages” on page 139. Perform a Time Base Calibration The N9340B provides a manual calibration function to calibrate the time base. The analyzer should warm up for approximately 30 minutes before calibration. When the calibration function is triggered, the current measurement is interrupted and a gauge displays on the LCD. -
Page 37: Low Frequency Channel
System and File System Setting rather than calibration course, as the calibration time is unpredictable. When the calibration is finished, the LCD displays a calibration, and the interrupted measurement restarts. Time base calibration takes during a short time only when the NO TE inner temperature is stable. -
Page 38: File
System and File File File Pressing [SYS] > {File} accesses to the menu that allows you to manage the file saving and loading. A USB memory stick of FAT32 or FAT16 format and with only one NO TE memory zone is primarily required when using USB memory stick for file saving and loading. - Page 39 File • Limit (*.LIM) A limit file records the limit settings. You can edit the limit file and transfer this file between the N9340B and PC software. • CSV (*.CSV) A CSV file records the trace data and available for review on PC.
- Page 40 System and File File Saving Multiple Test Setups Test Setups that are unique and are necessary to recall frequently can be saved as an instrument state file. "File Types" on Other file types are described on page Quick Saving a Trace or a Screen Press [0/Save] to quickly save a trace or a screen to either the local memory or an external USB device, depending upon the setup of the save path.
- Page 41 System and File File Quick loading a setup • Load default Press [SYS] > {More} > {More} > {LoadSYS Setup} > {Load default} to recall the factory default setup. • User Setup Press [SYS] > {More} > {More} > {LoadSYS Setup} > {User Setup} to recall a customized setup that has been saved previously.
- Page 42 System and File File...
-
Page 43: Making Measurements
Making Measurements Making Measurements... -
Page 44: Measuring Multiple Signals
Making Measurements Measuring Multiple Signals Measuring Multiple Signals This section provides information on measuring multiple signals. Comparing Signals on the Same Screen Using this analyzer, you can easily compare frequency and amplitude signal differences. For example, measuring radio or television signal spectra. The Delta Marker function allows two signals to be compared when both appear on the screen at the same time. - Page 45 Making Measurements Measuring Multiple Signals softkey. In this example the next peak is 100 MHz, a harmonic of the 50 MHz signal: • Press [MARKER] > {Peak Search} > {Next Right PK} or {Next Left PK}. To increase the resolution of the marker readings, turn on the NO TE frequency count function.
- Page 46 Making Measurements Measuring Multiple Signals Resolving Signals of Equal Amplitude In this example a decrease in resolution bandwidth is used in combination with a decrease in video bandwidth to resolve two signals of equal amplitude with a frequency separation of 100 kHz. Notice that the final RBW selected is the same width as the signal separation while the VBW is slightly narrower than the RBW.
- Page 47 Making Measurements Measuring Multiple Signals As you decrease the resolution bandwidth, you improve the resolution of the individual signals and it also increases the sweep timing. For fastest measurement times, use the widest possible resolution bandwidth. Under factory preset conditions, the resolution bandwidth is coupled to the span.
- Page 48 Making Measurements Measuring Multiple Signals Resolving Small Signals Hidden by Large Signals This example uses narrow resolution bandwidths to resolve two input signals with a frequency separation of 50 kHz and an amplitude difference of 60 dB. 1 Connect two sources to the analyzer input connector Figure 4-3 on page as shown in 2 Set one source to 300 MHz at –10 dBm.
-
Page 49: Measuring A Low-Level Signal
Making Measurements Measuring a Low-Level Signal Measuring a Low-Level Signal This section provides information on measuring low-level signals and distinguishing them from spectrum noise. There are four main useful techniques as follows to measure a low-level signal. Reducing Input Attenuation The ability to measure a low-level signal is limited by internally generated noise in the spectrum analyzer. - Page 50 Making Measurements Measuring a Low-Level Signal 5 Reduce the span to 1 MHz and if necessary re-center the peak. • Press [SPAN] > 1 > {MHz} 6 Set the attenuation to 20 dB. Note that increasing the attenuation moves the noise floor closer to the signal level.
- Page 51 Making Measurements Measuring a Low-Level Signal Decreasing the Resolution Bandwidth Resolution bandwidth settings affect the level of internal noise without affecting the amplitude level of continuous wave (CW) signals. Decreasing the RBW by a decade reduces the noise floor by 10 dB. "Reducing Input Attenuation"...
- Page 52 Making Measurements Measuring a Low-Level Signal Using the Average Detector and Increased Sweep Time The analyzer’s noise floor response may mask low-level signals. Selecting the instruments averaging detector and increasing the sweep time will smooth the noise and improve the signal’s visibility. Slower sweep times are necessary to average noise variations.
- Page 53 Making Measurements Measuring a Low-Level Signal Trace Averaging Averaging is a digital process in which each trace point is averaged with the previous sweeps data average for the same trace point. Selecting averaging, when the analyzer is auto coupled, changes the detection mode to sample, smoothing the displayed noise level.
-
Page 54: Improving Frequency Resolution And Accuracy
Making Measurements Improving Frequency Resolution and Accuracy Improving Frequency Resolution and Accuracy Using the frequency counter to improve frequency resolution and accuracy. Marker count properly functions only on CW signals or dis- NO TE crete spectral components. The marker must be > 40 dB above the displayed noise level. -
Page 55: Making Distortion Measurements
Making Measurements Making Distortion Measurements Making Distortion Measurements This section provides information on measuring and identifying signal distortion. Identifying Analyzer Generated Distortion High level input signals may cause analyzer distortion products that could mask the real distortion present on the measured signal. Use trace and the RF attenuator to determine which signals, if any, may be internally generated distortion products. - Page 56 Making Measurements Making Distortion Measurements 3 Change the center frequency to the value of the second (400 MHz) harmonic: • Press [MARKER] > {Peak Search} • Press [MARKER] > {Marker To} > {To Center} 4 Change the span to 50 MHz and re-center the signal: •...
- Page 57 Making Measurements Making Distortion Measurements Figure 4-13 Identifying Analyzer Distortion (O dB atten) 8 Press [AMPTD] > {Attenuation} > 10 > {dB} to increase the RF attenuation to 10 dB. Figure 4-14 Identifying Analyzer Distortion (10 dB atten) The marker readout comes from two sources: •...
- Page 58 Making Measurements Making Distortion Measurements Third-Order Intermodulation Distortion Two-tone, third-order intermodulation (TOI) distortion is a common test in communication systems. When two signals are present in a non-linear system, they may interact and create third-order intermodulation distortion products that are located close to the original signals.
- Page 59 Making Measurements Making Distortion Measurements After the performance of the source/analyzer combination has been verified, the DUT (device under test, for example, an amplifier) would be inserted between the directional coupler output and the analyzer input. The coupler used should have a high isolation between the NO TE two input ports to limit the sources intermodulation.
- Page 60 Making Measurements Making Distortion Measurements • Press [MARKER] > {Peak Search} > {Next Left (Right) PK} 8 Measure the other distortion product: • Press [MARKER] > {Normal} • Press [MARKER] > {Peak Search} > {Next Left (Right) Peak} 9 Measure the difference between this test signal and the second distortion product.
-
Page 61: Making A Stimulus Response Transmission Measurement
Making Measurements Making a Stimulus Response Transmission Measurement Making a Stimulus Response Transmission Measurement The procedure below describes how to use a built-in tracking generator to measure the rejection of a low pass filter, a type of transmission measurement. 1 To measure the rejection of a low pass filter, connect the equipment as shown below. - Page 62 Making Measurements Making a Stimulus Response Transmission Measurement 5 Press [BW/SWP] > {Sweep Time (Auto)} to put the sweep time into stimulus response auto coupled mode. 6 Increase measurement sensitivity and smooth the noise: Press [BW/SWP] > {RBW} > 30 > {kHz} Press [BW/SWP] >...
-
Page 63: Measuring Stop Band Attenuation Of A Low-Pass Filter
Making Measurements Measuring Stop Band Attenuation of a Low-pass Filter Measuring Stop Band Attenuation of a Low-pass Filter When measuring filter characteristics, it is useful to look at the stimulus response over a wide frequency range. Setting the analyzer x-axis (frequency) to display logarithmically provides this function. - Page 64 Making Measurements Measuring Stop Band Attenuation of a Low-pass Filter 8 Reconnect the DUT to the analyzer. Note that the units of the reference level have changed to dB, indicating that this is now a relative measurement. 9 To change the normalized reference position: Press [MEAS] >...
-
Page 65: Making A Reflection Calibration Measurement
Making Measurements Making a Reflection Calibration Measurement Making a Reflection Calibration Measurement The following procedure makes a reflection measurement using a coupler or directional bridge to measure the return loss of a filter. This example uses a 370 MHz low-pass filter as the DUT. The calibration standard for reflection measurements is usually a short circuit connected at the reference plane (the point at which the DUT is connected). - Page 66 Making Measurements Making a Reflection Calibration Measurement 2 Connect the tracking generator output of the analyzer to the directional bridge or coupler. 3 Connect the analyzer input to the coupled port of the directional bridge or coupler. 4 Press [Preset] to perform a factory preset. 5 Turn on the tracking generator and if necessary, set the output power to –10 dBm: Press [MODE] >...
- Page 67 Making Measurements Making a Reflection Calibration Measurement Figure 4-20 Short Circuit Normalized...
-
Page 68: Measuring Return Loss Using The Reflection Calibration Routine
Making Measurements Measuring Return Loss Using the Reflection Calibration Routine Measuring Return Loss Using the Reflection Calibration Routine This procedure uses the reflection calibration routine in "Making a Reflection Calibration the previous procedure Measurement" on page 45, to calculate the return loss of the 370 MHz low-pass filter. -
Page 69: Making An Average Power Measurement
Making Measurements Making an Average Power Measurement Making an Average Power Measurement Average power measurements provide a key metric in transmitter performance. Base station transmit power must be set accurately to achieve optimal coverage in wireless networks. If the transmit power is set too high due to inaccurate power measurements, undesired interference can occur. - Page 70 Making Measurements Making an Average Power Measurement best accuracy, users are recommended to perform external zeroing for input signals below -30 dBm for best accuracy. If you suspect other signals may be present, it is NO TE recommended that you turn off all the other channels and measure average power only on the signal of interest.
- Page 71 Making Measurements Making an Average Power Measurement To Make a Basic Average Power Measurement You can follow the steps below to make a basic average power measurement. 1 Press [Preset] to perform a factory preset. 2 Press [MODE] > {Power Meter} > [ENTER] to turn on the power meter.
- Page 72 Making Measurements Making an Average Power Measurement Setting Power Meter Resolution You can choose from four levels of Power Meter resolution. Higher resolutions provide more accuracy but slow the measurement speed. 1 Press [Preset] to perform a factory preset. 2 Press [MODE] > {Power Meter} > [ENTER] to turn on the power meter.
- Page 73 Making Measurements Making an Average Power Measurement Setting the Power Meter’s Upper and Lower Limits The internal Power Meter can be configured to detect when a measurement has failed a user predefined upper and lower limits. 1 Press [Preset] to perform a factory preset. 2 Press [MODE] >...
-
Page 74: Spectrogram
Making Measurements Spectrogram Spectrogram The scrolling three-dimensional display is noted for its ability to track the frequency and power behavior over the time, particularly intermittent signals. The user can use spectrogram to analyze the stability of a signal over the time, or to identify intermittent interference signals in communications systems. - Page 75 When in spectrogram auto save process, the measurement NO TE will be paused up to more than 10 seconds. Limit lines with pass/fail functionality is available in this measurement. The N9340B will identify the failed frame of spectrogram data with a red mark.
- Page 76 The max update rate of spectrogram monitoring function in NO TE N9340B PC software is slower than N9340B. If display mode is set to “Spectrg&Trace”, the max update rate is 1.5 updates/second. If display mode is set to “trace”, the update rate is increased to 2 updates/second.
-
Page 77: Demodulating An Fm Signal
Making Measurements Demodulating an FM Signal Demodulating an FM Signal This section demonstrates how to demodulate and listen to an FM signal using the built-in FM demodulator. Using the built in FM demodulator you can tune to an FM signal and view the results of the detector output as displayed in the time-domain. - Page 78 Making Measurements Demodulating an FM Signal RBW =((2 x Frequency Deviation)+(2 x Modulation Rate)) In our case the RBW should be: (2 x 10 kHz) + (2 x 1 kHz) = 22 kHz With 1-3-10 sequence RBW selec- tions, choose the next highest RBW of 30 kHz: Press [BW/SWP] >...
-
Page 79: Analysis The Demodulated Signals
Making Measurements Analysis the Demodulated Signals Analysis the Demodulated Signals The N9340B provides the optional AM/FM (Option AMA) and ASK/FSK (Option-DMA) demodulation analysis function for analysis the demodulated signals. These functions can be activated by license key. AM/FM Demodulation Analysis... - Page 80 Making Measurements Analysis the Demodulated Signals 5 Press {Y Scale} > {Auto Scale} > {Return} to set the Y scale. 6 Set the AM depth limit and turn on the limit function: Press {More 1 of 3} > {Limits} > {AM Depth UP} > [51] >...
- Page 81 Making Measurements Analysis the Demodulated Signals Press {More 1 of 3} > {More 2 of 3} > {Attenuation Auto} > {More 3 of 3} 5 Press {Y Scale} > {Auto Scale} > {Return} to set the Y scale. 6 Set the FM deviation limit and turn on the limit function: Press {More 1 of 3} >...
-
Page 82: Ask/Fsk Demodulation Analysis
Making Measurements ASK/FSK Demodulation Analysis ASK/FSK Demodulation Analysis The ASK/FSK demodulation analysis function supports four display modes: • Symbol • Waveform • ASK/FSK Error • Eye Diagram. User definable limits provide Pass/Fail indicators of four types: • Maximum carrier power •... - Page 83 Making Measurements ASK/FSK Demodulation Analysis 4 Press {Symbol Rate} > [10] > {MHz} to set the symbol rate. 5 Press {Filter Setup} > {Ref Filter} > {Nyquist} > {Return} to set the filter type. 6 Set the attenuation state to Auto (default): Press {More 1 of 3} >...
- Page 84 Making Measurements ASK/FSK Demodulation Analysis FSK Demodulation Analysis Please refer to the procedures below to analysis the ASK demodulation. 1 Connect the signal generator to RF IN connector and turn on the signal generator’s FSK and RF output. 2 Turn on the ASK demodulation analysis function. Press [MODE], Rotating the knob to highlight Demod- ulation Analysis, [ENTER], {FSK}.
-
Page 85: Monitoring The Adsl Signal With Option Xdm
The xDSL Measurement mode(Option XDM) provides the capability to measure the ADSL, ADSL2+ and VDSL network with a frequency range of 3 kHz to 40 MHz. An xDSL probe from Vierling is required to connect the N9340B NO TE analyzer to xDSL networks in the field. - Page 86 3 Press [AMPTD] > {More} > {Grid Scale On} 4 Connect the N9340B and ADSL network with a probe. 5 Insert a USB stick into N9340B 6 Set the start frequency as 3 kHz and stop frequency as 2 MHz.
-
Page 87: Key Reference
Key Reference Key Reference This Chapter provides descriptions of the Instrument hardkeys and softkey menu functionality, key access to softkey sub-menus, and instrument parameter control options. The additional reference information is provided in “Menu Map” on page 149... -
Page 88: Amplitude
Key Reference Amplitude Amplitude Key access: [AMPTD] Activates the reference level function and access the associated softkeys to set functions that affect the way data on the vertical axis is displayed or corrected. Ref level Key access: [AMPTD] > {Ref level} Activates the reference level function. - Page 89 Key Reference Amplitude Preamp Key access: [AMPTD] > {Preamp} Toggles the internal preamp between On and Off. Preamp results in a correction being applied to compensate for the gain of the preamp at 20 dBm so that amplitude readings show the actual value at the input connector.
- Page 90 Key Reference Amplitude HiSensitivity Key access: [AMPTD] > {HiSensitivity} Press this softkey On to set 0 dB attenuation, -50 dBm reference level and turn the pre-amplifier on. It’s very helpful to observe the low-level signals with this settings. Ref Offset Key access: [AMPTD] >...
- Page 91 Key Reference Amplitude EMF Mode Key access: [AMPTD] > {More} EMF mode is available when the Y Axis Unit is dBmV, dBV or V. This mode is used to measure the port voltage in open circuit. Grid Scale Key access: [AMPTD] > {More} Press this softkey to turn on the amplitude scale unit display on the left of the graticule.
-
Page 92: Bw/Swp
Key Reference BW/SWP BW/SWP Activates the bandwidth function and accesses the associated softkeys to control resolution bandwidth, video bandwidth and sweep time. Key access: [BW/SWP] > {RBW} Changes the 3 dB resolution bandwidth on the analyzer from 30 Hz to 1 MHz in a 1, 3, 10 sequence using the knob, step keys or the numeric keypad. - Page 93 Key Reference BW/SWP VBW/RBW Key access: [BW/SWP] > {VBW/RBW} Selects the ratio between the video and resolution bandwidths. If signal responses near the noise level are visually masked by the noise, the ratio can be set to less than 1 to lower the noise.
- Page 94 With average type set to Voltage, “VAvg” appears on the left side of the display. There are actually four types of averaging processes within an N9340B. All, except VBW filtering, are affected by this setting. They are listed as follows: • Trace averaging Averages signal amplitudes on a trace-to-trace basis.
- Page 95 Key Reference BW/SWP Sweep Time Key access: [BW/SWP] > {Sweep Time} Selects the sweep time for the analyzer to tune across the displayed frequency span (or, in zero span, the time the analyzer take to sweep the full screen).Inputs may be made using the knob, the arrow keys, or numeric keypad.
- Page 96 Default) or turning the power on, sets the sweep mode to continuous sweep as default. Sweep Mode Key access: [BW/SWP] > {Sweep} > {Sweep Mode} An N9340B provides two sweep modes to meet different sweep time requirements: • Normal Activates the default sweep mode.
- Page 97 TDD signal. For example, one time frame for GSM signal is 4.616ms, then the sweep time can be set no less than 4.616ms*461 (points of one trace of N9340B) to measure the signal. Single Sweep Key access: [BW/SWP] >...
-
Page 98: Enter
Key Reference Enter Enter Hardkey function: • Terminates data entry and enters into the analyzer numerical values keyed from numeric keypad on the front panel. • Terminate filename entries. ESC/CLR This hardkey provides mainly two types of functions: Clear • Clears any numeric entry and cancels the active function. -
Page 99: Frequency
Key Reference Frequency Frequency Activates the center frequency function, and accesses the menu of frequency functions. The center frequency, or start and stop frequency values appear below the graticule on the display. When changing both the center frequency and the span, change NO TE the frequency first since the span can be limited by the frequency value. - Page 100 Key Reference Frequency CF Step Key access: [FREQ] > {CF Step} Changes the step size for the center frequency function. Once a step size has been selected and the center frequency function is activated, the arrow keys change the center frequency by the step-size value. The step size function is useful for finding harmonics and sidebands beyond the current frequency span of the analyzer.
-
Page 101: Marker
Key Reference Marker Marker Accesses the marker control softkeys to select the type and number of markers. Markers are diamond-shaped characters that identify points of traces. Up to six pairs of markers may appear on the display simultaneously; only one pair can be controlled at a time. The marker that is controlled is called the “active”... - Page 102 Key Reference Marker Delta Key access: [MARKER] > {Delta} Activates a second marker at the position of the first marker. (If no marker is present, two markers appear at the center of the display). The amplitude and frequency (or time) of the first marker is fixed. The marker number is indicated above the delta marker, and the same number is indicated with an R (for example, 1R) above the reference marker.
- Page 103 Key Reference Marker Peak Search Place a marker on the highest peak based on the setting of the Search Criteria as follows: • Peak Key access: [MARKER] > {Peak Search} Place a marker on the highest peak. • Next Left Peak Key access: [MARKER] >...
- Page 104 Key Reference Marker Marker To Accesses the following marker function menu keys: • To Center Key access: [MARKER] > {To Center} Sets the center frequency of the analyzer to the marker frequency. In Delta mode, pressing [Marker] > {Marker To} > {To Center} sets the center frequency to the marker delta value.
- Page 105 Key Reference Marker Frequency counter is properly effective only on CW signals or NO TE discrete peaks. For a valid reading, the marker must be greater than 25 dB above the noise. Freq Count function is not supported under Marker Delta condition. Noise mode operates only on noise peaks and not supported NO TE under Marker Delta condition.
-
Page 106: Meas
Key Reference MEAS MEAS In spectrum analysis mode, pressing [MEAS] brings up the menu for a suite of power measurements such as adjacent channel power, occupied bandwidth, and channel power. Occupied Bandwidth (OBW) integrates the power of the spectrum in the displayed green frame. The measurement defaults to 99% of the occupied bandwidth power. - Page 107 Key Reference MEAS ACPR The adjacent channel power ratio (ACPR) measures the power ratio between the main channel power and the adjacent channel power. ACPR measures the total power (RMS voltage) in the specified channel. The measurement result reports the ratios of the two adjacent channel powers to the main channel power.
- Page 108 Key Reference MEAS Channel Power Channel power function measures the power and power spectral density in the channel bandwidth specified. One pair of vertical lines of the displayed green frame indicates the edges of the channel bandwidth. The center frequency, reference level, and channel bandwidth must be set by the user.
- Page 109 Key Reference MEAS Spectrum Emission Mask (SEM) Spectrum Emission Mask measurement includes the in-band and out-of-band spurious emissions. As it applies to W-CDMA (3GPP), this is the power contained in a specified frequency bandwidth at certain offsets relative to the total carrier power. It may also be expressed as a ratio of power spectral densities between the carrier and the specified offset frequency band.
- Page 110 Key Reference MEAS • Chan Span Key access: [MEAS] > {SEM} > {Ref Channel} Specifies the span used in measuring the power in the main channel. • Sweep Time Key access: [MEAS] > {SEM} > {Ref Channel} Specifies the sweep time used in measuring the power in the main channel.
- Page 111 Key Reference MEAS Table 2 Offsets & Limits Defaulted for W-CDMA (3GPP) Mobile Station Measurements Offset Start Stop Meas Freq Freq Start Stop Couple Start Stop (MHz) (MHz) (kHz) (dBm) (dBm) (dBc) (dBc) A. On 2.515 3.485 30.00 -71.07 -71.07 -35.23 -49.78 B.
- Page 112 Key Reference MEAS Offset Key access: [MEAS] > {SEM} > {Offset/Limits} Selects the offset pairs (upper and lower) that the softkeys affect, and displays the memory selection menu from A to E (where you can store up to 5 sets of values for Start Freq, Stop Freq, Sweep Time, Res BW, Meas BW, Abs Start, Abs Stop, and so forth).
- Page 113 Key Reference MEAS Specifies the resolution bandwidth used in measuring the offset pair. When set to Auto, the Res BW from the "Offset/Limits" on page 46 default tables for are used. When set to Man, the allowed range is 1 kHz to 1MHz. Abs StartAmpt Key access: [MEAS] >...
- Page 114 Key Reference MEAS Meas BW Key access: [MEAS] > {SEM} > {Offset/Limits} > {More} > {More} Specifies the bandwidth to use when measuring the offset. When using the front panel, only the currently selected offset is affected. All the offsets are affected when remote control.
- Page 115 Key Reference MEAS Spectrogram Spectrogram Run/Pause Key access: [MEAS] > {Spectrogram} > {Spectrogram} Toggles the spectrogram monitoring between Run and Pause. Restart Meas Key access: [MEAS] > {Spectrogram} > {Restart Meas} Resets the spectrogram display. Update Interval Key access: [MEAS] > {Spectrogram} > {Update Int.} Enables you to set the interval of time to update data to 1 or more seconds.
- Page 116 Key access: [MEAS]> {Spectrogram} > {Save&Load} > {Time Setting} This submenu allows you to configure automatic time save function. You can set start date, time, stop date, time in this menu. Press {Timed Save On}, the N9340B will start the auto-saving function from the Start Time.
- Page 117 Key Reference MEAS File Setup Key access: [MEAS]> {Spectrogram} > {Save&Load} > {File Setup} This submenu allows you to set the File Type, File name, File Path, and File Size (100-1500 frames). Save RAM Key access: [MEAS]> {Spectrogram} > {Save&Load} > {Save RAM} Press this key to save the current spectrogram measurement data into a file with default name.
-
Page 118: Mode
Key Reference MODE MODE Activates the softkey menus to select the measurement mode of your analyzer. The measurement modes are: • Spectrum Analyzer • Tracking Generator • Power Meter • Demodulation Analysis (Option) • IBOC Measurement (Option) (In-Band On-Channel) • xDSL Measurement (Option) Spectrum Analyzer Key access: [MODE] >... - Page 119 Therefore, exercise caution when connecting a power-level sensitive device to the tracking generator output. When Amplitude (Off) is selected, the output attenuation on the NO TE N9340B is set to the maximum attenuation. Amptd Step Key access: [MODE] > {Tracking Generator } > { Amptd Step} Allows you to set the step size of the power level range of the tracking generator.
- Page 120 Key Reference MODE Normalize Key access: [MODE]>{Tracking Generator } > {Normalize} • Store Ref (1 → 4) Copies trace 1 into trace 4. Store Ref (1 → 4) must be pressed before pressing Normalize (On). If Normalize (On) is pressed before Store Ref (1 → 4), the error message: Store reference trace before turning on Normalize (On) is displayed in the status line, however Normalize has been activate.
- Page 121 Key Reference MODE trace can now be moved to a different position on the display by changing the normalized reference position. This may be useful if the device to be tested has positive gain, such as an amplifier. Now replace the thru line with the device under test, and an accurate measurement of the gain or loss can be made.
- Page 122 Key Reference MODE • Zero Type Toggles the zeroing type of the Power Sensor between internal and external. When this type is set to EXT, pressing Zeroing will bring up a message which indicates the external signal need be pulled out.
- Page 123 Key Reference MODE • Resolution Access the associated Resolution submenu. When the measurement suffix is W or %, this parame- ter represents the number of significant digits. When the measurement suffix is dB or dBm, 1 through 4 represents 1, 0.1, 0.01, and 0.001 dB respectively. The default value is 3.
- Page 124 Key Reference MODE Meas Setup Key access: [MODE] > {Power Meter} > {Meas Setup} Accesses the Meas Disp submenu which is used to configure the mesurement settings. • Freq Sets a frequency between 1 kHz and 90.0 GHz using the numeric keypad, arrow key or knob. If the frequency does not correspond directly to a frequency in the sensor calibration table, the power sensor calculates the calibration factor using linear...
- Page 125 Key Reference MODE • Lower Limit Sets the lower test limit value for the current mea- surement. The units used are dependent on the cur- rent setting of power unit. When the measured power is less than the value specified, a failure will be reported.
- Page 126 Key Reference MODE the difference between the two averages is greater than 12.5%, the digital filter is cleared. The filter will then start storing new measurement data. This feature shortens the filter time required when the input power changes substantially. Note that the result appears to settle faster, although true settling to the final value is unaffected.
- Page 127 Key Reference MODE Range: 530 - 1700 kHz for AM band; 87.9 - 107.9 MHz for FM band. Quick Span Key access: [MODE] > {IBOC Measurement} > {AM}/{FM} > {Quick Span} Press this softkey to quick set the frequency span with the below configurations: •...
- Page 128 Key Reference MODE Mask Fuction Key access: [MODE] > {IBOC Measurement} > {AM}/{FM} > {Mask Function} Accesses the submenu to configure the mask related settings. • Mask Type There are two types of mask in spectrum mask measurement for IBOC standard: FCC spectral emission mask and NRSC spectral emission limits.
- Page 129 Key Reference MODE The mak types for IBOC-FM are listed as below: • FCC (FM-73.317) • NRSC-5-B Hybrid • NRSC-5-B Hybrid Figure 5-2 IBOC (FM) spectral emission mask and limits IBOC (FM) spectral emission mask and limits -100 -110 -600 -400 -200 Offset from carrier frequency (kHz)
- Page 130 Key Reference MODE • Noise Cancel This function is used to reduce the noise level for any possible small signals. It is only available in FM IBOC submenu, when Mask Type is set to NRSC-5-B <Hybird>. Channel Key access: [MODE] > {IBOC Measurement} > {AM}/{FM} >...
- Page 131 Key Reference MODE Tune Range Key access: [MODE] > {IBOC Measurement} > {AM}/{FM} > {Tune Range} Toggles Tune Range between Band and Span. When it is set to Band, auto tune is available in whole AM/FM band frequency range. When it is set to Span, Auto tune is available in current span frequency range.
- Page 132 Key Reference MODE Spec View Key access: [MEAS] > {xDSL Measurement} > {Spec View} Enables you to view the details in the captured spectrogram. when the Spectrogram is running, Pressing {Spec View}will pause the running spectrogram. Press {Home}/{End} to view the first /last spectrogram in cache.
- Page 133 {Time Setting} This submenu allows you to configure automatic time save function. You can set start date, time, stop date, time in this menu. Press {Timed Save On}, the N9340B will start the auto-saving function from the Start Time. File Setup Key access: [MEAS]>...
-
Page 134: Span
Key Reference SPAN SPAN This hardkey accesses the softkey submenu of span functions. Pressing [SPAN] allows you to change the frequency range. The frequency-span readout describes the total displayed frequency range. To determine frequency span per horizontal graticule division (when in linear frequency scale type), divide the frequency span by 10. -
Page 135: Delay Time
Key Reference SPAN Key access: [SPAN] > {Demod} > {AM} Pressing {AM ON} activates the AM demodulation and turns off FM demodulation (if it is on). Key access: [SPAN] > {Demod} > {FM} Pressing {FM ON} activates the FM demodulation and turns off AM demodulation (if it is on). - Page 136 Key Reference SPAN When AM or FM demod is enabled, the instrument will tune to the marker frequency and wait for the Demod to take place. Delay Time is not available unless AM or FM demod is selected, and span is >0 Hz. For long demodulation times, pressing Preset when Preset Type is set to DFT will abort the Demod function.
- Page 137 Key Reference SPAN Ext Rise Key access: [SPAN] > {Trigger} > {Ext Rise} Activates the trigger condition that will start a sweep when the external voltage (connected to EXT TRG IN on the rear panel) passes through approximately 2 volts. The external trigger signal must be a 0 V to +5 V TTL signal.
-
Page 138: Trace
Key Reference TRACE TRACE Accesses the trace keys to store and manipulate trace information. Each trace comprises a series of data points in which amplitude information is stored. The analyzer updates the data for any active trace with each successive sweep. Trace Key access: [TRACE] >... - Page 139 Key Reference TRACE Minimum Hold Key access: [TRACE] > {Min Hold} Maintains the minimum level for each trace point of the selected trace, and updates each trace point if a new minimum level is detected in successive sweeps. Changing the vertical scale (Amplitude, Scale Type, Log or Line), NO TE or pressing PRESET, or turning averaging on (TRACE, Average (On) or switching widow in Zone Span restarts the held trace.
- Page 140 Key Reference TRACE collected, the “bucket”. Thus a trace is more than a series of single points. It is actually a series of trace “buckets”. The data may be sampled many times within each bucket. • Normal Selects the maximum and minimum video signal values alternately.
- Page 141 Key Reference TRACE Average Key access: [TRACE] > {More} > {Average} Initiates a digital averaging routine that averages the trace points in a number of successive sweeps resulting in trace “smoothing”. Increasing the average number will further smooth the trace. For the information of the type "Avg Type"...
- Page 142 Key Reference TRACE Save As Key access: [TRACE] > {More} > {Save as} Saves a current trace to a file/directory, with a user-defined filename. The filename is entered using the numeric keypad and terminated by pressing [ENTER]. Numbers, alpha characters and underline are all valid components of a filename.
-
Page 143: Limit
Key Reference LIMIT LIMIT Limit Line Key access: [Limit] > {Limit Line} Activates an adjustable horizontal line that is used as a visual reference line. The limit line, used for trace arithmetic, has amplitude values that correspond to its vertical position when compared to the reference level. - Page 144 Key Reference LIMIT Limit Type Key access: [Limit] > {Limit Type} Defines the limit you are editing as either an upper or lower limit. An upper limit fails if trace 1 exceeds the limit. A lower limit fails if trace 1 falls below the limit. Beep Key access: [Limit] >...
-
Page 145: Error Messages
Error Messages Error Messages This chapter contains Error Message information and definitions used by the analyzer. - Page 146 Error Messages Overview Overview If an improper operation occurs during the instrument configuration, a message will appear on the status line indicating the incident and the how the spectrum analyzer corrected the setting automatically. press [SYS] > {More} > {Show errors} to read the specific descriptions of those messages.
-
Page 147: Error Message List
Error Messages Error Message List Error Message List Please refer to the error messages list table as below to find the corresponding message description: Error Error Message Description Code No error Indicates that a condition causing an –410 Query INTERRUPTED INTERRUPTED query occurred (see IEEE 488.2, 6.3.2.7) Indicates the SCPI remote interface error... - Page 148 Error Messages Error Message List Error Error Message Description Code Indicates the character data contained –144 Character data too long more than 12 characters. (see IEEE 488.2, 7.7.1.4) Indicates a failure occurred while saving a Unable to save file file. The file was not saved. Indicates a failure occurred while loading a Unable to load file...
- Page 149 Error Messages Error Message List Error Error Message Description Code Indicates the first mixer in danger. Either Mixer overload increase input attenuation or decrease the input signal level. Indicates you need to either increase the Mixer saturate input attenuation or decrease the input signal level.
- Page 150 Error Messages Error Message List...
-
Page 151: 7 Troubleshooting
Troubleshooting Troubleshooting This chapter includes information on how to check for a problem with your Keysight Technologies spectrum analyzer, and how to return it for service. If you experience a problem or would like additional information about your analyzer, Keysight Technologies’... -
Page 152: Check The Basics
WA RN ING qualified personnel. To prevent electrical shock, do not remove covers. • Before calling Keysight Technologies, or returning an analyzer for service, perform the quick checks listed below. This check may eliminate the problem. • Is there power at the receptacle? •... -
Page 153: Warranty And Service Options
Besides, we offers several optional maintenance plans to service your analyzer after the warranty has expired: R-51B-001-3C extends this service to 3 years. R-50C-011-3 Keysight calibration upfront support plan, 3-year coverage. The calibration cycle of N9340B Handheld spectrum analyzer is one year. -
Page 154: Contact Keysight Technologies
Troubleshooting Contact Keysight Technologies Contact Keysight Technologies... - Page 155 Menu Map Menu Map This chapter contains menu maps that visually present the menus and submenus that are accessed by pressing the hardkeys and softkey menu selections in the instrument. This is a quick reference guide for the experienced user.
- Page 156 Menu Map AMPTD AMPTD AMPTD Ref level Attenuation Auto Preamp Scale/DIV > 1 dB/DIV 2 dB/DIV Scale Type 5 dB/DIV HiSensitivity 10 dB/DIV More Ref Offset Y Axis Unit dBmV EMF Mode dBuV Grid Scale PSD Mode...
- Page 157 Menu Map AMPTD...
- Page 158 Menu Map BW/SWP BW/SWP BW/SWP Auto Auto VBW/RBW Auto Avg Type Log Pwr Power Sweep Time Auto Voltage Sweep Single Sweep Sweep Single Cont Sweep Mode Normal Fast TD Mode...
- Page 159 Menu Map FREQ FREQ Freq Center Freq Start Freq Stop Freq CF Step Auto Standard Channel STD> Load STD > STD Type Freq Offset <Chan name> System User Channel Load Now Channel Step Copy Delete...
- Page 160 Menu Map MARKER MARKER Marker Marker Peak 1 2 3 4 5 6 Next Left PK Normal Next Right PK 6 Peaks Search Delta Peak Search > Marker To > To Center To Ref More 1 of 2 Mode > Normal Freq Count Marker Trace...
- Page 161 Menu Map MEAS MEAS Center Freq MEAS Int BW Channel BW Measure Off Center Freq Channel Power Main Channel ACPR Adj Channel Channel Space Method Spectrogram Spectrogram Percent dBc Run Pause Restart Meas Update Int. More Spectrg View Avg Number Palette Meas Type Color...
- Page 162 Menu Map MODE - IBOC Measurement MODE - IBOC Measurement MODE IBOC Measur ement Center Freq AM > Mask Span Mask Span <val ue> FM > Quick Span > F M Band AM Band AM Channel FM Channel Mask Function > <Analog >...
- Page 163 Menu Map MODE - Tracking Generator MODE - Tracking Generator MODE Spectrum Analyzer Power Meter Tracking Amplitude Generaotr Source Amptd Step Demodulation Amptd Offset Analysis Store Ref IBOC Normalize Measurement 1->4 Normalize xDSL Measurement Off On Norm Ref Lvl Norm Ref Posn Ref Trace...
- Page 164 Menu Map MODE - Power Meter MODE - Power Meter M ODE Zero ing Zero Type Power Meter Zeroing Disp Ran ge Meas Disp Resolution 1 2 3 4 Meas Setup Disp Mode Auto Range M eter Chart Preset Range Ch art View Lower Upper Con tinu e...
- Page 165 Menu Map MODE - Demodulation Analysis (AM/FM) MODE - Demodulation Analysis (AM/FM) MO DE Demodula tion Ana lysis C arrie r Freq Auto S cal e Pe ak+ O ff Pea k- IF BW Re f Va lue Ref P osi ti on Pe ak+ -/2 EqLP F L eft...
- Page 166 Menu Map MODE - Demodulation Analysis (ASK/FSK) MODE - Demodulation Analysis (ASK/FSK) MO DE Demodula tion Ana lysis Auto S cal e Symbol Mea s F ilter Ca rrier Freq O ff W aveform Ref Fil ter Sy mbol R ate Re f Va lue Ref P osi ti on ASK/F SK Error...
- Page 167 Menu Map MODE - xDSL MODE - xDSL MODE xDSL Home Play Measurement Page Up Stop Spectrogram Direction Pause Page Down Down Up Restart Meas Update Int. Off On Update Int. Off On Playback Spectrg View Spctrg Palette Color Gray Trace Disp Mode Spctrg &...
- Page 168 Menu Map SPAN SPAN SPAN Span Full Span Speaker Vol Zero Span Delay Time Last Span Demod *Trigger Free Run Video Ext Rise Ext Fall Trig Delay *The trigger menu is available when span is set to zero span.
- Page 169 Menu Map View Trace File Type Local USB Save Path State Local USB Copy Screen Shortcut Type Delete Trace Screen Brightness Save Limit Time/Date File > Setup Load Now Color Mode File Setup Setting > Backlight Power Manager Language> General Screen Save Power On Language...
- Page 170 Menu Map TRACE TRACE TRACE Trace 1 2 3 4 Clear Write Max Hold Min Hold Normal Average View Pos Peak Blank Sample Neg Peak More 1 of 2 Detector Auto Average Avg Restart Save Trace Save As Recall Trace More 2 of 2...
- Page 171 Menu Map Limit Limit Limit Line LIMIT Limit Edit Limits Limits Points Limits Table Limit Type Upper Lower Limits Offset Beep Limit Limit Fixed Rel Save Limits X Axis Unit Freq Time Load Limits Limit System User Load Now Copy Delete...
- Page 172 This information is subject to change without notice. © Keysight Technologies 2008-2015 Edition 3, December 2015...
Need help?
Do you have a question about the N9340B and is the answer not in the manual?
Questions and answers