
Related Manuals for BIRD Digital Power Meter Display


Summary of Contents for BIRD Digital Power Meter Display
- Page 1 Digital Power Meter Display Operation Manual ©Copyright 2021 by Bird Technologies Instruction Manual Part Number 920-5000-NG Rev. C...
-
Page 2: Safety Precautions
Safety Precautions The following are general safety precautions that are not necessarily related to any specific part or procedure, and do not necessarily appear elsewhere in this publication. These precautions must be thoroughly understood and apply to all phases of operation and maintenance. WARNING Keep Away From Live Circuits Operating Personnel must at all times observe general safety precautions. -
Page 3: Safety Symbols
Safety Precautions Safety Symbols WARNING Warning notes call attention to a procedure, which if not correctly performed, could result in personal injury. CAUTION Caution notes call attention to a procedure, which if not correctly performed, could result in damage to the instrument. The caution symbol appears on the equipment indicating there is important information in the instruction manual regarding that particular area. -
Page 4: Safety Statements
Digital Power Meter Display, 5000-NG Safety Statements USAGE ANY USE OF THIS INSTRUMENT IN A MANNER NOT SPECIFIED BY THE MANUFACTURER MAY IMPAIR THE INSTRUMENT’S SAFETY PROTECTION. EL USO DE ESTE INSTRUMENTO DE MANERA NO ESPECIFICADA POR EL FABRICANTE, PUEDE ANULAR LA PROTECCIÓN DE SEGURIDAD DEL INSTRUMENTO. -
Page 5: About This Manual
NG as well as a list of compatible Bird power sensors. Operation — This chapter includes details on charging the units battery, and procedures for RF connections to a Bird power sensor as well as making a data connection between the 5000-NG and a Bird power sensor. User Interface —... - Page 6 Digital Power Meter Display, 5000-NG...
-
Page 7: Table Of Contents
Table of Contents Safety Precautions ......... i Safety Symbols . - Page 8 Digital Power Meter, 5000-NG Chapter 3 User Interface ........11 RF Power Meter Software User Interface .
- Page 9 Table of Contents Measurement procedure ........52 5014 Sensor Element Types .
-
Page 10: Chapter 1 Introduction
Chapter 1 Introduction The Digital Power Meter Display, 5000-NG is a hand held device designed for use with many of Bird’s Power Sensors to measure RF power in a variety of systems. Figure 1 Digital Power Meter Display, 5000-NG Measuring RF Power The 5000-NG utilizes the RF Power Meter Software. -
Page 11: Items Supplied
Introduction Items Supplied The Digital Power Meter Display, 5000-NG includes the equipment in the following table. Description Part Number Digital Power Meter 5000-NG Charger, US, 5V, 2.5A 5B5002-2 International Charger, 5V, 2.5A 5B5002-1 USB Micro charging cable 5A2653-3R5NL4 Model 5000-NG Soft Carry Case... -
Page 12: Controls And Connectors
Digital Power Meter Display, 5000-NG Controls and Connectors Figure 2 5000-NG Controls and Connectors Item Name Description Increases volume when pressed. When this button and power button are pressed Volume Down simultaneously a screenshot is taken of the display. Volume Up Decreases volume when pressed. -
Page 13: Compatible Power Sensors
Wideband Power Sensors (WPS) 5012D, 5016D, 5017D, 5018D, 5019D The Bird Wideband Power Sensor (WPS) is a Thruline sensor that can be used to diagnose RF component integrity. The WPS can be used with the Bird 5000-NG by launching the Bird RF Power Meter Software. -
Page 14: Antenna And Cable Monitor (Acm)
"Broadcast Power Monitor (BPM) Measurements" on page 62 Channel Power Monitor (CPM) The Bird CPM is a multiple-channel power monitoring system that is capable of continuously monitoring power and VSWR performance simultaneously for up to 16 analog / 16 digital channels and is scalable to accommodate any-sized radio system operating between 118 and 940 MHz. -
Page 15: Chapter 2 Operation
1. Carefully inspect shipping container for signs of damage. If the shipping container is damaged, do not unpack the unit. Immediately notify the shipping carrier and Bird Technologies. If the shipping container is not damaged, unpack the unit. Save shipping materials for repackaging. -
Page 16: Rf Line Connection
Digital Power Meter Display, 5000-NG RF Line Connection WARNING Never attempt to connect or disconnect RF equipment from a transmission line while RF power is applied. Leaking RF energy is a potential health hazard. 1. Connect output of the transmitter to the input of the power sensor. -
Page 17: Sensor Data Connection
Figure 3 on page 7 2. Connect USB cable to 5000-NG. Note: The Bird RF Power Meter Software will save all sensor settings (by serial number). Sensor settings will automatically load when the sensor is connected. Settings are saved in a Session File. Session Files are saved in the Session List. -
Page 18: Automatic Wifi Network Connection
2. Tap the menu icon on the RF Meter device selection screen to display the Preferences menu. 3. Tap Network Scan option. 4. Any Bird devices connected to the selected network should be displayed on the device selection screen as Found Devices. Note: Device will be displayed by device name, followed by the IP Address. -
Page 19: Wifi Device Disconnect
Once finished using a WiFi device it is recommended that you disconnect from the device. 1. Tap the 5000-NG back button to display the Bird RF Meter device selection screen. 2. Press on the WiFi sensors's name/IP Address until Disconnect is displayed. -
Page 20: Chapter 3 User Interface
Chapter 3 User Interface The user interface objects discussed in this chapter consists of the RF Power and the Meter Software User Interface 5000-NG Operating System User Interface "RF Power Meter Software User Interface" on page 11 "5000-NG Operating System User Interface" on page 31 RF Power Meter Software User Interface ... -
Page 21: Sensor Displays And Menus
User Interface Sensor Displays and Menus Figure 5 Power Meter Display Item Used to configure the sensor and choose the format Display Controls for displaying measurement data. See "Display Menu Controls Menu" on page 14 Displays the numerical readings available/selected Display Area/ device readings. - Page 22 "Arranging the Readings Menu Order" on page 13 Changing Readings Menu Settings Note: The Bird RF Power Meter Software will save all settings for each sensor (by serial number). Sensor specific settings will automatically load when the sensor is connected. All settings are saved in Session Files.
-
Page 23: Display Controls Menu
User Interface Figure 6 Changing Readings Order Display Controls Menu Figure 7 Display Controls Menu Sensor Configuration Menu Note: Menu options and readings displayed will vary according to the capabilities of the connected sensor. Measurement Type — Choose the Measurement Type by tapping one of the available radio buttons in the menu. - Page 24 Digital Power Meter Display, 5000-NG CCDF Limit — For Wideband Power Sensors: Enter the threshold to be used for CCDF measurement. See CCDF Note: Statistical Power Sensors (7022) have numerous unique configuration settings, for a description of these settings see Statistical Power Sensor Measurements.
- Page 25 User Interface Graph Types Any power measurement on the readings menu may be displayed on a graph. . Graph setup may also be saved so "How to Display a Graph" on page 16 frequently used settings will automatically be selected. Note: Graphs are saved for the mode only.
- Page 26 Digital Power Meter Display, 5000-NG 4. Select the measurement to graph from the drop-down menu. 5. Tap OK. 6. The new graph will be displayed in the Display Controls Menu below Reading Table. 7. Tap the graph's name in the menu to display the graph.
- Page 27 User Interface 2. Tap Graph Unit to display the dialog. 3. Tap the radio button for the desired unit of measure. Graph Scale The graph scale on the Y-axis may be changed by manually entering the minimum and maximum scale values. 1.
- Page 28 Digital Power Meter Display, 5000-NG 3. Tap drop-down list. Select Custom. 4. Tap the first value entry field (maximum) and enter the maximum scale value. 5. Tap the second value entry field (minimum) and enter the minimum scale value. 6. Tap the units drop-down list and select the appropriate value.
- Page 29 User Interface Press the marker data in the marker list until Delete is displayed, then tap Delete. Figure 10 Delete Marker Reset Zoom when tapped, graph will be return to default view and the trace will update as data is collected.
- Page 30 Digital Power Meter Display, 5000-NG Time Graph Controls Any measurement can be displayed in graphical or tabular format. See "How to Display a Graph" on page 16 Note: Graph controls are located in the Sensor Operation Menu . Touching the graph area will stop the trace on the screen, however data will continue to be collected.
- Page 31 User Interface Graph Scale The graph scale on the Y-axis may be changed by manually entering the minimum and maximum scale values. 1. Tap the Sensor Operation Menu . 2. Tap Graph Scale to display the dialog. 3. Tap drop-down list. Select Custom. 4.
-
Page 32: Sensor Operations Menu
Digital Power Meter Display, 5000-NG Sensor Operations Menu Figure 11 Sensor Operation Menu Pause/Resume — The Pause option will stop the updates of measurement readings and graphs. Load Preset — This option allows you to load a preset configuration file, see Session Files for details. -
Page 33: Logging
"Zeroing a Sensor" on page 10 Logging Sensor data can be logged by the Bird RF Power Meter Software. Logging saves all the sensors active readings into a text file. Logging can be started on the Sensor Operations Menu . Logs are saved using the following file naming... - Page 34 Digital Power Meter Display, 5000-NG Log File Definition Section 1: Data Definition, often referred to as an Object. The data logged will vary according to the sensor connected when the log file is created. Section 1 includes: Model, serial number, date and time log was created ...
-
Page 35: Share Readings Via Bluetooth
User Interface Importing Logs into Excel This procedure will display each group of results on one row with each measurement and values grouped by columns. 1. Transfer the log files to a PC. 2. Open an Excel spreadsheet. 3. Select Data Tab. 4. -
Page 36: Preferences Menu
About — Displays copyright information and software source credits. Session Files Session List Definitions Session files are used to initialize the Bird RF Power Meter Software when a Bird Power Sensor is connected. The following definitions describe the different session files. - Page 37 Figure 16 Session List When a power sensor is connected to the Bird RF Meter the first time the Generic Session File (Default Preset if created) is used to initialize the App then a Serial Number Specific Session File is automatically created.
- Page 38 Software a Serial Number Specific Session File is created. You can also save your settings as the default settings for your power sensor type in a Default Preset or Preset. All of these file types can be exported from the Bird RF Power Meter Software for use on other devices.
- Page 39 If you wish to import one or more Session Files onto an Android device you must first copy the files onto the Android device into the Bird RF Meter folder. 1. Transfer the desired Session Files into the following folder on the destination Android device: SDCARD>Bird RF Meter>Sessions...
-
Page 40: 5000-Ng Operating System User Interface
A Camera App is not preinstalled on the 5000-NG, to use the camera the Camera App APK must be manually installed, see "Package File (APK) Installation" on page 41 The 5000NG_Camera.apk is available on the 5000-NG product page on Bird’s website. https://birdrf.com/Products/Sensors/RF-Power-Sensors/Digital-Power- Meter-Display/5000-NG-Digital-Power-Meter-Display.aspx Camera Operation 1. -
Page 41: Memory Expansion
User Interface Memory Expansion There are two options for extending the internal memory of the 5000-NG. There is a MicroSD slot and a USB port. While memory expansion is not required for proper operation of the 5000-NG, it provides a easy way to transfer information off of the power meter. -
Page 42: 5000-Ng Communications Settings
Digital Power Meter Display, 5000-NG 5000-NG Communications Settings The 5000-NG utilizes Wi-Fi to perform functions described in the previous sections and Bluetooth can be used to transfer files from the 5000-NG to a PC. These communications functions may be turned on and off using the 5000-NG’s... -
Page 43: Pairing A Bluetooth Device With The 5000-Ng
User Interface Pairing a Bluetooth Device with the 5000-NG 5000-NG 1. Long press the power button. 2. Tap settings in popup menu. Figure 21 Settings Menu 3. Type password (5000ng) and tap Confirm. 4. Tap Bluetooth icon to open the Bluetooth dialog. 5. - Page 44 Digital Power Meter Display, 5000-NG 3. Type password (5000ng) and tap Confirm. 4. Tap Wi-Fi icon to open the Wi-Fi dialog. 5. If Wi-Fi is off, tap the toggle to turn on. Note: A list of Wi-Fi networks will be listed on the Wi-Fi dialog.
-
Page 45: Chapter 4 File Transfers And Updates
5. Type the password (5000ng) and tap yes. 6. Navigate to the location of the file. See Figure 23 Example: Internal Memory > Bird RF Meter > Logs Figure 23 Media Selection Note: Log files must be renamed because they contain colons (:). Files containing certain special characters must be renamed. - Page 46 Digital Power Meter Display, 5000-NG b. Tap rename in the pop-up menu. Delete or replace special characters in the file name, or type a new file name. d. Tap OK to finish. 8. If transferring multiple files: Tap Multi in the header. See Figure 24 b.
-
Page 47: Transfer Files From The 5000-Ng To A Pc Via Usb Cable
3. Files may be copied directly to or from the 5000-NG’s internal storage and connected a USB Drive or MicroSD card to the PC. Note: Log files and session logs generated by the Bird RF Power Meter Software are stored in the 5000-NG Internal storage in a folder titled Bird RF Meter. - Page 48 6. Type the password (5000ng) and tap yes. 7. Navigate to the location of the file. See Figure 23 Example: Internal Memory > Bird RF Meter > Logs Figure 27 Media Selection Note: Log files must be renamed because they contain colons (:). Files containing certain special characters must be renamed.
- Page 49 File Transfers and Updates Figure 28 Multiple File Selection 10. If transferring just one file: Long press the file name. b. Tap Send. 11. Tap the Bluetooth option in the Send Menu. 12. Tap the PC name in the Bluetooth Device Selection screen. See Figure 29 Figure 29 Bluetooth Device selection...
-
Page 50: Package File (Apk) Installation
Package files (APK) are the format used to install apps on the 5000-NG. The RF Power Meter Software (and other applications provided by Bird) may be updated and made available on the 5000-NG product page on Bird’s Website (birdrf.com). To install an APK follow these steps: 1. - Page 51 File Transfers and Updates Note: The Bird apps are not on the Google Play Store®, Installing Apps from Unknown Sources must be enabled to allow the Bird APK to be installed. 11. Scroll down to Unknown sources and tap the switch to enable.
-
Page 52: Chapter 5 Measurements
This chapter describes the measurements available from compatible sensors. section contains in-depth descriptions of some Measurement Descriptions the measurements possible using Bird power sensors. Procedures for each compatible sensor can be found in the following sections: "Wideband RF Power Sensor (WPS) Measurements" on page 48 ... -
Page 53: Vswr
All Sensors VSWR measures the relation between forward and reflected average power. The Bird Wideband Power Sensor calculates the VSWR from the Forward and Reflected Average Power measurements. Rho and Return Loss are also the same measurement, but in different units: Rho ... -
Page 54: Peak Envelope Power
Digital Power Meter Display, 5000-NG Peak Envelope Power 5012, 5016, 5017, 5018, 5019 Peak power measurements detect amplitude changes as a signal modulates the carrier envelope. The WPS operates in an asynchronous cycle: 300 ms of waveform sampling followed by a 50 ms reset period. The peak power is then displayed and the cycle repeats. -
Page 55: Statistical Power Measurement
Measurements Statistical Power Measurement 7022 Provides statistical measurements to display the percentage of time that a particular waveform exists at a specific peak to average power ratio. The illustrates this concept, as applied to an LTE-TDD Figure 34 on page 46 waveform. - Page 56 Digital Power Meter Display, 5000-NG Interpreting Statistical Data There are many factors that influence the performance of modern communications systems. Some examples: The presence of interfering signals within the operating bandwidth of the system. Transmission line discontinuities resulting in multiple reflections within the transmission system.
-
Page 57: Wideband Rf Power Sensor (Wps) Measurements
Wideband RF Power Sensor (WPS) Measurements "Wideband RF Power Sensor (WPS) Measurements" on page 48 The WPS are available with the frequency ranges shown below: 5012D: 350-4000 MHz 5016D: 350-4000 MHz 5017D: 25-1000 MHz 5018D: 150-4000 MHz 5019D: 25-1000 MHz Figure 35 Wideband Power Sensor The 501xD can be used to measure:... - Page 58 Digital Power Meter Display, 5000-NG 5. Enter the Offset value (total attenuation of couplers and attenuators connected to the WPS, if used). 6. Enter Filter Value. See for an explanation of the "Video Filter" on page 50 filter. 7. Tap the Display Controls Menu 8.
-
Page 59: Video Filter
Video Filter Figure 36 Video Filter Settings, 300 kHz Signal Filter Correct Filter Too Small Filter Too Wide Noise Signal Except for average power and VSWR measurements, all WPS measurements rely on a variable video filter to improve accuracy. This filter can be set to either 4.5 kHz, 400 kHz, or full bandwidth (10000kHz). -
Page 60: 7020 Sensor Measurements
Digital Power Meter Display, 5000-NG 7020 Sensor Measurements The 7020 is available in models covering the following frequency ranges: 350-4000 MHz 350-4200 MHz 25-1000 MHz Figure 37 7020 Power Sensor The 7020 sensors can be used to measure: Forward Power ... -
Page 61: Directional Power Sensor (Dps) Measurements
Directional Power Sensor (DPS) Measurements Figure 38 Directional Power Sensor The 5014 can be used to measure: Forward Power Reflected Power Match Measurements Sensor Temperature Measurement procedure 1. Tap the Sensor Operation Menu. 2. Tap Sensor Mode. 3. -
Page 62: 5014 Sensor Element Types
Digital Power Meter Display, 5000-NG 5014 Sensor Element Types The DPS series sensors utilize elements in order to make power measurements. Each element has an arrow on it that represents the direction in which it measures power. The elements ignore power in the opposite direction with a directivity of at least 25 dB. -
Page 63: Statistical Power Sensor Measurements
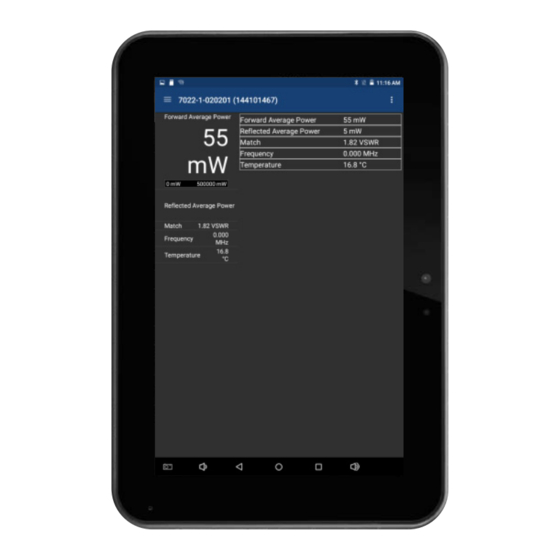
Statistical Power Sensor Measurements Figure 39 Statistical Power Sensor The 7022 has three measurement modes and can be used to measure: Average Power Mode Forward Power Reflected Power Match Measurements Frequency Sensor Temperature Time Domain Power Mode ... -
Page 64: Measurement Procedure
Digital Power Meter Display, 5000-NG Measurement procedure If additional information about any settings is desired prior to beginning a measurement, see Additional Information. 1. Select Sensor Mode on the Sensor Operation Menu . Average Power Time Domain ... -
Page 65: Additional Information
8. Tap the Display Controls Menu. 9. Tap Readings. 10. Tap the Sensor Operation Menu. 11. Tap Device Actions. 12. Tap Start to initiate measurement. Additional Information Time Domain Mode In Time Domain, the amplitude of a single frequency is measured, rather than sweeping a range of frequencies. - Page 66 3600 and positive 3600. Statistical Power Mode In Statistical Power Mode,the Bird RF Meter is capable of making meaningful power measurements of signals incorporating complex modulation methods. In essence, provide meaningful measurements independent of the modulation method used in the system.
- Page 67 Duty Cycle — Setting is a user selectable value between 100 and 0. auto enabled Bandwidth (Video Filter) — See Bandwidth (Video Filter) under Time Domain Measurement. Run Mode — Normal, RF Meter takes one measurement and stops ...
-
Page 68: Antenna And Cable Monitor (Acmi) Measurements
Digital Power Meter Display, 5000-NG Antenna and Cable Monitor (ACMI) Measurements Figure 40 ACMI The ACMI is available in a variety of frequency ranges: L0-xxxxxx 108 – 144 MHz L1-xxxxxx 136 – 225 MHz L2-xxxxxx 225 – 520 MHz M-xxxxxx 470 –... -
Page 69: Measurement Procedure
Measurement procedure The only configuration options for the ACMI are for alarms, relay control, and analog outputs for forward and reflected power. See "ACMI Configuration Menu Options" on page 60 Reset Alarm option is available under Device Actions on the Sensor Operation Menu Alarms can be reset on the Functions Menu. - Page 70 Digital Power Meter Display, 5000-NG Forward DAC Gain — The ACMI has an linear analog output voltage of 0-5 VDC representing the full scale of the forward power. The Forward Gain setting allows the adjustment of the value the voltage represents. This allows for increased resolution at lower power levels.
-
Page 71: Broadcast Power Monitor (Bpm) Measurements
Broadcast Power Monitor (BPM) Measurements Figure 41 BPME The BPME is available in a variety of frequency ranges and transmission line size: VHF low 45 – 88 MHz 88 - 230 MHz 470-890 MHz The BPME is used to measure: ... - Page 72 Digital Power Meter Display, 5000-NG Alarm Enable — When Enable is selected, alarms will be reported whenever signal conditions exceed alarm settings. Options are Enabled and Disabled. VSWR Trip Point — Selectable set point for VSWR alarm, Settings are 1.3 through 2.5.
- Page 73 Reflected DAC Gain — The BPME has an linear analog output voltage of 0-2 VDC representing the full scale of the reflected power. The Reflected DAC Gain setting allows the adjustment of the value the voltage represents. This allows for increased resolution at lower power levels.
-
Page 74: Channel Power Monitor (Cpm) Measurements
Digital Power Meter Display, 5000-NG Channel Power Monitor (CPM) Measurements Figure 42 Channel Power Monitor The CPM evaluates and monitors LMR systems by checking the key elements of the transmission path in real time and alerting users of degraded performance or failures. - Page 75 Channel X Max Power — Enter the maximum power capability or the sensor connected to the associated channel. Channel X Label — Enter a unique name for the associated channel. Channel X Push To Talk Enabled — If channel alarms are enabled: When Push To Talk is enabled, alarms for the associated channel will only be enabled when the push to talk input to the CPM back panel is active (radio is keyed).
- Page 76 Digital Power Meter Display, 5000-NG...
-
Page 77: Chapter 6 Specifications
Chapter 6 Specifications General Specifications Display Full-Color 8" 1280 x 800 pixel display with backlight. 5012D, 5014,5016D, 5017D, 5018D, 5019D, 7020, 7022, 5015,5016D, 5017D, 5018D, 5019D, 7020, 7022, 5015-EF, Compatible Sensors 3141 CPM (4042, 4043, 4044, 4045), ACM/ACMI Series, BPME True Average Power (Forward and Reflected) VSWR, Return Loss, rho, Match Efficiency Peak Power, Peak to Average Ratio, Crest Factor, PEP... -
Page 78: Physical And Environmental Specifications
Digital Power Meter Display, 5000-NG Minimum 8 Hours continuous usage (except 7022) Battery Life 24 hour data logging (display in sleep mode) (except 7022) 1 Camera interface disabled from factory for security, user activation required. Physical and Environmental Specifications Operating Temperature -20 to +60 °C (-4 to +140 °F) -
Page 79: Accessories
Specifications Accessories Included Accessories Item Part Number Charger, US, 5V, 2.5A 5B5002-2 Charger, International, 5V, 2.5A 5B5002-1 Cable, USB, Standard 5A2653-3R5NL4 Soft Carry Case, 5000-NG 5B5000-1 Instruction Manual (PDF) 920-5000-NG Stylus SK-TP-112 Cable, USB SeaLATCH Cable, 72" 5A2653-6L Optional Accessories Item Part Number Boot, Protective Rubber... -
Page 80: Limited Warranty
Limited Warranty All products manufactured by Seller are warranted to be free from defects in material and workmanship for a period of one (1) year, unless otherwise specified, from date of shipment and to conform to applicable specifications, drawings, blueprints and/or samples. Seller’s sole obligation under these warranties shall be to issue credit, repair or replace any item or part thereof which is proved to be other than as warranted;...
Need help?
Do you have a question about the Digital Power Meter Display and is the answer not in the manual?
Questions and answers