Table of Contents
Advertisement
Quick Links
Advertisement
Table of Contents

Related Manuals for AEMC 407


Summary of Contents for AEMC 407
- Page 1 ...
-
Page 3: Table Of Contents
THE ROTARY SWITCH ................10 THE FUNCTION BUTTONS .................11 THE DISPLAY ....................12 1.3.1 Display Symbols ................12 1.3.2 Measurement Capacity Exceeded (OL) ........13 THE TERMINALS...................14 BUTTON ....................15 (YELLOW) BUTTON (second function) ..........16 BUTTON ....................16 BUTTON ....................17 BUTTON ....................18 2.5.1 Normal Mode ................18 2.5.2 The MAX/MIN Mode + Activation of the HOLD Mode .... - Page 4 3.10 POWER MEASUREMENTS W, VA, var AND PF ........32 3.10.1 Single-Phase Power Measurement..........32 3.10.2 Balanced 3-Phase Power Measurement........33 3.10.3 Four Quadrant Diagram ..............34 3.11 ENERGY METERING MEASUREMENT.............35 3.12 FREQUENCY MEASUREMENT (Hz) ............38 3.12.1 Frequency Measurement (V) ............38 3.12.2 Frequency Measurement (A) ............
- Page 5 4.2.10 Continuity Measurement ............... 69 4.2.11 Resistance Measurement ............. 69 4.2.12 Active DC Power Measurements ..........70 4.2.13 Active AC Power Measurements ..........70 4.2.14 Active AC+DC Power Measurements ........... 72 4.2.15 Measurement of Apparent AC Power ........... 72 4.2.16 Measurement of Apparent AC+DC Power ........
- Page 6 Thank you for purchasing a For best results from your instrument and for your safety, read the enclosed operating instructions carefully and comply with the precautions for use. These products must be only used by qualified and trained users. Indicates a WARNING and that the operator must refer to the user manual for instructions before operating the instrument in all cases where this symbol is marked.
- Page 7 PRECAUTIONS FOR USE This device complies with safety standards IEC-61010-1 and 61010-2-032 for voltages of 1000V in category IV at an altitude of less than 2000m, indoors, with a degree of pollution not exceeding 2. These safety instructions are intended to ensure the safety of persons and proper operation of the device.
-
Page 8: Receiving Your Shipment
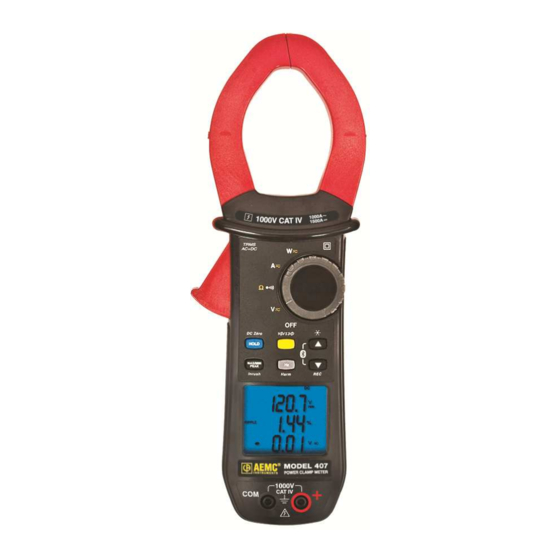
Save the damaged packing container to substantiate your claim. ORDERING INFORMATION Clamp-on Meter Model 407......Cat. #2139.51 Includes set of 2 color-coded silicone insulated test leads, test probes and alligator clips, ®... - Page 9 The Clamp-on Meter Model 407 is a professional electrical measuring instrument that combines the following functions: Current measurement InRush current / overcurrent (True InRush™) measurement Voltage measurement Frequency measurement Harmonic distortion (THD) measurement Harmonic rank value (A and V) up to the 25th ...
-
Page 10: The Rotary Switch
The rotary switch has five positions. To access the functions, set the switch to the desired function. The functions are described in the table below. OFF mode – Turns the clamp-on meter off AC, DC, AC+DC voltage measurement (V) Continuity test Resistance measurement ... -
Page 11: The Function Buttons
Holds the last value on the display Zero correction A 3.8.2 AC+DC AC+DC Selects the type of measurement and configuration functions (AC, DC, AC+DC) Selection of single-phase or 3-phase measurement Enables/disables display backlighting Scrolls up the of orders of harmonics or of pages of results in W, MAX/MIN/PEAK Enables/disables Bluetooth wireless transfer (in combination with 6) -
Page 12: The Display
Mode selection display Active measurement value and unit display 3.5 to 3.13 Display of the MAX/MIN/PEAK modes 3.10 Type of measurement (AC or DC) Low battery indication Alternating current or voltage Direct current or voltage Alternating and direct current Storage of the values and display hold RMS value Maximum DC or RMS value Minimum DC or RMS value... -
Page 13: Measurement Capacity Exceeded (Ol)
Balanced total 3-phase power measurement Volt Hertz Active power Ampere Percentage Ω Milli- prefix Kilo- prefix Reactive power Apparent power Power factor Displacement power factor (cos φ) Crest factor Ripple (in DC) Total harmonic distortion with respect to the fundamental Total harmonic distortion with respect to the true RMS value of the signal. -
Page 14: The Terminals
The terminals are used as follows: (black) Input Terminal Jack (red) Input Terminal Jack... -
Page 15: Button
The buttons respond differently to short, long, and sustained presses. In this section, the icon represents the possible positions of the switch for the button’s functionality. This button is used to: Store and look up the last values acquired specific to each function (V, A, ... -
Page 16: Yellow) Button (Second Function)
This button is used to select the type of measurement (AC, DC, AC+DC) and the second functions marked in yellow next to the relevant positions of the switch. It can also be used to modify the default values in the configuration mode (see §... -
Page 17: Button
This button is used to: Scroll down through the orders of harmonics or successive pages Activate the recording of the data Activate the Bluetooth function - Scrolls through the various pages of measurement results, depending on the short function and possibly the active mode (MAX/MIN/PEAK or THD/Harmonics) -
Page 18: Button
This button activates the detection of the MAX, MIN, PEAK+, PEAK- or AVG values of the measurements made. Max and Min are the extreme mean values in DC and the extreme RMS values in AC. Peak+ is the maximum instantaneous peak and Peak- is the minimum instantaneous peak. -
Page 19: The Max/Min Mode + Activation Of The Hold Mode
2.5.2 The MAX/MIN Mode + Activation of the HOLD Mode Successive presses on Function Displays the MAX, AVG, MIN and PEAK+, AVG, PEAK- values detected before the button was pressed short When the button is pressed, the last value is held on the display NOTE: The HOLD function does not interrupt the acquisition of new MAX, MIN, PEAK values 2.5.3... -
Page 20: Button
BUTTON This button is used to display the frequency measurements of a signal, of power, of the levels and orders of harmonics. NOTE: This button is not functional in the DC mode. 2.6.1 Normal Mode Successive Function presses on Displays: - The frequency of the signal, the RMS short measurement, and the DC component... -
Page 21: The Hz Function + Activation Of The Hold Mode
2.6.3 The Hz Function + Activation of the HOLD Mode Successive Function presses on - Stores and displays the frequency with the RMS value and the DC component, then on a 2nd consecutive page, the crest factor CF short - NOTE: The values displayed are those measured before the button is pressed... -
Page 22: Installing The Batteries
3 USE INSTALLING THE BATTERIES Insert the batteries supplied with the device as follows: Using a screwdriver, unscrew the battery compartment cover (item 1) from the back of the housing. Insert the 4x1.5V AA batteries supplied (item 2), observing polarities. Close the battery compartment cover and screw it onto the housing. -
Page 23: Configuration
CONFIGURATION As a safety measure, and to avoid repeated overloads on the inputs of the meter, configuration operations should only be performed when the meter is disconnected from all dangerous voltages. 3.4.1 Auto Power Off The Auto Power Off feature is enabled by default. To disable it, perform the following: In the OFF position, hold the button down while turning the switch... -
Page 24: Configuring The Recording Duration
3.4.3 Configuring the Recording Duration In the OFF position, hold the (yellow) button down while turning the switch to , until the end of the "full screen" display and the emission of a beep, to enter the configuration mode. The display will then indicate the recording interval. -
Page 25: Voltage Measurement (V)
VOLTAGE MEASUREMENT (V) To measure voltage, proceed as follows: Set the switch to Connect the black lead to the COM terminal and the red lead to the "+" terminal. Connect the test probes or the alligator clips to the circuit to be measured. -
Page 26: Continuity Test
Display Quantity 1st row Total RMS voltage V RMS or TRMS 2nd row Crest factor (CF) 3rd row DC voltage component, V CONTINUITY TEST Warning: Before performing the test, make sure that the circuit is off and all capacitors have been discharged. Set the switch to ;... -
Page 27: Resistance Measurement
RESISTANCE MEASUREMENT Warning: Before making a resistance measurement, make sure that the circuit is off and all capacitors have been discharged. (yellow) button. The symbol Set the switch to and press the is displayed. Connect the black lead to the COM terminal and the red lead to the "+" terminal. -
Page 28: Dc Or Ac+Dc Measurement
The measured values are displayed on the screen. Display Quantity 1st row RMS current A RMS 2nd row Crest factor (CF) 3rd row DC current component A 3.8.2 DC or AC+DC Measurement Set the switch to and select DC if the display does not indicate "0"; the DC zero must be corrected first. - Page 29 Step 2: Make a Measurement The switch is set to . Select DC or AC+DC by pressing the (yellow) button until the desired choice is reached. Clamp the jaws around the conductor to be measured. The measured values are displayed: In DC: Display Quantity...
-
Page 30: Starting Current Or Overcurrent (True Inrush™) Measurement
In AC and AC+DC: Display Quantity 1st row Total RMS current in A RMS or TRMS 2nd row Crest factor (CF) 3rd row DC current component A STARTING CURRENT OR OVERCURRENT (True InRush™) MEASUREMENT NOTE: The measurement can be made only in AC or DC mode (AC+DC mode disabled). - Page 31 PEAK: Display Quantity 1st row “Inrh” 2nd row PEAK+ or PEAK- value in A 3rd row Triggering threshold in A...
-
Page 32: Power Measurements W, Va, Var And Pf
3.10 POWER MEASUREMENTS W, VA, VAR AND PF This measurement is possible in single-phase or in balanced 3-phase. NOTE: If performing DC or AC+DC power measurements, correct the DC zero in current first (see § 3.8.2) For the power factor (PF) and VA and var, the measurements possible are only available in AC or AC+DC modes. -
Page 33: Balanced 3-Phase Power Measurement
3.10.2 Balanced 3-Phase Power Measurement Set the switch to Press the (yellow) button until the symbol is displayed. The device automatically displays AC+DC. To select AC, DC, or AC+DC, press the (yellow) button until the desired choice is reached. Connect the black lead to the COM terminal and the red lead to the "+" terminal. -
Page 34: Four Quadrant Diagram
The measurement is displayed on screen. NOTE: 3-phase power on a balanced 4-wire network can also be measured by proceeding in the same way, or by proceeding as for the measurement on a single-phase network, then multiplying the value by three. 3.10.3 Four Quadrant Diagram In order to correctly determine the sign of the active and reactive powers, refer to the diagram below, which determines:... -
Page 35: Energy Metering Measurement
3.11 ENERGY METERING MEASUREMENT The Energy Metering measurement is available in W for the AC and AC+DC quantities. The energy meters start and totalize the various types of energy (the eight energy meters - 4 meters of energy consumed and 4 meters of energy generated - are started). - Page 36 The status of each meter is: On <=> metering in operation Off <=> metering stopped (values of the meters 0) Stop <=> metering stopped (values of the meters preserved) Hour meter page: 1 : hours (h) 2 : minutes (n) 3 : seconds (s) The duration of the metering uses the following format: XXXh (for hours) XXm (for minutes) XXs (for seconds)
- Page 37 Conventions: Load designates the consumed energy by the load (W+) Load C designates the capacitive reactive energy (W+ and var-) Load L designates the inductive reactive energy (W+ and var+) Supp designates the energy generated by the load (W-) Supp C designates the capacitive reactive energy (W- and var-) Supp L designates the inductive reactive energy (W- and var+) To access the screens concerning the energies received by the load...
-
Page 38: Frequency Measurement (Hz)
Example of « SUPP side » screen The energy displays use the following formats: [000.1 ; 999.9] [1.000 k ; 9999 k] [10.0 M ; 999 M] [1.00 G ; 999 G] 3.12 FREQUENCY MEASUREMENT (HZ) The frequency measurement is available in V, W and A for AC and AC+DC measurements. -
Page 39: Frequency Measurement (A)
3.12.2 Frequency Measurement (A) Set the switch to and press the button. The Hz symbol is displayed. Select AC or AC+DC by pressing the (yellow) button until desired choice is reached. Clamp the jaws around the conductor to be measured. The measured value is displayed on the screen. -
Page 40: Measurement Of The Thd (A)
The measurement is displayed on screen. 3.13.2 Measurement of the THD (A) Set the switch to and press and hold (>2s) the button. The , THD and A RMS symbols are displayed. NOTE: first press the yellow button to place the meter in AC current measurement mode. -
Page 41: Display Of The Individual Harmonics And Of The Frequency Of The Fundamental From Dc To The 25
3.13.3 Display of the Individual Harmonics and of the Frequency of the Fundamental From DC to the 25 In the context of measurement of the THDs in voltage (§ 3.13.1) and in current (§ 3.13.2): Press the button. Order “hdC” is displayed (DC component), only in DC or AC+DC. -
Page 42: Recording Of Measurements
3.15 CONNECTING TO A COMPUTER 3.15.1 Bluetooth Connection The Model 407 is equipped with Bluetooth connectivity for downloading displaying and deleting recorded data in the instrument’s memory. The instrument is supplied with a Bluetooth USB adapter for use with computers without Bluetooth capability. -
Page 43: Pairing The Instrument To The Computer
3.15.2 Pairing the Instrument to the Computer 3.15.2.1 Pairing Using Windows Vista/Windows 7 In the active measurement function, press the buttons simultaneously. The symbol will appear in the upper right corner of the display. Connect the supplied Bluetooth USB Adapter into an available USB port. - Page 44 NOTE: Depending on the Bluetooth setup and operating system, it may be necessary to enter a passkey to finalize the instrument connection. If so, the default passkey is: 0000. If asked for a pairing code select the “Enter the Device’s pairing code”.
- Page 45 Once the instrument has been successfully added to the computer, a window similar to the one below will be displayed. Select “Close”. You should see the Device listed in the Bluetooth devices window.
- Page 46 ® Launch the Dataview Control Panel using the icon placed on the ® desktop during software installation. Refer to section 3.22 for DataView software installation. The instrument should automatically connect if only one power meter is paired. If more than one instrument is paired, select the instrument you wish to connect to from the drop-down list in the connection window.
- Page 47 In the “Bluetooth Devices” window select “Add…”.
- Page 48 In the “Add Bluetooth Device Wizard” window, check the box next to “My device is set up and ready to be found”, then select “Next”. The computer will search for any available Bluetooth equipment to pair with. Once the software locates the instrument, select the device you wish to pair with and select “Next”.
-
Page 49: Turning Bluetooth On/Off
When prompted for a passkey, select “Let me choose my own passkey” and enter the default code 0000. When the computer is finished pairing with the instrument, a window indicating its success will be displayed. The computer is now set up to communicate via Bluetooth. -
Page 50: Recording Data
3.18 RECORDING DATA 3.17.1 Starting a Recording Session NOTE: A new recording cannot be started if the memory is full or if the Bluetooth is active. Configure the instrument as described in section 3.4. Select the measurement function to be recorded using the rotary switch and connect the instrument to the measurement source Press the REC button for >2s to start a recording. -
Page 51: Data Storage
The approximate number of data points that can be recorded with the memory cleared 3.20.1 Trend Measurements The Model 407 stores the measurement of each of the inputs. In addition, the user can define the storage rate and type of measurement. 3.20.2 Recording with Memory Cleared... - Page 52 ® Insert the DataView CD into your CD-ROM drive. If auto-run is enabled, the Setup program will start automatically. If auto-run is not enabled, select Run from the Start menu and type in D:\SETUP (if your CD-ROM drive is drive D. If this is not the case, substitute the appropriate drive letter).
- Page 53 NOTE: The PDF-XChange option must be selected to be able to generate PDF ® reports from within DataView 407 and 607 In the Ready to Install the Program window, click on Install. 10. If the instrument selected for installation requires the use of a USB port, a warning box will appear, similar to below.
-
Page 54: Opening The Dataview Control Panel
11. When the drivers are finished installing, the Installation Successful dialog box will appear. Click OK. 12. Next, the Installation Wizard Complete window will appear. Click Finish. 13. A Question dialog box appears next. Click Yes to read the procedure for connecting the instrument to the USB port on the computer. - Page 55 The main menu at the top of the screen lists the following commands: File • Open • Save As • Create DataView Report • Create Spreadsheet • Edit Session Properties • Print - prints the selected real-time window. • Print Preview - provides a preview of the real-time window to be printed.
- Page 56 Instrument • Connect - establishes a connection. • Disconnect - closes a connection. • Configure – N/A • View Recorded Data – Open a window to display the recordings present in the instrument. • Download All Recorded Data – Downloads the instruments memory to the PC •...
-
Page 57: Displaying Real-Time Status Information
Window • Cascade - arrange all windows into a stack, with each window offset slightly. • Tile - display all windows equally sized without overlapping. • Load Layout - Loads a user saved layout • Save Layout – Allows the user to save a custom layout for later use. •... -
Page 58: Resizing And Saving Real-Time Window Layouts
3.25 RESIZING AND SAVING REAL-TIME WINDOW LAYOUTS The windows can also be resized and arranged to suit your needs by using the mouse pointer. To move a window, simply click and hold on the title bar, then drag to the desired location. To resize a window, click and drag the corner of the window. - Page 59 • Once a Date/Time is written, the Recorded Data in Instrument window will display the recording. To display the data in a graph or list format, select the desired recording and select View. • From the “View” window you can select what to view using the radio buttons and view the data in a list format by selecting the “View as List”...
-
Page 60: Power Clamp Meter Template
Refer to the DataView Help files for detailed information about using the templates. 407 Template The Trend Summary Report template generates a view with a worksheet for each recorded parameter and a cover page. You can move between the worksheets by selecting the desired worksheet from the worksheet tabs at the bottom of the view (just above the status bar). - Page 61 • Session Summary - containing operator comments. ® • OLE - containing the AEMC Instruments logo. Using the associated properties window customizes each of these frames. The properties window for a frame is displayed by selecting the frame, then selecting the Properties command from the Frame menu.
- Page 62 Channel Graph Frame A Channel Graph frame provides a graphical look into the database it is attached to. The database is attached to the Trend Graph frame when it is created. This can be done manually by placing a graph frame or automatically when using a template.
- Page 63 At which point, clicking the left mouse button again will select the first trace and the process will repeat. Frames can be linked together so that when you select a trace or line in one frame another frame shows additional information about the selection. example when selecting a trace in the graph the trend summary list will be updated to list the sample points for the selected trace.
- Page 64 list entries, the selection will move from each entry for the associated channel. In addition to stepping through the list with the tool bar, you can select a specific entry listed using the mouse pointer. The text for the selected entry will be highlighted, indicating which entry in the list is currently selected.
-
Page 65: Reference Conditions
4 SPECIFICATIONS REFERENCE CONDITIONS Quantities of Influence Reference Conditions Temperature: 23°C ±2°C Relative humidity: 45% to 75% Supply voltage: 6.0V ±0.5V Frequency range of the applied signal: 45 to 65Hz Sine wave: pure Peak factor of the applied alternating signal: √2 Position of the conductor in the clamp: centered... -
Page 66: Ac Voltage Measurement
4.2.2 AC Voltage Measurement Measurement 0.15 to 100.0 to 1000V RMS Range 99.99V 999.9V 1400V peak (1) Specified Measurement 0 to 100% of the measurement range Range (2) 0.15 to 9.99V ± (1% R +10cts) Accuracy ± (1% R +3cts) 10.00 to 99.99V ±... -
Page 67: Dc Current Measurement
Specific Specifications in MAX/MIN mode in Voltage (from 10Hz to 1kHz in AC and AC+DC): Accuracy: add 1% R to the values of the previous table. Capture of the extreme: approximately 100ms. Specific Specifications in PEAK mode in voltage (from 10Hz to 1kHz in AC and AC+DC): ... -
Page 68: Ac+Dc Intensity Measurement
4.2.6 AC+DC Intensity Measurement AC: 1000A Measurement 0.15 to 100.0 to DC or PEAK: Range (2) 99.99A 999.9A 1000 to 1500A (1) Specified Measurement 0 to 100% of the measurement range Range Accuracy (2) ± (1% R +10cts) ± (1% R +3cts) (zero corrected) Resolution 0.01A... -
Page 69: Calculation Of The Crest Factor (Cf)
4.2.8 Calculation of the Crest Factor (CF) Measurement range 1.00 to 3.50 3.51 to 5.99 6.00 to 10.00 Specified Measurement Range 0 to 100% of the measurement range (from 5V or 5A) Accuracy (zero ± (2% R +2cts) ± (5% R +2cts) ±... -
Page 70: Active Dc Power Measurements
Specific Specifications in MAX/MIN mode: Accuracy: add 1% R to the values of the previous table Capture of the extreme: approximately 100ms. 4.2.12 Active DC Power Measurements Measurement 0 to 10.00 to 100.0 to 1000 to Range (2) 9999W 99.99kW 999.9kW... - Page 71 Note (4) Any power measured less than 5W is regarded as zero and causes the display of dashes "----" If the voltage is less than 0.15V or if the current is less than 0.15A, the power measured is regarded as zero and causes the display of "----" Note 5 The active powers are positive for power consumed and negative for power generated.
-
Page 72: Active Ac+Dc Power Measurements
4.2.14 Active AC+DC Power Measurements Measurement 5 to 10.00 to 100.0 to 1000 to Range (2) (4) 9999W 99.99kW 999.9kW 1500kW (1) Specified 1 to 100% of the Measurement 0 to 100% of the measurement range measurement range Range Accuracy (3) 1000A 1000A ±... -
Page 73: Measurement Of Apparent Ac+Dc Power
4.2.16 Measurement of Apparent AC+DC Power Measurement 5 to 10.00 to 100.0 to 1000 to Range (2) (4) 9999VA 99.99kVA 999.9kVA 1500kVA (1) Specified 1 to 100% of the 0 to 100% Measurement measurement range of the measurement range Range Accuracy (3) 1000A 1000A... -
Page 74: Measurement Of Reactive Ac+Dc Power
4.2.18 Measurement of Reactive AC+DC Power 1000 to Measurement 5 to 10.00 to 100.0 to 1500 kvar Range (2) (4) 9999 var 99.99 kvar 999.9 kvar Specified 1 to 100% of the Measurement 0 to 100% of the measurement range measurement range Range Accuracy (3) -
Page 75: Calculation Of The Displacement Power Factor (Dpf)
4.2.20 Calculation of the Displacement Power Factor (DPF) Measurement Range (1) 0.00 to +1.00 Specified measurement Range 0 to 100% of the measurement range (from 1A Accuracy (2) (3) ± (5% R +2cts) Resolution 0.01 Note (1) If one of the terms in the calculation of the DPF is displayed as "OL", or forced to zero, the display of the DPF is an indeterminate value "----". -
Page 76: Specifications In Thdr
4.2.22 Specifications in THDr Measurement Range 0.0 to 100% Specified Measurement 0 to 100% Range of the measurement range Accuracy ± (5% R ±2cts) in voltage ± (5% R ±5cts) in current Resolution 4.2.23 Specifications in THDf Measurement Range 0.0 to 1000% Specified Measurement 0 to 100% Range... -
Page 77: Environmental Conditions
- Specific characteristics in MAX/MIN mode in THD (from 10Hz to 1kHz): Accuracy: add 1% R to the values in the tables above. Capture time of the extreme: approximately 100ms ENVIRONMENTAL CONDITIONS Conditions Operating Storage Temperature -4° to +131°F -40°... -
Page 78: Compliance With International Standards
COMPLIANCE WITH INTERNATIONAL STANDARDS Compliant with standards IEC-61010-1, Electric safety IEC-61010-2-30, and IEC-61010-2-32: 1000V CAT IV. Electromagnetic Compliant with standard EN-61326-1 compatibility Classification: residential environment Mechanical strength Free fall: 2m (in accordance with standard IEC-68-2-32) Level of protection of Housing: IP54 (per standard IEC-60529) the housing Jaws: IP40... -
Page 79: Environmental Variations
ENVIRONMENTAL VARIATIONS Influence Condition of Range of Measurement Influence Influence Influenced Typical 0.1% R/10°C 0.1% R/10°C 0.5% R/10°C + 2ct -4° to +131°F Temperature 1% R/10°C T°C 1.5% R/10°C + 2ct (-20° to +55°C) (0.2% R +1°C)/10°C (0.3% R +2°C)/10°C ... -
Page 80: Warning
5 MAINTENANCE WARNING Remove the test leads on any input before opening the case. Do not operate the clamp-on meter without a battery case cover. To avoid electrical shock, do not attempt to perform any servicing unless you are qualified to do so. ... -
Page 81: Repair And Calibration
N.I.S.T. (includes calibration certificate plus recorded calibration data). ® ® Chauvin Arnoux , Inc. d.b.a. AEMC Instruments 15 Faraday Drive Dover, NH 03820 USA Tel: (800) 945-2362 (Ext. 360) (603) 749-6434 (Ext. -
Page 82: Limited Warranty
8 LIMITED WARRANTY The Model 407 is warranted to the owner for a period of three years from the date of original purchase against defects in manufacture. This limited ® warranty is given by AEMC Instruments, not by the distributor from whom it was purchased. - Page 84 ® ® Chauvin Arnoux , Inc. d.b.a AEMC Instruments 15 Faraday Drive • Dover, NH 03820 USA www.aemc.com 99-MAN 100367 v1 05/12...
Need help?
Do you have a question about the 407 and is the answer not in the manual?
Questions and answers