Dell PowerEdge M IO Aggregator Command Reference Manual
Mxl 10/40gbe switch io module ftos command reference guide, ftos 8.3.16.1
Hide thumbs
Also See for PowerEdge M IO Aggregator:
- Getting started manual (38 pages) ,
- Reference manual (264 pages)
Table of Contents
Troubleshooting

Related Manuals for Dell PowerEdge M IO Aggregator


Summary of Contents for Dell PowerEdge M IO Aggregator
- Page 1 Dell PowerEdge Configuration Guide for the M I/O Aggregator Publication Date: March 2013...
- Page 2 © 2012 Dell Force10. All rights reserved. Reproduction of these materials in any manner whatsoever without the written permission of Dell Inc. is strictly forbidden. Trademarks used in this text: Dell(TM), the Dell logo, Dell Boomi(TM), Dell Precision(TM) , OptiPlex(TM), Latitude(TM), PowerEdge(TM), PowerVault(TM), PowerConnect(TM), OpenManage(TM), EqualLogic(TM), Compellent(TM), KACE(TM), FlexAddress(TM), Force10(TM) and Vostro(TM) are trademarks of Dell Inc.
- Page 3 | iii...
-
Page 5: Table Of Contents
1 About this Guide ........... 1 Objectives . - Page 6 External Serial Port with a USB Connector ....... .23 Boot Process ............23 Configure a Host Name .
- Page 7 Data Center Bridging Exchange Protocol (DCBX) ......55 Data Center Bridging in a Traffic Flow ........55 Data Center Bridging: Auto-DCB-Enable Mode .
- Page 8 8 FIP Snooping........... . . 93 Fibre Channel over Ethernet .
- Page 9 Information Monitored in iSCSI Traffic Flows ......150 Detection and Autoconfiguration for Dell EqualLogic Arrays ....151 Detection and Port Configuration for Dell Compellent Arrays .
- Page 10 12 Link Aggregation ..........155 How the LACP is Implemented on an Aggregator .
- Page 11 16 Simple Network Management Protocol (SNMP) ......191 Implementation Information ..........191 Configuring the Simple Network Management Protocol .
- Page 12 Stack-Link Flapping Error .........218 Master Switch Recovers from Failure .
- Page 13 Resolution: Disable broadcast storm control globally on the Aggregator..245 Steps to Take: ..........245 Flooded packets on all VLANs are received on a server .
- Page 14 RFC and I-D Compliance ..........272 General Internet Protocols.
-
Page 15: About This Guide
Dell Force10 M I/O Aggregator running FTOS version 8.3.17.4. The M I/O Aggregator is installed in a Dell PowerEdge M1000e Enclosure. For information about how to install and perform the initial switch configuration, refer to the Getting Started Guides on the Dell Support website at http://support.dell.com/manuals. -
Page 16: Conventions
Dell Support website at http://support.dell.com/support/edocs/systems/ pem/en/index.htm. Related Documents For more information about the Dell Force10 MXL 10/40GbE Switch IO Module, refer to the following documents: • Dell Force10 FTOS Command Line Reference Guide for the M I/O Aggregator •... -
Page 17: Before You Start
(CMC) interface. In this document, configuration tasks that you can perform from the CMC interface are shown with a CMC icon: For information about how to access the CMC to configure an Aggregator, refer to the Dell PowerEdge M1000e Enclosure Hardware Owner's Manual or Dell Chassis Management Controller (CMC) User’s Guide on the Dell Support website at... -
Page 18: Other Auto-Configured Settings
Other Auto-Configured Settings After the Aggregator powers on, it auto-configures and is operational with software features enabled, including: • Ports: Ports are administratively up and auto-configured to operate as hybrid ports to transmit tagged and untagged VLAN traffic. Ports 1 to 32 are internal server-facing ports, which can operate in either 1GbE or 10GbE mode. -
Page 19: Dcb Support
DCB Support DCB enhancements for data center networks are supported to eliminate packet loss and provision links with required bandwidth. The Aggregator provides zero-touch configuration for DCB. The Aggregator auto-configures DCBX port roles as follows: • Server-facing ports are configured as auto-downstream interfaces. •... -
Page 20: Link Aggregation
Link Aggregation All uplink ports are configured in a single LAG (LAG 128). Server-facing ports are auto-configured as part of link aggregation groups if the corresponding server is configured for LACP-based NIC teaming. Static LAGs are not supported. Tip: The recommended LACP timeout is long-timeout mode. Link Tracking By default, all server-facing ports are tracked by the operational status of the uplink LAG. -
Page 21: Stacking Mode
The untagged VLAN of a server-facing LAG is configured based on the untagged VLAN to which the lowest numbered server-facing port in the LAG belongs. Tip: Dell Force10 recommends that you configure the same VLAN membership on all LAG member ports. - Page 22 In case of an FTOS upgrade, you can check to see that an Aggregator is running the latest FTOS version by entering the show version command. To download an FTOS version, go to http://support.dell.com. Refer to the appropriate chapter for detailed information on how to reconfigure specific software settings.
-
Page 23: Configuration Fundamentals
Note: You can use the chassis management controller (CMC) out-of-band management interface to access and manage an Aggregator using the FTOS command-line interface. For information about how to access the CMC to configure an Aggregator, refer to the Dell Chassis Management Controller (CMC) User's Guide on the Dell Support website at http://support.dell.com/support/edocs/systems/pem/en/... -
Page 24: Cli Modes
CLI Modes Different sets of commands are available in each mode. A command found in one mode cannot be executed from another mode (with the exception of EXEC mode commands preceded by the command for more information, refer to do Command and EXEC Privilege Mode commands). -
Page 25: Navigating Cli Modes
Navigating CLI Modes The FTOS prompt changes to indicate the CLI mode. Table 3-1 lists the CLI mode, its prompt, and information about how to access and exit this CLI mode. You must move linearly through the command modes, with the exception of the command, which takes you directly to EXEC Privilege mode and the command moves you up one command mode level. -
Page 26: Do Command
Figure 3-3 shows how to change the command mode from CONFIGURATION mode to INTERFACE configuration mode. Figure 3-3. Changing CLI Modes FTOS(conf)# interface tengigabitethernet 1/2 New command prompt FTOS(conf-if-te-1/2)# do Command Enter an EXEC mode or EXEC privilege mode command from any CONFIGURATION mode (such as CONFIGURATION, INTERFACE, etc.) without returning to EXEC mode by preceding the EXEC mode command with the command Figure 3-4... -
Page 27: Obtaining Help
Figure 3-5. Undoing a command with the Command FTOS(conf)# interface managementethernet 0/0 FTOS(conf-if-ma-0/0)# ip address 192.168.5.6/16 Assign an IP address FTOS(conf-if-ma-0/0)# FTOS(conf-if-ma-0/0)# FTOS(conf-if-ma-0/0)#show config interface ManagementEthernet 0/0 ip address 192.168.5.6/16 no shutdown FTOS(conf-if-ma-0/0)# Enter “no” form of IP address command FTOS(conf-if-ma-0/0)# no ip address FTOS(conf-if-ma-0/0)# FTOS(conf-if-ma-0/0)# show config... -
Page 28: Entering And Editing Commands
Figure 3-7. Keyword? Command Example partial keyword plus “?” for matching keywords FTOS(conf)#cl? clock FTOS(conf)#cl • A keyword followed by [space] lists all of the keywords that can follow the specified keyword. Figure 3-8. Keyword ? Command Example keyword plus “[space]?” for compatible keywords FTOS(conf)#clock ? summer-time Configure summer (daylight savings) time... -
Page 29: Command History
Table 3-2. Short-Cut Keys and their Actions (continued) Key Combination Action CNTL-R Re-enters the previous command. CNTL-U Deletes the line. CNTL-W Deletes the previous word. CNTL-X Deletes the line. CNTL-Z Ends continuous scrolling of command outputs. Esc B Moves the cursor back one word. Moves the cursor forward one word. - Page 30 Figure 3-9. Filtering Command Outputs with the Command grep FTOS(conf)#do show stack-unit all stack-ports all pfc details | grep 0 stack unit 0 stack-port all 0 Pause Tx pkts, 0 Pause Rx pkts 0 Pause Tx pkts, 0 Pause Rx pkts 0 Pause Tx pkts, 0 Pause Rx pkts 0 Pause Tx pkts, 0 Pause Rx pkts 0 Pause Tx pkts, 0 Pause Rx pkts...
-
Page 31: Multiple Users In Configuration Mode
% Warning: User "<username>" on line vty0 "10.11.130.2" is in configuration mode If either of these messages appear, Dell Force10 recommends coordinating with the users listed in the message so that you do not unintentionally overwrite each other’s configuration changes. - Page 32 Configuration Fundamentals...
-
Page 33: Getting Started
• View the Command History • Upgrading and Downgrading FTOS When the boot process is complete, the console monitor displays the Dell Force10 operating software (FTOS) banner and EXEC mode prompt (Figure 4-3). For details about using the command line interface (CLI), refer to the... -
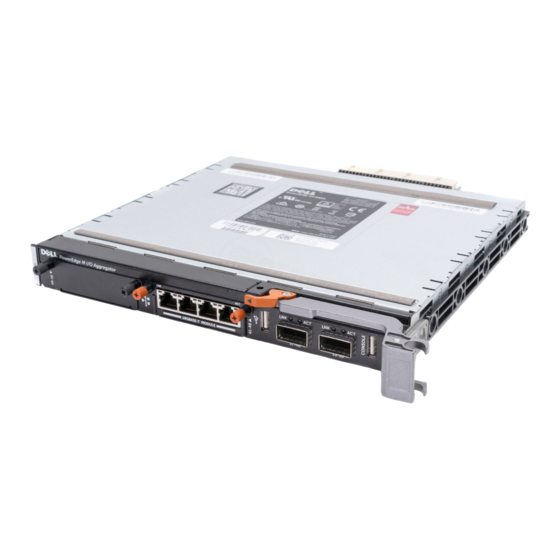
Page 34: Front Panel
Front Panel Figure 4-1 shows the Aggregator front panel: Figure 4-1. Front Panel of the M I/O Aggregator Flex IO Module in Top Expansion Slot Flex IO Module in Bottom Expansion Slot USB Storage Port 40GbE QSFP+ Ports on Base Module USB Console Port Port Numbering When installed in a PowerEdge M1000e Enclosure, Aggregator ports are numbered 1 to 56 and consist of... -
Page 35: Uplink Ports
Uplink Ports Ports 33 to 56 are external ports used for uplinks and numbered from the bottom to the top of the switch as follows: • The two base module ports operate by default in standalone 4x10GbE mode and are numbered 33 to 36 and 37 to 40. -
Page 36: Console Access
Figure 4-2. Port Numbering on an Aggregator 2-Port 40-GbE QSFP+ FlexIO 4-Port 10-GbE SFP+ or Module (4x10GbE mode): 4-Port 10GBASE-T FlexIO Module: Ports 53 to 56 (top port) Ports 49 to 52 (4x10GbE mode) Ports 49 to 52 (bottom port) 2-Port 40-GbE QSFP+ FlexIO 4-Port 10-GbE SFP+ or Module (4x10GbE mode):... -
Page 37: External Serial Port With A Usb Connector
Step Task (continued) Note: Terminal settings on the console port cannot be changed in the software and are set as follows: • 9600 baud rate • No parity • 8 data bits • 1 stop bit • No flow control External Serial Port with a USB Connector Table 4-1 lists the pin assignments. - Page 38 Boot Selector: Booting Bootflash Partition A image... Copying stage-2 loader from 0xb6120000 to 0x8c100000(size = 0x100000) F10 Boot Image selection DONE. ## Starting application at 0x8C100000 ... U-Boot 2010.03-rc1(Dell Force10) Built by antonyr at login-sjc-05 on Wed May 0:57:04 2012 Navasota IOM Boot Label 4.0.1.0bt...
- Page 39 SOFTWARE IMAGE HEADER DATA : ---------------------------- --More-- Starting Dell Force10 application 00:00:15: %STKUNIT0-M:CP %RAM-6-ELECTION_ROLE: Stack unit 0 is transitioning to Management unit. 00:00:16: %STKUNIT0-M:CP %CHMGR-5-STACKUNITDETECTED: Stack unit 0 present 00:00:18: %STKUNIT0-M:CP %CHMGR-5-CHECKIN: Checkin from Stack unit 0 (type I/O-Aggregator, 56 ports)
- Page 40 Figure 4-5. Completed Boot Process (Contd.) FTOS>00:00:30: %STKUNIT0-M:CP %IFMGR-5-IFM_ISCSI_ENABLE: iSCSI has been enabled causing flow control to be enabled on all interfaces. EQL detection and enabling iscsi profile-compellent on an interface may cause some automatic configurations to occur like jumbo frames on all ports and no storm control on the port of detection 00:00:30: %STKUNIT0-M:CP %SEC-5-LOGIN_SUCCESS: Login successful for user on line console...
- Page 41 Figure 4-6. Completed Boot Process (Contd.) 00:00:59: %STKUNIT0-M:CP %IFMGR-5-OSTATE_DN: Downstream interface set to UFD error-disabled: Te 0/29 00:00:59: %STKUNIT0-M:CP %IFMGR-5-ASTATE_UP: Changed interface Admin state to up: Te 0/30 00:00:59: %STKUNIT0-M:CP %IFMGR-5-OSTATE_DN: Downstream interface set to UFD error-disabled: Te 0/30 00:01:00: %STKUNIT0-M:CP %IFMGR-5-ASTATE_UP: Changed interface Admin state to up: Te 0/31 00:01:00: %STKUNIT0-M:CP %IFMGR-5-OSTATE_DN: Downstream interface set to UFD error-disabled: Te 0/31 00:01:00: %STKUNIT0-M:CP %IFMGR-5-ASTATE_UP: Changed interface Admin state to up: Te 0/32 00:01:00: %STKUNIT0-M:CP %IFMGR-5-OSTATE_DN: Downstream interface set to UFD error-disabled: Te 0/32...
-
Page 42: Configure A Host Name
Figure 4-7. Completed Boot Process (Contd.) 00:01:11: %STKUNIT0-M:CP %IFMGR-5-ASTATE_UP: Changed interface Admin state to up: Te 0/54 00:01:11: %STKUNIT0-M:CP %DIFFSERV-4-DSM_DCBX_ETS_RECO_TX_OVERRIDE: Port Role Change overrides the configuration of ETS Recommend TLV transmitstatus: Te 0/54 00:01:11: %STKUNIT0-M:CP %IFMGR-5-ASTATE_UP: Changed interface Admin state to up: Te 0/54 00:01:11: %STKUNIT0-M:CP %DIFFSERV-4-DSM_DCBX_ETS_RECO_TX_OVERRIDE: Port Role Change overrides the configuration of ETS Recommend TLV transmitstatus: Te 0/54 Configure a Host Name... -
Page 43: Access The Aggregator Remotely
Access the Aggregator Remotely Configuring the Aggregator for Telnet access is a three-step process: 1. Configure an IP address for the management port. Refer to Configure the Management Port IP Address. 2. Configure a management route with a default gateway. Refer to Configure a Management Route. -
Page 44: Configure A Management Route
7 is for inputting a password that is already encrypted using a Type 7 hash. Obtaining the encrypted password from the configuration of another Dell Force10 system. Configure the Enable Password Access EXEC Privilege mode using the command. EXEC Privilege mode is unrestricted by default. -
Page 45: Configuration File Management
You can store on and access files from various storage media. Rename, delete, and copy files on the system from EXEC Privilege mode. Note: Using flash memory cards in the system that have not been approved by Dell Force10 can cause unexpected system behavior, including a reboot. -
Page 46: Important Points To Remember
(Table 4-2). file-destination • To copy a remote file to a Dell Force10 system, combine the syntax for a remote file location file-origin with the syntax for a local file location (Table 4-2). -
Page 47: Save The Running-Configuration
Figure 4-10 shows an example of using the command to import a file to the Dell Force10 system from copy an FTP server. Figure 4-10. Copying a file from a Remote System Remote Location Local Location FTOS#copy ftp://myusername:mypassword@10.10.10.10//FTOS/FTOS-EF-8.2.1.0.bin flash:// Destination file name [FTOS-EF-8.2.1.0.bin.bin]:... -
Page 48: View Files
Task Command Syntax Command Mode an SCP server copy running-config scp:// username:password@{hostip hostname}/filepath/ EXEC Privilege filename Note: When copying to a server, you can only use a hostname if a DNS server is configured. View Files You can only view file information and content on local file systems. To view a list of files on the internal or external Flash, follow this step: Step Task... -
Page 49: View Configuration Files
To view the contents of a file, follow this step: Step Task Command Syntax Command Mode View the: contents of a file in the internal flash show file flash://filename EXEC Privilege show file usbflash://filename contents of a file in the usb flash EXEC Privilege running-configuration show running-config... -
Page 50: File System Management
File System Management The Dell Force10 system can use the internal Flash, USB Flash, or remote devices to store files. The system stores files on the internal Flash by default, but you can configure it to store files elsewhere. To view file system information:... -
Page 51: View The Command History
Figure 4-14. Alternative Storage Location FTOS#cd usbflash: No File System Specified FTOS#copy running-config test 3998 bytes successfully copied FTOS#dir Directory of usbflash: drwx 4096 Jan 01 1980 00:00:00 +00:00 . drwx 2048 May 02 2012 07:05:06 +00:00 .. 3 -rwx 1272 Apr 29 2011 16:15:14 +00:00 startup-config File Saved to USB Flash 4 -rwx... - Page 52 Getting Started...
-
Page 53: Aggregator Management
Aggregator Management This chapter explains the different protocols or services used to manage an Aggregator including: • Logging • Disabling System Logging • File Transfer Services • Terminal Lines • Telnet to Another Network Device • Recovering from a Forgotten Password •... -
Page 54: Disabling System Logging
Disabling System Logging By default, logging is enabled and log messages are sent to the logging buffer, all terminal lines, console, and syslog servers. To enable and disable system logging: Task Command Syntax Command Mode Disable all logging except on the console. no logging on CONFIGURATION Disable logging to the logging buffer. -
Page 55: Changing System Logging Settings
Changing System Logging Settings You can change the default settings of the system logging by changing the severity level and the storage location. The default is to log all messages up to debug level, that is, all system messages. By changing the severity level in the logging commands, you control the number of system messages logged. -
Page 56: Displaying The Logging Buffer And Logging Configuration
Displaying the Logging Buffer and Logging Configuration To display the current contents of the logging buffer and the logging settings for the system, enter the show command in EXEC privilege mode (Figure 5-1). logging Figure 5-1. show logging Command Example FTOS#show logging Syslog logging: enabled Console logging: level debugging... -
Page 57: Configuring A Unix Logging Facility Level
Configuring a UNIX Logging Facility Level You can save system log messages with a UNIX system logging facility. To configure a UNIX logging facility level, use the following command in CONFIGURATION mode: Command Syntax Command Mode Purpose logging facility [facility-type] CONFIGURATION Specify one of the following parameters. -
Page 58: Enabling Time Stamps On Syslog Messages
Enabling Time Stamps on Syslog Messages By default, syslog messages do not include a time/date stamp stating when the error or message was created. To have FTOS include a timestamp with the syslog message, use the following command syntax in CONFIGURATION mode: Command Syntax Command Mode... -
Page 59: Enabling The Ftp Server
Enabling the FTP Server To enable the system as an FTP server, use the following command in CONFIGURATION mode: Command Syntax Command Mode Purpose CONFIGURATION Enable FTP on the system. ftp-server enable To view the FTP configuration, enter the command in EXEC privilege mode show running-config ftp (Figure 5-3). -
Page 60: Terminal Lines
Terminal Lines You can access the system remotely and restrict access to the system by creating user profiles. The terminal lines on the system provide different means of accessing the system. The virtual terminal lines (VTY) connect you through Telnet to the system. Telnet to Another Network Device To telnet to another device (Figure... -
Page 61: Recovering From A Forgotten Password
Recovering from a Forgotten Password If you configure authentication for the console and you exit out of EXEC mode or your console session times out, you are prompted to re-enter the password. If you forget your password, follow these steps: Step Task Command Syntax... -
Page 62: Recovering From A Failed Start
Step Task Command Syntax Command Mode Set the system parameters to ignore ignore enable-password BOOT USER the enable password when the system reloads. reload Reload the system. BOOT USER Configure a new enable password. copy flash://startup-config.bak running-config EXEC Privilege Configure a new enable password. enable {secret | password) CONFIGURATION copy running-config startup-config... - Page 63 Net: nae-0: PHY is Broadcom BCM54616S IOM MAC Addr: 00:1E:C9:F1:00:99 Hit any key to stop autoboot: ***** Welcome to Dell Force10 Boot Interface ***** Use "help" or "?" for more information. BOOT_USER # BOOT_USER # boot change primary '-' = go to previous field;...
- Page 64 Aggregator Management...
-
Page 65: Data Center Bridging (Dcb)
DCB-enabled network is required in a data center. The Dell Force10 switches that support a unified fabric and consolidate multiple network infrastructures use a single input/output (I/O) device called a converged network adapter (CNA). -
Page 66: Priority-Based Flow Control
Data center bridging satisfies the needs of the following types of data center traffic in a unified fabric: • LAN traffic consists of a large number of flows that are generally insensitive to latency requirements, while certain applications, such as streaming video, are more sensitive to latency. Ethernet functions as a best-effort network that may drop packets in case of network congestion. -
Page 67: Enhanced Transmission Selection
Figure 6-1. Priority-Based Flow Control PFC is implemented as follows in the Dell Force10 operating software (FTOS): • PFC is supported on specified 802.1p priority traffic (dot1p 0 to 7) and is configured per interface. However, only two lossless queues are supported on an interface: one for FCoE converged traffic and one for SCSI storage traffic. - Page 68 Although you can configure strict-priority queue scheduling for a priority group, ETS introduces flexibility that allows the bandwidth allocated to each priority group to be dynamically managed according to the amount of LAN, storage, and server traffic in a flow. Unused bandwidth in a priority-group is dynamically allocated to other priority groups for which traffic is available to be scheduled.
-
Page 69: Data Center Bridging Exchange Protocol (Dcbx)
Data Center Bridging Exchange Protocol (DCBX) The data center bridging exchange (DCBX) protocol is enabled by default on any switch on which PFC or ETS are enabled. DCBX allows a switch to automatically discover DCB-enabled peers and exchange configuration information. PFC and ETS use DCBX to exchange and negotiate parameters with peer devices. -
Page 70: Data Center Bridging: Auto-Dcb-Enable Mode
Data Center Bridging: Auto-DCB-Enable Mode On an Aggregator in standalone mode, the default mode of operation for data center bridging on Ethernet ports is auto-DCB-enable mode. In this mode, Aggregator ports detect whether peer devices support converged enhanced Ethernet (CEE) or not, and enable DCBX and PFC or link-level flow control accordingly: •... -
Page 71: When Dcb Is Enabled
Figure 6-4. show interfaces Command Example: DCB disabled and Flow Control enabled FTOS#show interfaces tengigabitethernet 0/2 interface TenGigabitEthernet 0/2 mtu 12000 portmode hybrid switchport auto vlan flowcontrol rx on tx off dcb-policy input smux-dcb-in dcb-policy output smux-dcb-out protocol lldp advertise management-tlv system-name dcbx port-role auto-downstream no shutdown When DCB is Enabled... -
Page 72: Enabling Dcb On Next Reload
Enabling DCB on Next Reload To configure the Aggregator so that all interfaces come up with DCB enabled and flow control disabled, use the command. You must save the configuration change and reload the switch dcb enable on-next-reload for DCB to be enabled on all interfaces. Internal PFC buffers are automatically configured. Task Command Command Mode... -
Page 73: Qos Dot1P Traffic Classification And Queue Assignment
Layer 2 class maps: dot1p priorities are used to classify traffic in a class map and apply a service policy to an ingress port to map traffic to egress queues. Note: Dell Force10 does not recommend mapping all ingress traffic to a single queue when using PFC and ETS. Ingress traffic classification using the... -
Page 74: How Priority-Based Flow Control Is Implemented
How Priority-Based Flow Control is Implemented Priority-based flow control provides a flow control mechanism based on the 802.1p priorities in converged Ethernet traffic received on an interface and is enabled by default. As an enhancement to the existing Ethernet pause mechanism, PFC stops traffic transmission for specified priorities (CoS values) without impacting other priority classes. - Page 75 Enhanced Transmission Selection is Implemented Enhanced transmission selection (ETS) provides a way to optimize bandwidth allocation to outbound 802.1p classes of converged Ethernet traffic. Different traffic types have different service needs. Using ETS, groups within an 802.1p priority class are auto-configured to provide different treatment for traffic with different bandwidth, latency, and best-effort needs.
-
Page 76: Ets Operation With Dcbx
• When an ETS output policy is applied to an interface, ETS-configured scheduling and bandwidth allocation take precedence over any auto-configured settings in the QoS output policies. • ETS is enabled by default with the default ETS configuration applied (all dot1p priorities in the same group with equal bandwidth allocation). -
Page 77: Dcb Policies In A Switch Stack
DCB Policies in a Switch Stack A DCB input policy with PFC and ETS configuration is applied to all stacked ports in a switch stack or on a stacked switch. DCBX Operation The data center bridging exchange protocol (DCBX) is used by DCB devices to exchange configuration information with directly connected peers using the link layer discovery protocol (LLDP) protocol. -
Page 78: Dcbx Port Roles
DCBX Port Roles The following DCBX port roles are auto-configured on an Aggregator to propagate DCB configurations learned from peer DCBX devices internally to other switch ports: • Auto-upstream: The port advertises its own configuration to DCBX peers and receives its configuration from DCBX peers (ToR or FCF device). -
Page 79: Dcb Configuration Exchange
Note: On a DCBX port, application priority TLV advertisements are handled as follows: - The application priority TLV is transmitted only if the priorities in the advertisement match the configured PFC priorities on the port. - On auto-upstream and auto-downstream ports: - If a configuration source is elected, the ports send an application priority TLV based on the application priority TLV received on the configuration-source port. -
Page 80: Configuration Source Election
Configuration Source Election When an auto-upstream or auto-downstream port receives a DCB configuration from a peer, the port first checks to see if there is an active configuration source on the switch. • If a configuration source already exists, the received peer configuration is checked against the local port configuration. -
Page 81: Auto-Detection Of The Dcbx Version
Auto-Detection of the DCBX Version The Aggregator operates in auto-detection mode so that a DCBX port automatically detects the DCBX version on a peer port. Legacy CIN and CEE versions are supported in addition to the standard IEEE version 2.5 DCBX. A DCBX port detects a peer version after receiving a valid frame for that version. -
Page 82: Dcbx Prerequisites And Restrictions
Figure 6-7. DCBX Sample Topology DCBX Prerequisites and Restrictions • DCBX requires LLDP in both send (TX) and receive (RX) mode to be enabled on a port interface. If multiple DCBX peer ports are detected on a local DCBX interface, LLDP is shut down. •... -
Page 83: Dcbx Error Messages
DCBX Error Messages An error in DCBX operation is displayed using the following syslog messages: LLDP_MULTIPLE_PEER_DETECTED: DCBX is operationally disabled after detecting more than one DCBX peer on the port interface. LLDP_PEER_AGE_OUT: DCBX is disabled as a result of LLDP timing out on a DCBX peer interface. DSM_DCBX_PEER_VERSION_CONFLICT: A local port expected to receive the IEEE, CIN, or CEE version in a DCBX TLV from a remote peer but received a different, conflicting DCBX version. -
Page 84: Verifying Dcb Configuration
Verifying DCB Configuration Use the show commands in Table 6-2 to display DCB configurations and statistics. Table 6-2. Displaying DCB Configurations Command Output show dcb [stack-unit unit-number] (Figure 6-8) Displays data center bridging status, number of PFC-enabled ports, and number of PFC-enabled queues. On the master switch in a stack, you can specify a stack-unit number. -
Page 85: Field Description
Figure 6-10. show interfaces pfc summary Command Example FTOS# show interfaces tengigabitethernet 0/49 pfc summary Interface TenGigabitEthernet 0/49 Admin mode is on Admin is enabled Remote is enabled, Priority list is 4 Remote Willing Status is enabled Local is enabled Oper status is Recommended PFC DCBX Oper status is Up State Machine Type is Feature... - Page 86 Table 6-3. show interface pfc summary Command Description Field Description Remote is enabled, Priority list Operational status (enabled or disabled) of peer device for DCBX exchange of Remote Willing Status is PFC configuration with a list of the configured PFC priorities. enabled Willing status of peer device for DCBX exchange (Willing bit received in PFC TLV): enabled or disabled.
- Page 87 Figure 6-11. show interface ets summary Command Example FTOS(conf)# show interfaces tengigabitethernet 0/0 ets summary Interface TenGigabitEthernet 0/0 Max Supported TC Groups is 4 Number of Traffic Classes is 8 Admin mode is on Admin Parameters: ------------------ Admin is enabled TC-grp Priority# Bandwidth...
- Page 88 Figure 6-12. show interface ets detail Command Example FTOS# show interfaces tengigabitethernet 0/34 ets detail Interface TenGigabitEthernet 0/34 Max Supported PG is 4 Number of Traffic Classes is 8 Admin mode is on Admin Parameters : ------------------ Admin is enabled PG-grp Priority# Bandwidth...
- Page 89 Table 6-4. show interface ets detail Command Description Field Description Admin mode ETS mode: on or off. When on, the scheduling and bandwidth allocation configured in an ETS output policy or received in a DCBX TLV from a peer can take effect on an interface.
- Page 90 Figure 6-13. show stack-unit all stack-ports all pfc details Command Example FTOS# show stack-unit all stack-ports all pfc details stack unit 0 stack-port all Admin mode is On Admin is enabled, Priority list is 4-5 Local is enabled, Priority list is 4-5 Link Delay 45556 pause quantum 0 Pause Tx pkts, 0 Pause Rx pkts stack unit 1 stack-port all...
- Page 91 Figure 6-15. show interface dcbx detail Command Example FTOS# show interface tengigabitethernet 0/49 dcbx detail FTOS# show interface te 0/49 dcbx detail E-ETS Configuration TLV enabled e-ETS Configuration TLV disabled R-ETS Recommendation TLV enabled r-ETS Recommendation TLV disabled P-PFC Configuration TLV enabled p-PFC Configuration TLV disabled F-Application priority for FCOE enabled f-Application Priority for FCOE disabled...
- Page 92 Table 6-5. show interface dcbx detail Command Description Field Description Local DCBX Configured mode DCBX version configured on the port: CEE, CIN, IEEE v2.5, or Auto (port auto-configures to use the DCBX version received from a peer). Peer Operating version DCBX version that the peer uses to exchange DCB parameters.
-
Page 93: Example: Pfc And Ets Operation
Example: PFC and ETS Operation This section contains examples of DCB input and output policies applied on an interface. In the example shown in Figure 6-16 for an Aggregator: • Incoming SAN traffic is configured for priority-based flow control. • Outbound LAN, IPC, and SAN traffic is mapped into three ETS priority groups and configured for enhanced traffic selection (bandwidth allocation and scheduling). - Page 94 QoS Traffic Classification: On the Aggregator, the command has been used in service-class dynamic dot1p Global Configuration mode to map ingress dot1p frames to the queues shown in Table 6-6. For more information, refer to QoS dot1p Traffic Classification and Queue Assignment.
-
Page 95: Hierarchical Scheduling In Ets Output Policies
Table 6-8. Example: priority group-bandwidth Assignment Priority Group Bandwidth Assignment Hierarchical Scheduling in ETS Output Policies On an Aggregator, ETS supports up to three levels of hierarchical scheduling. For example, ETS output policies with the following configurations can be applied: •... - Page 96 Data Center Bridging (DCB)
-
Page 97: Dynamic Host Configuration Protocol (Dhcp)
Skippy812 Dynamic Host Configuration Protocol (DHCP) The Aggregator is auto-configured to operate as a DHCP client. The DHCP server, DHCP relay agent, and secure DHCP features are not supported. DHCP Overview Dynamic host configuration protocol (DHCP) is an application layer protocol that dynamically assigns IP addresses and other configuration parameters to network end-stations (hosts) based on configuration policies determined by network administrators. -
Page 98: Dhcp Packet Format And Options
DHCP Packet Format and Options DHCP uses the user datagram protocol (UDP) as its transport protocol. The server listens on port 67 and transmits to port 68; the client listens on port 68 and transmits to port 67. The configuration parameters are carried as options in the DHCP packet in type, length, value (TLV) format;... -
Page 99: Assigning An Ip Address Using Dhcp
Assigning an IP Address Using DHCP When a client joins a network: 1. The client initially broadcasts a DHCPDISCOVER message on the subnet to discover available DHCP servers. This message includes the parameters that the client requires and might include suggested values for those parameters. -
Page 100: Dhcp Client
FTOS Behavior: DHCP is implemented in FTOS based on RFC 2131 and 3046. DHCP Client An Aggregator is auto-configured to operate as a DHCP client. The DHCP client functionality is enabled only on the default VLAN and the management interface. A DHCP client is a network device that requests an IP address and configuration parameters from a DHCP server. -
Page 101: Releasing And Renewing Dhcp-Based Ip Addresses
Releasing and Renewing DHCP-based IP Addresses On an Aggregator configured as a DHCP client, you can release a dynamically-assigned IP address without removing the DHCP client operation on the interface. You can later manually acquire a new IP address from the DHCP server as follows: Task Command Syntax Command Mode... -
Page 102: Debugging Dhcp Client Operation
Figure 7-4. show ip dhcp lease FTOS# show ip dhcp Interface Lease-IP Def-Router ServerId State Lease Obtnd At Lease Expires At ========= ======== ========= ======== ===== ============== ================ Ma 0/0 0.0.0.0/0 0.0.0.0 0.0.0.0 INIT -----NA----- ----NA---- Vl 1 10.1.1.254/24 0.0.0.0 10.1.1.1 BOUND 08-26-2011 04:33:39... - Page 103 Figure 7-5. DHCP Client: Debug Messages Logged during DHCP Client Enabling/Disabling FTOS (conf-if-Ma-0/0)# ip address dhcp 1w2d23h: %STKUNIT0-M:CP %DHCLIENT-5-DHCLIENT-LOG: DHCLIENT_DBG_EVT: Interface Ma 0/0 :DHCP ENABLE CMD Received in state START 1w2d23h: %STKUNIT0-M:CP %DHCLIENT-5-DHCLIENT-LOG: DHCLIENT_DBG_EVT: Interface Ma 0/0 :Transitioned to state SELECTING 1w2d23h: %STKUNIT0-M:CP %DHCLIENT-5-DHCLIENT-LOG: DHCLIENT_DBG_PKT: DHCP DISCOVER sent in Interface Ma 0/0...
-
Page 104: How Dhcp Client Is Implemented
Figure 7-6 shows an example of the packet- and event-level debug messages displayed for the packet transmissions and state transitions on a DHCP client interface when you release and renew a DHCP client. Figure 7-6. DHCP Client: Debug Messages Logged during DHCP Client Release/Renew FTOS# release dhcp interface managementethernet 0/0 May 27 15:55:22: %STKUNIT0-M:CP %DHCLIENT-5-DHCLIENT-LOG: DHCLIENT_DBG_EVT: Interface Ma 0/0 : DHCP RELEASE CMD Received in state BOUND... -
Page 105: Dhcp Client On A Management Interface
DHCP Client on a Management Interface The following conditions apply on a management interface that operates as a DHCP client: • The management default route is added with the gateway as the router IP address received in the DHCP ACK packet. This is required to send and receive traffic to and from other subnets on the external network. -
Page 106: Dhcp Client On A Vlan
DHCP Client on a VLAN The following conditions apply on a VLAN that operates as a DHCP client: • The default VLAN 1 with all ports auto-configured as members is the only L3 interface on the Aggregator. • When the default management VLAN has a DHCP-assigned address and you reconfigure the default VLAN ID number, the Aggregator: •... -
Page 107: Fip Snooping
FIP Snooping FIP snooping is auto-configured on an Aggregator in standalone mode. You can display information on FIP snooping operation and statistics by entering commands. show This chapter describes FIP snooping concepts and configuration procedures: • Fibre Channel over Ethernet •... - Page 108 To ensure similar Fibre Channel robustness and security with FCoE in an Ethernet cloud network, the Fibre Channel over Ethernet initialization protocol (FIP) establishes virtual point-to-point links between FCoE end-devices (server ENodes and target storage devices) and FCoE forwarders (FCFs) over transit FCoE-enabled bridges.
-
Page 109: Fip Snooping On Ethernet Bridges
Figure 8-1. FIP discovery and login between an ENode and an FCF FIP Snooping on Ethernet Bridges In a converged Ethernet network, intermediate Ethernet bridges can snoop on FIP packets during the login process on an FCF. Then, using ACLs, a transit bridge can permit only authorized FCoE traffic to be transmitted between an FCoE end-device and an FCF. - Page 110 Dynamic ACL generation on an Aggregator operating as a FIP snooping bridge functions as follows: • Global ACLs are applied on server-facing ENode ports. • Port-based ACLs are applied on ports directly connected to an FCF and on server-facing ENode ports. •...
-
Page 111: Fip Snooping In A Switch Stack
In case of a failover, the new master switch starts the required timers for the FCoE database tables. Timers run only on the master stack unit. Note: As a best practice, Dell Force10 recommends that you do not configure FIP Snooping on a stacked Aggregator. -
Page 112: Fip Snooping On Vlans
FIP Snooping on VLANs FIP snooping is enabled globally on an Aggregator on all VLANs: • FIP frames are allowed to pass through the switch on the enabled VLANs and are processed to generate FIP snooping ACLs. • FCoE traffic is allowed on VLANs only after a successful virtual-link initialization (fabric login FLOGI) between an ENode and an FCF. -
Page 113: Fip Snooping Prerequisites
A FIP snooping bridge requires DCBX and PFC to be enabled on the switch for lossless Ethernet connections (refer to Data Center Bridging (DCB)). Dell recommends that you also enable ETS; ETS is recommended but not required. DCBX and PFC mode are auto-configured on Aggregator ports and FIP snooping is operational on the port. -
Page 114: Displaying Fip Snooping Information
Displaying FIP Snooping Information Use the commands in Table 8-1 to display information on FIP snooping. show Table 8-1. Displaying FIP Snooping Information Command Output show fip-snooping sessions [interface vlan Displays information on FIP-snooped sessions on all VLANs or a specified vlan-id] (Figure 8-3) - Page 115 Figure 8-3. show fip-snooping sessions Command Example FTOS#show fip-snooping sessions Enode MAC Enode Intf FCF MAC FCF Intf VLAN aa:bb:cc:00:00:00 Te 0/42 aa:bb:cd:00:00:00 Te 0/43 aa:bb:cc:00:00:00 Te 0/42 aa:bb:cd:00:00:00 Te 0/43 aa:bb:cc:00:00:00 Te 0/42 aa:bb:cd:00:00:00 Te 0/43 aa:bb:cc:00:00:00 Te 0/42 aa:bb:cd:00:00:00 Te 0/43 aa:bb:cc:00:00:00...
- Page 116 Figure 8-5. show fip-snooping enode Command Example FTOS# show fip-snooping enode Enode MAC Enode Interface FCF MAC VLAN FC-ID --------- --------------- ------- ---- ----- d4:ae:52:1b:e3:cd Te 0/11 54:7f:ee:37:34:40 62:00:11 Table 8-3. show fip-snooping enode Command Description Field Description ENode MAC MAC address of the ENode.
- Page 117 Figure 8-7. show fip-snooping statistics (VLAN and port) Command Example FTOS# show fip-snooping statistics interface vlan 100 Number of Vlan Requests Number of Vlan Notifications Number of Multicast Discovery Solicits Number of Unicast Discovery Solicits Number of FLOGI Number of FDISC Number of FLOGO Number of Enode Keep Alive :9021...
- Page 118 Figure 8-8. show fip-snooping statistics (port channel) Command Example FTOS# show fip-snooping statistics interface port-channel 22 Number of Vlan Requests Number of Vlan Notifications Number of Multicast Discovery Solicits Number of Unicast Discovery Solicits Number of FLOGI Number of FDISC Number of FLOGO Number of Enode Keep Alive Number of VN Port Keep Alive...
- Page 119 Table 8-5. show fip-snooping statistics Command Descriptions Field Description Number of Vlan Requests Number of FIP-snooped VLAN request frames received on the interface. Number of VLAN Notifications Number of FIP-snooped VLAN notification frames received on the interface. Number of Multicast Discovery Number of FIP-snooped multicast discovery solicit frames received on the Solicits interface.
- Page 120 Figure 8-9. show fip-snooping system Command Example FTOS# show fip-snooping system Global Mode : Enabled FCOE VLAN List (Operational) : 1, 100 FCFs Enodes Sessions : 17 Note: NPIV sessions are included in the number of FIP-snooped sessions displayed. Figure 8-10. show fip-snooping vlan Command Example FTOS# show fip-snooping vlan * = Default VLAN VLAN...
-
Page 121: Fip Snooping Example
FIP Snooping Example Figure 8-11 shows an Aggregator used as a FIP snooping bridge for FCoE traffic between an ENode (server blade) and an FCF (ToR switch). The ToR switch operates as an FCF and FCoE gateway. Figure 8-11. Example: FIP Snooping on an Aggregator Figure 8-11, DCBX and PFC are enabled on the Aggregator (FIP snooping bridge) and on the FCF ToR switch. -
Page 122: Debugging Fip Snooping
Debugging FIP Snooping To enable debug messages for FIP snooping events, enter the command. debug fip-snooping Task Command Command Mode Enable FIP snooping debugging on for all or a debug fip-snooping [all | acl | error | EXEC PRIVILEGE ifm | info | ipc | rx] specified event type, where: enables all debugging options. -
Page 123: Internet Group Management Protocol (Igmp)
Internet Group Management Protocol (IGMP) On an Aggregator, IGMP snooping is auto-configured. You can display information on IGMP by using commands. show Multicast is based on identifying many hosts by a single destination IP address. Hosts represented by the same IP address are a multicast group. The internet group management protocol (IGMP) is a Layer 3 multicast protocol that hosts use to join or leave a multicast group. -
Page 124: Joining A Multicast Group
Figure 9-1. IGMP Version 2 Packet Format Padding Preamble Start Frame Destination MAC Source MAC Ethernet Type IP Packet Delimiter Version Total Length Flags Frag Offset Protocol Header Src IP Addr Dest IP Addr Options Padding IGMP Packet (0xc0) Checksum (Router Alert) Max. -
Page 125: Igmp Version 3
IGMP Version 3 Conceptually, IGMP version 3 behaves the same as version 2. However, there are differences: • Version 3 adds the ability to filter by multicast source, which helps the multicast routing protocols avoid forwarding traffic to subnets where there are no interested receivers. •... -
Page 126: Joining And Filtering Groups And Sources
Joining and Filtering Groups and Sources Figure 9-4 shows how multicast routers maintain the group and source information from unsolicited reports. 1. The first unsolicited report from the host indicates that it wants to receive traffic for group 224.1.1.1. 2. The host’s second report indicates that it is only interested in traffic from group 224.1.1.1, source 10.11.1.1. -
Page 127: Leaving And Staying In Groups
Leaving and Staying in Groups Figure 9-5 shows how multicast routers track and refresh state changes in response to group-and-specific and general queries. 1. Host 1 sends a message indicating it is leaving group 224.1.1.1 and that the included filter for 10.11.1.1 and 10.11.1.2 are no longer necessary. -
Page 128: How Igmp Snooping Is Implemented On An Aggregator
How IGMP Snooping is Implemented on an Aggregator • IGMP snooping is enabled by default on the switch. • FTOS supports version 1, version 2, and version 3 hosts. • FTOS IGMP snooping is based on the IP multicast address (not on the Layer 2 multicast MAC address). - Page 129 Figure 9-6. show ip igmp groups Command Example FTOS# show ip igmp groups Total Number of Groups: 2 IGMP Connected Group Membership Group Address Interface Mode Uptime Expires Last Reporter 226.0.0.1 Vlan 1500 INCLUDE 00:00:19 Never 1.1.1.2 226.0.0.1 Vlan 1600 INCLUDE 00:00:02 Never...
- Page 130 Figure 9-7. show ip igmp interface Command Example FTOS# show ip igmp interface Vlan 2 is up, line protocol is down Inbound IGMP access group is not set Interface IGMP group join rate limit is not set IGMP snooping is enabled on interface IGMP Snooping query interval is 60 seconds IGMP Snooping querier timeout is 125 seconds IGMP Snooping last member query response interval is 1000 ms...
-
Page 131: Interfaces
Interfaces This chapter describes the auto-configuration of 1 Gigabit and 10 Gigabit Ethernet interfaces (physical and logical) on an Aggregator. Basic Interface Configuration: • Interface Auto-Configuration • Interface Types • Viewing Interface Information • Disabling and Re-enabling a Physical Interface •... -
Page 132: Interface Auto-Configuration
Interface Auto-Configuration An Aggregator auto-configures interfaces as follows: • All interfaces operate as layer 2 interfaces at 10GbE in standalone mode. FlexIO module interfaces support only uplink connections. Only the 40GbE ports on the base module can be used for stacking. •... -
Page 133: Viewing Interface Information
Viewing Interface Information You can use show commands to view interface status and auto-configured parameters. command in EXEC mode lists all configurable interfaces on the chassis and has options show interfaces to display the interface status, IP and MAC addresses, and multiple counters for the amount and type of traffic passing through the interface. - Page 134 Use the command in EXEC Privilege mode to view which interfaces are enabled for show ip interfaces brief Layer 3 data transmission. In Figure 10-2, the TenGigabitEthernet interface 1/5 is in Layer 3 mode because an IP address has been assigned to it and the interface’s status is operationally up. Figure 10-2.
-
Page 135: Disabling And Re-Enabling A Physical Interface
Disabling and Re-enabling a Physical Interface By default, all port interfaces on an Aggregator are operationally enabled (no shutdown) to send and receive Layer 2 traffic. You can reconfigure a physical interface to shut it down by entering the shutdown command. -
Page 136: Layer 2 Mode
Layer 2 Mode On an Aggregator, physical interfaces, port channels, and VLANs auto-configure to operate in Layer 2 mode. Figure 10-4 shows the basic configuration found in a Layer 2 interface. Note: Layer 3 (network) mode is not supported on Aggregator physical interfaces, port channels, and VLANs. -
Page 137: Configuring A Management Interface
The Aggregator supports the management ethernet interface as well as the standard interface on any front-end port. You can use either method to connect to the system. Configuring a Management Interface On the Aggregator, the dedicated management interface provides management access to the system.You can configure this interface with FTOS, but the configuration options on this interface are limited. - Page 138 To display the configuration for a given port, use the command from EXEC Privilege mode show interface (Figure 10-5). To display the routing table for a given port, use the command from EXEC Privilege mode. show ip route Figure 10-5. Viewing Management Routes FTOS#show interface tengigabit 0/46 TenGigabitEthernet 0/4 is up, line protocol is up Port is part of Port-channel 1...
-
Page 139: Configuring A Static Route For A Management Interface
Configuring a Static Route for a Management Interface When an IP address used by a protocol and a static management route exists for the same prefix, the protocol route takes precedence over the static management route. To configure a static route for the management port, use the following command in CONFIGURATION mode: Command Syntax Command Mode... -
Page 140: Vlan Membership
VLAN Membership A virtual LAN (VLANs) is a logical broadcast domain or logical grouping of interfaces in a LAN in which all data received is kept locally and broadcast to all members of the group. In Layer 2 mode, VLANs move traffic at wire speed and can span multiple devices. -
Page 141: Port-Based Vlans
Port-Based VLANs Port-based VLANs are a broadcast domain defined by different ports or interfaces. In FTOS, a port-based VLAN can contain interfaces from different stack units within the chassis. FTOS supports 4094 port-based VLANs. Port-based VLANs offer increased security for traffic, conserve bandwidth, and allow switch segmentation. -
Page 142: Configuring Vlan Membership
Configuring VLAN Membership By default, all Aggregator ports are member of all (4094) VLANs, including the default untagged VLAN 1. You can use the CLI or CMC interface to reconfigure VLANs only on server-facing interfaces (1 to 32) so that an interface has membership only in specified VLANs. To assign an Aggregator interface in Layer 2 mode to a specified group of VLANs, use the vlan tagged commands. -
Page 143: Displaying Vlan Membership
Displaying VLAN Membership To view the configured VLANs, enter the command in EXEC privilege mode: show vlan Figure 10-8. show vlan Command Example FTOS#show vlan Codes: * - Default VLAN, G - GVRP VLANs, R - Remote Port Mirroring VLANs, P - Primary, C - Community, I - Isolated Q: U - Untagged, T - Tagged x - Dot1x untagged, X - Dot1x tagged... -
Page 144: Adding An Interface To A Tagged Vlan
Adding an Interface to a Tagged VLAN Figure 10-9 shows an example of how to add a tagged interface (port channel 1) to a VLAN (VLAN 4). Figure 10-9. Adding an Interface to Another VLAN FTOS(conf-if-te-1/7)# vlan tagged 2 Enter the vlan tagged command to add interface Te 1/7 to VLAN 4. FTOS(conf-if-te-1/7)# exit FTOS(conf)# exit Enter the show vlan command to verify that interface Te 1/7 is a... -
Page 145: Port Channel Interfaces
Adding an Interface to an Untagged VLAN To move an untagged interfaces from the default VLAN to another VLAN, use the command vlan untagged as shown in Figure 10-10. Figure 10-10. Moving an Untagged Interface to Another VLAN FTOS(conf)# interface tengigabit 0/16 Enter the vlan untagged command to add interface Te 0/16 FTOS(conf-if-te-0/16)# vlan untagged 4 as an untagged member of VLAN 4. -
Page 146: Port Channel Definition And Standards
Port Channel Definition and Standards Link aggregation is defined by IEEE 802.3ad as a method of grouping multiple physical interfaces into a single logical interface—a link aggregation group (LAG) or port channel. A LAG is “a group of links that appear to a MAC client as if they were a single link”... -
Page 147: Gbe And 10Gbe Interfaces In Port Channels
Port channels can contain a mix of 100, 1000, or 10000 Mbps Ethernet interfaces and TenGigabit Ethernet interfaces. The interface speed (100, 1000, or 10000 Mbps) used by the port channel is determined by the first port channel member that is physically up. FTOS disables the interfaces that do not match the interface speed set by the first channel member. -
Page 148: Displaying Port Channel Information
Displaying Port Channel Information To view the port channel’s status and channel members in a tabular format, use the show interfaces command in EXEC Privilege mode (Figure 10-11). port-channel brief Figure 10-11. show interfaces port-channel brief Command Example FTOS#show int port brief Codes: L - LACP Port-channel Mode Status... - Page 149 Figure 10-12. show interface port-channel Command Example FTOS#show interface port-channel Port-channel 1 is a dynamically-created port channel based on the Port-channel 1 is up, line protocol is up NIC teaming configuration in connected servers learned via LACP. Created by LACP protocol Hardware address is 00:1e:c9:f1:03:58, Current address is 00:1e:c9:f1:03:58 Interface index is 1107755009 Minimum number of links to bring Port-channel up is 1...
-
Page 150: Interface Range
Interface Range An interface range is a set of interfaces to which other commands may be applied, and may be created if there is at least one valid interface within the range. Bulk configuration excludes from configuring any non-existing interfaces from an interface range. A default VLAN may be configured only if the interface range being configured consists of only VLAN ports. -
Page 151: Create A Multiple-Range
Create a Multiple-Range Figure 10-14. Creating a Multiple-Range Prompt FTOS(conf)#interface range tengigabitethernet 3/0 , tengigabitethernet 2/1 - 47 , vlan 1000 FTOS(conf-if-range-te-2/1-47)# Exclude a Smaller Port Range If the interface range has multiple port ranges, the smaller port range is excluded from the prompt. Figure 10-15. - Page 152 - Quit Figure 10-18. Command Example monitor interface FTOS#monitor interface tengig 3/1 Dell Force10 uptime is 1 day(s), 4 hour(s), 31 minute(s) Monitor time: 00:00:00 Refresh Intvl.: 2s Interface: TenGig 3/1, Disabled, Link is Down, Linespeed is 1000 Mbit Traffic statistics:...
-
Page 153: Maintenance Using Tdr
Maintenance Using TDR The time domain reflectometer (TDR) is supported on all Dell Force10 switch/routers. TDR is an assistance tool to resolve link issues that helps detect obvious open or short conditions within any of the four copper pairs. TDR sends a signal onto the physical cable and examines the reflection of the signal that returns. -
Page 154: Flow Control Using Ethernet Pause Frames
Flow Control Using Ethernet Pause Frames An Aggregator auto-configures to operate in auto-DCB-enable mode (see Data Center Bridging: Auto-DCB-Enable Mode). In this mode, Aggregator ports detect whether peer devices support converged enhanced Ethernet (CEE) or not, and enable DCBX and PFC or link-level flow control accordingly: •... -
Page 155: Mtu Size
MTU Size The Aggregator auto-configures interfaces to use a maximum MTU size of 12,000 bytes. If a packet includes a Layer 2 header, the difference in bytes between the link MTU and IP MTU must be enough to include the Layer 2 header. For example, for VLAN packets, if the IP MTU is 1400, the link MTU must be no less than 1422: 1400-byte IP MTU + 22-byte VLAN Tag = 1422-byte link MTU The MTU range is 592-12000, with a default of 1554. -
Page 156: Auto-Negotiation On Ethernet Interfaces
Auto-negotiation is the easiest way to accomplish these settings, as long as the remote interface is capable of auto-negotiation. Note: As a best practice, Dell Force10 recommends keeping auto-negotiation enabled. Auto-negotiation should only be disabled on switch ports that attach to devices not capable of supporting negotiation or where connectivity issues arise from interoperability issues. -
Page 157: Setting Auto-Negotiation Options
Figure 10-19. show interfaces status Command Example FTOS#show interfaces status Port Description Status Speed Duplex Vlan Te 0/1 Down Auto Auto Te 0/2 Down Auto Auto Te 0/3 Down Auto Auto Te 0/4 Down Auto Auto Te 0/5 Down Auto Auto Te 0/6 Down... - Page 158 speed 100 interface-config Supported Not supported Not supported % Error: Speed mode (Error (Error message is 100 not message is thrown) supported on thrown) (% Error: Speed 100 this interface, (% Error: not supported on this Speed 100 not interface, config supported on ignored Te 0/49) this interface,...
-
Page 159: Displaying Non-Default Configurations
Figure 10-21 shows the auto-negotiation options. Figure 10-21. Setting Auto-Negotiation Options FTOS(conf)# int tengig 0/0 FTOS(conf-if)#neg auto FTOS(conf-if-autoneg)# ? Exit from configuration mode exit Exit from autoneg configuration mode mode Specify autoneg mode Negate a command or set its defaults show Show autoneg configuration information FTOS(conf-if-autoneg)#mode ? - Page 160 In EXEC mode, the command displays only interfaces in Layer 2 mode and their show interfaces switchport relevant configuration information. The command (Figure 10-23) displays the show interfaces switchport interface, whether the interface supports IEEE 802.1Q tagging or not, and the VLANs to which the interface belongs.
-
Page 161: Clearing Interface Counters
Clearing Interface Counters The counters in the command are reset by the command. This command does show interfaces clear counters not clear the counters captured by any SNMP program. To clear the counters, use the following command in EXEC Privilege mode: Command Syntax Command Mode Purpose... - Page 162 Interfaces...
-
Page 163: Iscsi Optimization
In a data center network, Dell EqualLogic and Compellent iSCSI storage arrays are connected to a converged Ethernet network using the data center bridging exchange protocol (DCBX) through stacked and/or non-stacked Ethernet switches. -
Page 164: Monitoring Iscsi Traffic Flows
Figure 11-1. iSCSI Optimization Example Monitoring iSCSI Traffic Flows The switch snoops iSCSI session-establishment and termination packets by installing classifier rules that trap iSCSI protocol packets to the CPU for examination. Devices that initiate iSCSI sessions usually use well-known TCP ports 3260 or 860 to contact targets. When you enable iSCSI optimization, by default the switch identifies IP packets to or from these ports as iSCSI traffic. -
Page 165: Detection And Autoconfiguration For Dell Equallogic Arrays
Link Layer Discovery Protocol (LLDP). The following message is displayed the first time a Dell EqualLogic array is detected and describes the configuration changes that are automatically performed: %STKUNIT0-M:CP %IFMGR-5-IFM_ISCSI_AUTO_CONFIG: This switch is being configured for optimal conditions to support iSCSI traffic which will cause some automatic configuration to occur including jumbo frames and flow-control on all ports;... -
Page 166: Iscsi Optimization: Operation
The Aggregator auto-configures as follows: • Jumbo frame size is set to 12000 for all interfaces on all ports and port-channels, if it is not already enabled. • Unicast storm control is disabled on the interface identified by LLDP. iSCSI Optimization: Operation When the Aggregator auto-configures with iSCSI enabled, the following actions occur: •... -
Page 167: Displaying Iscsi Optimization Information
Displaying iSCSI Optimization Information Use the commands in Table 11-2 to display information on iSCSI optimization. show Table 11-2. Displaying iSCSI Optimization Information Command Output show iscsi (Figure 11-2) Displays the currently configured iSCSI settings. show iscsi sessions (Figure 11-3) Displays information on active iSCSI sessions on the switch. - Page 168 Figure 11-4. show iscsi sessions detailed Command Example FTOS# show isci sessions detailed Session 0 ----------------------------------------------------------------------------- Target:iqn.2010-11.com.ixia:ixload:iscsi-TG1 Initiator:iqn.2010-11.com.ixia.ixload:initiator-iscsi-2c Up Time:00:00:01:28(DD:HH:MM:SS) Time for aging out:00:00:09:34(DD:HH:MM:SS) ISID:806978696102 Initiator Initiator Target Target Connection IP Address TCP Port IP Address TCPPort 10.10.0.44 33345 10.10.0.101 3260 Session 1 -----------------------------------------------------------------------------...
-
Page 169: How The Lacp Is Implemented On An Aggregator
Note: A link aggregation group is referred to as a port channel by the Dell Force10 operating software A LAG provides both load-sharing and port redundancy across stack units. An Aggregator supports LACP for the auto-configuration of dynamic LAGs. -
Page 170: Server-Facing Lags
Server-Facing LAGs Server-facing ports are configured as individual ports by default. If a server NIC is configured for LACP-based NIC teaming, server-facing ports are automatically configured as part of dynamic LAGs. The LAG range 1 to127 is reserved for server-facing LAGs. Once the Aggregator receives LACPDU from server-facing ports, the information embedded in the LACPDU (remote-system ID and port key) is used to form a server-facing LAG. -
Page 171: Lacp Example
LACP Example Figure 12-1 shows an example of how LACP operates in an Aggregator stack by auto-configuring the uplink LAG 128 for the connection to a ToR switch and a server-facing LAG for the connection to an installed server that is configured for LACP-based NIC teaming. Figure 12-1. -
Page 172: Verifying Lacp Operation And Lag Configuration
Verifying LACP Operation and LAG Configuration To verify the operational status and configuration of a dynamically created LAG, and LACP operation on a LAG on an Aggregator, enter the show interfaces port-channel port-channel-number show lacp commands. port-channel-number outputs in this section for uplink LAG 128 and server-facing LAG 1 refer to the example shown show Figure 12-1. - Page 173 Figure 12-3. show lacp 128 Command Example FTOS# show lacp 128 Port-channel 128 admin up, oper up, mode lacp Actor System ID: Priority 32768, Address 0001.e8e1.e1c3 Partner System ID: Priority 32768, Address 0001.e88b.253d Actor Admin Key 128, Oper Key 128, Partner Oper Key 128, VLT Peer Oper Key 128 LACP LAG 128 is an aggregatable link LACP LAG 128 is a normal LAG A - Active LACP, B - Passive LACP, C - Short Timeout, D - Long Timeout...
- Page 174 Figure 12-4. show lacp 128 Command Example (Continued) Port Te 0/48 is disabled, LACP is disabled and mode is lacp Port State: Bundle Actor Admin: State ADEHJLMP Key 128 Priority 32768 Oper: State ADEHJLMP Key 128 Priority 32768 Partner is not present Port Te 0/49 is disabled, LACP is disabled and mode is lacp Port State: Bundle Actor...
- Page 175 Figure 12-5. show interfaces port-channel 1 Command Example FTOS# show interfaces port-channel 1 Port-channel 1 is up, line protocol is up Created by LACP protocol Hardware address is 00:01:e8:e1:e1:c1, Current address is 00:01:e8:e1:e1:c1 Interface index is 1107755009 Minimum number of links to bring Port-channel up is 1 Internet address is not set Mode of IP Address Assignment : NONE DHCP Client-ID :lag10001e8e1e1c1...
- Page 176 Link Aggregation...
-
Page 177: Layer
Layer 2 The Aggregator supports CLI commands to manage the MAC address table: • Clearing MAC Address Entries • Displaying the MAC Address Table The Aggregator auto-configures with support for Network Interface Controller (NIC) Teaming. Note: On an Aggregator, all ports are configured by default as members of all (4094) VLANs, including the default VLAN. -
Page 178: Displaying The Mac Address Table
Task Command Syntax Command Mode clear mac-address-table dynamic Clear a MAC address table of dynamic entries. EXEC Privilege {address | all | interface | vlan} • deletes the specified entry address • deletes all dynamic entries • interface deletes all entries for the specified interface •... -
Page 179: Mac Address Station Move
Figure 13-1. Redundant NICs with NIC Teaming Port 0/1 MAC: A:B A:B:C:D IP: 1.1.1.1 Port 0/5 fnC0025mp MAC Address Station Move When you use NIC teaming, consider that the server MAC address is originally learned on Port 0/1 of the switch (Figure 13-2). - Page 180 Layer 2...
-
Page 181: Link Layer Discovery Protocol (Lldp)
Link Layer Discovery Protocol (LLDP) An Aggregator auto-configures to support the link layer discovery protocol (LLDP) for the auto-discovery of network devices. You can use CLI commands to display acquired LLDP information, clear LLDP counters, and debug LACP operation. Overview LLDP—defined by IEEE 802.1AB—is a protocol that enables a local area network (LAN) device to advertise its configuration and receive configuration information from adjacent LLDP-enabled LAN infrastructure devices. -
Page 182: Optional Tlvs
System Name System Description Management Addr Organizationally Specific End of LLDPDU fnC0047mp Optional TLVs The Dell Force10 operating software (FTOS) supports the following optional TLVs: • Management TLVs • IEEE 802.1 and 802.3 Organizationally Specific TLVs • TIA-1057 Organizationally Specific TLVs Management TLVs A Management TLV is an Optional TLVs sub-type. -
Page 183: Organizationally Specific Tlvs
On Dell Force10 systems, indicates the untagged VLAN to which a port belongs. Port and Protocol VLAN ID On Dell Force10 systems, indicates the tagged VLAN to which a port belongs (and the untagged VLAN to which a port belongs if the port is in hybrid mode). VLAN Name Indicates the user-defined alphanumeric string that identifies the VLAN. -
Page 184: Tia-1057 (Lldp-Med) Overview
(non-configurable) in the LLDP-MED implementation. Power via MDI Dell Force10 supports the LLDP-MED protocol, which recommends that Power via MDI TLV is not implemented, and therefore Dell Force10 implements Extended Power via MDI TLV only. Link Aggregation Indicates whether the link is capable of being aggregated, whether it is currently in a LAG, and the port identification of the LAG. -
Page 185: Tia Organizationally Specific Tlvs
TIA Organizationally Specific TLVs The Dell Force10 system is an LLDP-MED Network Connectivity Device (Device Type 4). Network connectivity devices are responsible for: • transmitting an LLDP-MED capabilities TLV to endpoint devices • storing the information that endpoint devices advertise Table 14-3 list the five types of TIA-1057 Organizationally Specific TLVs. -
Page 186: Lldp-Med Capabilities Tlv
• The possible values of the LLDP-MED Device Type is listed in Table 14-5. The Dell Force10 system is a Network Connectivity device, which is Type 4. When you enable LLDP-MED in FTOS (using the command), the system begins transmitting advertise med this TLV. -
Page 187: Lldp-Med Network Policies Tlv
LLDP-MED Network Policies TLV A network policy in the context of LLDP-MED is a device’s virtual local area network (VLAN) configuration and associated Layer 2 and Layer 3 configurations, specifically: • VLAN ID • VLAN tagged or untagged status • Layer 2 priority •... -
Page 188: Extended Power Via Mdi Tlv
MDI on all ports that are connected to an 802.3af powered, LLDP-MED endpoint device. • Power Type—there are two possible power types: power sourcing entity (PSE) or power device (PD). The Dell Force10 system is a PSE, which corresponds to a value of 0, based on the TIA-1057 specification. •... -
Page 189: Lldp Operation
LLDP Operation On an Aggregator, LLDP operates as follows: • LLDP is enabled by default. • LLDPDUs are transmitted and received by default. LLDPDUs are transmitted periodically. The default interval is 30 seconds. • LLDPDU information received from a neighbor expires after the default Time to Live (TTL) value: 120 seconds. -
Page 190: Viewing Information Advertised By Adjacent Lldp Agents
Viewing Information Advertised by Adjacent LLDP Agents To display brief information about adjacent devices, use the command (Figure 14-9). To show lldp neighbors display all of the information that neighbors are advertising, use the command show lldp neighbors detail (Figure 14-10). - Page 191 Figure 14-10. Viewing All Information Advertised by Adjacent LLDP Agent FTOS#show lldp neighbors detail ======================================================================== Local Interface Te 0/2 has 1 neighbor Total Frames Out: 16843 Total Frames In: 17464 Total Neighbor information Age outs: 0 Total Multiple Neighbors Detected: 0 Total Frames Discarded: 0 Total In Error Frames: 0 Total Unrecognized TLVs: 0...
-
Page 192: Clearing Lldp Counters
Clearing LLDP Counters You can clear LLDP statistics that are maintained on an Aggregator for LLDP counters for frames transmitted to and received from neighboring devices on all or a specified physical interface. To clear LLDP counters, enter the command. clear lldp counters Command Syntax Command Mode... -
Page 193: Debugging Lldp
Debugging LLDP command allows you to view the TLVs that your system is sending and receiving. debug lldp • Use the command to view a readable version of the TLVs. debug lldp brief • Use the command to view a readable version of the TLVs plus a hexadecimal version of debug lldp detail the entire LLDPDU. -
Page 194: Relevant Management Objects
Relevant Management Objects FTOS supports all IEEE 802.1AB MIB objects. • Table 14-7 lists the objects associated with received and transmitted TLVs. • Table 14-8 lists the objects associated with the LLDP configuration on the local agent. • Table 14-9 lists the objects associated with IEEE 802.1AB Organizationally Specific TLVs. - Page 195 Table 14-8. LLDP System MIB Objects TLV Type TLV Name TLV Variable System LLDP MIB Object Chassis ID chassis ID subtype Local lldpLocChassisIdSubtype Remote lldpRemChassisIdSubtype chassid ID Local lldpLocChassisId Remote lldpRemChassisId Port ID port subtype Local lldpLocPortIdSubtype Remote lldpRemPortIdSubtype port ID Local lldpLocPortId Remote...
- Page 196 Table 14-9. LLDP 802.1 Organizationally Specific TLV MIB Objects TLV Type TLV Name TLV Variable System LLDP MIB Object Port-VLAN ID PVID Local lldpXdot1LocPortVlanId Remote lldpXdot1RemPortVlanId Port and Protocol port and protocol VLAN supported Local lldpXdot1LocProtoVlanSupported VLAN ID Remote lldpXdot1RemProtoVlanSupported port and protocol VLAN enabled Local lldpXdot1LocProtoVlanEnabled...
- Page 197 Table 14-10. LLDP-MED System MIB Objects TLV Sub-Type TLV Name TLV Variable System LLDP-MED MIB Object Network Policy Application Type Local lldpXMedLocMediaPolicyApp Type Remote lldpXMedRemMediaPolicyAp pType Unknown Policy Flag Local lldpXMedLocMediaPolicyUnk nown Remote lldpXMedLocMediaPolicyUnk nown Tagged Flag Local lldpXMedLocMediaPolicyTag Remote lldpXMedLocMediaPolicyTag VLAN ID Local...
- Page 198 Table 14-10. LLDP-MED System MIB Objects TLV Sub-Type TLV Name TLV Variable System LLDP-MED MIB Object Extended Power via Power Device Type Local lldpXMedLocXPoEDeviceTyp Remote lldpXMedRemXPoEDeviceTy Power Source Local lldpXMedLocXPoEPSEPower Source, lldpXMedLocXPoEPDPowerS ource Remote lldpXMedRemXPoEPSEPowe rSource, lldpXMedRemXPoEPDPower Source Power Priority Local lldpXMedLocXPoEPDPowerP riority,...
-
Page 199: Port Monitoring
Port Monitoring The Aggregator supports user-configured port monitoring. See Configuring Port Monitoring for the configuration commands to use. Port monitoring copies all incoming or outgoing packets on one port and forwards (mirrors) them to another port. The source port is the monitored port (MD) and the destination port is the monitoring port (MG). -
Page 200: Port Monitoring
Port Monitoring The Aggregator supports multiple source-destination statements in a monitor session, but there may only be one destination port in a monitoring session (Message Message 2 One Destination Port in a Monitoring Session Error Message % Error: Only one MG port is allowed in a session. The number of source ports supported in a port pipe is equal to the number of physical ports in the port pipe. - Page 201 Figure 15-2 shows ports 0/25 and 0/26 that belong to port pipe 1 with a maximum of four destination ports. Figure 15-2. Number of Monitoring Ports FTOS(conf-mon-sess-300)#do show mon session SessionID Source Destination Direction Mode Type --------- ------ ----------- --------- ---- ---- TenGig 0/13...
-
Page 202: Configuring Port Monitoring
Configuring Port Monitoring To configure port monitoring, use the following example: Step Task Command Syntax Command Mode Verify that the intended monitoring port has no show interface EXEC Privilege configuration other than (Figure 15-3). no shutdown monitor session Create a monitoring session using the command monitor CONFIGURATION session from CONFIGURATION mode (Figure... - Page 203 Figure 15-4, the host and server are exchanging traffic which passes through the uplink interface 1/1. Port 1/1 is the monitored port and port 1/42 is the destination port, which is configured to only mirror traffic received on tengigabitethernet 1/1 (host-originated traffic). Figure 15-4.
- Page 204 Port Monitoring...
-
Page 205: Simple Network Management Protocol (Snmp)
Simple Network Management Protocol (SNMP) Network management stations use the Simple Network Management Protocol (SNMP) to retrieve or alter management data from network elements. A datum of management information is called a managed object; the value of a managed object can be static or variable. Network elements store managed objects in a database called a Management Information Base (MIB). -
Page 206: Setting Up Snmp
Setting up SNMP FTOS supports SNMP version 1 and version 2 which are community-based security models. The primary difference between the two versions is that version 2 supports two additional protocol operations (informs operation and query) and one additional object (counter64 object). snmpgetbulk Creating a Community For SNMPv1 and SNMPv2, you must create a community to enable the community-based security in... - Page 207 SNMPv2-MIB::sysDescr.0 = STRING: Dell Force10 OS Operating System Version: 1.0 Application Software Version: E8-3-17-46 Series: I/O-Aggregator Copyright (c) 1999-2012 by Dell Inc. All Rights Reserved. Build Time: Sat Jul 28 03:20:24 PDT 2012 SNMPv2-MIB::sysObjectID.0 = OID: SNMPv2-SMI::enterprises.6027.1.4.2 DISMAN-EVENT-MIB::sysUpTimeInstance = Timeticks: (77916) 0:12:59.16 SNMPv2-MIB::sysContact.0 = STRING:...
-
Page 208: Displaying The Ports In A Vlan Using Snmp
Displaying the Ports in a VLAN Using SNMP FTOS identifies VLAN interfaces using an interface index number that is displayed in the output of the command as shown in Figure 16-5. show interface vlan Figure 16-5. Identifying the VLAN Interface Index Number FTOS(conf)#do show interface vlan 10 Vlan 10 is down, line protocol is down Address is 00:01:e8:cc:cc:ce, Current address is 00:01:e8:cc:cc:ce... -
Page 209: Fetching Dynamic Mac Entries Using Snmp
16-7, Port 0/2 is added to VLAN 10 as untagged. And the first hex pair changes from 00 to 04. Figure 16-7. Displaying Ports in a VLAN using SNMP [Dell Force10 system output] FTOS(conf)#do show vlan id 10 Codes: * - Default VLAN, G - GVRP VLANs... - Page 210 The value of dot1dTpFdbPort is the port number of the port off which the system learns the MAC address. In this case, of TenGigabitEthernet 1/21, the manager returns the integer 118. Figure 16-8. Fetching Dynamic MAC Addresses on the Default VLAN -----------------------------MAC Addresses on Dell Force10 System------------------------------- FTOS#show mac-address-table...
-
Page 211: Deriving Interface Indices
16-11. Figure 16-11. Display the Interface Index Number FTOS#show interface tengig 1/21 TenGigabitEthernet 1/21 is up, line protocol is up Hardware is Dell Force10Eth, address is 00:01:e8:0d:b7:4e Current address is 00:01:e8:0d:b7:4e Interface index is 72925242 [output omitted] The interface index is a binary number with bits that indicate the slot number, port number, interface type, and card type of the interface. - Page 212 Figure 16-13. Binary Representation of Interface Index For interface indexing, slot and port numbering begins with binary one. If the Dell Force10 system begins slot and port numbering from 0, then binary 1 represents slot and port 0. In S4810, the first interface is 0/0, but in the Aggregator the first interface is 0/1.
-
Page 213: Monitor Port-Channels
Monitor Port-channels To check the status of a Layer 2 port-channel, use f10LinkAggMib (.1.3.6.1.4.1.6027.3.2). Below, Po 1 is a switchport and Po 2 is in Layer 3 mode. [senthilnathan@lithium ~]$ snmpwalk -v 2c -c public 10.11.1.1 .1.3.6.1.4.1.6027.3.2.1.1 SNMPv2-SMI::enterprises.6027.3.2.1.1.1.1.1.1 = INTEGER: 1 SNMPv2-SMI::enterprises.6027.3.2.1.1.1.1.1.2 = INTEGER: 2 SNMPv2-SMI::enterprises.6027.3.2.1.1.1.1.2.1 = Hex-STRING: 00 01 E8 13 A5 C7 SNMPv2-SMI::enterprises.6027.3.2.1.1.1.1.2.2 = Hex-STRING: 00 01 E8 13 A5 C8... -
Page 214: Entity Mibs
Entity MIBS The Entity MIB provides a mechanism for presenting hierarchies of physical entities using SNMP tables. The Entity MIB contains the following groups, which describe the physical elements and logical elements of a managed system The following tables are implemented for the Aggregator. •... - Page 215 The status of the MIBS is as follows: $ snmpwalk -c public -v 2c 10.16.130.148 1.3.6.1.2.1.47.1.1.1.1.2 SNMPv2-SMI::mib-2.47.1.1.1.1.2.1 = "" SNMPv2-SMI::mib-2.47.1.1.1.1.2.2 = STRING: "PowerConnect I/O-Aggregator" SNMPv2-SMI::mib-2.47.1.1.1.1.2.3 = STRING: "Module 0" SNMPv2-SMI::mib-2.47.1.1.1.1.2.4 = STRING: "Unit: 0 Port 1 10G Level" SNMPv2-SMI::mib-2.47.1.1.1.1.2.5 = STRING: "Unit: 0 Port 2 10G Level" SNMPv2-SMI::mib-2.47.1.1.1.1.2.6 = STRING: "Unit: 0 Port 3 10G Level"...
- Page 216 SNMPv2-SMI::mib-2.47.1.1.1.1.2.81 = STRING: "Unit: 1 Port 14 10G Level" SNMPv2-SMI::mib-2.47.1.1.1.1.2.82 = STRING: "Unit: 1 Port 15 10G Level" SNMPv2-SMI::mib-2.47.1.1.1.1.2.83 = STRING: "Unit: 1 Port 16 10G Level" SNMPv2-SMI::mib-2.47.1.1.1.1.2.84 = STRING: "Unit: 1 Port 17 10G Level" SNMPv2-SMI::mib-2.47.1.1.1.1.2.85 = STRING: "Unit: 1 Port 18 10G Level" SNMPv2-SMI::mib-2.47.1.1.1.1.2.86 = STRING: "Unit: 1 Port 19 10G Level"...
-
Page 217: Stacking
A stack of Aggregators operates as a virtual chassis with management units (primary and standby) and member units. The Dell Force10 operating software (FTOS) elects a primary (master) and secondary (standby) management unit. The forwarding database resides on the master switch; the standby unit maintains a synchronized local copy. -
Page 218: Stack Management Roles
Figure 17-15. A Two-Aggregator Stack Stack Management Roles The stack elects the management units for the stack management: • Stack master: primary management unit • Standby: secondary management unit The master holds the control plane and the other units maintain a local copy of the forwarding databases. From Stack master you can configure: •... -
Page 219: Stack Master Election
Stack Master Election The stack elects a master and standby unit at bootup time based on MAC address. The unit with the higher MAC value becomes master. To view which switch is the stack master, use the command. Figure 17-16 shows sample show system output from an established stack. -
Page 220: Mac Addressing
MAC Addressing All port interfaces in the stack use the MAC address of the management interface on the master switch. The MAC address of the chassis in which the master Aggregator is installed is used as the stack MAC address. The stack continues to use the master’s chassis MAC address even after a failover. -
Page 221: Stacking Port Numbers
Stacking Port Numbers By default, each Aggregator in Standalone mode is numbered stack-unit 0. Stack-unit numbers are assigned to member switches when the stack comes up. Figure 17-17 shows the numbers of the 40GbE stacking ports on an Aggregator. Figure 17-17. Stack Groups on an Aggregator Stack Unit 0 / Port 37 Stack Unit 0 / Port 33 Configuring a Switch Stack... -
Page 222: Stacking Prerequisites
8.3.17.0. To check the FTOS version that a switch is running, use the command. To show version download an FTOS version, go to http://support.dell.com. • Stacking is supported only with other Aggregators. A maximum of two Aggregators is supported in a single stack. -
Page 223: Cabling Procedure
Cabling Procedure The following cabling procedure uses the stacking topology in Figure 17-15. To connect the cabling: 1. Connect a 40GbE base port on the first Aggregator to a 40GbE base port on another Aggregator in the same chassis. 2. Connect a 40GbE base port on the second Aggregator to a 40GbE port on the first Aggregator. The resulting ring topology allows the entire stack to function as a single switch with resilient fail-over capabilities. -
Page 224: Adding A Stack Unit
Note: If the stacked switches all reboot at approximately the same time, the switch with the highest MAC address is automatically elected as the master switch. The switch with the next highest MAC address is elected as standby. As each switch joins the stack, it is assigned the lowest available stack-unit number from 0 to 5. The default configuration of each stacked switch is stored in the running configuration of the stack. -
Page 225: Resetting A Unit On A Stack
Resetting a Unit on a Stack Use the following reset commands to reload any of the member units or the standby in a stack. If you try to reset the stack master, an error message is displayed: Reset of master unit is not allowed. Task Command Syntax Command Mode... -
Page 226: Verifying A Stack Configuration
Verifying a Stack Configuration Using LEDs Table 17-2 lists the status of a stacked switch according to the color of the System Status light emitting diodes (LEDs) on its front panel. Table 17-2. System Status LED on a Stacked Switch Color Meaning Blue... - Page 227 Figure 17-19. show system Command Example FTOS# show system Stack MAC : 00:1e:c9:f1:00:9b Reload Type : normal-reload [Next boot : normal-reload] Unit 0 -- Unit Type : Management Unit Status : online Next Boot : online Required Type : I/O-Aggregator - 34-port GE/TE (XL) Current Type : I/O-Aggregator - 34-port GE/TE (XL) Master priority : 0...
- Page 228 Figure 17-21. show system stack-unit stack-group configured Command Example FTOS# show system stack-unit 1 stack-group configured Configured stack groups in stack-unit 1 ------------------------------------------ Figure 17-22. show system stack-unit stack-group Command Example FTOS# show system stack-unit 1 stack-group Stack group Ports ------------------------------------ 1/33 1/37...
-
Page 229: Troubleshooting A Switch Stack
Troubleshooting a Switch Stack Troubleshooting Commands To perform troubleshooting operations on a switch stack, use the commands in Table 17-4 on the master switch. Table 17-4. Troubleshooting Stack Commands Command Output (Figure 17-25) Displays the status of stacked ports on stack units. show system stack-ports (Figure 17-26) - Page 230 Figure 17-26. show redundancy Command Example FTOS#show redundancy Stack-unit Status ------------------------------------------------ Mgmt ID: Stack-unit ID: Stack-unit Redundancy Role: Primary Indicates master unit Stack-unit State: Active Stack-unit SW Version: E8-3-17-46 Link to Peer: PEER Stack-unit Status ------------------------------------------------ Indicates standby unit Stack-unit State: Standby Peer stack-unit ID: Stack-unit SW Version:...
-
Page 231: Failure Scenarios
Figure 17-27. show hardware stack-unit stack-port Command Example FTOS# show hardware stack-unit 1 stack-port 33 Input Statistics: 7934 packets, 1049269 bytes 0 64-byte pkts, 7793 over 64-byte pkts, 100 over 127-byte pkts 0 over 255-byte pkts, 7 over 511-byte pkts, 34 over 1023-byte pkts 70 Multicasts, 0 Broadcasts 0 runts, 0 giants, 0 throttles 0 CRC, 0 overrun, 0 discarded... -
Page 232: Master Switch Fails
Master Switch Fails Problem: The master switch fails due to a hardware fault, software crash, or power loss. Resolution: A failover procedure begins: Keep-alive messages from the Aggregator master switch time out after 60 seconds and the switch is removed from the stack. 2. -
Page 233: Stack Unit In Card-Problem State Due To Incorrect Ftos Version
Stack Unit in Card-Problem State Due to Incorrect FTOS Version Problem: A stack unit enters a Card-Problem state because the switch has a different FTOS version than the master unit (Figure 17-29). The switch does not come online as a stack unit. Resolution: To restore a stack unit with an incorrect FTOS version as a member unit, disconnect the stacking cables on the switch and install the correct FTOS version. -
Page 234: Upgrading A Switch Stack
Upgrading a Switch Stack To upgrade all switches in a stack with the same FTOS version, follow these steps: Step Task Command Syntax Command Mode Copy the new FTOS image to a network server. Download the FTOS image by accessing an upgrade system { flash: | ftp: | scp: EXEC Privilege | tftp: | usbflash: } partition... -
Page 235: Upgrading A Single Stack Unit
Upgrading a Single Stack Unit Upgrading a single stacked switch is necessary when the unit was disabled due to an incorrect FTOS version. This procedure upgrades the image in the boot partition of the member unit from the corresponding partition in the master unit. To upgrade an individual stack unit with a new FTOS version, follow these steps: Step Task... - Page 236 Stacking...
-
Page 237: Broadcast Storm Control
Broadcast Storm Control On the Aggregator, the broadcast storm control feature is enabled by default on all ports, and disabled on a port when an iSCSI storage device is detected. Broadcast storm control is re-enabled as soon as the connection with an iSCSI device ends. Broadcast traffic on Layer 2 and Layer 3 interfaces is limited or suppressed during a broadcast storm. - Page 238 Broadcast Storm Control...
-
Page 239: System Time And Date
System Time and Date The Aggregator auto-configures the hardware and software clocks with the current time and date. If necessary, you can manually set and maintain the system time and date using the CLI commands described in this chapter. • Setting the Time for the Hardware Clock •... -
Page 240: Setting The Time For The Software Clock
Setting the Time for the Software Clock You can change the order of the month and day parameters to enter the time and date as time day month year. You cannot delete the software clock. The software clock runs only when the software is up. The clock restarts, based on the hardware clock, when the switch reboots. -
Page 241: Setting The Time Zone
Setting the Time Zone Universal time coordinated (UTC) is the time standard based on the International Atomic Time standard, commonly known as Greenwich Mean time. When determining system time, you must include the differentiator between the UTC and your local timezone. For example, San Jose, CA is the Pacific Timezone with a UTC offset of -8. -
Page 242: Setting Daylight Savings Time
Setting Daylight Savings Time FTOS supports setting the system to daylight savings time once or on a recurring basis every year. Setting Daylight Saving Time Once Set a date (and time zone) on which to convert the switch to daylight savings time on a one-time basis. To set daylight saving time once, use the following command: Command Syntax Command Mode... -
Page 243: Setting Recurring Daylight Saving Time
Setting Recurring Daylight Saving Time Set a date (and time zone) on which to convert the switch to daylight savings time on a specific day every year. If you have already set daylight savings for a one-time setting, you can set that date and time as the recurring setting using the command. - Page 244 Command Syntax Command Mode Purpose • end-week: If you entered a start-week, enter one of the following as the week that daylight savings ends: • enter a number from 1 to 4 as the week-number: number of the week to end daylight savings time. •...
-
Page 245: Uplink Failure Detection (Ufd)
Uplink Failure Detection (UFD) Uplink failure detection (UFD) is enabled by default on the Aggregator. Note: Uplink failure detection is also referred to as link tracking. UFD provides detection of the loss of upstream connectivity and, if used with NIC teaming, automatic recovery from a failed link. -
Page 246: How Uplink Failure Detection Works
Figure 20-1. Uplink Failure Detection How Uplink Failure Detection Works UFD creates an association between upstream and downstream interfaces. The association of uplink and downlink interfaces is called an uplink-state group. An interface in an uplink-state group can be a physical interface or a port-channel (LAG) aggregation of physical interfaces. -
Page 247: Ufd And Nic Teaming
Figure 20-2. Uplink Failure Detection Example If only one of the upstream interfaces in an uplink-state group goes down, a specified number of downstream ports associated with the upstream interface are put into a link-down state. This number is user-configurable and is calculated by the ratio of upstream port bandwidth to downstream port bandwidth in the same uplink-state group. -
Page 248: Important Points To Remember
Important Points to Remember UFD operates as follows on an Aggregator: • Uplink-state group 1 is created by default with the uplink LAG 128 as the upstream interface and all server ports as downstream interfaces. When the uplink LAG goes down, all server interfaces are brought down and placed in UFD error-dis- abled state. -
Page 249: Disabling Uplink Failure Detection
Disabling Uplink Failure Detection In some network topologies, you may prefer that downstream links on an Aggregator remain opera- tionally up and continue transmitting traffic without being automatically disabled when connectivity to an upstream switch/router goes down. When UFD is enabled and the upstream connectivity on LAG 128 fails, downstream links are also dis- abled. -
Page 250: Displaying Uplink Failure Detection
Displaying Uplink Failure Detection To display information on the Uplink Failure Detection feature, enter any of the following show commands: Show Command Syntax Description show uplink-state-group [ group-id ] [detail] Displays status information on a specified uplink-state group or all groups. -
Page 251: Command Output
Figure 20-3. Command Output show uplink-state-group FTOS# show uplink-state-group Uplink State Group: 1 Status: Enabled, Down FTOS# FTOS#show uplink-state-group 1 Uplink State Group: 1 Status: Enabled, Down FTOS# FTOS#show uplink-state-group detail (Up): Interface up (Dwn): Interface down (Dis): Interface disabled Uplink State Group Status: Enabled, Down Defer Timer... - Page 252 Figure 20-4. Command Output show interfaces FTOS#show interfaces tengigabitethernet 0/5 TenGigabitEthernet 0/5 is up, line protocol is down(error-disabled[UFD]) Hardware is DellForce10Eth, address is 00:1e:c9:f1:04:80 Current address is 00:1e:c9:f1:04:80 Server Port AdminState is N/A Pluggable media not present Interface index is 35197697 Internet address is not set Mode of IP Address Assignment : NONE DHCP Client-ID :tenG134001ec9f10480...
-
Page 253: Debugging Ufd On An Interface
Debugging UFD on an Interface To enable debug messages for events related to a specified uplink-state group or all groups, enter the debug command. uplink-state-group Task Command Command Mode Enable UFD debugging on all or a specified debug uplink-state-group [group-id] EXEC PRIVILEGE uplink-state group, where: group-id... - Page 254 Uplink Failure Detection (UFD)
-
Page 255: Upgrade Procedures
FTOS Release Notes for the M I/O Aggregator. Follow the procedures in the FTOS Release Notes for the software version you wish to upgrade to. Direct any questions or concerns about FTOS upgrades to the Dell Force10 Technical Support Center. You can reach technical support: •... - Page 256 Upgrade Procedures...
-
Page 257: Debugging And Diagnostics
Debugging and Diagnostics The chapter contains the following sections: • Debugging Aggregator Operation • Software show Commands • Offline Diagnostics • Trace Logs • Show Hardware Commands • Environmental Monitoring • Buffer Tuning • Troubleshooting Packet Loss • Application Core Dumps •... -
Page 258: Debugging Aggregator Operation
Debugging Aggregator Operation This section describes common troubleshooting procedures to use for error conditions that may arise during Aggregator operation. All interfaces on the Aggregator are operationally down Symptom: All Aggregator interfaces are down. Resolution: Ensure that port channel 128 is up and that the Aggregator-facing port channel on the top-of-rack switch is correctly configured. -
Page 259: Broadcast, Unknown Multicast, And Dlf Packets Are Switched At A Very Low Rate
Broadcast, unknown multicast, and DLF packets are switched at a very low rate Symptom: Broadcast, unknown multicast, and DLF packets are switched at a very low rate. By default, broadcast storm control is enabled on an Aggregator and rate limits the transmission of broadcast, unknown multicast, and DLF packets to 1Gbps. -
Page 260: Flooded Packets On All Vlans Are Received On A Server
Flooded packets on all VLANs are received on a server Symptom: All packets flooded on all VLANs on an Aggregator are received on a server, even if the server is configured as a member of only a subset of VLANs. This behavior happens because all Aggregator ports are, by default, members of all (4094) VLANs. -
Page 261: Auto-Configured Vlans Do Not Exist On A Stacked Aggregator
Auto-configured VLANs do not exist on a stacked Aggregator Symptom: When an Aggregator is configured and used in a stack, traffic does not flow and the VLAN auto-configuration on all ports is lost. This behavior happens because an Aggregator in stacking mode does not support auto-configured VLANs. -
Page 262: Software Show Commands
Dell Force10 Real Time Operating System oftware Dell Force10 Operating System Version: 1.0 Dell Force10 Application Software Version: E8-3-17-24 Copyright (c) 1999-2012 by Dell Inc. All Rights Reserved. Build Time: Thu Jul 5 11:20:28 PDT 2012 Build Path: /sites/sjc/work/build/buildSpaces/build05/E8-3-17/SW/SRC/Cp_src/Tacacs st-sjc-m1000e-3-72 uptime is 17 hour(s), 1 minute(s) System image file is "st-sjc-m1000e-3-c2"... - Page 263 : 2147483648 bytes Temperature : 64C Voltage : ok Switch Power : GOOD Product Name : I/O Aggregator Mfg By : DELL Mfg Date : 2012-05-01 Serial Number : TW282921F00038 Part Number : 0NVH81 Piece Part ID : TW-0NVH81-28292-1F0-0038 PPID Revision...
-
Page 264: Offline Diagnostics
Offline Diagnostics The offline diagnostics test suite is useful for isolating faults and debugging hardware.The diagnostics tests are grouped into three levels: • Level 0—Level 0 diagnostics check for the presence of various components and perform essential path verifications. In addition, they verify the identification registers of the components on the board. •... -
Page 265: Trace Logs
FTOS# Trace Logs In addition to the syslog buffer, the Dell Force10 operating software (FTOS) buffers trace messages which are continuously written by various FTOS software tasks to report hardware and software events and status information. Each trace message provides the date, time, and name of the FTOS process. All messages are stored in a ring buffer and can be saved to a file either manually or automatically upon failover. -
Page 266: Show Hardware Commands
Table 22-2 lists the commands available as of the latest FTOS version. show hardware Note: Use the commands only under the guidance of Dell Force10 Technical Assistance show hardware Center. Table 22-2. show hardware Commands Command Description... -
Page 267: Environmental Monitoring
Table 22-2. show hardware Commands Command Description show hardware stack-unit {0-5} stack-port View the input and output statistics for a stack-port interface. {33-56} show hardware stack-unit {0-5 unit {0-0} counters View the counters in the field processors of the stack unit. show hardware stack-unit {0-5} unit {0-0} details View the details of the FP devices and Hi gig ports on the stack-unit. - Page 268 Figure 22-6. show interfaces transceiver Command Example FTOS#show int ten 0/49 transceiver SFP is present SFP 49 Serial Base ID fields SFP 49 Id = 0x03 SFP 49 Ext Id = 0x04 SFP 49 Connector = 0x07 SFP 49 Transceiver Code = 0x00 0x00 0x00 0x01 0x20 0x40 0x0c 0x01 SFP 49 Encoding = 0x01...
-
Page 269: Recognize An Over-Temperature Condition
To bring the stack unit back online, use the command in EXEC mode. power-on In addition, Dell Force10 requires that you install blanks in all slots without a line card to control airflow for adequate system cooling. Debugging and Diagnostics | 255... -
Page 270: Recognize An Under-Voltage Condition
Figure 22-8. show environment Command Example FTOS#show environment -- Unit Environment Status Unit Status Temp Voltage --------------------------------------------------------------------------- online * Management Unit Thermal Sensor Readings (deg C) Unit Sensor0 Sensor1 Sensor2 Sensor3 Sensor4 Sensor5 Sensor6 Sensor7 Sensor8 Sensor9 ------------------------------------------------------------------------------------------ ------ Note: Exercise care when removing a card; if it has exceeded the major or shutdown thresholds, the card could be hot to the touch Recognize an Under-Voltage Condition If the system detects an under-voltage condition, it sends an alarm. -
Page 271: Buffer Tuning
The simple network management protocol (SNMP) traps and OIDs in Table 22-3 provide information about environmental monitoring hardware and hardware components. Table 22-3. SNMP Traps and OIDs OID String OID Name Description Receiving power .1.3.6.1.4.1.6027.3.10.1.2.5.1.6 chSysPortXfpRecvPower OID to display the receiving power of the connected optics. - Page 272 All ports support eight queues, four for data traffic and four for control traffic. All eight queues are tunable. Physical memory is organized into cells of 128 bytes. The cells are organized into two buffer pools—a dedicated buffer and a dynamic buffer. •...
-
Page 273: Deciding To Tune Buffers
Deciding to Tune Buffers Dell Force10 recommends exercising caution when configuring any non-default buffer settings, as tuning can significantly affect system performance. The default values work for most cases. As a guideline, consider tuning buffers if traffic is very bursty (and coming from several interfaces). In this case: •... - Page 274 You cannot allocate more than the available memory for the dedicated buffers. If the system determines that the sum of the configured dedicated buffers allocated to the queues is more than the total available memory, the configuration is rejected, returning a syslog message similar to the following. Table 22-4.
- Page 275 Figure 22-11. Displaying Buffer Profile Allocations FTOS#show running-config interface tengigabitethernet 2/0 ! interface TenGigabitEthernet 2/0 no ip address mtu 9252 switchport no shutdown buffer-policy myfsbufferprofile FTOS#show buffer-profile detail int tengig 0/10 Interface Tengig 0/10 Buffer-profile fsqueue-fp Dynamic buffer 1256.00 (Kilobytes) Queue# Dedicated Buffer Buffer Packets...
-
Page 276: Using A Pre-Defined Buffer Profile
Using a Pre-Defined Buffer Profile FTOS provides two pre-defined buffer profiles, one for single-queue (for example, non-QoS) applications, and one for four-queue (for example, QoS) applications. Task Command Mode Apply one of two pre-defined buffer profiles for all port buffer-profile global [1Q|4Q] CONFIGURATION pipes in the system. -
Page 277: Sample Buffer Profile Configuration
Sample Buffer Profile Configuration The two general types of network environments are sustained data transfers and voice/data. Dell Force10 recommends a single-queue approach for data transfers (Figure 22-12). Figure 22-12. Single Queue Application with Default Packet Pointers buffer-profile fp fsqueue-fp... -
Page 278: Displaying Drop Counters
Displaying Drop Counters command assists in identifying which stack unit, show hardware stack-unit 0–11 drops [unit 0 [port 0–63]] port pipe, and port is experiencing internal drops (Figure 22-13) and (Figure 22-14). Figure 22-13. Displaying Drop Counter Statistics FTOS#show hardware stack-unit 0 drops UNIT No: 0 Total Ingress Drops :0 Total IngMac Drops :0... -
Page 279: Dataplane Statistics
Figure 22-14. Displaying Buffer Statistics, Displaying Drop Counters FTOS#show hardware stack-unit 0 drops unit 0 port 1 --- Ingress Drops Ingress Drops : 30 IBP CBP Full Drops PortSTPnotFwd Drops IPv4 L3 Discards Policy Discards Packets dropped by FP : 14 (L2+L3) Drops Port bitmap zero Drops : 16... - Page 280 Figure 22-15. Displaying Buffer Statistics, Displaying Dataplane Statistics FTOS#show hardware stack-unit 2 cpu data-plane statistics bc pci driver statistics for device: rxHandle noMhdr noMbuf noClus recvd dropped recvToNet rxError rxDatapathErr rxPkt(COS0) rxPkt(COS1) rxPkt(COS2) rxPkt(COS3) rxPkt(COS4) rxPkt(COS5) rxPkt(COS6) rxPkt(COS7) rxPkt(UNIT0) rxPkt(UNIT1) rxPkt(UNIT2) rxPkt(UNIT3) transmitted...
-
Page 281: Displaying Stack Port Statistics
Displaying Stack Port Statistics command displays input and output statistics for a stack-port show hardware stack-unit stack-port interface (Figure 22-17). Figure 22-17. Displaying Stack Unit Statistics FTOS#show hardware stack-unit 2 stack-port 49 Input Statistics: 27629 packets, 3411731 bytes 0 64-byte pkts, 27271 over 64-byte pkts, 207 over 127-byte pkts 17 over 255-byte pkts, 56 over 511-byte pkts, 78 over 1023-byte pkts 0 Multicasts, 5 Broadcasts 0 runts, 0 giants, 0 throttles... -
Page 282: Application Core Dumps
Application Core Dumps Application core dumps are disabled by default. A core dump file can be very large. Due to memory requirements, the file can only be sent directly to an FTP server. It is not stored on the local flash. To following command: enable full application core dumps, use the Task... - Page 283 Figure 22-19. Mini application core file naming example FTOS#dir Directory of flash: drw- 16384 Jan 01 1980 00:00:00 +00:00 . drwx 1536 Sep 03 2009 16:51:02 +00:00 .. drw- Aug 07 2009 13:05:58 +00:00 TRACE_LOG_DIR d--- Aug 07 2009 13:06:00 +00:00 ADMIN_DIR -rw- 8693 Sep 03 2009 16:50:56 +00:00 startup-config...
-
Page 284: Tcp Dumps
TCP Dumps TCP dump captures CPU bound control plane traffic to improve troubleshooting and system manageability. When enabled, a TCP dump captures all the packets on the local CPU, as specified in the CLI. You can save the traffic capture files to flash, FTP, SCP, or TFTP. The files saved on the flash are located in directory, and labeled tcpdump_*.pcap. -
Page 285: Standards Compliance
RFC and I-D Compliance • MIB Location Note: Unless noted, when a standard cited here is listed as supported by Dell Force10 operating software (FTOS), FTOS also supports predecessor standards. One way to search for predecessor standards is to use the http://tools.ietf.org/... -
Page 286: Rfc And I-D Compliance
RFC and I-D Compliance The following standards are supported by FTOS on an Aggregator and are grouped by related protocol. The columns showing support by platform indicate which version of FTOS first supports the standard. General Internet Protocols RFC# Full Name User Datagram Protocol Transmission Control Protocol Telnet Protocol Specification... -
Page 287: General Ipv4 Protocols
General IPv4 Protocols RFC# Full Name Internet Protocol Internet Control Message Protocol An Ethernet Address Resolution Protocol 1027 Using ARP to Implement Transparent Subnet Gateways 1042 A Standard for the Transmission of IP Datagrams over IEEE 802 Networks 1519 Classless Inter-Domain Routing (CIDR): an Address Assignment and Aggregation Strategy 1812 Requirements for IP Version 4 Routers 2131... -
Page 288: Network Management
Network Management RFC# Full Name 1155 Structure and Identification of Management Information for TCP/IP-based Internets 1156 Management Information Base for Network Management of TCP/IP-based internets 1157 A Simple Network Management Protocol (SNMP) 1212 Concise MIB Definitions 1215 A Convention for Defining Traps for use with the SNMP 1493 Definitions of Managed Objects for Bridges [except for the dot1dTpLearnedEntryDiscards object] 1901... - Page 289 Network Management (continued) RFC# Full Name IEEE 802.1AB The LLDP Management Information Base extension module for IEEE 802.3 organizationally defined discovery information. (LLDP DOT1 MIB and LLDP DOT3 MIB) ruzin-mstp-mib-02 Definitions of Managed Objects for Bridges with Multiple Spanning Tree Protocol (Traps) sFlow.org sFlow Version 5...
-
Page 290: Mib Location
You also can obtain a list of selected MIBs and their OIDs at the following URL: https://www.force10networks.com/csportal20/MIBs/MIB_OIDs.aspx Some pages of iSupport require a login. To request an iSupport account, go to: https://www.force10networks.com/CSPortal20/Support/AccountRequest.aspx If you have forgotten or lost your account information, contact Dell Force10 TAC for assistance. Standards Compliance...
Need help?
Do you have a question about the PowerEdge M IO Aggregator and is the answer not in the manual?
Questions and answers