Table of Contents
Advertisement
Racelogic Ltd
Introduction
CONGRATULATIONS ON PURCHASING A RACELOGIC PERFORMANCEBOX!
PerformanceBox is based on the Racelogic VBOX, which is used by the majority of Car
Manufacturers, Tyre Manufacturers and car magazines around the world to assess performance.
You can be sure that in PerformanceBox you have a product which will prove to be invaluable in all
your motorsport applications.
Performance
With PerformanceBox it is very easy to measure acceleration
times, braking distances, quarter mile times and many more.
There are a number of configurable screens that show specific
test results such as 0-60, 0-100, 0-100-0, ½ mile and ¼ mile
etc.
Because it is very easy to edit the test ranges,
PerformanceBox is a very powerful tool for use in many
different kinds of vehicle testing. Vehicle modification can be
readily assessed and given specific improvement parameters
– the perfect tool for any tuning enthusiast.
Because it is very easy to edit the test ranges,
PerformanceBox is a very powerful tool for use in many
different kinds of vehicle testing.
02/05/2014
Page 1
Advertisement
Table of Contents

Related Manuals for Racelogic PerformanceBox


Summary of Contents for Racelogic PerformanceBox
- Page 1 PerformanceBox is based on the Racelogic VBOX, which is used by the majority of Car Manufacturers, Tyre Manufacturers and car magazines around the world to assess performance. You can be sure that in PerformanceBox you have a product which will prove to be invaluable in all your motorsport applications.
- Page 2 Introduction Lap Timing Displaying your Lap times as you drive around a circuit is simple with PerformanceBox. You can display your last and best Lap times and Lap count, and also display split times for up to six specified split points around the lap. The split files can be saved and reused should you attend the same circuit again, guaranteeing consistent data.
- Page 3 For drivers keen to improve their lap times and get valuable feedback on technique, PerformanceBox includes a sophisticated, fully functioning data logging package. If used with a 64mb SD card, PerformanceBox can log up to 50 hours of continuous data, which can be analysed in great detail in the available software.
-
Page 4: Table Of Contents
OUNTING ERFORMANCE OX IN YOUR CAR ....... 8 EGISTERING YOUR ERFORMANCE OX AND ACTIVATING ALL AVAILABLE FUNCTIONS Registering Your PerformanceBox ..................8 ..........9 CTIVATING THE ADDITIONAL FUNCTIONS IN YOUR ERFORMANCE USING PERFORMANCEBOX ...................... 10 ....................... 10 ERFORMANCE EYPAD ........................ - Page 5 INISH INES AND PLITS Defining start / finish lines and splits in the PerformanceBox software ........49 Loading and Saving start / finish line and split data ............... 50 Clearing start / finish line and split data ................. 50 Moving Splits ......................... 50...
- Page 6 Racelogic Ltd Contents Show Split Info on Graph Chart ..................... 50 Gate Width ..........................50 Split Names ........................... 51 ....................... 51 ISPLAYING IMES Including Split times ......................51 Exporting Lap Time Results ....................52 Clearing Lap Time Results ....................52 Lap Highlight .........................
-
Page 7: Quick Start Guide
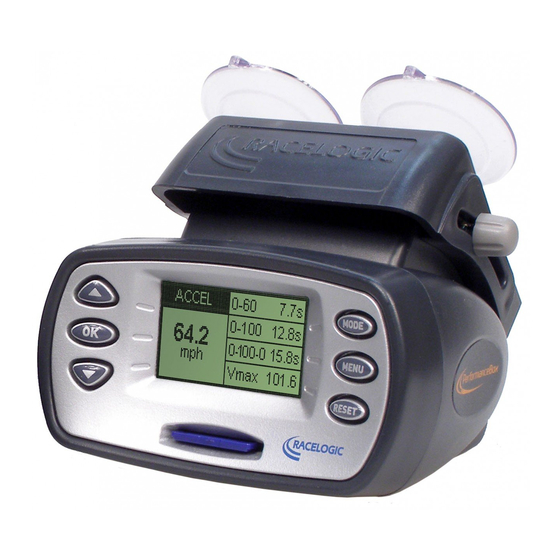
Quick Start Guide Introduction PerformanceBox is a self-contained GPS data logger and Performance Meter. A 10Hz fully calibrated GPS engine is used to provide accuracy and precision and the data can be stored on a removable SD flash card. Real time results are displayed on the back-lit LCD display and a USB connection allows data to be downloaded to a laptop for further in-depth analysis. -
Page 8: Connections
6. Insert the PerformanceBox power cable into the vehicle cigar lighter socket. If power is not permanently available at this socket, turn on the ignition to ensure power at the socket. 7. The first time PerformanceBox is used it will need to be left for 10-15 minutes to acquire fully the latest satellite constellation information. -
Page 9: Activating The Additional Functions In Your Performancebox
The serial number is displayed when you first switch on, or alternatively you can note it from the underside of the PerformanceBox hardware itself (the serial number will begin with 501.) Once you have entered your details you will be emailed an activation code. In the case of web-based email accounts, such as Hotmail, it may be necessary to check the junk email folders. -
Page 10: Using Performancebox
Racelogic Ltd Using PerformanceBox Using PerformanceBox Your PerformanceBox can be used in a variety of modes, as described in this section. PerformanceBox Keypad Used to show next screen, or Changes Mode. to navigate menu. Select the menu item that is... -
Page 11: Changing The Units Of Measurement
Searching for satellites at power up Whilst the PerformanceBox is acquiring satellites it will flash the image of a satellite, the location of the flashing image depends on the screen you are in. -
Page 12: Performance Mode
Racelogic Ltd Performance Mode Performance Mode The Performance mode is used to measure the acceleration and braking performance of your vehicle. Press the MODE button to scroll to the Performance Mode screen. This mode is divided into six screens, each of which displays different performance data. Navigate between these ▲▼... -
Page 13: Measuring The 0-60 Time Of Your Vehicle
The MAX value is cleared by pressing the RESET button. Measuring the 0-60 time of your vehicle 1. Install PerformanceBox into your vehicle as described in the ‘Quick Start Guide’ section of this manual. 2. Press the MENU button to select the Performance Mode. -
Page 14: Editing A Performance Mode Test Range
Racelogic Ltd Performance Mode 8. After doing a number of runs you can view your best 0-60 time by scrolling to the BEST screen. 9. If you have your SD card inserted then your run data will be stored. Please note, to record a results file, you must accelerate over at least 30 Km/H. -
Page 15: Foot Rollout
Performance Mode 1 Foot Rollout The PerformanceBox normally takes the start of a performance run at the point at which the vehicle moves, but at drag strips the vehicle starts 1 foot behind the timing start line. You can make the PerformanceBox start all timing runs from 1 foot by enabling this feature. -
Page 16: Example Resultxx.txt File
Racelogic Ltd Performance Mode Example RESULTXX.TXT file: --------------- Run 0001 --------------- Time 13:09 Date 31/03/2014 Accel results Speed(mph) Time(s) 0-60 05.3 0-100 11.7 Accel Distance results Distance(m) Time(s) @Speed(mph) 0-20 02.6 32.0 00.0 00.5 00.0 00.5 00.0 00.5 Braking results... -
Page 17: Speed Buzzer
In order to arm the speed buzzer once more the vehicle must either come to a complete halt for five seconds, or PerformanceBox must be power-cycled. Event Marking Pressing the OK button when in any of the Performance Mode screens will create an event mark in the logged file (see ‘Event Marking’... -
Page 18: Laptiming Mode
This method of lap timing requires just one button push to set up a start/finish line. With the PerformanceBox in Lap Timing mode, press either the up or down arrow key as you drive over the desired start/finish point. The screen will then display the following message:... -
Page 19: Lap Count
If you want to save your lap times to a file, insert an SD card. Drive around the circuit, your times will automatically appear on the PerformanceBox display: Big Speed @ Split display There is a choice of what is displayed in the main area of the Lap timing screen, either your Lap/Split time, as shown above, or the Vehicle speed as it crosses a split point or start/finish line;... -
Page 20: Split To Split Time
Split Widths When setting a start / finish or split line, PerformanceBox will set the width of the line at a default value of 25m (12.5m either side of the point at which the OK button was pressed.) However this can be changed by selecting the Split Widths function and altering the value using the ▲▼... -
Page 21: Start / Finish And Split Lines
Before PerformanceBox can measure and display times, you will need to either load previously recorded start / finish lines or create new ones in your PerformanceBox. This is done using either Simple Lap Timing, mentioned above, which sets only a start / finish line. In order to set a start / finish AND split points, follow the instructions below. -
Page 22: Saving Start / Finish And Split Lines
After creating start / finish, Splits or Finish lines you can save them to a file on the SD card which can be loaded back into PerformanceBox at a later stage, or used in the VBox Tools software. The file created is called DBOX.DSF and is saved into the ‘DATA’ directory on the SD card. If a DBOX.DSF already exists the file will not be created;... - Page 23 To review a ‘Laps-xx.txt’ file with lap and split time data: Enter Lap Timing Mode and then press the OK button. PerformanceBox will then display any Lap Timing files stored on the card: ▲▼ Press the buttons to scroll to the required file, then press the OK button to select it.
-
Page 24: Predictive Mode
Racelogic Ltd Predictive Mode Predictive Mode Predictive mode enables you to graphically view your predicted lap time. Predictive lap timing works by saving your position around a circuit, every second. If the current lap is the fastest so far, then this positional data is saved as a reference. -
Page 25: Fixed Lap
Racelogic Ltd Predictive Mode Once a valid reference lap has been created or loaded, the Drift Box will begin predicting. The prediction is shown in text and graph format which is a graphical representation of the amount of time gained or lost around the lap. -
Page 26: Speed Display Mode
Racelogic Ltd Speed Display Speed Display Mode The Speed Display Mode is divided into three screens. The first contains a compass and current speed in a large font, the second is an Odometer and the third, an Altimeter. Navigate between ▲▼... -
Page 27: Power Testing
Racelogic Ltd Power Mode Power Mode Your car’s power output can be measured using the Power Mode. There are two parts to this process: the acceleration run, which gives you the power at the wheels minus the losses caused by tyre and air resistance. The second part of the test measures these losses and also estimates gearbox losses. -
Page 28: Power Runs
Accelerate to the top of the engine’s rev range, disengage the clutch and make a note of the car’s speed as this will be required during the losses run, then coast for a few seconds. PerformanceBox will record the amount of power as soon as it recognises deceleration:... - Page 29 Racelogic Ltd Power Mode Begin to accelerate, and press OK. Continue to accelerate to the top of the engine rev range. At the top of the rev range, disengage the clutch and put the gearbox into neutral. Once deceleration has begun the screen will display the recording information:...
-
Page 30: Input Module Screen
NOTE: After each power up, the Input Module Screen on the PerformanceBox must be accessed in order for the PerformanceBox to recognise the presence of the MICIN01. After this has been done, then any of the PerformanceBox screens can be used, but this must be done or the MICIN01 channels will not be logged. -
Page 31: Data Logging
Files logged by PerformanceBox are named ‘PBOX_001.dbn’, where 001 increments when a new file is created. A new file is created every time PerformanceBox is powered up, or when the card is re-inserted. If you wish to log data to the SD card then simply insert the card into the slot in the front of PerformanceBox. -
Page 32: Setup Menu
UPGRADE EXIT Logging Mode Allows the logging mode of the PerformanceBox to be configured, see the Data logging section of this manual for more information. Contrast & Brightness Use these to adjust the Brightness & Contrast of the screen, OK to return. -
Page 33: Cold Start
PerformanceBox is coldstarted on its first use. After performing a Cold Start the vehicle to which PerformanceBox is connected should be left in an open area for at least 15 minutes, to re-acquire the satellite almanac. You should only need to do a cold start when you first receive your PerformanceBox, or you are experiencing poor satellite reception in an open area. -
Page 34: Troubleshooting
No data files are appearing on the SD card Make sure the SD card is not full. If your PerformanceBox does not beep twice when you insert the card, then you may have to re-format the card - you should use the utility in PerformanceBox Tools. -
Page 35: Performancetools Software
PerformanceTools Software The PerformanceTools software allows you to view the driving data recorded by PerformanceBox in a ‘.dbn’ file. The software also allows you to display Lap times, Acceleration, Deceleration results, and to carry out detailed analysis of driver and vehicle performance. -
Page 36: Graph Window
There are a number of other channels which are shown, but these are not relevant to the PerformanceBox and will be blank. For reference, these channels are: Relative Height, Vertical Speed, Glonass Satellites, GPS Satellites, Lat Acc from Yaw Rate, DGPS, Speed Quality, Centre Line Deviation, Solution Type, RMS Error Position, and any channel with an underscore at the start of its name, such as _latitude. -
Page 37: Software Basics
PerformanceBox files and select the file you wish to view. By default the ‘Files of Type:’ will be ‘PerformanceBox Binary Files (*.dbn)’, with a further option of ‘VBOX Data Files (*.vbo)’. Unless you are loading files that have been recorded using Racelogic VBOX equipment you will not need to select the .vbo file type. -
Page 38: Moving Around The Graphs
Racelogic Ltd PerformanceTools Software Moving Around the Graphs Once a file is displayed the data from the file can be examined more closely using the following basic functions: zoom, pan and cursor movement. Cursor The position of the cursors in the Graph and Graph:Map windows are linked and move together, and the values displayed in the Graph:Data window update as the cursor is moved through the file. -
Page 39: Graph Screen Y Axis
Main Run. Open in Notepad A PerformanceBox file can be opened in Notepad by selecting the ‘Open In Notepad’ option from the ‘Load All’ drop down list. Note that for large files, it may take some time for Notepad to load all of the lines of data. -
Page 40: Saving Performancebox Files
Save a file by clicking on the ‘Save’ icon in the main toolbar. If you have made changes or edited your PerformanceBox file it is wise to save this file to a new name so that you do not lose the original file. -
Page 41: Exporting Graph Data
Racelogic Ltd PerformanceTools Software Exporting Graph Data It is possible to export the graph or map as a picture file, which can either be saved or copied onto the computer’s clipboard for use with other software. Simply click the ‘Export’ icon and then choose the image to export. -
Page 42: Selecting Channels
The enabled channel will then be highlighted in its display colour. The data table contains all of the logged channels from the PerformanceBox file plus Lateral and Longitudinal Acceleration and Radius of Turn channels, calculated when the file is first loaded. - Page 43 Racelogic Ltd PerformanceTools Software 02/05/2014 Page 43...
-
Page 44: Channel And Axis Setup
Racelogic Ltd PerformanceTools Software Channel and Axis Setup For each channel there are a number of attributes that can be configured, including those relating to the y-axis. These are configured in the Channel Set-up and Axis Set-up screens, which are accessed by double-clicking on any of the channels in the data table or by right clicking the mouse button and selecting the ‘Channel scaling &... - Page 45 Racelogic Ltd PerformanceTools Software The example on the right shows the Lateral Acceleration channel with a smoothing level of This example shows the Lateral Acceleration channel with a smoothing level of 25 – note how the individual peaks and troughs are...
-
Page 46: Axis Setup
Racelogic Ltd PerformanceTools Software Axis Displays the axis with which the channel is associated. To change the associated axis, click the mouse in the right hand end of the axis box once the channel has been made visible. A common application for this is to display both the Longitudinal and Lateral Acceleration... - Page 47 Racelogic Ltd PerformanceTools Software Column descriptions: Visible Each tick box in this column switches an individual axis on or off in the graph window Axis Title Shows the title of each available axis. The axis title is edited by clicking on the box and entering a new name.
-
Page 48: Lap Timing
Analysing Your Data In PerformanceTools PerformanceBox Tools has three main features which will allow you gather results from data you have logged. Many of these results are available to view on the PerformanceBox itself, but the software allows for more detailed analysis. -
Page 49: Start / Finish Lines And Splits
The information pertaining to these points can be saved to start / finish files for later use with new data from the same circuit, or for sharing with other PerformanceBox users. Defining start / finish lines and splits in the PerformanceBox software... -
Page 50: Loading And Saving Start / Finish Line And Split Data
Click on the ‘Load‘ button in the Start/finish drop down menu to load in a ‘.dsf’ or ‘.spl’ file. The .dsf file must be copied into the DATA directory of the PerformanceBox SD card. If you have multiple .dsf files from various tracks, it is advisable to keep them stored on the PC in directories named after the track –... -
Page 51: Split Names
Displaying Lap Times Load the PerformanceBox .dbn file into the software, then define a start / finish line (along with split points and a separate finish line if required) in the manner described above, or by loading a .dsf or .spl file. -
Page 52: Exporting Lap Time Results
Racelogic Ltd PerformanceTools Software Naming the split files (see ‘Split Names’ above) from the option in the ‘Start, Finish & Splits’ menu will result in the split names being displayed when the ‘Lap Timing – Split Line’ option is chosen – see the example on the next page, which shows the split points that have been set on corners at Silverstone Circuit and named accordingly. -
Page 53: Loading And Comparing Individual Laps From The Same File
Racelogic Ltd PerformanceTools Software Loading and comparing individual laps from the same file Individual laps from the loaded file can be compared to each other in the main Graph and Graph:Map windows. Each lap shown in the Lap timing table has a Graph Icon associated with it in the right hand column. - Page 54 Racelogic Ltd PerformanceTools Software Result in the Graph window: The main run is in red, the compare run in blue. In this instance the two laps have been performed very consistently: the peaks and troughs, which indicate the braking and acceleration points, sit on top of each other almost every time.
-
Page 55: Loading And Comparing Individual Laps From Different Files
Racelogic Ltd PerformanceTools Software Loading and comparing individual laps from different files Lap data created by individual users, and therefore not logged in one .dbn file, can also be loaded and compared: Load the first file containing the lap data, set the start / finish line, and click the lap timing button. - Page 56 Racelogic Ltd PerformanceTools Software Result in the Graph window: The main run (1:30.70 – the fastest lap from the previous example) is in red, the compare run (1:26.10) in blue. Note in this instance how there are differences in the peaks and troughs of the speed plots, indicating that the faster driver carried more speed before braking, and accelerated harder.
-
Page 57: Replaying Laps (Driftbox Tools Only)
Racelogic Ltd PerformanceTools Software Replaying Laps (DriftBox Tools Only) If you have recorded laps loaded into the software you can replay them, by clicking on the Replay button. By default the cursor will move through the Graph window and round the path in the Graph:Map window at the same speed at which the file was recorded. - Page 58 Racelogic Ltd PerformanceTools Software Set Position Cursor Type The cursors themselves are configurable: right click on any of the main windows (Graph, Data or Map) to bring up the context menu (or click on the Graph Setup button on the Toolbar.) Select ‘Set Position Cursor Type’...
-
Page 59: Creating A Circuit Overlay
There are two ways that an overlay file can be created: either by driving around the circuit, or by creating a .kml file in Google Earth and importing it into PerformanceBox Tools. Creating an Overlay File by Driving the Circuit Note: It is best to use an external antenna to get maximum positional accuracy ... -
Page 60: Aligning Circuit Overlays And Laps
Racelogic Ltd PerformanceTools Software If you want to load a .cir file into PerformanceBox Tools on its own, click Load All and then type *.* in the File name field: You can then select the .cir file and it will load like a normal .dbn file. - Page 61 Racelogic Ltd PerformanceTools Software In order to be able to view truer drive lines, right-click on the Graph Map - the option to align either the lap data or overlay will appear at the top of the context menu. Having chosen which you wish to move in the “Select run to...
-
Page 62: Importing A Background Image In To The Graph Map
Racelogic Ltd PerformanceTools Software Importing a background image in to the Graph Map You can import any image of your choosing into the Graph Map by right-clicking on either the Graph:Data, Graph:Map, or Graph windows and selecting the Graph: Map Background Image>Load option:... -
Page 63: Producing Acceleration Results
Racelogic Ltd PerformanceTools Software Performance Results Acceleration and deceleration results can be easily extracted from your logged data by using the various performance results tools. These are available by clicking on the ‘Accel results’ and ‘Decel results’ buttons on the Toolbar. -
Page 64: Creating A Custom Acceleration Test
Racelogic Ltd PerformanceTools Software Creating a Custom Acceleration test 1. Click on the Custom option in the Accel test drop down list. This will then open the following window: 2. Enter the speed of the start condition. 3. Set the end condition option, speed or distance. -
Page 65: Additional Data Analysis Features
Racelogic Ltd PerformanceTools Software Additional Data Analysis Features The software has additional features to aid in data analysis, explained in this section. Many of these features can be used as a part of the analysis whilst producing Performance results. The G-Circle Pressing the G-Circle button produces a plot of the Longitudinal vs Latitudinal Acceleration data. -
Page 66: Graph Measure Tool
Racelogic Ltd PerformanceTools Software Graph Measure Tool This tool can be used to highlight a section of data in the Graph window and produce a table that summarises the data captured in the window: Measure Window Summary Hold shift down whilst clicking and dragging to use the Measure Tool The area of data that is displayed in the table is highlighted in blue in the Graph window. -
Page 67: Event Marking
‘spike’ in the graph. The example above demonstrates an event created by the user holding the OK button on the PerformanceBox for five seconds: the event will continue to be recorded for as long as the button is pressed. -
Page 68: Tools
Google Earth cannot display files of greater than 65,000 samples. Exporting to Mapping Software (AutoRoute or Streets & Trips) Load the ‘.dbn’ file into PerformanceBox Tools using the ‘Load All’ button from the main toolbar, then click on the ‘Export Data To Mapping Software’ option in the ‘Tools’ menu. -
Page 69: Formatting Mmc/Sd Cards
‘Creating a Circuit Overlay’ on page 67.) Only .kml files can be imported, so when saving paths created in Google Earth it is necessary to ensure the correct file type is chosen (the other option is .kmz, and is not a valid import file type for PerformanceBox Tools.) File Repair... -
Page 70: Radius Of Turn Set-Up
Racelogic Ltd PerformanceTools Software Radius of Turn set-up Click this option to open the Radius of Turn setup window, in which the smoothing level and maximum radius value can be set. When smoothing is applied to data, the value of an individual sample point is affected by samples around it. -
Page 71: Firmware Upgrades
Ensure that you have the latest version of PerformanceTools software installed on your PC. With the PerformanceBox switched off, connect your it to the PC with the USB cable. Power on the PerformanceBox whilst holding down the MODE button – instead of the usual splash screen you will see the Upgrader screen: ... -
Page 72: Specification
Racelogic Ltd Specification and Contact Specification Velocity Distance Accuracy 0.2 Km/h Accuracy 0.05% (<50 cm per Km) Units Km/h or Mph Units Metres / Feet Update rate 10 Hz Update rate 10 Hz Maximum velocity 1000 Mph Resolution 1 cm Minimum velocity 0.1 Km/h...
Need help?
Do you have a question about the PerformanceBox and is the answer not in the manual?
Questions and answers