Table of Contents
Advertisement
Quick Links
R0E424270MCU00
User's Manual
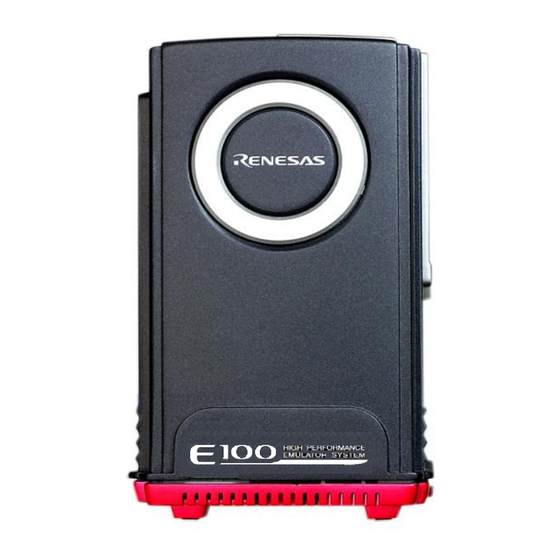
E100 Emulator MCU Unit for H8S/2400 Series
All information contained in these materials, including products and product specifications,
represents information on the product at the time of publication and is subject to change by
Renesas Electronics Corporation without notice. Please review the latest information published
by Renesas Electronics Corporation through various means, including the Renesas Electronics
Corporation website (http://www.renesas.com).
www.renesas.com
Rev.2.02 Sep 2021
Advertisement
Table of Contents

Related Manuals for Renesas R0E424270MCU00


Summary of Contents for Renesas R0E424270MCU00
- Page 1 All information contained in these materials, including products and product specifications, represents information on the product at the time of publication and is subject to change by Renesas Electronics Corporation without notice. Please review the latest information published by Renesas Electronics Corporation through various means, including the Renesas Electronics Corporation website (http://www.renesas.com).
- Page 2 Renesas Electronics disclaims any and all liability for any damages or losses incurred by you or any third parties arising from the use of any Renesas Electronics product that is inconsistent with any Renesas Electronics data sheet, user’s manual or other Renesas Electronics document.
- Page 3 Unit Products The following usage notes are applicable to all Microprocessing unit and Microcontroller unit products from Renesas. For detailed usage notes on the products covered by this document, refer to the relevant sections of the document as well as any technical updates that have been issued for the products.
- Page 4 ・Authorised representative Name: Renesas Electronics Corporation Address: Toyosu Foresia, 3-2-24, Toyosu, Koto-ku, Tokyo 135-0061, Japan ・Person responsible for placing on the market Name: Renesas Electronics Europe GmbH Address: Arcadiastrasse 10, 40472 Dusseldorf, Germany ・Trademark and Type name Trademark: Renesas Product name:...
-
Page 5: Preface
All the components of the R0E424270MCU00 are listed under “1.1 Package Components” (page 18). If you have any questions about the R0E424270MCU00, contact your local distributor. The manuals relevant to usage of the R0E424270MCU00 are listed below. You can download the latest manuals from the Renesas Tools homepage (https://www.renesas.com/tools). -
Page 6: Important
Purpose of use of the emulator: This emulator is a device to support the development of systems that use the H8S family H8S/2400 series of Renesas 16-bit single-chip MCUs. It provides support for system development in both software and hardware. - Page 7 Renesas or to a third party. (3) This user’s manual and this emulator are copyrighted, with all rights reserved by Renesas. This user’s manual may not be copied, duplicated or reproduced, in whole or part, without prior written consent from Renesas.
-
Page 8: Precautions For Safety
R0E424270MCU00 User’s Manual Precautions for Safety Precautions for Safety Definitions of Signal Words In both the user’s manual and on the product itself, several icons are used to insure proper handling of this product and also to prevent injuries to you or other persons, or damage to your properties. - Page 9 R0E424270MCU00 User’s Manual Precautions for Safety WARNING Warnings for AC Power Supply: ⚫ If the attached AC power cable does not fit the receptacle, do not alter the AC power cable and do not plug it forcibly. Failure to comply may cause electric shock and/or fire.
- Page 10 R0E424270MCU00 User’s Manual Precautions for Safety CAUTION Caution for AC Adapter: ⚫ The DC plug of the AC adapter has the polarity shown below. ⚫ Use an AC adapter which complies with the safety standards of the country where it is to be used.
-
Page 11: Table Of Contents
R0E424270MCU00 User’s Manual Contents Contents Page Preface ..................................5 Important ..................................6 Precautions for Safety ..............................8 Contents ..................................11 User Registration ................................ 16 Terminology ................................17 1. Outline ..................................18 1.1 Package Components ........................... 18 1.2 Other Tool Products Required for Development ................... 18 1.3 System Configuration ............................ - Page 12 R0E424270MCU00 User’s Manual Contents 3.15 Hardware Break Facility ..........................57 3.15.1 Stopping a Program when It Executes the Instruction at a Specified Address ......57 3.16 Stopping a Program when It Accesses Memory ..................58 3.17 Tracing Facility ............................59 Showing the Information Acquired in “Fill Until Stop”...
- Page 13 R0E424270MCU00 User’s Manual Contents Setting Hardware Break Conditions ......................120 5.8.1 Setting Hardware Break Conditions................... 120 5.8.2 Setting Hardware Breakpoints ....................120 5.8.3 Saving/Loading Hardware Break Settings ................. 123 Viewing Trace Information ........................124 5.9.1 Viewing Trace Information ......................124 5.9.2...
- Page 14 7.1 Target MCU Specifications .......................... 216 7.2 Differences between the Actual MCU and the Emulator ................217 7.3 Connection Diagram ............................ 219 7.3.1 Connection Diagram for the R0E424270MCU00 ................219 7.4 External Dimensions ............................ 220 7.4.1 External Dimensions of the E100 Emulator ..................220 7.4.2 External Dimensions of the Converter Board (R0E424270CFLE0) ..........
- Page 15 R0E424270MCU00 User’s Manual Contents Revision History ................................1 R20UT3586EJ0202 Rev.2.02 Page 15 of 233 Sep.01.21...
-
Page 16: User Registration
R0E424270MCU00 User’s Manual User Registration User Registration When you install debugger software, a text file for user registration is created on your PC. Fill it in and email it to your local distributor. If you have replaced an emulator main unit or emulation probe, rewrite an emulator name and serial number in the text file you filled in earlier to register your new hardware products. -
Page 17: Terminology
This means the E100 emulator for the H8S/2400 series. Emulator system This means an emulator system built around the MCU unit (R0E424270MCU00). The emulator system is configured with an emulator main unit (R0E001000EMU00), MCU unit (R0E424270MCU00), emulator power supply, USB cable, emulator debugger and host machine. -
Page 18: Outline
- User’s Manual * Please keep the R0E424270MCU00's packing box and cushioning materials at hand for later reuse in sending the product for repairs or for other purposes. Always use the original packing box and cushioning material when transporting the MCU unit. -
Page 19: System Configuration
Figure 1.1 System configuration (1) MCU unit R0E424270MCU00 (this product) This is an MCU board for the H8S/2400-series MCUs and contains an evaluation MCU. (2) Flexible cable R0E001000FLX10 (included) (3) E100 emulator main unit R0E001000EMU00 This is the E100 emulator main unit. -
Page 20: Names And Functions Of The Emulator Parts
R0E424270MCU00 User’s Manual 1. Outline 1.3.2 Names and Functions of the Emulator Parts Figure 1.2 shows the names of the emulator parts. (5) System status LEDs (4) External trigger connector (1) Power switch (2) USB cable connector (3) Power connector (6) Target status LEDs Figure 1.2 Names of the emulator parts... - Page 21 R0E424270MCU00 User’s Manual 1. Outline (5) System Status LEDs The system status LEDs indicate the E100 emulator’s power supply, operating state of firmware, etc. Table 1.3 lists the definitions of the system status LEDs. Table 1.3 Definitions of the system status LEDs...
-
Page 22: Specifications
R0E424270MCU00 User’s Manual 1. Outline 1.4 Specifications Table 1.5 lists the specifications of the R0E424270MCU00. Table 1.5 Specifications of the R0E424270MCU00 Applicable MCU H8S-family H8S/2400-series MCUs Applicable MCU mode Single-chip mode, on-chip ROM disabled extension mode, and on-chip ROM enabled extension mode Maximum ROM/RAM capacity 1. -
Page 23: Operating Environment
R0E424270MCU00 User’s Manual 1. Outline 1.5 Operating Environment Make sure to use this emulator in the operating environments listed in Tables 1.6 to 1.8. Table 1.6 Operating environmental conditions Item Description Operating temperature 5 to 35°C (no condensation) Storage temperature -10 to 60°C (no condensation) -
Page 24: Specifications Of The Ac Adapter
R0E424270MCU00 User’s Manual 1. Outline 1.6 Specifications of the AC Adapter The user must prepare an AC adapter and a power cable. Use an AC adapter which complies with the safety standards of the country where it is to be used. Table 1.9 lists the recommended specifications of the AC adapter. -
Page 25: Setup
R0E424270MCU00 User’s Manual 2. Setup 2. Setup This chapter describes the preparation for using the MCU unit, the procedure for starting up the emulator and how to change settings. 2.1 Flowchart of Starting Up the Emulator The procedure for starting up the emulator is shown in Figures 2.1 and 2.2. For details, refer to each section hereafter. If the emulator does not start up normally, refer to “6. - Page 26 R0E424270MCU00 User’s Manual 2. Setup Change the settings of the power supply and clock supply to the Change the settings. MCU, according to the conditions of use. ▼ Connect the user system. Connect the user system as the occasion demands.
-
Page 27: Installing The Included Software
R0E424270MCU00 User’s Manual 2. Setup 2.2 Installing the Included Software If you have Windows Vista®, Windows® XP or Windows® 2000 on the host machine, this installation must be executed by a user with administrator rights. Note that users without administrator rights cannot complete the installation. -
Page 28: Connecting The Mcu Unit To And Disconnecting It From The E100 Emulator Main Unit
R0E424270MCU00 User’s Manual 2. Setup 2.3 Connecting the MCU Unit to and Disconnecting it from the E100 Emulator Main Unit Figure 2.3 shows the procedure for connecting the MCU Unit to the E100 Emulator Main Unit. Connecting MCU Unit R0E424270MCU00... -
Page 29: Connecting The Host Machine
R0E424270MCU00 User’s Manual 2. Setup 2.4 Connecting the Host Machine USB interface is used to connect the emulator to the host machine. The USB cable is connected to the USB cable connector of the emulator and the USB port of the host machine. -
Page 30: Connecting The Emulator Power Supply
R0E424270MCU00 User’s Manual 2. Setup 2.5 Connecting the Emulator Power Supply Power is supplied from an AC adapter to the emulator. The following shows how to connect the AC adapter. (1) Turn OFF the power to the emulator. (2) Connect the DC cable of the AC adapter to the emulator. -
Page 31: Turning On The Power
R0E424270MCU00 User’s Manual 2. Setup 2.6 Turning ON the Power 2.6.1 Checking the Connections of the Emulator System Before turning the power ON, check the connection of the interface cable with the host machine, emulator, and user system. 2.6.2 Turning the Power ON and OFF - Turn power to the emulator and user system ON and OFF as close to simultaneously as is possible. -
Page 32: Self-Checking
R0E424270MCU00 User’s Manual 2. Setup 2.7 Self-checking Self-checking is a test run by the emulator itself to check if its functions are operating correctly. To run the self-checking function of the emulator, follow the procedure below. While self-checking is in progress, the states of the LEDs will change as shown in Figure 2.6. -
Page 33: Selecting The Clock Supply
R0E424270MCU00 User’s Manual 2. Setup 2.8 Selecting the Clock Supply 2.8.1 Clock Source You can choose the source of the clock signal for supply to the evaluation MCU on the System page in the Configuration properties dialog box of the emulator debugger. Table 2.1 shows the clock sources and their default settings. -
Page 34: Using An Internal Oscillator Circuit Board
2.8.2 Using an Internal Oscillator Circuit Board Kinds of Oscillator Circuit Boards An oscillator module (16.5 MHz) is mounted in IC16 at shipment of the R0E424270MCU00. If you wish to change the frequency, replace the oscillator module. (1) Replacing the Oscillator Module Remove the MCU unit from the E100 emulator main unit, and replace the oscillator module in IC16 (see Figure 2.7). -
Page 35: Using The Oscillator Circuit On The User System
R0E424270MCU00 User’s Manual 2. Setup 2.8.3 Using the Oscillator Circuit on the User System To operate the MCU unit with an external clock source, connect an oscillator circuit to pin EXTAL of the user system as shown in Figure 2.8. The oscillator must have an output within the operating range of the evaluation MCU and a duty cycle of 50%. -
Page 36: Connecting The User System
R0E424270MCU00 User’s Manual 2. Setup 2.9 Connecting the User System Figure 2.10 shows how to connect the MCU unit to your system. Flexible cable 120 pins 144 pins 0.4-mm pitch 0.5-mm pitch 0.5-mm pitch R0E424270CFKE0 R0E424270CFLE0 R0E0144TNPFK00 120-pin LQFP 120-pin LQFP 144-pin LQFP Figure 2.10 Connecting the MCU unit to the user system... -
Page 37: Connection To A 120-Pin 0.4-Mm Pitch Pad Pattern
R0E424270MCU00 User’s Manual 2. Setup 2.9.1 Connection to a 120-pin 0.4-mm Pitch Pad Pattern The following is the procedure for connection to a 120-pin 0.4-mm pitch pad pattern on the user system by using the R0E424270CFLE0 (not included). For details on the R0E424270CFLE0, refer to its user’s manual. -
Page 38: Connection To A 120-Pin 0.5-Mm Pitch Pad Pattern
R0E424270MCU00 User’s Manual 2. Setup 2.9.2 Connection to a 120-pin 0.5-mm Pitch Pad Pattern The following is the procedure for connection to a 120-pin 0.5-mm pitch pad pattern on the user system by using the R0E424270CFKE0 (not included). For details on the R0E424270CFKE0, refer to its user’s manual. -
Page 39: Connection To A 144-Pin 0.5-Mm Pitch Pad Pattern
R0E424270MCU00 User’s Manual 2. Setup 2.9.3 Connection to a 144-pin 0.5-mm Pitch Pad Pattern The following is the procedure for connection to a 144-pin 0.5-mm pitch pad pattern on the user system by using the R0E0144TNPFK00 (not included). For details on the R0E0144TNPFK00, refer to its user’s manual. -
Page 40: Tutorial
R0E424270MCU00 User’s Manual 3. Tutorial 3. Tutorial 3.1 Introduction A tutorial program for the E100 emulator is provided as a means of presenting the emulator’s main features to you. The tutorial is described in this section. The tutorial program was written in the C and C++ languages, and sorts random data (10 items) into ascending and descending order. -
Page 41: Starting The High-Performance Embedded Workshop
R0E424270MCU00 User’s Manual 3. Tutorial 3.2 Starting the High-performance Embedded Workshop Open a workspace by following the procedure described in “4.4 Opening an Existing Workspace” (page 77). Specify the directory given below. (Drive where the OS is installed)\Workspace\Tutorial\E100\H8S2400\Tutorial Specify the file shown below. -
Page 42: Downloading The Tutorial Program
R0E424270MCU00 User’s Manual 3. Tutorial 3.4 Downloading the Tutorial Program 3.4.1 Downloading the Tutorial Program Download the object program you want to debug. Note, however, that the name of a program to be downloaded and the address where the program will be downloaded depend on the MCU in use. Accordingly, strings shown in the screen shots should be altered to those for the MCU in use. -
Page 43: Displaying The Source Program
R0E424270MCU00 User’s Manual 3. Tutorial 3.4.2 Displaying the Source Program In the High-performance Embedded Workshop you can debug programs at the source level. Double-click on the C++ source file Tutorial.cpp. Figure 3.3 Editor window (displaying the source program) If necessary, you can change the font and size to make the text more easily readable. For details, refer to the High-performance Embedded Workshop User’s Manual. -
Page 44: Setting Software Breakpoints
R0E424270MCU00 User’s Manual 3. Tutorial 3.5 Setting Software Breakpoints Setting of software breakpoints is one simple debugging facility. Software breakpoints are easy to set in the Editor window. For example, you can set a software breakpoint at the line where the sort function is called. -
Page 45: Executing The Program
R0E424270MCU00 User’s Manual 3. Tutorial 3.6 Executing the Program The following describes how to run the program. 3.6.1 Resetting the CPU To reset the CPU, choose Reset CPU from the Debug menu or click on the Reset CPU toolbar button [ 3.6.2 Executing the Program... -
Page 46: Checking Breakpoints
R0E424270MCU00 User’s Manual 3. Tutorial The Status window permits you to check the cause of the last break to have occurred. Choose CPU − Status from the View menu or click on the View Status toolbar button [ ]. When the Status window is displayed, open the Target sheet and check the cause of the break. -
Page 47: Altering Register Contents
R0E424270MCU00 User’s Manual 3. Tutorial 3.8 Altering Register Contents Choose CPU -> Registers from the View menu or click on the Registers toolbar button [ ]. The Register window shown below will be displayed. Figure 3.8 Register window The contents of any register can be altered. -
Page 48: Referring To Symbols
R0E424270MCU00 User’s Manual 3. Tutorial 3.9 Referring to Symbols The Labels window permits you to view the symbolic information in a module. Choose Symbols − Labels from the View menu or click on the Labels toolbar button [ ].The Labels window shown below will be displayed. -
Page 49: Checking Memory Contents
R0E424270MCU00 User’s Manual 3. Tutorial 3.10 Checking Memory Contents After you have specified a label name, you can use the Memory window to check the contents of memory where that label is registered. For example, you can check the contents of memory corresponding to _main in byte units, as shown below. -
Page 50: Referring To Variables
R0E424270MCU00 User’s Manual 3. Tutorial 3.11 Referring to Variables When single-stepping through a program, you can see how the values of the variables used in the program change as you step through source lines or instructions. For example, by following the procedure described below, you can look at the long-type array ‘a’... - Page 51 R0E424270MCU00 User’s Manual 3. Tutorial Enter variable ‘i’ in the Variable or expression edit box and click on the OK button. The int-type variable ‘i’ will be displayed in the Watch window. Figure 3.16 Watch window (showing a variable) Click on the “+” mark shown to the left of the array ‘a’ in the Watch window. You can now look at the individual elements of the array ‘a.’...
-
Page 52: Showing Local Variables
R0E424270MCU00 User’s Manual 3. Tutorial 3.12 Showing Local Variables By using the Local window, you can view the local variables included in a function. As an example, let’s check the local variables of the tutorial function. Four local variables are declared in this function: ‘a,’ ‘j,’ ‘i’ and ‘p_sam.’... -
Page 53: Executing Step In Command
R0E424270MCU00 User’s Manual 3. Tutorial 3.13.1 Executing Step In Command The Step In command ‘steps in’ to a called function and stops at the first statement of the function. To enter the sort function, choose Step In from the Debug menu or click on the Step In toolbar button. -
Page 54: Executing The Step Out Command
R0E424270MCU00 User’s Manual 3. Tutorial 3.13.2 Executing the Step Out Command The Step Out command takes execution out of a called function by completing its execution at once and only stopping at the next statement of the program from which the function was called. -
Page 55: Executing The Step Over Command
R0E424270MCU00 User’s Manual 3. Tutorial 3.13.3 Executing the Step Over Command The Step Over command executes the whole of a function call as one step and then stops at the next statement of the main program. To execute all statements in the change function at once, choose Step Over from the Debug menu or click on the Step Over toolbar button. -
Page 56: Forcibly Breaking Program Execution
R0E424270MCU00 User’s Manual 3. Tutorial 3.14 Forcibly Breaking Program Execution The High-performance Embedded Workshop permits you to forcibly break program execution. Clear all breakpoints. To execute the rest of the tutorial function, choose Go from the Debug menu or click on the Go toolbar button. -
Page 57: Hardware Break Facility
R0E424270MCU00 User’s Manual 3. Tutorial 3.15 Hardware Break Facility A hardware break causes the program to stop when it executes the instruction at a specified address (instruction fetch) or reads from or writes to a specified memory location (data access). -
Page 58: Stopping A Program When It Accesses Memory
R0E424270MCU00 User’s Manual 3. Tutorial 3.16 Stopping a Program when It Accesses Memory To make a program stop when it reads or writes the value of a global variable, follow the procedure below. Choose Event -> Hardware Break from the View menu to open the Hardware Break dialog box. -
Page 59: Tracing Facility
R0E424270MCU00 User’s Manual 3. Tutorial 3.17 Tracing Facility The tracing facility of the E100 emulator includes a special memory unit known as “trace memory” that can hold a record of the execution of up to 4-M bus cycles. This memory is constantly updated during program execution. The contents of trace memory are displayed in the Trace window. -
Page 60: Showing The Information Acquired In "Fill Until Stop" Tracing
R0E424270MCU00 User’s Manual 3. Tutorial 3.17.1 Showing the Information Acquired in “Fill Until Stop” Tracing In “fill until stop” tracing, trace information is successively acquired from the start of user program execution until a break is encountered. (1) Clear all break conditions. Click the right mouse button with the cursor anywhere in the Trace window and choose Acquisition from the popup menu. - Page 61 R0E424270MCU00 User’s Manual 3. Tutorial (2) Set a software break on the following line of the tutorial function: “p_sam ->s0=a[0];”. (3) Choose Reset Go from the Debug menu. Processing will be halted by the break, and the trace information acquired prior to the break will be displayed in the Trace window.
- Page 62 R0E424270MCU00 User’s Manual 3. Tutorial (5) Choosing Display Mode − SRC from the popup menu, on the other hand, shows a mixture of bus information, disassembly listing, and source code as the trace information. Figure 3.33 Trace window (mixed bus, disassembly, and source mode) R20UT3586EJ0202 Rev.2.02...
-
Page 63: Showing The Information Acquired In "Fill Around Tp" Tracing
R0E424270MCU00 User’s Manual 3. Tutorial 3.17.2 Showing the Information Acquired in “Fill around TP” Tracing In “fill around TP” tracing, the acquisition of trace information is stopped a specified number of cycles after a trace point is encountered. This facility allows you to use trace information to keep track of program flow without having to break the user program. - Page 64 R0E424270MCU00 User’s Manual 3. Tutorial (3) Next, set the trace point, i.e. the point where the debugger will start acquiring trace information. Open the OR page of the Trace conditions dialog box. Select the main function in the Editor window and drag-and-drop it onto the OR page. Click on the Apply button and then the Close button.
-
Page 65: Showing A History Of Function Execution
R0E424270MCU00 User’s Manual 3. Tutorial 3.17.3 Showing a History of Function Execution A function execution history can be displayed from the acquired trace information. You can extract the history of executed functions from the acquired trace information. (1) Clear all break conditions. Click the right mouse button with the cursor anywhere in the Trace window and choose Acquisition from the popup menu. - Page 66 R0E424270MCU00 User’s Manual 3. Tutorial (5) Click the right mouse button with the cursor anywhere in the upper pane of the Trace window and choose Analyze Execution History from the popup menu. The history of function execution will be displayed in the upper pane.
-
Page 67: Filter Facility
R0E424270MCU00 User’s Manual 3. Tutorial 3.17.4 Filter Facility Use the filtering facility to extract specific cycles from the acquired trace information. This is achieved by software filtering of the trace information that was acquired by hardware. Unlike the “Capture/Do not Capture conditions” where you set conditions for acquisition before getting the trace information, this facility allows you to change filter settings for the acquired trace information any number of times without having to reexecute the program. - Page 68 R0E424270MCU00 User’s Manual 3. Tutorial (5) Click on the [ ]button in the R/W column and choose R. Figure 3.41 Trace window (Auto Filter) (6) The Trace window now only shows trace information for cycles that have R in the R/W column.
-
Page 69: Stack Trace Facility
R0E424270MCU00 User’s Manual 3. Tutorial 3.18 Stack Trace Facility Stack information can be used to find out which function called the function corresponding to the current PC value. Set a software breakpoint in any line of the tutorial function by double-clicking on the corresponding row in the S/W Breakpoints column. -
Page 70: What Next
R0E424270MCU00 User’s Manual 3. Tutorial After the break, choose Code − Stack Trace from the View menu to open the Stack Trace window. Figure 3.44 Stack Trace window You will see that the current PC value is within the tutorial() function, and that the tutorial() function was called from the main() function. -
Page 71: Preparation For Debugging
Follow the procedure below to start the High-performance Embedded Workshop. (1) Connect the host machine, E100 emulator, and user system. Then turn on power to the E100 emulator and user system. (2) From Programs on the Start menu, choose Renesas -> High-performance Embedded Workshop -> High-performance Embedded Workshop. -
Page 72: Creating A New Workspace (Toolchain Unused)
R0E424270MCU00 User’s Manual 4. Preparation for Debugging 4.2 Creating a New Workspace (Toolchain Unused) The procedure for creating a new project workspace differs according to whether you are using a toolchain or not. Toolchains are not included with the E100 emulator. Toolchains can be used in environment in which the C/C++ compiler package is installed. - Page 73 R0E424270MCU00 User’s Manual 4. Preparation for Debugging The other list boxes are used for setting up a toolchain. If no toolchains are installed, fixed information is displayed here. Click on the OK button. (3) Select the target for debugging. Figure 4.4 Setting the Target System for Debugging dialog box Select the target platform you wish to use by placing a check mark in its checkbox and click on the Next button.
-
Page 74: Creating A New Workspace (With A Toolchain In Use)
R0E424270MCU00 User’s Manual 4. Preparation for Debugging When you have finished setting the configuration names, emulator-related settings are completed. Click on the Finish button, and the Summary dialog box will be displayed. Clicking on the OK button in this dialog box starts the High-performance Embedded Workshop. - Page 75 R0E424270MCU00 User’s Manual 4. Preparation for Debugging Workspace Name: Enter a workspace name here. Project Name: Enter a project name here. You do not need to enter any name if you wish this to be the same as the workspace name.
- Page 76 R0E424270MCU00 User’s Manual 4. Preparation for Debugging (5) Set a configuration name. Figure 4.9 Setting the Debugger Options dialog box If you have selected two or more target platforms, click on the Next button and then set a configuration name for each of the selected target platforms.
-
Page 77: Opening An Existing Workspace
R0E424270MCU00 User’s Manual 4. Preparation for Debugging 4.4 Opening an Existing Workspace Follow the procedure below to open an existing workspace. (1) In the Welcome! dialog box, select the radio button with the caption “Browse to another project workspace” and click on the OK button. -
Page 78: Connecting The Emulator
R0E424270MCU00 User’s Manual 4. Preparation for Debugging 4.5 Connecting the Emulator 4.5.1 Connecting the Emulator The following methods for connecting the emulator are available. (1) Making the emulator settings in booting-up before connection Choose Debug Settings from the Debug menu to open the Debug Settings dialog box. In this dialog box, you can register download modules and the command chain to be automatically executed. -
Page 79: Making Debugging-Related Settings
R0E424270MCU00 User’s Manual 4. Preparation for Debugging 4.8 Making Debugging-Related Settings Register download modules, set up automatic execution of command line batch files, and set download options, etc. 4.8.1 Specifying a Module for Downloading Choose Debug Settings from the Debug menu to open the Debug Settings dialog box. -
Page 80: Setting Up Automatic Execution Of Command Line Batch Files
R0E424270MCU00 User’s Manual 4. Preparation for Debugging 4.8.2 Setting Up Automatic Execution of Command Line Batch Files Click on the Options tab of the dialog box. Figure 4.13 Debug Settings dialog box Here, register a command chain to be automatically executed with the specified timing. -
Page 81: Debugging Functions
R0E424270MCU00 User’s Manual 5. Debugging Functions 5. Debugging Functions The E100 emulator supports the functions listed in the table below. Table 5.1 List of Debugging Functions Item Item Specification Software break 4,096 points Number of event points Maximum number of effective points: 16... -
Page 82: Setting Up The Emulation Environment
R0E424270MCU00 User’s Manual 5. Debugging Functions Table 5.1 List of Debugging Functions (cont) Item Item Specification C0 level code coverage 256 Kbytes 8 blocks (2-Mbyte space) Address range and source file C0 + C1 level code coverage 128 Kbytes 8 blocks (1-Mbyte space) -
Page 83: Setting Up The Target Mcu
R0E424270MCU00 User’s Manual 5. Debugging Functions 5.1.2 Setting Up the Target MCU (1) Selecting the target MCU On the Device page of the Device setting dialog box, specify the target MCU to be emulated. For details, refer to the hardware manual supplied with each product. - Page 84 R0E424270MCU00 User’s Manual 5. Debugging Functions (4) Usage with the RAME bit of SYSCR as 1 The state of the RAME bit in SYSCR is selectable. Select this checkbox when the target program is for execution with the RAME bit in SYSCR as 1. This option is only available for MCUs that have an RAME bit in SYSCR.
-
Page 85: Setting Up The System
R0E424270MCU00 User’s Manual 5. Debugging Functions 5.1.3 Setting Up the System On the System page of the Configuration Properties dialog box, specify the configuration of the emulator system as a whole. During the boot-up process, this dialog box appears after the Device setting dialog box. - Page 86 R0E424270MCU00 User’s Manual 5. Debugging Functions (2) Selecting the direction of the external trigger cable For the external trigger cable, select the direction of EXT pins 16–31 as input or output. EXT pins 0–15 are fixed as inputs. Select either of the following options: - EXT 0–31 INPUT (default)
- Page 87 R0E424270MCU00 User’s Manual 5. Debugging Functions (10) Enable or disable IRQ input signals Specify the hexadecimal number for the pattern of bits that corresponds to the user IRQ signals (IRQn) that you wish to monitor. 0: Disables monitoring of IRQn 1: Enables monitoring of IRQn n = 15 to 0.
-
Page 88: Setting Up The Memory Map
R0E424270MCU00 User’s Manual 5. Debugging Functions 5.1.4 Setting up the Memory Map The Memory map page of the Configuration properties dialog box allows the user to assign up to four blocks of emulation memory. Figure 5.3 Configuration properties dialog box (Memory map page) The MCU currently in use is automatically displayed in the ‘MCU’... -
Page 89: Setting For Overwriting Blocks Of The Flash Rom
R0E424270MCU00 User’s Manual 5. Debugging Functions 5.1.5 Setting for Overwriting Blocks of the Flash ROM The Internal flash memory overwrite page of the Configuration properties dialog box allows you to specify whether or not individual blocks of flash ROM should be overwritten. -
Page 90: Settings To Request Notification Of Exceptional Events
R0E424270MCU00 User’s Manual 5. Debugging Functions 5.1.6 Settings to Request Notification of Exceptional Events The Exception Warning page of the Configuration properties dialog box allows you to select whether or not to display warnings in the Status window and as a balloon on the status bar when exceptional events occur. -
Page 91: Viewing The Progress Of Boot-Up Processing
R0E424270MCU00 User’s Manual 5. Debugging Functions 5.1.7 Viewing the Progress of Boot-Up Processing You can check the progress of boot-up processing in the Connecting dialog box. This dialog box appears when boot-up processing is started and remains open until it is completed. - Page 92 R0E424270MCU00 User’s Manual 5. Debugging Functions (3) Display of states of clock signals This information will be updated on completion of processing for the clock settings. Only information on the clock signals that are actually operating is shown here. (4) State of progress as progress bars The upper progress bar shows the state of progress through the overall process of booting up.
-
Page 93: Downloading A Program
R0E424270MCU00 User’s Manual 5. Debugging Functions 5.2 Downloading a Program 5.2.1 Downloading a Program Download the load module to be debugged. To download a program, choose Download from the Debug menu and select a desired load module or right-click on a load module under Download modules of the Workspace window and then choose Download from the popup menu. - Page 94 R0E424270MCU00 User’s Manual 5. Debugging Functions This column shows the line numbers of lines in the source file. (2) Source Address column When a program is downloaded, this column shows the addresses that correspond to the lines of the current source file. This function is convenient for determining values for the PC and where to set breakpoints.
-
Page 95: Turning Columns In All Source Files Off
R0E424270MCU00 User’s Manual 5. Debugging Functions 5.2.3 Turning Columns in All Source Files off (1) From the Editor window 1. Right-click in the Editor window and choose Define Column Format from the popup menu. 2. The Global Editor Column States dialog box will be displayed. -
Page 96: Viewing Assembly Language Code
R0E424270MCU00 User’s Manual 5. Debugging Functions 5.2.5 Viewing Assembly Language Code While a source file is open, click the right mouse button in the Editor window and choose View Disassembly from the popup menu. The Disassembly window will be displayed. -
Page 97: Correcting Assembly Language Code
R0E424270MCU00 User’s Manual 5. Debugging Functions (2) Code Coverage - ASM column This column graphically shows the C0 code coverage information. (3) S/W Breakpoints - ASM column This column shows the following: Table 5.5 Icons in the S/W Breakpoints – ASM column... -
Page 98: Viewing Memory Data In Real Time
R0E424270MCU00 User’s Manual 5. Debugging Functions 5.3 Viewing Memory Data in Real Time 5.3.1 Viewing Memory Data in Real Time Use the RAM Monitor window to monitor data in memory while the user program is running. The RAM monitoring function permits recording and inspection of the data in an area of memory for which monitoring has been assigned and the states of access in real time without obstructing execution of the user program. -
Page 99: Setting The Update Interval For Ram Monitoring
R0E424270MCU00 User’s Manual 5. Debugging Functions (3) Detecting reading from non-initialized areas If a memory location is read but nothing has been written to that location, the emulator detects “a non-initialized area” and indicates the error. To view errors of this type, choose Error Detection Display from the popup menu. -
Page 100: Viewing The Current Status
R0E424270MCU00 User’s Manual 5. Debugging Functions 5.4 Viewing the Current Status 5.4.1 Viewing the Emulator Status To find out the current status of the emulator, open the Status window. To open the Status window, choose CPU -> Status from the View menu, or click on the View Status toolbar button [ The information shown in this window is not updated while the program is running. -
Page 101: Viewing The Emulator Status In The Status Bar
R0E424270MCU00 User’s Manual 5. Debugging Functions 5.4.2 Viewing the Emulator Status in the Status Bar The status of the emulator can be displayed in the status bar. Right clicking on the status bar brings up a list of the available items. Check the items you want to view in the status bar. -
Page 102: Periodically Reading Out And Showing The Emulator Status
R0E424270MCU00 User’s Manual 5. Debugging Functions Figure 5.16 Example of warning display when exceptional events have occurred 5.5 Periodically Reading Out and Showing the Emulator Status 5.5.1 Periodically Reading Out and Showing the Emulator Information To find out about changes in emulator information whether the user program is running or idle, use the Extended Monitor window. -
Page 103: Selecting The Items To Be Displayed
R0E424270MCU00 User’s Manual 5. Debugging Functions 5.5.2 Selecting the Items to Be Displayed Choose Properties from the popup menu of the Extended Monitor window. The Extended Monitor Configuration dialog box will be displayed. Figure 5.18 Extended Monitor Configuration dialog box This dialog box allows you to select items to be shown in the Extended Monitor window. -
Page 104: Using Software Breakpoints
R0E424270MCU00 User’s Manual 5. Debugging Functions 5.6 Using Software Breakpoints 5.6.1 Using Software Breakpoints In a software break, the instruction code at a specified address is replaced with a BRK instruction, which causes the user program to stop running by generating a BRK interrupt. In that sense, this is a pre-execution break function. - Page 105 R0E424270MCU00 User’s Manual 5. Debugging Functions (1) From the Editor or Disassembly window 1. Check that the Editor or Disassembly window that is currently open shows the position at which you want to set a software breakpoint. 2. In the S/W Breakpoints column, double-click on the line where you want the program to stop.
-
Page 106: Enabling And Disabling Software Breakpoints
R0E424270MCU00 User’s Manual 5. Debugging Functions 5.6.3 Enabling and Disabling Software Breakpoints Select one of the following ways to enable or disable software breakpoints. - From the Editor or Disassembly window - From the Breakpoints dialog box - From the command line (1) From the Editor or Disassembly window 1. - Page 107 R0E424270MCU00 User’s Manual 5. Debugging Functions (2) From the Breakpoints dialog box 1. Select Source Breakpoints from the Edit menu to bring up the Breakpoints dialog box. In this dialog box, you can alternately enable, disable, or remove a currently set breakpoint.
-
Page 108: Using Events
R0E424270MCU00 User’s Manual 5. Debugging Functions 5.7 Using Events 5.7.1 Using Events An event refers to a combination of phenomena that occur during program execution. The E100 emulator permits you to use an event you have set as a condition for the break, trace or performance-analysis function. - Page 109 R0E424270MCU00 User’s Manual 5. Debugging Functions (1) Creating a new event [Creating an event in the Hardware Break, Trace conditions, or Performance Analysis Conditions dialog box] 1. Click on the Add button or double-click on the line where the new event is to be added.
- Page 110 R0E424270MCU00 User’s Manual 5. Debugging Functions [Adding an event from the Registered Events dialog box] 1. Click on the Add button in the Registered Events dialog box. Figure 5.27 Registered Events dialog box 2. The Event dialog box shown below will be displayed. Set details of the event condition in this dialog box. Enter a comment if any is necessary.
- Page 111 R0E424270MCU00 User’s Manual 5. Debugging Functions 3. The event is added to the list of registered events. Figure 5.29 Registered Events dialog box (2) Adding an event from the Event column of the Editor window [Adding a hardware breakpoint] 1. Select HW Break Point from the popup menu opened by double-clicking or right clicking in the Event column of the Editor window.
- Page 112 R0E424270MCU00 User’s Manual 5. Debugging Functions 2. If the number of events currently set allows room for another, the event you have added from the Editor window is added as an OR condition. If there is no room, an error message is displayed.
- Page 113 R0E424270MCU00 User’s Manual 5. Debugging Functions (3) Adding events by dragging and dropping [Dragging and dropping a variable or function name in the Editor window] 1. By dragging and dropping a variable name into the Event column, you can set access to that variable as an event to be detected, i.e.
-
Page 114: Removing Events
R0E424270MCU00 User’s Manual 5. Debugging Functions 5.7.3 Removing Events The following ways of removing events are available. [Deleting an event from the Hardware Break, Trace conditions, or Performance Analysis Conditions dialog box] To remove one point, select the line you want to remove in the Event list and then click on the Delete button (or use the keys Ctrl + Del instead of clicking on the button). - Page 115 R0E424270MCU00 User’s Manual 5. Debugging Functions [Deleting an event from the Registered Events dialog box] To remove one point, select the line you want to remove in the Registered Events dialog box and then click on the Delete button (or use the keys Ctrl + Del instead of clicking on the button).
-
Page 116: Registering Events
R0E424270MCU00 User’s Manual 5. Debugging Functions 5.7.4 Registering Events “Registering an event” refers to placing an event in the list of registered events. A registered event can be reused at a later time. Select one of the following ways to register an event. Up to 256 events can be registered. - Page 117 R0E424270MCU00 User’s Manual 5. Debugging Functions [Registering an event by dragging and dropping] An event you have created can be registered in the Registered Events dialog box by dragging and dropping it into the list. Figure 5.38 Hardware Break dialog box and Registered Events dialog box [Registering an event in the Registered Events dialog box] Click on the Add button to create an event.
-
Page 118: Creating Events For Each Instance Of Usage Or Reusing Events
R0E424270MCU00 User’s Manual 5. Debugging Functions 5.7.5 Creating Events for Each Instance of Usage or Reusing Events The following two approaches are available for setting events in the Hardware Break, Trace conditions, or Performance Analysis Conditions dialog box. One is to create events in the dialog box each time they are to be used. The other is to choose a condition from the Registered Events dialog box and drag and drop it into the Event list in the Hardware Break, Trace conditions, or Performance Analysis Conditions dialog box. -
Page 119: Activating Events
R0E424270MCU00 User’s Manual 5. Debugging Functions 5.7.6 Activating Events To activate the settings for events that you have created, click on the Apply button. Settings you make do not become effective until you click on the Apply button. [*] after the title on the title bar of the Hardware Break, Trace conditions, or Performance Analysis Conditions dialog box indicates that some setting is being edited. -
Page 120: Setting Hardware Break Conditions
R0E424270MCU00 User’s Manual 5. Debugging Functions 5.8 Setting Hardware Break Conditions 5.8.1 Setting Hardware Break Conditions A hardware break causes the user program to stop running a specified number of cycles after a specific event or phenomenon is detected (i.e., a hardware breakpoint is encountered). Up to 16 events can be specified as hardware breakpoint conditions. - Page 121 R0E424270MCU00 User’s Manual 5. Debugging Functions (2) Setting an OR condition You can choose to enable or disable the OR condition. By default, the OR condition is enabled. To disable the OR condition, deselect the checkbox to the left of “OR condition.”...
- Page 122 R0E424270MCU00 User’s Manual 5. Debugging Functions (3) Setting other conditions You can select one from among five available choices: AND (cumulative), AND (simultaneous), Subroutine, Sequential and State transitions. To set any condition, select the checkbox to the left of “Other conditions.” Other conditions are disabled by default (the checkbox to the left of “Other conditions”...
-
Page 123: Saving/Loading Hardware Break Settings
R0E424270MCU00 User’s Manual 5. Debugging Functions (4) Detection of exceptional events Specify whether you want detection of the following exceptional events to be used as a breakpoint. - Violation of access protection - Reading from a non-initialized memory area - Stack access violation... -
Page 124: Viewing Trace Information
R0E424270MCU00 User’s Manual 5. Debugging Functions 5.9 Viewing Trace Information 5.9.1 Viewing Trace Information Tracing means the acquisition of bus information per cycle and storage of this information in trace memory during user program execution. You can use tracing to track the flow of application execution or to search for and examine the points where problems arise. - Page 125 R0E424270MCU00 User’s Manual 5. Debugging Functions The following items are shown in the Trace window (in bus display mode). Table 5.13 Items shown in the Trace window Column Description Cycle Number of the cycle within trace memory. By default, the number of the last cycle to have been acquired is 0, and earlier cycles are assigned progressively lower numbers in sequence, i.e.
- Page 126 R0E424270MCU00 User’s Manual 5. Debugging Functions Description Column IMD2 Interrupt mask levels of the extend register in interrupt control mode 2. Display form Description Bit EXR I2 Bit EXR I1 Bit EXR I0 The entry under IMD2 is "-" if IMD0 values are being displayed.
-
Page 127: Setting Conditions For Trace Information Acquisition
R0E424270MCU00 User’s Manual 5. Debugging Functions 5.9.3 Setting Conditions for Trace Information Acquisition Since the size of the trace buffer is limited, the oldest trace data is overwritten with new data after the buffer has become full. You can set trace conditions to restrict the acquired trace information to that which is useful, thus more effectively using the trace buffer. - Page 128 R0E424270MCU00 User’s Manual 5. Debugging Functions (3) Selecting Capture or Do not capture If the selected trace mode is Fill until stop, Fill until full or Fill around TP, you can specify Capture or Do not capture in the Record condition group box.
-
Page 129: Selecting The Trace Mode
R0E424270MCU00 User’s Manual 5. Debugging Functions 5.9.4 Selecting the Trace Mode (1) Selecting the trace mode The following five trace modes are available. Table 5.14 Trace modes Trace mode Description Fill until stop Trace acquisition continues until the program stops running. - Page 130 R0E424270MCU00 User’s Manual 5. Debugging Functions Specifiable conditions vary with the trace mode, as summarized in the tables below. 1. Fill until stop The trace memory can hold up to 4-M bus cycles. When the buffer becomes full, the oldest data among the acquired trace information are overwritten with new data.
-
Page 131: Setting Trace Points
R0E424270MCU00 User’s Manual 5. Debugging Functions 5. Repeat fill until full For each time trace point encountered, information for a total of 512 cycles before and after that point is acquired. Acquisition continues in the same way until the trace memory overflows, at which time acquisition is halted. The positions where trace points have been encountered can be checked in the Trace window. - Page 132 R0E424270MCU00 User’s Manual 5. Debugging Functions (2) OR condition You can choose to enable or disable the OR condition. By default, the OR condition is enabled. When the OR condition is re-enabled, the previous event settings on the OR page (with their checkboxes being selected) are restored.
- Page 133 R0E424270MCU00 User’s Manual 5. Debugging Functions (3) Other conditions You can select one from among five available choices: AND (cumulative), AND (simultaneous), Subroutine, Sequential and State transitions. To set any condition, select the checkbox to the left of “Other conditions.”...
- Page 134 R0E424270MCU00 User’s Manual 5. Debugging Functions (4) Detection of exceptional events Specify whether you want detection of the following exceptional events to be used as a trace point. - Violation of access protection - Reading from a non-initialized memory area...
-
Page 135: Setting Extraction Or Elimination Conditions
R0E424270MCU00 User’s Manual 5. Debugging Functions 5.9.6 Setting Extraction or Elimination Conditions If the selected trace mode is Fill until stop, Fill until full or Fill around TP, you can specify a condition for capturing or not capturing information. You can specify events so as to extract only the required portions or to eliminate non-required portions of the trace information. - Page 136 R0E424270MCU00 User’s Manual 5. Debugging Functions CAUTION When you specify conditions for extraction or elimination, you cannot select DIS (disassembly mode) or SRC (source mode) from Display Mode in the popup menu of the Trace window. When you specify a data-access event as a condition for extraction or elimination, be sure to specify MCU bus as the access type.
-
Page 137: Selecting The Type Of Trace Information To Be Acquired
R0E424270MCU00 User’s Manual 5. Debugging Functions 5.9.7 Selecting the Type of Trace Information to be Acquired Select the type of trace information to be stored in the trace memory. Make this selection on the Option page of the Trace conditions dialog box. -
Page 138: Viewing Trace Results
R0E424270MCU00 User’s Manual 5. Debugging Functions 5.9.8 Viewing Trace Results To check trace results, open the Trace window. Trace results can be shown in one of the following display modes: bus, disassembly, source, or mixed. The display can be switched by changing the selection of Display Mode in the popup menu of the Trace window. - Page 139 R0E424270MCU00 User’s Manual 5. Debugging Functions (3) Source Display Mode From the popup menu, choose Display Mode -> SRC. This mode shows the flow of execution of the source program. You can check the flow of execution by stepping forwards and backwards through the source code from the current trace cycle.
-
Page 140: Filtering Trace Information
R0E424270MCU00 User’s Manual 5. Debugging Functions 5.9.9 Filtering Trace Information Use the filtering facility to extract only the records you need from the acquired trace information. This facility is achieved by software filtering of the trace information that has been acquired by hardware. - Page 141 R0E424270MCU00 User’s Manual 5. Debugging Functions If you have specified multiple items in an Option dialog box, these items constitute an OR condition for use in filtering. Figure 5.62 Option dialog box R20UT3586EJ0202 Rev.2.02 Page 141 of 233 Sep.01.21...
-
Page 142: Searching For Trace Records
R0E424270MCU00 User’s Manual 5. Debugging Functions 5.9.10 Searching for Trace Records You can search the acquired trace information for a specific trace record. To search for trace records, use the Find dialog box. Open this by choosing Find -> Find from the popup menu of the Trace window or clicking on the Find toolbar button [ ] in the toolbar. -
Page 143: Saving Trace Information In Files
R0E424270MCU00 User’s Manual 5. Debugging Functions (1) Search history The search conditions that have been used are recorded in the History column and are retained throughout a session of the High-performance Embedded Workshop. If you want to perform a search again, choose the corresponding line from the history and click on the Add button to initiate a new search for trace information with the same condition. -
Page 144: Loading Trace Information From Files
R0E424270MCU00 User’s Manual 5. Debugging Functions 5.9.12 Loading Trace Information from Files To load trace information from a file, choose File -> Load from the popup menu or click on the Load toolbar button [ Specify a trace information file that was saved in the binary format. The current results of tracing are overwritten. -
Page 145: Viewing The History Of Function Execution
R0E424270MCU00 User’s Manual 5. Debugging Functions 5.9.16 Viewing the History of Function Execution To view the history of function execution extracted from the acquired trace information, choose Function Execution History -> Function Execution History from the popup menu or click on the Function Execution History toolbar button [ An upper pane will be opened in the Trace window (the pane is blank by default). -
Page 146: Viewing The History Of Task Execution
R0E424270MCU00 User’s Manual 5. Debugging Functions 5.9.17 Viewing the History of Task Execution The history of task execution can only be displayed when you are debugging a realtime OS program. Furthermore, to view the history of task execution, you need to select Task ID on the Option page of the Trace conditions dialog box that is displayed when you choose Acquisition from the popup menu of the Trace window. -
Page 147: Measuring Performance
R0E424270MCU00 User’s Manual 5. Debugging Functions 5.10 Measuring Performance 5.10.1 Measuring Performance The performance measurement facility of the emulator is capable of measuring the maximum, minimum, average and total execution times and the number of passes for each of up to eight specified sections of the user program, and shows ratios of time relative to the overall execution time (Go–Break) as percentages and graphically. -
Page 148: Setting Performance Measurement Conditions
R0E424270MCU00 User’s Manual 5. Debugging Functions The contents displayed in this window are listed below. Table 5.23 Columns and contents Column Description Numbers from 1–8 that are assigned to the measurement sections set up in the Performance Analysis Conditions dialog box. - Page 149 R0E424270MCU00 User’s Manual 5. Debugging Functions (1) Setting measurement conditions The measurement mode can be selected from among the four choices listed in Table 5.24. Select one measurement mode for one section. Use events to specify the beginning and end of a section. The value of Count is fixed to 1. The event count is always 1, even if you have attempted to specify some other value.
-
Page 150: Starting Performance Measurement
R0E424270MCU00 User’s Manual 5. Debugging Functions Table 5.25 Measurement modes (continued) [Interrupt-disabled range between two events] Figure 5.70 Interrupt-disabled range between two events Measurement is of ranges over which interrupts are disabled from the start event to the end event. -
Page 151: Clearing Performance Measurement Conditions
R0E424270MCU00 User’s Manual 5. Debugging Functions 5.10.5 Clearing Performance Measurement Conditions Select the measurement condition you want to clear in the Performance Analysis window and then choose Set from the popup menu to display the Performance Analysis Conditions dialog box. In the Performance Analysis Conditions dialog box, disable the condition you want to clear. -
Page 152: Measuring Code Coverage
R0E424270MCU00 User’s Manual 5. Debugging Functions 5.11 Measuring Code Coverage 5.11.1 Measuring Code Coverage Code coverage refers to measures of the condition of a program in terms of ‘digestion’ by tests, i.e., the degree of thoroughness of tests of the software code (and the paths within it). -
Page 153: Allocating Code Coverage Memory (Hardware Resource)
R0E424270MCU00 User’s Manual 5. Debugging Functions (1) Measurement method The Code Coverage window has two sheets. Table 5.28 Sheets of the Code Coverage window Sheet Description Address Range Measurement is performed on any address range. Source Measurement is performed on a specified source file The respective sheets permit registration of multiple ranges. - Page 154 R0E424270MCU00 User’s Manual 5. Debugging Functions Figure 5.73 Allocation of Code Coverage Memory dialog box When using C0 level coverage and C1 level coverage, you can specify a number of blocks from 1 to 8 (for a total of up to 2 Mbytes), each beginning on a 256-Kbyte boundary, and a number of blocks from 1 to 8 blocks (for a total of up to 1 Mbyte), each beginning on a 128-Kbyte boundary, as areas for the respective forms of code coverage measurement.
- Page 155 R0E424270MCU00 User’s Manual 5. Debugging Functions (2) Changing memory allocation When the allocation of coverage memory is changed, the coverage data acquired from the target address ranges prior to the change is retrieved from coverage memory into a dedicated coverage buffer.
-
Page 156: Code Coverage In An Address Range
R0E424270MCU00 User’s Manual 5. Debugging Functions 5.11.4 Code Coverage in an Address Range The Address Range sheet shows the code-coverage information (C0 coverage and C1 coverage) acquired by the emulator from a user-specified address range. Multiple address ranges can be registered. -
Page 157: Code Coverage In A Source File
R0E424270MCU00 User’s Manual 5. Debugging Functions Acquired coverage information is accumulated in memory until it is cleared by the user. When you double click on an assembler instruction in the Address Range sheet, the corresponding source code is shown in the Editor window. -
Page 158: Showing Percentages And Graphs
R0E424270MCU00 User’s Manual 5. Debugging Functions The lower pane shows a detailed (assembly-language level) view of the address range selected in the upper pane. Table 5.32 Contents of the lower pane of the Code Coverage window [Executed] 1: The instruction was executed. -
Page 159: Sorting Coverage Data
R0E424270MCU00 User’s Manual 5. Debugging Functions CAUTION While [Percentage Auto Calculate] is active, stepping may take more time because the emulator calculates the coverage every time there is a break in user program execution. The larger the areas specified for coverage measurement, the longer the calculation of percentages takes. -
Page 160: Searching For Nonexecuted Lines
R0E424270MCU00 User’s Manual 5. Debugging Functions (3) Clicking on the C0 Coverage and File columns, in that order The data for each file is sorted by coverage rate in descending order. Example: File Function C0 Coverage -------------------------------------- 80% ■■■■■■■■ file1.cpp func3 70% ■■■■■■■... -
Page 161: Clearing Code Coverage Information
R0E424270MCU00 User’s Manual 5. Debugging Functions 5.11.9 Clearing Code Coverage Information (1) Clearing the code coverage information for a specified range Selecting Clear Coverage Range from the popup menu opens the Clear Address Range dialog box. Figure 5.80 Clear Address Range dialog box Enter the addresses where the range to be cleared starts and ends. -
Page 162: Saving The Code Coverage Information In A File
R0E424270MCU00 User’s Manual 5. Debugging Functions 5.11.12 Saving the Code Coverage Information in a File You can save the code coverage information for the currently selected sheet in a file. Selecting Save Data from the popup menu opens the Save Coverage Data dialog box. -
Page 163: Modes Of Loading For Coverage Information Files
R0E424270MCU00 User’s Manual 5. Debugging Functions Clicking on the Add button opens the Add Coverage Files dialog box shown below. Figure 5.83 Add Coverage Files dialog box Use this dialog box to specify the coverage information file you want to load. You can also specify a mode of loading and offset for each file you load. - Page 164 R0E424270MCU00 User’s Manual 5. Debugging Functions (2) When “Merge” has been selected Figure 5.85 Schematic of the merge mode (3) Example of application of the merge mode Figure 5.86 Schematic view of a merge-mode application [Procedure] (1) Open the Load Coverage Data dialog box.
-
Page 165: Displaying Code Coverage Information In The Editor Window
R0E424270MCU00 User’s Manual 5. Debugging Functions 5.11.15 Displaying Code Coverage Information in the Editor Window When the Editor window is open in the source mode, the results of coverage are displayed in the Code Coverage column. Rows of the Code Coverage column that correspond to source lines where the instructions have been executed are highlighted. -
Page 166: Measuring Data Coverage
R0E424270MCU00 User’s Manual 5. Debugging Functions 5.12 Measuring Data Coverage 5.12.1 Measuring Data Coverage The code coverage, data coverage and realtime profiling functions of the E100 emulator are mutually exclusive. To use the data coverage function, choose Data coverage in the Switching function section on the System page of the Configuration properties dialog box. -
Page 167: Allocating Data Coverage Memory (Hardware Resource)
R0E424270MCU00 User’s Manual 5. Debugging Functions (1) Measurement method The Data Coverage window has three sheets. Table 5.34 Sheets of the Data Coverage window Sheet Description Address Range Measurement is performed on any address range. Section Measurement is performed on a specified section. - Page 168 R0E424270MCU00 User’s Manual 5. Debugging Functions Figure 5.90 Schematic view of data coverage memory allocation (2) Changing memory allocation When the allocation of coverage memory is changed, the coverage data acquired from the target address ranges prior to the change is retrieved from coverage memory into a dedicated coverage buffer.
-
Page 169: Data Coverage In An Address Range
R0E424270MCU00 User’s Manual 5. Debugging Functions 5.12.4 Data Coverage in an Address Range The E100 emulator is capable of collecting the access information for a user-specified address range and of displaying the information. Figure 5.92 Data Coverage window (address specification) The Data Coverage window is vertically divided in two by the splitter. -
Page 170: Data Coverage In Sections
R0E424270MCU00 User’s Manual 5. Debugging Functions 5.12.5 Data Coverage in Sections The E100 emulator is capable of collecting the access information for a user-specified section and of displaying the information. Figure 5.93 Data Coverage window (section name specification) The Data Coverage window is vertically divided in two by the splitter. -
Page 171: Data Coverage In The Task Stack
R0E424270MCU00 User’s Manual 5. Debugging Functions 5.12.6 Data Coverage in the Task Stack The E100 emulator is capable of collecting the access information for the task stacks and of displaying the information. The task stack is automatically registered when a load module that includes an OS has been downloaded. -
Page 172: Clearing Data Coverage Information
R0E424270MCU00 User’s Manual 5. Debugging Functions Lines for addresses beyond the area to which coverage memory has been allocated are grayed-out. Although any existing coverage information for such addresses is retained, the coverage information will not be updated by program execution. -
Page 173: Saving The Data Coverage Information In A File
R0E424270MCU00 User’s Manual 5. Debugging Functions 5.12.10 Saving the Data Coverage Information in a File You can save the data coverage information for the currently selected sheet in a file. Selecting Save Data from the popup menu opens the Save Data dialog box. - Page 174 R0E424270MCU00 User’s Manual 5. Debugging Functions Clicking on the Add button opens the Add coverage data file dialog box shown below. Figure 5.98 Add coverage data file dialog box Use this dialog box to specify the coverage information file you want to load. You can also specify a mode of loading and offset for each file you load.
-
Page 175: Viewing Realtime Profile Information
R0E424270MCU00 User’s Manual 5. Debugging Functions 5.13 Viewing Realtime Profile Information 5.13.1 Viewing Realtime Profile Information The code coverage, data coverage and realtime profiling functions of the E100 emulator are mutually exclusive. To use the realtime profiling function, choose Real-time profile in the Switching function section on the System page of the Configuration properties dialog box. - Page 176 R0E424270MCU00 User’s Manual 5. Debugging Functions (e) Relationship between the address where Go was executed and the address of a break within a measurement range, and the measurable range Figure 5.99 Measurable range The measurable range will be as follows.
-
Page 177: Selecting A Realtime Profile Measurement Mode
R0E424270MCU00 User’s Manual 5. Debugging Functions (2) Task profile Performance of individual tasks can be measured. For a task, the Realtime Profile window shows its ID, the number of passes, cumulative execution time, the ratio of this to the overall execution time, and the average execution time. -
Page 178: Measuring Function Profiles
R0E424270MCU00 User’s Manual 5. Debugging Functions 5.13.3 Measuring Function Profiles The Function Profile mode allows measurement of performance per function. Figure 5.100 Realtime Profile window (function profile) The information in each of the columns is described in the table below. -
Page 179: Setting Ranges For Function Profile Measurement
R0E424270MCU00 User’s Manual 5. Debugging Functions 5.13.4 Setting Ranges for Function Profile Measurement Choose Set Range from the popup menu that is displayed when you right-click in the window. The Realtime Profile Setting dialog box will be displayed. Set a profile measurement range in this dialog box. -
Page 180: Saving Function Profile Measurement Settings
R0E424270MCU00 User’s Manual 5. Debugging Functions 5.13.5 Saving Function Profile Measurement Settings You can save the current profile mode and measurement ranges (memory allocation) for function profiles. Click on the Save button of the Realtime Profile Setting dialog box, and the Save As dialog box will be displayed. -
Page 181: Measuring Task Profiles
R0E424270MCU00 User’s Manual 5. Debugging Functions 5.13.7 Measuring Task Profiles The Task Profile mode allows measurement of performance per task. Figure 5.103 Realtime Profile window (task profile) The information in each of the columns is described in the table below. -
Page 182: Setting Ranges For Task Profile Measurement
R0E424270MCU00 User’s Manual 5. Debugging Functions 5.13.8 Setting Ranges for Task Profile Measurement Choose Set Range from the popup menu that is displayed when you right-click in the window. The Realtime Profile Setting dialog box will be displayed. Set a profile measurement range in this dialog box. -
Page 183: Saving Task Profile Measurement Settings
R0E424270MCU00 User’s Manual 5. Debugging Functions 5.13.9 Saving Task Profile Measurement Settings You can save the current settings regarding tasks for measurement (task IDs and enabled/disabled states) in task mode. Click on the Save button of the Realtime Profile Setting dialog box, and the Save As dialog box will be displayed. -
Page 184: Clearing Results Of Realtime Profile Measurement
R0E424270MCU00 User’s Manual 5. Debugging Functions 5.13.11 Clearing Results of Realtime Profile Measurement Choose Clear from the popup menu of the Realtime Profile window, and all results of measurement are cleared. Unless this is done, measurement results are accumulated in memory. -
Page 185: Maximum Measurement Time For Realtime Profiles
R0E424270MCU00 User’s Manual 5. Debugging Functions 5.13.14 Maximum Measurement Time for Realtime Profiles (1) Maximum measurement time The timer used for realtime profile measurement is configured with a 40-bit counter. The maximum measurement time varies with the selected unit of measurement. -
Page 186: Detecting Exceptional Events
R0E424270MCU00 User’s Manual 5. Debugging Functions 5.14 Detecting Exceptional Events 5.14.1 Detecting Exceptional Events The E100 emulator permits you to detect the occurrence of various exceptional events during user program execution. Exceptional events include abnormal behavior of the user program, as well as an overflow of the measurement counter for break, trace, or performance analysis. - Page 187 R0E424270MCU00 User’s Manual 5. Debugging Functions (3) Methods of setting protection There are the following two methods: - Automatic setting by section information in a downloaded module - Individually specifying an access attribute for an area (4) Method of detection Violation of access protection is detected by internal resources (blocks 1–16) of the emulator.
-
Page 188: Setting Protection For An Area
R0E424270MCU00 User’s Manual 5. Debugging Functions 5.14.3 Setting Protection for an Area Follow the procedure below to set protection for an area. (1) From the Hardware Break dialog box 1. Select the Exception checkbox on the Hardware Break sheet and then click on the Detail button. - Page 189 R0E424270MCU00 User’s Manual 5. Debugging Functions 3. The Violation of access protection dialog box shown below will be displayed. To have the access attributes automatically set according to the section information in the downloaded module when a program is downloaded, select the checkbox labeled “Automatically set address areas at downloading.”...
- Page 190 R0E424270MCU00 User’s Manual 5. Debugging Functions 6. The protected area you have added will be displayed in the Address Areas list of the Violation of access protection dialog box. Figure 5.112 Violation of access protection dialog box R20UT3586EJ0202 Rev.2.02 Page 190 of 233...
- Page 191 R0E424270MCU00 User’s Manual 5. Debugging Functions (2) From the Trace conditions dialog box 1. In the Trace Mode drop-down list of the Trace sheet, select Fill around TP. Select the Exception checkbox and then click on the Detail button. Figure 5.113 Trace conditions dialog box 2.
-
Page 192: Detecting Reading From A Non-Initialized Area
R0E424270MCU00 User’s Manual 5. Debugging Functions Figure 5.114 Trace conditions dialog box 3. The Violation of access protection dialog box will be displayed. The rest of the procedure is the same as if you opened the Violation of access protection dialog box from the Hardware Break dialog box. - Page 193 R0E424270MCU00 User’s Manual 5. Debugging Functions (2) Action taken when reading from a non-initialized area is detected The following actions are selectable. - Display a warning. When the Read from uninitialized memory checkbox has been selected on the Exception Warning page of the Configuration properties dialog box, you will see a warning in the Status window and in a status bar balloon when errors of this type occur.
-
Page 194: Detecting Stack Access Violations
R0E424270MCU00 User’s Manual 5. Debugging Functions 5.14.5 Detecting Stack Access Violations Setting the size of the stack too small in software development raises the possibility of a program going out of control or malfunctioning. The E100 emulator actively detects abnormal access by the stack pointer. -
Page 195: Detecting A Performance-Measurement Overflow
R0E424270MCU00 User’s Manual 5. Debugging Functions 5.14.6 Detecting a Performance-Measurement Overflow A time in performance measurement coming to exceed the maximum value can be detected as an error. Timeout case in a performance measurement is referred to as a performance overflow. -
Page 196: Detecting A Trace Memory Overflow
R0E424270MCU00 User’s Manual 5. Debugging Functions 5.14.8 Detecting a Trace Memory Overflow Overflows of the trace memory (4 M cycles) can be detected as errors. (1) Action taken when a trace memory overflow is detected The following actions are selectable. -
Page 197: Setting A Task Stack Area
R0E424270MCU00 User’s Manual 5. Debugging Functions 5.14.10 Setting a Task Stack Area Follow the procedure below to set a task stack area. (1) From the Hardware Break dialog box 1. Select the Exception checkbox on the Hardware Break sheet and then click on the Detail button. - Page 198 R0E424270MCU00 User’s Manual 5. Debugging Functions 3. The Violation of task stack access dialog box shown below will be displayed. To have the task stack areas automatically set when a program is downloaded, select the “Automatically set address areas at downloading” checkbox.
- Page 199 R0E424270MCU00 User’s Manual 5. Debugging Functions (2) From the Trace conditions dialog box 1. In the Trace Mode drop-down list of the Trace sheet, select Fill around TP. Select the Exception checkbox and then click on the Detail button. Figure 5.121 Trace conditions dialog box R20UT3586EJ0202 Rev.2.02...
-
Page 200: Detecting An Os Dispatch
R0E424270MCU00 User’s Manual 5. Debugging Functions 2. The Exception page shown below will appear. Click on the Detail button to the right of the Task stack access violation checkbox. Figure 5.122 Trace conditions dialog box 3. The Violation of task stack access dialog box will be displayed. The rest of the procedure is the same as if you opened the Violation of task stack access dialog box from the Hardware Break dialog box. -
Page 201: Using The Start/Stop Function
R0E424270MCU00 User’s Manual 5. Debugging Functions 5.15 Using the Start/Stop Function The emulator can be made to execute specific routines of the user program immediately before starting and immediately after halting program execution. This function is useful if you wish to control a user system in synchronization with starting and stopping of user program execution. -
Page 202: Limitations Of The Start/Stop Function
R0E424270MCU00 User’s Manual 5. Debugging Functions 5.15.4 Limitations of the Start/Stop Function The start/stop function is subject to the following limitations. - The debugging functions listed below are not to be used while the start/stop function is in use. (a) Memory setting and downloading into the program area of a routine specified as a start/stop function. -
Page 203: Using The Trigger Output Function
R0E424270MCU00 User’s Manual 5. Debugging Functions 5.16 Using the Trigger Output Function The trigger output function is for the output of signals through an external trigger cable (this is a separately sold product). Connect the external trigger cable according to the instructions given in the user’s manual for the cable. -
Page 204: Opening The Trigger Output Conditions Dialog Box
R0E424270MCU00 User’s Manual 5. Debugging Functions 5.16.2 Opening the Trigger Output Conditions Dialog Box Choose [Event -> Trigger Output Conditions] from the View menu, or click on the ‘Trigger Output Conditions’ toolbar button Figure 5.125 Trigger Output Conditions dialog box Note that you cannot open the Trigger Output Conditions dialog box in either of the following cases. -
Page 205: Manual Setting For Output Through Trigger Pins 31 To 24
R0E424270MCU00 User’s Manual 5. Debugging Functions 5.16.3 Manual Setting for Output through Trigger Pins 31 to 24 Make the manual settings for output through trigger pins 31 to 24 on the Manual output page. Figure 5.126 Trigger Output Conditions dialog box (Manual output page) (1) Display of output states: ‘Output contents’... - Page 206 R0E424270MCU00 User’s Manual 5. Debugging Functions (2) ‘Output setting’ ‘Output setting’ indicates the levels of signals to be output through trigger pins 31 to 24. Clicking on one of these buttons changes the state of the corresponding pin in the following order.
-
Page 207: Setting For Output Through Trigger Pins 20 To 16
R0E424270MCU00 User’s Manual 5. Debugging Functions 5.16.4 Setting for Output through Trigger Pins 20 to 16 The Event output page allows manual setting for output through trigger pins 20 to 16. Figure 5.127 Trigger Output Conditions dialog box (Event output page) (1) Default setting ‘Default setting’... -
Page 208: Events
CAUTION The actual trigger output follows event detection after some delay. The number of cycles of delay varies with the product. The delay for trigger output in the R0E424270MCU00 is 9 cycles. 5.16.5 Events For details on the setting of events, refer to, “5.7 Using Events” (page 108). -
Page 209: Acquiring Trace Data
R0E424270MCU00 User’s Manual 5. Debugging Functions (2) Specifying the start and end events Specify the start and end events that define the points where the desired section starts and ends, along with the following conditions. Do not select any other event type or address condition. -
Page 210: Saving The Execution Times To A File
R0E424270MCU00 User’s Manual 5. Debugging Functions 5.17.4 Saving the Execution Times to a File After the trace data has been acquired, you can use the TRACE_EXECUTE_SAVE command to save the execution times in the specified section to a file with extension .csv. -
Page 211: Troubleshooting (Action In Case Of An Error)
Figure 6.1 shows the flowchart for remediation of trouble arising between activation of the power supply to the emulator system and the emulator debugger starting up. Go through the checks with the user system disconnected. For the latest FAQs, visit the Renesas Tools Homepage. https://www.renesas.com/tools... -
Page 212: Error In Self-Checking
R0E424270MCU00 User’s Manual 6. Troubleshooting (Action in Case of an Error) 6.2 Error in Self-checking When an error occurs in self-checking, check the following items. (1) Re-check the connection between the E100 emulator main unit and the MCU unit. (2) Download the proper firmware again. -
Page 213: Errors Reported In Booting-Up Of The Emulator
R0E424270MCU00 User’s Manual 6. Troubleshooting (Action in Case of an Error) 6.3 Errors Reported in Booting-up of the Emulator (1) States of the LEDs on the E100 are incorrect Table 6.1 Points to check for errors indicated by incorrect states of the LEDs on the E100... - Page 214 R0E424270MCU00 User’s Manual 6. Troubleshooting (Action in Case of an Error) (2) Configuration Properties Dialog Box Does Not Appear in Booting-up of the Emulator Debugger Table 6.2 Points to check for errors in booting-up of the emulator debugger (1) Error...
-
Page 215: How To Request Support
R0E424270MCU00 User’s Manual 6. Troubleshooting (Action in Case of an Error) 6.4 How to Request Support After checking the items under "6. Troubleshooting (Action in Case of an Error)" (page 211), fill in the text file which is available for downloading at the following URL, then send the information to your local distributor. -
Page 216: Hardware Specifications
This chapter describes specifications of the MCU unit. 7.1 Target MCU Specifications Table 7.1 lists the specifications of target MCUs which can be debugged with the MCU unit. Table 7.1 Specifications of target MCUs for the R0E424270MCU00 Item Description Applicable MCU series... -
Page 217: Differences Between The Actual Mcu And The Emulator
7. Hardware Specifications R0E424270MCU00 User’s Manual 7.2 Differences between the Actual MCU and the Emulator Differences between the actual MCU and the emulator are described below. When using the MCU unit in debugging an application for the corresponding MCU, take care with regard to the following points. - Page 218 7. Hardware Specifications R0E424270MCU00 User’s Manual IMPORTANT Notes on Maskable Interrupts: ⚫ Even if a user program is not being executed (including when run-time debugging is being performed), the evaluation MCU is executing a debug control program. Therefore, the timers and other components do not stop running.
-
Page 219: Connection Diagram
7.3.1 Connection Diagram for the R0E424270MCU00 Figure 7.1 shows a partial circuit diagram of the connections of the R0E424270MCU00. This diagram mainly shows the circuitry to be connected to the user system. Other circuitry, such as that for the emulator’s control system, has been omitted. -
Page 220: External Dimensions
7. Hardware Specifications R0E424270MCU00 User’s Manual 7.4 External Dimensions 7.4.1 External Dimensions of the E100 Emulator Figure 7.2 shows the external dimensions of the E100 emulator. D: 184 mm H: 132 mm W: 73 mm Figure 7.2 External dimensions of the E100 emulator R20UT3586EJ0202 Rev.2.02... -
Page 221: External Dimensions Of The Converter Board (R0E424270Cfle0)
7. Hardware Specifications R0E424270MCU00 User’s Manual 7.4.2 External Dimensions of the Converter Board (R0E424270CFLE0) Figure 7.3 shows external dimensions and a sample pad pattern of the converter board (R0E424270CFLE0) for an 80-pin 0.65- mm pitch LQFP. 35.00 7.50 R0E424270CFLE0 REV.A MADE IN JAPAN 7.50... -
Page 222: External Dimensions Of The Converter Board (R0E424270Cfke0)
7. Hardware Specifications R0E424270MCU00 User’s Manual 7.4.3 External Dimensions of the Converter Board (R0E424270CFKE0) Figure 7.4 shows external dimensions and a sample pad pattern of the converter board (R0E424270CFKE0) for an 80-pin 0.5- mm pitch LQFP. 35.00 6.00 R0E424270CFKE0 REV.A 0.25... -
Page 223: External Dimensions Of The Converter Board (R0E0144Tnpfk00)
7. Hardware Specifications R0E424270MCU00 User’s Manual 7.4.4 External Dimensions of the Converter Board (R0E0144TNPFK00) Figure 7.5 shows external dimensions and a sample pad pattern of the converter board (R0E0144TNPFK00) for a 64-pin 0.5- mm pitch LQFP. 42.00 4.50 R0E0144TNPFK00 REV.A 0.25... -
Page 224: Notes On Using The Mcu Unit
7. Hardware Specifications R0E424270MCU00 User’s Manual 7.5 Notes on Using the MCU Unit Notes on using the MCU unit are listed below. When using the MCU unit in debugging an application for the corresponding MCU, take care with regard to the following precautions. - Page 225 7. Hardware Specifications R0E424270MCU00 User’s Manual IMPORTANT Note on the Watchdog Function: ⚫ If the reset circuit of the user system has a watchdog timer, disable the watchdog timer when using the emulator. Note on Access Prohibited Area: ⚫ You cannot use internally reserved areas. Write signals to these areas will be ignored, and values read will be undefined.
- Page 226 7. Hardware Specifications R0E424270MCU00 User’s Manual IMPORTANT Note on Transitions to Low-Power Consumption Modes: ⚫ Generation of an interrupt while the emulator is in a low-power consumption mode causes the emulator to leave the low-power consumption mode. However, the emulator generates an emulation-only interrupt as part of processing in each of the following cases.
- Page 227 7. Hardware Specifications R0E424270MCU00 User’s Manual IMPORTANT Data Bus in Trace Information: ⚫ Since the bus width within the emulator is 32 bits, if you have accessed an external space with a bus width of 8 bits, the trace information for the data bus may differ from the actual external bus operations of the MCU.
- Page 228 7. Hardware Specifications R0E424270MCU00 User’s Manual IMPORTANT Trace Data after Transition from Self-Refresh to Software Standby Mode: ⚫ When the MCU has made a transition from self-refresh to software standby mode and all of the conditions listed below are satisfied, the displayed realtime trace data will include some information that does not reflect actual operations if the user program is stopped (i.e.
-
Page 229: Maintenance And Warranty
R0E424270MCU00 User’s Manual 8. Maintenance and Warranty 8. Maintenance and Warranty This chapter covers basic maintenance, warranty information, provisions for repair and the procedures for requesting a repair. 8.1 User Registration When you purchase our product, be sure to register as a user. For user registration, refer to “User Registration” (page 16) of this user's manual. -
Page 230: How To Request Repairs
R0E424270MCU00 User’s Manual 8. Maintenance and Warranty (3) Expiration of the repair period When a period of one year has elapsed after production of a given model ceased, repairing products of that model may ecome impossible. (4) Carriage fees for sending your product to be repaired Carriage fees for sending your product to us for repair are at your own expense. - Page 231 Revision History Rev. Date Description Page Summary 2.01 Dec.01.15 Regulatory Compliance Notices changed ⎯ 2.02 Sep.01.21 The statement of inclusion of an AC adapter was removed. Regulatory Compliance Notices was changed. The specifications of the AC adapter were added. C – 1...
- Page 232 E100 Emulator Main Unit for H8S/2400 Series User’s Manual R0E424270MCU00 Publication Date: Sep.01.21 Rev.2.02 Published by: Renesas Electronics Corporation...
- Page 233 © 2010-2014 Renesas Electronics Corporation. All rights reserved. Colophon 3.0 R0E424270MCU00 User’s Manual R20UT3586EJ0202...
- Page 234 Mouser Electronics Authorized Distributor Click to View Pricing, Inventory, Delivery & Lifecycle Information: Renesas Electronics R0E424270MCU00...
Need help?
Do you have a question about the R0E424270MCU00 and is the answer not in the manual?
Questions and answers