Anritsu spectrum master ms2711d User Manual
Spectrum analysis
Hide thumbs
Also See for spectrum master ms2711d:
- Programming manual (139 pages) ,
- Programming manual (116 pages) ,
- Maintenance manual (48 pages)
Table of Contents
Advertisement
Quick Links
See also:
Programming Manual
Advertisement
Table of Contents

Related Manuals for Anritsu spectrum master ms2711d


Summary of Contents for Anritsu spectrum master ms2711d
- Page 1 Spectrum Master ™ MS2711D Fast. Accurate, Repeatable, Portable Spectrum Analysis S331D SiteMaster MS2711D MT8212A Site Master MS2712 Spectrum Master SpectrumMaster MS2712 Cell Master CellMaster MS2712 User’s Guide SiteMaster SpectrumMaster CellMaster...
- Page 2 Anritsu Company. UPDATES Updates to this manual, if any, may be downloaded from the Anritsu internet site at: http://www.us.anritsu.com. Equipment marked with the Crossed-out Wheelie...
-
Page 4: Table Of Contents
ESD Cautions ....... . . 1-11 Anritsu Service Centers......1-12 Chapter 2 - Quick Start Guide Introduction . - Page 5 Channel Scanner Mode (Option 27) ..... 3-46 CW Signal Generator Mode (Option 28) ....3-50 All Modes.
- Page 6 Chapter 8 - GPS Feature Introduction ........8-1 Activating the GPS Feature .
-
Page 7: Chapter 1 - General Information
100 kHz to 3 GHz Description The Anritsu Spectrum Master is a synthesizer-based hand held spectrum analyzer that pro- vides quick and accurate signal results. Measurements can be easily made by using the main instrument functions: frequency, span, amplitude and bandwidth. Dedicated keys for common functions and a familiar calculator-type keypad are available for fast data entry. -
Page 8: Options
· 633-27 Rechargeable NiMH Battery · 800-441 Serial Interface Cable (null modem type) · 2300-347 Anritsu Handheld Software Tools CDROM · One Year Warranty (includes battery, firmware, and software) · Options Option 5 Power Monitor - Requires external detector ·... -
Page 9: Optional Accessories
Armored Test Port Extension Cable, 5.0 meter, N (m) to N (m) 6 GHz 15NDF50-1.5C Armored Test Port Extension Cable, 1.5 meter, N (m) to 7/16 DIN (f) 6 GHz 760-235 Transit Case for Anritsu Handheld Spectrum Analyzer 2300-347 Anritsu Handheld Software Tools 551-1691... - Page 10 Chapter 1 General Information Table 1-1. Optional Accessories (continued) Part Number Description 2000-1412 Portable Yagi Antenna, N(f), 885-975 MHz, 10 dBd 2000-1413 Portable Yagi Antenna, N(f), 1.71-1.88 GHz, 10 dBd 2000-1414 Portable Yagi Antenna, N(f), 1.85-1.99 GHz, 9.3 dBd 2000-1415 Portable Yagi Antenna, N(f), 2.4-2.5 GHz, 12 dBd 2000-1416 Portable Yagi Antenna, N(f), 1.92-2.23 GHz, 12 dBd...
- Page 11 Chapter 1 General Information Power Monitor (Option 5) RF Detectors The Anritsu 5400 and 560 Series Detectors use zero-biased Schottky diodes. Measurement range is –55 dBm to +16 dBm using single cycle per sweep AC detection, auto-zeroing with DC detection during the frequency sweep. Extender cables of over 3000 feet can be used with the MS2711D Specgtum Master with Option 5 installed.
-
Page 12: Performance Specifications
Chapter 1 General Information Performance Specifications Performance specifications are provided in Table 1-2. Unless otherwise noted, specified values are obtained after a five minute warmup period at a constant ambient temperature. The typical values are provided for reference, and are not guaranteed. Table 1-2. - Page 13 Chapter 1 General Information Table 1-2. Performance Specifications (2 of 4) Description Value Power Monitor (Option 5, w/external detector) Detector Range: 1A peak 150 ms, 300 mA max steady state Offset Range: –50 to +20 dBm, 10 nW to 100 nW Display Range: –80 to 80 dBm Resolution:...
- Page 14 Chapter 1 General Information Table 1-2. Performance Specifications (3 of 4) Description Value Transmission Measurement (Option 21) Frequency 25 MHz to 3.0 GHz Freq. Resolution 10 Hz Output Power Level: –10 dBm typical (up to –90 dBm with external attenuator) Dynamic Range: 80 dB, 25 MHz to 2 GHz 60 dB, >2 GHz to 3 GHz...
- Page 15 Chapter 1 General Information Table 1-2. Performance Specifications (4 of 4) Description Value Marker Modes Standard Delta Marker To Peak Marker Frequency To Center Marker To Valley (M5 & M6 only) Noise Markers Memory Trace Storage 200 traces Setup Storage 10 setups Displayed Traces 2 traces...
-
Page 16: Preventive Maintenance
Anritsu Spectrum Master preventive maintenance consists of cleaning the unit and inspect- ing and cleaning the RF connector on the instrument and all accessories. Clean the Anritsu Spectrum Master with a soft, lint-free cloth dampened with water or wa- ter and a mild cleaning solution. -
Page 17: Calibration
Although the Anritsu Spectrum Master does not require daily field calibration, Anritsu rec- ommends an annual calibration and performance verification by local Anritsu service cen- ters. Anritsu service centers are listed in Table 1-3 beginning on the following page. ESD Cautions The MS2711D, like other high performance instruments, is susceptible to ESD damage. -
Page 18: Anritsu Service Centers
Chapter 1 General Information Anritsu Service Centers Table 1-3 provides a listing of the Anritsu Service Centers. Table 1-3. Anritsu Service Centers UNITED STATES GERMANY SOUTH AFRICA ANRITSU COMPANY ANRITSU GmbH ETESCSA 685 Jarvis Drive Konrad-Zuse-Platz 1 12 Surrey Square Office Park... -
Page 19: Chapter 2 - Quick Start Guide
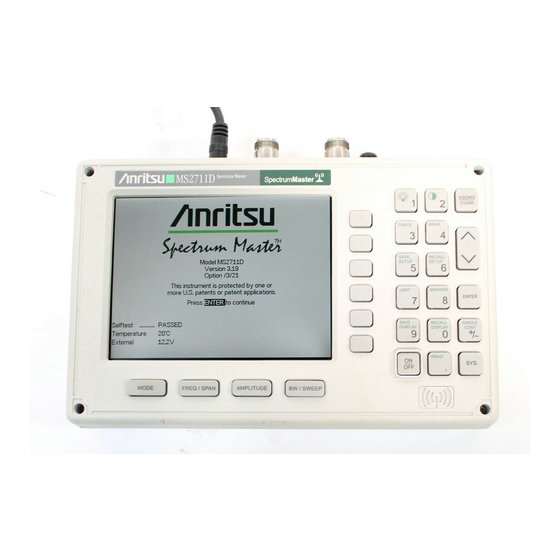
The Spectrum Master takes about five seconds to perform a series of self-diagnostic rou- tines. At completion, the screen displays the Anritsu logo, the model number, and the ver- sion of firmware. It also prompts you to press ENTER to continue. -
Page 20: Front Panel Overview
Chapter 2 Quick Start Guide The Anritsu Spectrum Master is now ready for operation. No additional keystrokes or in- stallation are required. For information on making measurements with the Anritsu Spectrum Master, refer to “Making a Basic Measurement,” on page 2-22. For advanced applications, refer to Chapter 4, Measurement Fundamentals, Chapter 5, Field Measurements, Chapter 6, Power Measurement and Chapter 7, Transmission Measurement. -
Page 21: Display Overview
Chapter 2 Quick Start Guide Display Overview Figure 2-3 illustrates some of the key information areas of the MS2711D display. TITLE BAR SWEEP MODE DETECTION CURRENT METHOD MENU PREAMPLIFIER STATE MESSAGE AREA Figure 2-3. Display Overview Figures 2-4 through 2-12 illustrate the menu structures and soft key labels for each menu selection. - Page 22 Chapter 2 Quick Start Guide MODE=SPECTRUM ANALYZER FREQ/SPAN AMPLITUDE SOFTKEYS: Center Level Span Scale Atten/ Start Preamp Edit Stop Auto Full Signal Units Standard Manual Zero Level Span Select Offset Dynamic Volts Standard 1-2-5 Span Select Watts Down Channel 1-2-5 Preamp Uplink dBmV...
- Page 23 Chapter 2 Quick Start Guide MODE = SPECTRUM ANALYZER BW/SWEEP SOFTKEYS: Band- width Trigger Auto Hold Free Manual Detection Single Auto Sweep Time Positive External Peak Manual More Video Average Change Negative Average Back Trigger (2-25) Peak Position Sampling Back Mode Hold Back...
- Page 24 Chapter 2 Quick Start Guide MODE = TRANSMISSION MEASUREMENT FREQ/SPAN AMPLITUDE BW/SWEEP SOFTKEYS: Band- Center Level width Calibrate Span Scale Auto Atten/ Start Preamp Hold Edit Manual Average Stop (2-25) Auto Full Auto Signal Standard Hold Manual Manual Span Select Dynamic Standard 1-2-5...
- Page 25 Chapter 2 Quick Start Guide MODE=POWER METER FREQ/SPAN AMPLITUDE BW/SWEEP SOFTKEYS: Center Units Averaging Span Offset Edit Zero Medium Full Signal Standard High Span Select Standard 1-2-5 Span Select Back Down Channel 1-2-5 Uplink Back Downlink Back Figure 2-7. Menu Structure, Power Meter Mode (Option 29)
- Page 26 Self External Test Printer Freq Hour Status Units Minute Change Impedance Date Format Language Month English On/Off Back Location Anritsu Year 12N50-75B Back Quality Other Adapter Back Offset Reset Back Back Figure 2-8. Menu Structure, SYS Key, Spectrum Analyzer Mode...
- Page 27 Options Clock Self External Test Printer Freq Hour Status Units Minute Change Impedance Date Format Language Month English Back Anritsu Year 12N50-75B Back Other Adapter Back Offset Back Figure 2-9. Menu Structure, SYS Key, Transmission Measurement and Power Meter Modes...
- Page 28 Chapter 2 Quick Start Guide MODE = SPECTRUM ANALYZER TRACE KEY: TRACE Normalize A -> B A - B -> A + B -> Trace Trace Reset View Normal- On/Off Clear Recall Trace -> B Back Back Figure 2-10. Menu Structure, TRACE Key, Spectrum Analyzer Mode 2-10...
- Page 29 Chapter 2 Quick Start Guide MODE = TRANSMISSION MEASUREMENT TRACE KEY: TRACE Recall Trace -> B View B/ Clear B A -> B A - B -> A + B -> Figure 2-11. Menu Structure, TRACE Key, Transmission Measurement Mode (Option 21) 2-11...
- Page 30 Chapter 2 Quick Start Guide MODE = SPECTRUM ANALYZER Center Freq Main Channel Freq MEAS KEY: Adjacent MEAS Channel Measure Channel Freq To Spacing Field Center Strength Measure Freq As Marker M1 On/Off Back Channel Power Select Standard Method Back Antenna ACPR Select...
- Page 31 Chapter 2 Quick Start Guide MODE = SPECTRUM ANALYZER/TRANSMISSION MEASUREMENT MARKER KEY: MARKER On/Off On/Off Edit Edit On/Off Marker Delta On/Off Edit (M2-M1) Peak More Marker Marker Delta Edit Freq To (M3-M1) Peak Center Marker Marker Delta Freq To Back (M4-M1) Center Peak...
- Page 32 Chapter 2 Quick Start Guide MODE = SPECTRUM ANALYZER OR TRANSMISSION MEASUREMENT LIMIT KEY: LIMIT Single Limit Multiple Upper Limits On/Off Multiple Lower Limits Segment Edit Limit Beep Upper / Segment Segment Lower Limit Segment Segment Segment Segment Segment Segment Back Segment Back...
-
Page 33: Test Panel Connectors
RS232 DB9 interface to a COM port on a personal computer (for use with the Interface Anritsu Handheld Software Tools program). Also provides a serial interface to a printer. An optional serial to USB adapter, Anritsu part number 551-1691, is available for use in connecting printers and working with Handheld Software Tools. -
Page 34: Making Spectrum Analyzer Measurements
Chapter 2 Quick Start Guide Making Spectrum Analyzer Measurements Required Equipment MS2711D Handheld Spectrum Analyzer Selecting Spectrum Analyzer Mode Step 1. Press the ON/OFF key. Step 2. Press the MODE key and use the Up/Down arrow key to select Spectrum Ana- lyzer mode. - Page 35 Chapter 2 Quick Start Guide Selecting a Signal Standard Step 1. Press the FREQ/SPAN key to display the Frequency menu. Step 2. Press the Signal Standard soft key. Step 3. Use the Up/Down arrow key to highlight the desired signal standard. Use the Top of List, Page Up, Page Down and Bottom of List soft keys to quickly navigate through the list.
- Page 36 Chapter 2 Quick Start Guide Selecting Sweep Parameters Press the BW/SWEEP key to set the sweep parameters. Max Hold Maximum hold displays the maximum response of the input signal over multiple sweeps. To toggle maximum hold on or off, press the Max Hold soft key. Min Hold Minimum Hold displays the minimum response of the input signal over multiple sweeps.
- Page 37 Chapter 2 Quick Start Guide To set the number of sweeps to average, press the More soft key, then the Average (2-25) soft key and use the Up/Down arrow key or directly enter the desired number of sweeps from the keypad. Press ENTER to set the sweep average. NOTE: Max Hold, Min Hold, and Average are mutually exclusive.
- Page 38 Chapter 2 Quick Start Guide A limit segment is defined by its end points. That is, starting frequency, starting amplitude, ending frequency, and ending amplitude. This procedure describes the setting of two upper limit segments. The steps can be carried over to the other upper limit segments as well as to the lower limit segments.
- Page 39 Step 1. Press the SYS key. Step 2. Press the Impedance soft key. Step 3. If using the Anritsu 12N50-75B adapter, press the 75W Anritsu 12N50-75B soft key. Step 4. If using a different adapter, press the Other Adapter Offset soft key. Enter the loss value using the numeric keypad or the Up/Down arrow key.
-
Page 40: Making A Basic Measurement
Step 1. Press the ON/OFF key, then the ENTER key when prompted. Step 2. Connect a signal generator to the input of the Anritsu Spectrum Master and con- figure it to provide a -10 dBm, 900 MHz signal. - Page 41 Chapter 2 Quick Start Guide Set the Center Frequency Step 1. Press the FREQ/SPAN key. Step 2. Press the Center frequency soft key. NOTE: To set the center frequency to 900 MHz, use the numerical keypad to the right of the display. The data keys allow you to select the exact numeric value of the active function, which in this example is the center frequency.
- Page 42 Chapter 2 Quick Start Guide Span Up in a 1-2-5 Sequence Press the Span Up 1-2-5 soft key to increase the span to the nearest power of 10, times ei- ther 1, 2 or 5. For example, if the current span is 300 kHz, pressing the Span Up 1-2-5 soft key will change the span to 500 kHz.
- Page 43 Chapter 2 Quick Start Guide Set the Amplitude Generally, placing the signal peak at the reference level provides the best measurement ac- curacy. The following steps will adjust the signal peak to the reference level (Figure 2-17). Step 1. Press the AMPLITUDE key. Step 2.
- Page 44 Chapter 2 Quick Start Guide Activate the Marker The marker reads both the frequency and the amplitude, and it displays these values in the message area at the bottom of the display. In this case, the marker will read 900 MHz and approximately –10.00 dBm, as shown in Figure 2-18.
-
Page 45: Save And Recall Display
Chapter 2 Quick Start Guide Save and Recall Display The MS2711D can store up to 200 trace displays in internal memory. Stored traces can be recalled to the display or uploaded to a PC using the Handheld Software Tools program (see Chapter 12, Handheld Software Tools). - Page 46 Chapter 2 Quick Start Guide Printer Setup Step 1. Connect the printer as shown in Figure 2-19. SERIAL-TO-PARALLEL INTERFACE CABLE 2000-753 MS2711D Spectrum Master ESCAPE CLEAR TRACE MEAS SAVE RECALL SETUP SETUP DESKJET LIMIT MARKER ENTER PRINTER SAVE RECALL SINGLE DISPLAY CONT DISPLAY...
-
Page 47: Battery Information
The battery can be charged while installed in the instrument. Step 1. Turn the instrument off. Step 2. Connect the AC-DC adapter (Anritsu part number: 40-168) to the instrument DC power input port. Step 3. Connect the AC-DC adapter to a 120 VAC or 240 VAC power source as appro- priate for your application. -
Page 48: Determining Remaining Battery Life
A blinking red light indicates less than 13 VDC is being supplied to the charger stand. Check that the correct AC charger adapter is connected to the charger stand. If the battery fails to charge, contact your nearest Anritsu Service Center. Determining Remaining Battery Life When the AC-DC adapter is disengaged, a battery indicator symbol is continuously dis- played at the top-left corner of the display (Figure 2-20). - Page 49 Chapter 2 Quick Start Guide During operation, the battery condition can be viewed by pressing the SYS key and select- ing the Self Test soft key. The battery condition will be displayed as a percentage of the charge remaining. Selftest Temperature .
- Page 50 The NiMH battery supplied with the Spectrum Master has already completed three charge and discharge cycles at the factory. Recharge the battery only in the Spectrum Master, or in an Anritsu approved charger. · When the Spectrum Master or the charger is not in use, disconnect it from the power ·...
-
Page 51: Symbols
This icon is also displayed at the end of a single sweep. PLL Lock fail indication. Check battery. (If the instrument fails to lock with a fully charged battery, call your Anritsu Service Center.) Indicates the remaining charge on the battery. The inner white rectangle grows longer as the battery charge depletes. -
Page 52: Self Test
Chapter 2 Quick Start Guide Self Test At turn-on, the Anritsu Spectrum Master runs through a series of quick checks to ensure the system is functioning properly. Note that the battery voltage and temperature are displayed in the lower left corner below the self test message. If the battery is low, or if the ambient temperature is not within the specified operational range, Self Test will fail. -
Page 53: Error Messages
Battery voltage is less than 9.5 volts. Charge battery. If condition per- sists, call your Anritsu Service Center. External Power Low External supply voltage is less than 10 volts. Call your Anritsu Service Center PLL Failed Phase-locked loops failed to lock. Charge battery. If condition persists... - Page 54 Chapter 2 Quick Start Guide Operation Error Messages The following tables list possible error messages that could occur during operation of the Spectrum Master. Table 2-3. Operation Error Messages Error Message Description No Stored Sweep at Attempting to recall a display from a location that has not been previ- This Location ously written to or that contains invalid sweep data.
- Page 55 Chapter 2 Quick Start Guide Spectrum Analyzer Error Messages A listing of Spectrum Analyzer Error Messages is provided in Table 2-4 Table 2-4. Spectrum Analyzer Error Messages Error Message Description OVER LOAD This error message is displayed when there is too much input power. Decrease Input Power OVER RANGE! The ADC is over range.
- Page 56 The following error messages could be displayed on the Site Master when using the High Accuracy Power Meter mode with Power Sensor PSN50. If any error condition persists, contact your local Anritsu Service Center. Table 2-5. Option 19 Error Messages...
-
Page 57: Using The Soft Carrying Case
Using the Soft Carrying Case The soft carrying case has been designed such that the strap can be unsnapped to allow the case to be easily oriented horizontally; thus allowing the Anritsu controls to be more easily accessed (Figure 2-23). -
Page 58: Chapter 3 - Key Functions
Chapter 3 Key Functions Introduction This chapter provides a description of the Anritsu MS2711D Spectrum Master keypad con- trols. There are two kinds of keys available on the MS2711D front panel: Hard Keys and Soft Keys. Hard Keys Hard keys are those keys on the front panel that are labeled in black and green and perform specific functions as explained below. - Page 59 ENTER Implements the current action or parameter selection. Turns the Anritsu Spectrum Master on or off. When turned on, the last saved system state is restored. If the ESCAPE/CLEAR key is held down while the ON/OFF key is pressed, the factory preset state will be restored.
- Page 60 CONT The default is continuous sweep. When single sweep is selected, the HOLD symbol appears to the left of the display and the Anritsu Spectrum Master will sweep once each time the ENTER key is pressed. Single sweep mode can be used to conserve battery power. Continuous sweeping can be re-activated by pressing the SINGLE/CONT key again.
-
Page 61: Soft Keys
Chapter 3 Key Functions Soft Keys Soft keys are the six unlabeled keys (see Figure 2-2, page 2-2) that perform different func- tions depending on the currently-selected soft key menu. The available selections for the softkeys are displayed in the active function block. Selections may vary depending upon the currently selected mode. - Page 62 Chapter 3 Key Functions Select Allows selection of the signal standard to be used. Select a Standard standard using the Up/Down arrow key and press the ENTER key to implement. Select Sets the channel for the selected signal standard. Select a Channel channel using the Up/Down arrow key and press the ENTER key to implement.
- Page 63 Sets the input impedance of the instrument to 50W, which is the default setting. Displays measurements as if the input impedance was 75W. Anritsu The actual input impedance is still 50W, but the displayed in- 12N50-75B formation is transformed to the equivalent 75W value based on the offset value specified by the adapter used in the mea- surement.
- Page 64 Chapter 3 Key Functions compensate 7.5 dB for the loss of the Anritsu 12N50-75B adapter. Other This key allows the user to enter other adapter offset values. Adapter Enter the desired loss using the keypad or Up/Down arrow Offset key and press the ENTER key to accept.
-
Page 65: Power Monitor (External Detector) Option 5
Chapter 3 Key Functions Power Monitor (External Detector) Option 5 Selecting Power Monitor (External Detector) from the mode menu causes the soft keys, described below, to be displayed and the corresponding values shown in the message area. Units — Toggles between dBm and Watts. Rel —... - Page 66 Chapter 3 Key Functions Displays a menu of supported printers. Use the Up/Down arrow key and ENTER key to make the selection. Units Select the unit of measurement (metric or English). Change Toggles the date format between MM/DD/YYYY, DD/MM/YYYY, and Date YYYY/MM/DD.
-
Page 67: High Accuracy Power Meter (Option 19)
Chapter 3 Key Functions High Accuracy Power Meter (Option 19) Choosing the FREQ/SPANkey causes the soft keys, below, to be displayed and the corre- sponding values to be shown in the message area. Center Sets the center frequency of the Spectrum Analyzer. Enter a value using the Up/Down arrow key or keypad, press ENTER to accept, ESCAPE to restore previous value. - Page 68 Chapter 3 Key Functions Lower Activate the lower limit line by toggling this soft key. The unit beeps if Limit the data is below the set limit line and the status is displayed in the mes- sage area. Upper Activate the upper limit line by toggling this soft key. The unit beeps if Limit the data is above the set limit line and the status is displayed in the mes- sage area.
-
Page 69: Spectrum Analyzer Menus
Returns to the previous menu level. Start Activates the start frequency and sets the Anritsu Spectrum Master in the Start/Stop mode. Use the keypad to enter the desired start frequency and complete the entry by pressing the GHz, MHz, kHz, or Hz softkey to ac- cept the start frequency input. - Page 70 Press ENTER to accept. This soft key is not available when the Units selection is Linear (see below). Atten/Preamp Sets the Anritsu Spectrum Master input attenuator so that it is either cou- pled automatically to the reference level (Auto), manually adjustable (Manual), or dynamically controlled (Dynamic).
- Page 71 Chapter 3 Key Functions justing the attenuation and preamp to give the maximum dy- namic range without compressing the input mixer. Dynamic attenuation is based on a broadband detector. This means that an out of band signal may interfere and force the need to use a bandpass filter to eliminate the out of band in- terference and enable accurate measurements.
- Page 72 Chapter 3 Key Functions Allows the user to manually set the video bandwidth using Manual the Up/Down arrow key. Back Returns to the previous menu level. Trigger Select the method used to trigger the sweep. Free Run The sweep is continuous. Single A single sweep will be performed with each press of the ENTER key.
- Page 73 Chapter 3 Key Functions Average Sets the number of the sweeps to be averaged. The number (2-25) of the sweeps can be adjusted from 2 to 25 using the Up/Down arrow key, or entered directly with the keypad number keys. Select OFF, or enter 1 to turn off averaging. Press ENTER to accept the selected value.
- Page 74 Chapter 3 Key Functions Trace Menu Pressing the TRACE key in Spectrum Analyzer mode activates a menu of trace-related functions. Use the corresponding softkey to select the desired trace function. NOTE: For this function, Trace A is always the runtime trace, and Trace B is al- ways a saved trace.
- Page 75 Activates the Channel Power measurement function. Channel Power and Power Channel Power Density are measured based on the selection in the Units menu. Center Activates the center frequency function, and sets the center Freq frequency of the Anritsu Spectrum Master for the channel power measurement. 3-18...
- Page 76 Chapter 3 Key Functions Sets the integration bandwidth for channel power measure- ment. Modifying this value automatically adjusts the channel span to maintain the same ratio. Channel Sets the channel span for channel power measurement. Span Zoom Automatically sets the span to cover one channel. A standard and channel must be selected for this feature to be active.
- Page 77 Chapter 3 Key Functions Int. Analysis The instrument attempts to identify the type of signal standard based on the modulation characteristics of the signal. Enter the frequency of the interfering signal. A specific fre- quency can be entered using the keypad or Up/Down arrow Freq key.
- Page 78 Chapter 3 Key Functions Center - Activates the center frequency function and sets the Spectrum Master to the center frequency. A specific cen- ter frequency can be entered using the keypad or Up/Down arrow key. Span - Sets the user-defined frequency span. Use the Up/Down arrow key or keypad to enter a value in MHz.
- Page 79 Chapter 3 Key Functions Segment View/edit the upper limit segment 4. Segment View/edit the upper limit segment 5. Back Return to the previous menu. Multiple Set multiple user-defined lower limits, and can be used to create a lower Lower limit mask for quick pass/fail measurements. A lower limit will result in a Limits failure when the data falls below the limit line.
- Page 80 Chapter 3 Key Functions Marker Menu Pressing MARKER on the data keypad in Spectrum Analyzer mode activates a menu for the six different markers. Use the corresponding softkey to select the desired marker. Then use the marker second level menu to turn the markers on or off, and to edit marker parame- ters and values.
- Page 81 Chapter 3 Key Functions Delta Displays delta frequency and amplitude for the selected marker Mx (M2, (Mx-M1) M3 or M4) with respect to the M1 marker. Marker Places the selected marker at the maximum amplitude of a trace (M1 - M4 only).
- Page 82 This setting is commonly used for cable TV-re- lated measurements. Pressing this soft key will also compensate 7.5 dB for the loss of the Anritsu 12N50-75B adapter. 3-25...
- Page 83 Chapter 3 Key Functions Other This key allows the user to enter other adapter offset values. Adapter Enter the desired loss using the keypad or Up/Down arrow Offset key and press the ENTER key to accept. Back Returns to the previous menu. Back Returns to the top-level SYS menu.
-
Page 84: Transmission Measurement Menus
Returns to the previous menu level. Start Activates the start frequency and sets the Anritsu Spectrum Master in the Start/Stop mode. Use the keypad to enter the desired start frequency and complete the entry by pressing the GHz, MHz, kHz, or Hz softkey to ac- cept the start frequency input. - Page 85 Enter the desired scale using the keypad or Up/Down ar- row key. Press ENTER to accept. Atten/Preamp Sets the Anritsu Spectrum Master input attenuator so that it is either cou- pled automatically to the reference level (Auto), manually adjustable (Manual), or dynamically controlled (Dynamic).
- Page 86 Chapter 3 Key Functions Dynamic attenuation is based on a broadband detector. This means that an out of band signal may interfere and force the need to use a bandpass filter to eliminate the out of band in- terference and enable accurate measurements. Preamp Allows manual control of the preamplifier on/off state.
- Page 87 Chapter 3 Key Functions Displays and holds the minimum responses of the input signal over multi- Hold ple sweeps. This feature is useful for detecting small, discrete, stable sig- nals in the presence of noise. Trace Menu Pressing the TRACE key in Transmission Measurement mode activates a menu of trace-re- lated functions.
- Page 88 This setting is commonly used for cable TV-re- lated measurements. Pressing this soft key will also compensate 7.5 dB for the loss of the Anritsu 12N50-75B adapter. Other This key allows the user to enter other adapter offset values.
- Page 89 Chapter 3 Key Functions Status In cable and antenna analyzer freq or dist measurement mode, displays the current instrument status, including calibration status, temperature, and battery charge state. Press ESCAPE to return to operation. Opens the GPS soft key menu. Press the GPS On/Off soft key to turn the GPS feature on or off.
- Page 90 Chapter 3 Key Functions Segment View/edit the upper limit segment 2. Segment View/edit the upper limit segment 3. Segment View/edit the upper limit segment 4. Segment View/edit the upper limit segment 5. Back Return to the previous menu. Multiple Set multiple user-defined lower limits, and can be used to create a lower Lower limit mask for quick pass/fail measurements.
- Page 91 Chapter 3 Key Functions set equal to the ending point of the current segment (if the current segment is on). Back Return to the previous menu. Marker Menu Pressing MARKER on the data keypad in Transmission Measurement mode activates a menu for the six different markers.
- Page 92 Chapter 3 Key Functions On/Off Turns the selected marker on or off. Edit Opens the selected marker parameter for data entry. Enter the desired marker frequency using the keypad or Up/Down arrow key. Select the GHz, MHz, kHz, or Hz softkey to accept the marker frequency input. Delta Displays delta frequency and amplitude for the selected marker Mx (M2, (Mx-M1)
-
Page 93: Interference Analyzer Mode (Option 25)
Chapter 3 Key Functions Interference Analyzer Mode (Option 25) The Interference Analyzer option provides several different ways to determine the nature and source of an interfering signal. Selecting Interference Analyzer from the mode menu causes the soft keys, described below, to be displayed and the corresponding values shown in the message area. - Page 94 Chapter 3 Key Functions AMPLITUDE Choosing AMPLITUDE causes the soft keys, below, to be displayed and the corresponding values to be shown in the message area. Ref Level — Activates the amplitude reference level function which sets the amplitude at the top of the display.
- Page 95 Chapter 3 Key Functions BW/SWEEP Pressing BW/SWEEP activates a menu of bandwidth and sweep-related functions. Use the corresponding soft key to select the desired function. Spectrum — Spectrum selects a traditional spectrum analyzer display. Spectrogram — Selecting Spectrogram provides a three dimensional representation of fre- quency, time and power to aid in the identification of intermittent signals.
- Page 96 Chapter 3 Key Functions creases as the measured signal strength increases. This mode is especially useful when at- tempting to locate an emitter using a directional antenna. Volume — Select the Volume soft key to adjust the sound level of the audible signal strength indicator using the Up/Down arrow key.
- Page 97 Chapter 3 Key Functions surement frequency. Refer to the Marker key section on the next page for information on setting the markers. Back — Returns to the previous menu level. Setup — Sets the parameters for IA measurements. Bandwidth — Activates a menu that allows the resolution and video bandwidths to be ei- ther coupled automatically to the span (Auto) or manually adjustable (Manual).
- Page 98 Chapter 3 Key Functions Edit — Opens the selected marker parameter for data entry. Enter the desired marker fre- quency using the keypad or Up/Down arrow key. Select the GHz, MHz, kHz, or Hz soft key to accept the marker frequency input. Delta (Mx-M1) —...
- Page 99 Chapter 3 Key Functions NOTE: If markers M1 and/or M2 are off, the Peak and Valley functions above are executed across the entire span. M6 — Selects the M6 marker parameter and opens the M6 marker second level menu with M6 highlighted.
- Page 100 Chapter 3 Key Functions Edit — Allows entry of the limit amplitude using the keypad or Up/Down arrow key. Press ENTER to accept the entered value. Upper / Lower Limit — Selects whether the measurement will fail if the data is above the limit line or below the limit line, as indicated in the message area of the display.
- Page 101 75W value based on the offset value specified by the adapter used in the mea- surement. This setting is commonly used for cable TV-related measurements. Pressing this soft key will also compensate 7.5 dB for the loss of the Anritsu 12N50-75B adapter. 3-44...
- Page 102 Chapter 3 Key Functions Other adapter Offset — This key allows the user to enter other adapter offset values. En- ter the desired loss using the keypad or Up/Down arrow key and press the ENTER key to accept. Back — Returns to the previous menu. Back —...
-
Page 103: Channel Scanner Mode (Option 27)
Chapter 3 Key Functions Channel Scanner Mode (Option 27) The Channel Scanner option provides the choice of a bar graph or a text display showing the amplitude of selected channels for a given air interface standard. The interface settings can be manually entered if none of the available air interface standards meet the measure- ment need. - Page 104 Chapter 3 Key Functions Channel Span — Channel Span sets the width of each channel. Enter a Channel Span from 0 to 3000 MHz using the Up/Down arrow key, or the keypad and the appropriate soft key for Hz, kHz, MHz or GHz. Press ENTER to accept the input. AMPLITUDE Choosing AMPLITUDE causes the soft keys, below, to be displayed and the corresponding values to be shown in the message area.
- Page 105 This setting is commonly used for cable TV-related measurements. Pressing this soft key will also compensate 7.5 dB for the loss of the Anritsu 12N50-75B adapter. Other adapter Offset — This key allows the user to enter other adapter offset values. En- ter the desired loss using the keypad or Up/Down arrow key and press the ENTER key to accept.
- Page 106 Chapter 3 Key Functions Press the Quality soft key to display the number of tracked satellites and the GPS quality. Press the Reset soft key to reset the GPS. Back — Returns to the previous menu. Language — Pressing this soft key immediately changes the language used to display messages on the Spectrum Master status window.
-
Page 107: Cw Signal Generator Mode (Option 28)
The external splitter feeds the signal into the instrument's RF input. The display shows the output power and frequency. The amplitude is set using an external step attenuator. The external splitter and attenuator are included in Anritsu CW Signal Generator Kit, part number 61534, or can be customer-supplied. - Page 108 This setting is commonly used for cable TV-related measurements. Pressing this soft key will also compensate 7.5 dB for the loss of the Anritsu 12N50-75B adapter. Other adapter Offset — This key allows the user to enter other adapter offset values. En- ter the desired loss using the keypad or Up/Down arrow key and press the ENTER key to accept.
- Page 109 Chapter 3 Key Functions Language — Pressing this soft key immediately changes the language used to display messages on the Spectrum Master status window. Choices are English, French, German, Spanish, Chinese, and Japanese. The default language is English. 3-52...
-
Page 110: All Modes
Chapter 3 Key Functions All Modes The following key menus are available and function identically in all modes. Save Setup Menu Pressing SAVE SETUP on the data keypad saves the current system setup to 1 of 10 (1 of 5 in Power Meter (Option 29) mode) internal non-volatile memory locations. When the key is pressed, a Save Setup selection box appears on the display. - Page 111 The default is continuous sweep. When single sweep is se- lected, the Anritsu Spectrum Master will sweep once and hold until activated again by pressing the ENTER key. The currently selected sweep mode appears to the left of the display.
-
Page 112: Chapter 4 - Measurement Fundamentals
This chapter demonstrates spectrum analyzer measurement techniques using the Anritsu Spectrum Master, with measurement techniques and examples of typical applications. Each application focuses on different features of the Anritsu Spectrum Master. Measurement ap- plications and procedures covered in this section include:... - Page 113 “smeared” look to it, with the spectral lines being wider than normal and shifted to the right. Fortunately, the Anritsu Handheld Spectrum Analyzer has mechanisms designed into it that relieve the user from having to calculate the sweep rate. When changing the RBW and VBW, the sweep rate will change accordingly.
- Page 114 Chapter 4 Measurement Fundamentals Attenuator Functions Attenuation adjusts the hand held spectrum analyzer input attenuator. In Auto mode, as the reference level is increased, the attenuation is increased. In Manual mode, the input attenu- ation can be adjusted using the keypad or the Up/Down arrow key. The attenuator range is 0 to 51 dB, in 1 dB steps.
-
Page 115: Preamplifier
Chapter 4 Measurement Fundamentals Preamplifier The MS2711D includes a built-in preamplifier which provides the MS2711D with an addi- tional 25 dB of sensitivity. The preamplifier is a broadband preamplifier and thus the use of discrete filters should be considered when using it. Four different bandpass filters have been added to the list of optional accessories to accommodate this need (see Table 1-1, Optional Accessories). -
Page 116: Preamplifier Measurement Example
Required Equipment MS2711D Handheld Spectrum Master Test Port extension cable, Anritsu 15NNF50 – 1.5C A signal source (Anritsu 69xxxB Synthesized Signal Generator or equivalent) Procedure Step 1. If necessary, set the MS2711D to Spectrum Analyzer mode. Step 2. Reset the MS2711D to the factory default settings for the current mode by press- ing the RECALL SETUP key on the data keypad. - Page 117 Chapter 4 Measurement Fundamentals Figure 4-1 shows the measurement results with the preamplifier off. Figure 4-1. Preamplifier Off Step 15. Turn the preamplifier on. When the preamplifier is ON, the word AMP should appear in the lower left corner of the display. The displayed noise level should be lowered by approximately 20 dB on the dis- play, and the signal should appear on top of the displayed noise.
- Page 118 Chapter 4 Measurement Fundamentals Example 1: Resolving Closely Spaced Signals Signal resolution is determined by the intermediate frequency (IF) filter bandwidth. The hand held spectrum analyzer, as do conventional spectrum analyzers, traces the shape of its IF filter as it tunes past a signal. Thus, if two equal-amplitude signals are close enough in frequency, the filter shapes for the two signals can fall on top of one another and appear as a single response.
- Page 119 Chapter 4 Measurement Fundamentals Step 6. Change the Resolution Bandwidth to 3 kHz. Figure 4-4 shows the results after changing the RBW using a signal combiner/splitter with a loss of 6 dB. Averaging has been turned off for this display, as the signals can be discerned without it.
- Page 120 Chapter 4 Measurement Fundamentals Measurement of Two Signals Having Unequal Amplitudes Typically, in real world environments, closely spaced signals do not have equal amplitudes. Often, the difference between closely spaced signals can be as much as 60 dB. To resolve two signals of unequal amplitude, the resolution bandwidth must be less than or equal to the frequency separation of the two signals (the same as resolving two equal amplitude signals).
- Page 121 Chapter 4 Measurement Fundamentals Step 1. Change the resolution bandwidth to 30 kHz. Figure 4-6 shows the results after changing the RBW using a signal combiner/splitter with a loss of 6 dB. Figure 4-6. Measurement of Two Signals Having Unequal Amplitudes The two signals should still be observable with the 10 kHz resolution bandwidth, but may be difficult to detect with the 30 kHz resolution bandwidth.
- Page 122 Step 3. Enter the desired Reference Level (+20 dBm) using the keypad and press ENTER. Step 4. Connect a signal source to the Anritsu Spectrum Master. Step 5. Set the signal source frequency to 10 MHz and the signal level to +10 dBm.
- Page 123 Chapter 4 Measurement Fundamentals Step 17. Press the Delta (M3-M1) soft key. This will provide frequency and amplitude information with respect to marker M1. Figure 4-7 shows the distortion characteristics of the signal source just measured. Marker 1 indicates the fundamental frequency. Marker 2 shows that the second order distortion of the source is 65.70 dB below the carrier.
- Page 124 Chapter 4 Measurement Fundamentals Example 3: AM/FM Modulation is the process of translating some low frequency or baseband signal (voice, mu- sic, or data) to a higher frequency. In the modulation process, some characteristic of a car- rier signal (usually amplitude or frequency) is changed in direct proportion to the instantaneous amplitude of the baseband signal.
- Page 125 Chapter 4 Measurement Fundamentals band frequency and pressing the Delta (M2-M1) soft key. Figure 4-8 shows the modulating frequency of 35 kHz as the value of delta Marker 2. Figure 4-8. Amplitude Modulation The markers read the frequency difference between the two signals, which is equal to the modulating frequency.
- Page 126 Chapter 4 Measurement Fundamentals the spectrum of a FM signal is not infinite. The sideband amplitudes become negligibly small beyond a certain frequency offset for the carrier, depending on the value of b. To demonstrate the properties of an FM signal, we will use a carrier frequency of 900 MHz and test for FM deviation of 17.5 kHz.
- Page 127 Field Strength Measurements. The antenna factors for custom antennas may be uploaded to the MS2711D using the Anritsu Handheld Software Tools provided with the unit. These antenna factors can then be used to enhance measurement accuracy.
- Page 128 Quick go/no-go measurements can be performed by establishing test limits. When using test limits, the user is able to quickly identify signals exceeding established limits as failing. To aid users in establishing limits, the Anritsu Spectrum Master features both single limit and multiple limit functions.
- Page 129 Chapter 4 Measurement Fundamentals Figure 4-11 shows the resulting display. The mask created in this example serves as an up- per bound on the measurement results. Any of the data points appearing above the line indi- cates a failed measurement. Figure 4-11.
- Page 130 Recall Setup selection box appears on the display. Select setup location 0 <De- fault> to recall the factory preset state for the currently selected mode. Step 2. Connect a signal source to the Anritsu Spectrum Master and set the signal source frequency to 900 MHz and the signal level to –20 dBm.
-
Page 131: Chapter 5 - Field Measurements
X dB below the peak carrier level. Required Equipment MS2711D Handheld Spectrum Analyzer 30 dB, 50 watt, Bi-directional, DC – 18 GHz, N(m) – N(f), Attenuator, Anritsu 42N50A-30 Test Port extension cable, Anritsu 15NNF50 – 1.5C... - Page 132 Chapter 5 Field Measurements Procedure Step 1. If the MS2711D is not currently in Spectrum Analyzer mode, press the MODE key, scroll to Spectrum Analyzer mode, and press ENTER. Step 2. Reset the MS2711D to the factory default settings for the current mode by press- ing the RECALL SETUP key on the data keypad.
-
Page 133: Channel Power Measurement
MS2711D Handheld Spectrum Master 30 dB, 50 Watt, bi-directional, DC –18 GHz, N(m) – N(f), Attenuator Test Port extension cable, Anritsu 15NNF50 – 1.5C Procedure Step 1. Reset the MS2711D to the factory default settings for the current mode by press- ing the RECALL SETUP key on the data keypad. - Page 134 Chapter 5 Field Measurements Step 5. Press the Scale soft key and set the scale to 10 dB/division. Step 6. Press the Atten/Preamp soft key followed by the Dynamic soft key to use dy- namic attenuation. Step 7. Press the MEAS key, and then the Channel Power soft key. Step 8.
-
Page 135: Gsm Channel Power Measurement
MS2711D Handheld Spectrum Master 30 dB, 50 Watt, bi-directional, DC –18 GHz, N(m) – N(f), Attenuator, Anritsu 42N50A-30 Test Port extension cable, Anritsu 15NNF50 – 1.5C Procedure Step 1. Reset the MS2711D to the factory default settings for the current mode by press- ing the RECALL SETUP key on the data keypad. - Page 136 Chapter 5 Field Measurements Step 7. Press the BW/SWEEP key, press the Bandwidth soft key, and press the RBW Auto and the VBW Auto soft keys. Step 8. Press the MEAS key and press the Channel Power soft key. Step 9. Select the Center Freq soft key and set the center frequency of the Spectrum Master to that of the GSM signal, in this case 947.4 MHz.
-
Page 137: Amps Channel Power Measurement
MS2711D Handheld Spectrum Master 30 dB, 50 Watt, bi-directional, DC –18 GHz, N(m) – N(f), Attenuator, Anritsu 42N50A-30 Test Port extension cable, Anritsu 15NNF50 – 1.5C Procedure Step 1. Reset the MS2711D to the factory default settings for the current mode by press- ing the RECALL SETUP key on the data keypad. - Page 138 Chapter 5 Field Measurements Step 12. Make the measurement by pressing the Measure soft key. The detection method is automatically changed to RMS Average. Solid vertical lines are drawn on the display to indicate the integration bandwidth. The MS2711D will display the measurement results in the message area.
-
Page 139: Adjacent Channel Power Ratio
30 dB, 50 watt, Bi-Directional, DC – 18 GHz, N(m) – N(f), Attenuator, Anritsu 42N50A-30 Test Port extension cable, Anritsu 15NNF50 – 1.5C Procedure Step 1. Reset the MS2711D to the factory default settings for the current mode by press- ing the RECALL SETUP key on the data keypad. - Page 140 Chapter 5 Field Measurements d. Select the Adj Channel BW soft key, and enter the desired adjacent channel bandwidth. For an IS-95 CDMA signal, enter 30 kHz. e. Select the Channel Spacing soft key, and enter the desired channel spac- ing.
-
Page 141: Gsm Adjacent Channel Power Measurement
GSM Adjacent Channel Power Measurement Required Equipment MS2711D Handheld Spectrum Analyzer Test Port extension cable, Anritsu 15NNF50 – 1.5C Procedure Step 1. Reset the MS2711D to the factory default settings for the current mode by press- ing the RECALL SETUP key on the data keypad. When the key is pressed, a Recall Setup selection box appears on the display. - Page 142 Chapter 5 Field Measurements Figure 5-6 shows the results of the measurement using a GSM signal source with an output power level of –35 dBm. Figure 5-6. GSM Adjacent Channel Power Measurement Adjacent Channel Power Ratio is a constant measurement. Once it is turned on, it will re- main on until it is turned off by pressing the Measure soft key again.
-
Page 143: Amps (Tdma) Adjacent Channel Power Measurement
30 dB, 50 watt, Bi-Directional, DC – 18 GHz, N(m) – N(f), Attenuator, Anritsu 42N50A-30 Test Port extension cable, Anritsu 15NNF50 – 1.5C Procedure Step 1. Reset the MS2711D to the factory default settings for the current mode by press- ing the RECALL SETUP key on the data keypad. - Page 144 Chapter 5 Field Measurements Figure 5-7. AMPS Adjacent Channel Power Measurement Adjacent Channel Power Ratio is a constant measurement. Once it is turned on, it will re- main on until it is turned off by pressing the Measure key again. When the ACPR mea- surement is on, an ACPR icon appears to the left of the display.
-
Page 145: Out-Of-Band Spurious Emissions
Out-of-Band Spurious Emission Measurement Required Equipment MS2711D Handheld Spectrum Analyzer Test Port extension cable, Anritsu 15NNF50 – 1.5C Procedure Step 1. Reset the MS2711D to the factory default settings for the current mode by press- ing the RECALL SETUP key on the data keypad. When the key is pressed, a Recall Setup selection box appears on the display. - Page 146 Chapter 5 Field Measurements Step 10. Press the Back soft key and select the M2 soft key. Move the M2 marker over one of the spurs and press ENTER to set the marker. Step 11. Compare the value of the marker to the specified allowable level of out-of-band spurious emissions for the corresponding channel transmit frequency.
-
Page 147: In-Band/Out-Of-Channel Measurements
30 dB, 50 watt, Bi-Directional, DC – 18 GHz, N(m) – N(f), Attenuator, Anritsu 42N50A-30 Test Port extension cable, Anritsu 15NNF50 – 1.5C Procedure Step 1. Reset the MS2711D to the factory default settings for the current mode by press- ing the RECALL SETUP key on the data keypad. - Page 148 Chapter 5 Field Measurements Step 12. Compare the value of the marker to the specified allowable level of in-band/out-of-channel spurious emissions for the corresponding channel trans- mit frequency. Step 13. Press the Delta (M2-M1) soft key to see the distance of the spur from the car- rier.
-
Page 149: Field Strength
Chapter 5 Field Measurements Field Strength Required Equipment MS2711D Handheld Spectrum Analyzer Portable Antenna Procedure Step 1. Use the Antenna Editor feature of the Handheld Software Tools to define an an- tenna (see page 12-8). Step 2. Reset the MS2711D to the factory default settings for the current mode by press- ing the RECALL SETUP key on the data keypad. - Page 150 Chapter 5 Field Measurements Figure 5-11 shows the results of a measurement using a 2000-1031 antenna. Figure 5-11. Field Strength Antenna Calculations The following is a list of various antenna calculations should you find it necessary to con- vert from one to another: Conversion of signal levels from W to V in a 50W system: where: P = power in Watts...
- Page 151 Chapter 5 Field Measurements In the far field, where electric and magnetic fields are related by the impedance of free space: = power density in W/m = power transmitted in Watts = gain of transmitting antenna r = distance from the antenna in meters 5-21...
-
Page 152: Dynamic Attenuation Control
Chapter 5 Field Measurements Dynamic Attenuation Control The dynamic attenuation control feature tracks the peak input signal level and automatically adjusts the attenuator to protect the MS2711D in situations of high RF signal levels. This feature also enhances the instrument sensitivity in situations of low-level RF signals by de- activating and activating the internal preamplifier resulting in improved measurement accu- racy. -
Page 153: Frequency Converter Interface (Option 6)
Option 6 provides added circuitry and a connector to provide power, control signals and a local oscillator signal to a frequency converter. The Anritsu FCN4760 4.7 GHz to 6.0 GHz Frequency Converter can be used with this op- tion. When the frequency converter is attached to the Spectrum Master, the frequency range of the combination becomes 4.7 GHz to 6.0 GHz. -
Page 154: Am/Fm Demodulation
Chapter 5 Field Measurements AM/FM Demodulation The Spectrum Master built-in demodulator for AM, narrowband FM, wideband FM and single sideband (selectable USB and LSB) allows a technician to hear an interfering signal for easy identification. The demodulated signal can be heard using either the built-in speaker, or through a monaural headset connected to the 1/8-inch jack on the test panel. - Page 155 Chapter 5 Field Measurements Figure 5-14. SSB Demodulation Step 5. Press the On/Off soft key to enable the measurement. AM/FM will appear to the left of the graph. Figure 5-15. AM Demodulation Step 6. Use the Volume soft key and the Up/Down arrow key to change the audio vol- ume from 0% to 100%.
-
Page 156: Carrier To Interference Ratio Measurement
Chapter 5 Field Measurements Carrier to Interference Ratio Measurement Carrier to Interference Ratio (C/I) Measurement is a two-step process, first measuring the carrier level and then, with the carrier turned off, measuring the remaining signals and noise in the band of interest. After the two measurements are complete, the ratio of the carrier level to the noise plus interference is displayed using three assumptions: The interferer is a narrowband frequency hopping signal (NB FHSS) The interferer is a wideband frequency hopping signal (WB FHSS) - Page 157 Chapter 5 Field Measurements Step 5. Press the MEAS key followed by the More soft key and the C/I soft key. Figure 5-17. Carrier to Interference Ratio Measurement Screen Step 6. Press the Signal Type soft key and select the correct carrier signal type from the three choices, Narrow Band FHSS, Wide Band FHSS, or Broadband.
- Page 158 Chapter 5 Field Measurements Step 11. Press the Measure soft key and follow the on-screen prompts to complete the measurement. NOTE: Access to the transmitter is required to complete this procedure as the transmitted carrier must be turned off for the second portion of the measure- ment.
-
Page 159: Interference Analysis
Chapter 5 Field Measurements Interference Analysis Interference analysis, as performed by the Spectrum Master MS2711D, is a process of mea- suring the bandwidth and skirt shapes of a signal and determining what type of cellular sig- nal it is from those characteristics. -
Page 160: Noise Marker
Chapter 5 Field Measurements Step 3. Press the Measure soft key to initiate the measurement. After about one minute, the instrument will display the results. If the signal is of a known cellular type, the cellular standard and the estimated bandwidth will be displayed in a dialog box. -
Page 161: Chapter 6 - Power Measurements
Chapter 6 Power Measurements Introduction The MS2711D Spectrum Master with Option 29 can make power measurements based on the spectrum analyzer measurements, and can display the measured power in dBm or Watts. The MS2711D Spectrum Master with Option 5 installed can be used for making power measurements with a broadband (0.001 MHz to 50 GHz) RF detector, as shown in Table 6-1. - Page 162 Chapter 6 Power Measurement Step 2. Press the Span soft key and enter the desired frequency span for the measure- ment between 3 and 2997 MHz. If the existing center frequency value would cause the instrument to be tuned outside of its available frequency range, the center frequency is automatically changed so that the entered span range can be used.
- Page 163 Press the Units soft key to toggle the power display units between Watts and dBm. Displaying Relative Power Step 1. With the desired base power level input to the Anritsu Spectrum Master, press the AMPLITUDE key, then the Rel soft key. The message area will show Relative: On and the power reading will indicate 100%.
-
Page 164: Offset Calibration
18" (46cm) Test Port Extension Cable, Anritsu 3-806-151 · 10 dB Attenuator, Anritsu 3-1010-119 · 30 dB, 50W, bi-directional, DC–18 GHz, N(m) – N(f), Attenuator, Anritsu 42N50A-30 · Procedure Step 1. Press the ON/OFF key on the Spectrum Master. Step 2. Press the MODE key. - Page 165 Chapter 6 Power Measurement Step 7. Press the ENTER key. Step 8. Disconnect the 18" (46cm) Test Port Extension Cable from the RF In connector and connect the phase stable cable and attenuator between the RF In connector and the 18" (46cm) Test Port Extension Cable. 30 dB Attenuator 42N50A-30 18"...
- Page 166 Chapter 6 Power Measurement Recall an Offset Calibration The offset calibration will be turned off when the system is rebooted. However, the last cal- ibration is always saved and can be recalled and applied again without performing another calibration. Step 1. Press the Amplitude key. Step 2.
-
Page 167: Making Power Measurements With The Option 5 Power Monitor (External)
Chapter 6 Power Measurement Making Power Measurements with the Option 5 Power Monitor (External) Required Equipment MS2711D Spectrum Master with Power Monitor Option 5 · Broadband RF detector, as shown in Table 6-1 · 30 dB, 50 Watt, bi-directional, DC –18 GHz, N(m) – N(f), Attenuator, 42N50A-30 ·... - Page 168 Measurements use a single cycle per sweep AC detection, and auto-zeroing with DC detection during the frequency sweep. Optional extender cables of over 3000 feet can be used. Contact a local sales representative for special cables. Table 6-1. Anritsu Detectors Part Number Description 560-7A50...
-
Page 169: Making Power Measurements With The Option 19 High Accuracy Power Meter6-9
The Option 19 High Accuracy Power Meter connects to the PSN50 High Accuracy Power Sensor using an RS232 cable (Anritsu part number 800-441). A 9-18 VDC (<100 mA) power supply is needed to power the sensor. Anritsu power supply (40-168), supplied with the Site Master, or battery supply (3-40-172), supplied with the PSN50, are recommended. - Page 170 Required Equipment MS2711D Spectrum Master RS232 Serial Cable, Anritsu P/N 800-441 Battery Supply, Anritsu P/N 3-40-172, or Power Supply, Anritsu P/N 40-168 High Accuracy Power Sensor Anritsu P/N PSN50 30 dB, 50W, bi-directional, DC-8.5 GHz, N(m)-N(f), Attenuator, 3-1010-123 DC SUPPLY...
- Page 171 Chapter 6 Power Measurement Step 8. With no power applied to the sensor, press the AMPLITUDE key then the Zero soft key to zero the sensor. Zeroing the sensor is recommended when making power measurements below –20 dBm. Using Attenuators Step 9.
- Page 172 Chapter 6 Power Measurement Transferring Data to Handheld Software Tools The Site Master has only one serial port, so it is not possible to communicate with both the PSN50 sensor and a PC running Handheld Software Tools (HHST) at the same time. There- fore, only saved measurements can be viewed in HHST when using the PSN50.
-
Page 173: Chapter 7 - Transmission Measurement
Chapter 7 Transmission Measurement Introduction The Transmission Measurement option (Option 21) provides the capability to perform two-port measurements of passive devices over the 25 MHz to 3 GHz frequency range. The signal source provided by Option 21 is un-leveled, with a power output of approximately –10 dBm. -
Page 174: Transmission Measurement Procedure
Chapter 7 Transmission Measurement Step 4. Press the ENTER key. The unit will sweep once and store transmission correction information. On the next sweep, the trace should be flat at the zero dB reference line and ready for measurements. The cali- bration information is lost when the instrument is turned off. - Page 175 Chapter 7 Transmission Measurement Step 4. Calibrate the Spectrum Master for transmission measurements as described in the previous section. Step 5. Reconnect the duplexer and make the measurements. Figure 7-4. Transmission Measurement...
-
Page 176: Chapter 8 - Gps Feature
Activating the GPS Feature To activate the GPS feature: Step 1. Install the Anritsu GPS antenna to the GPS antenna connection on the Spectrum Master connector panel. NOTE: The GPS antenna connection on the Spectrum Master is fitted with a re- verse BNC connector to help prevent damage to the GPS circuitry. - Page 177 Chapter 8 GPS Feature NOTE: The Spectrum Master retains the current GPS location information until the unit is turned off. This feature allows measurement traces to be saved with the retained GPS location information even when the GPS is inactive or the in- strument is indoors.
-
Page 178: Saving With Gps Information
Chapter 8 GPS Feature Saving with GPS Information Spectrum Master measurement traces can be saved with the GPS coordinates of the location where the measurement was taken. The following procedure saves a display to memory. Step 1. Press the SAVE DISPLAY key to activate the alphanumeric menu for trace storage. - Page 179 Chapter 8 GPS Feature Figure 8-3. Saved GPS Location Information...
-
Page 180: Chapter 9 - Interference Analyzer Mode
Chapter 9 Interference Analyzer Mode Introduction This chapter presents Interference Analyzer (Option 25) information and procedures. Interference Analysis Multiple wireless networks often operate in complicated signal environments. Three or four base station antennas may be located on the same tower, and can create interference prob- lems. - Page 181 Chapter 9 Interference Analyzer Mode Step 6. Press the BW/SWEEP key followed by the Spectrogram soft key to set the spectrogram sweep parameters. There are two ways to set up spectrogram time parameters: set the time between sweeps or set the total time for a full spectro- gram display.
-
Page 182: Signal Strength
Chapter 9 Interference Analyzer Mode Signal Strength Signal Strength is useful for tracking down the source of an interfering signal. This mea- surement is done at a single frequency in zero span. Signal Strength displays the power at a single frequency (in dBm) along with an optional audible indicator. Connect a directional antenna and the frequency of the audible indicator increases as the measured signal strength increases. -
Page 183: Rssi
Chapter 9 Interference Analyzer Mode RSSI RSSI is useful to observe signal strength at a single frequency over time. Procedure: The following procedure demonstrates a common Interference Analyzer RSSI setup. To se- lect Interference Analyzer mode: Step 1. On the Spectrum Master, press the MODE key, use the Up/Down arrow key to select the Interference Analyzer mode and press ENTER. -
Page 184: Signal Id
Chapter 9 Interference Analyzer Mode Signal ID Signal Identification is used to determine, if possible, the air interface standard of a signal. If the instrument is unable to determine the modulation format, it will display the estimated bandwidth of the signal. Procedure: The following procedure demonstrates a common Interference Analyzer Signal ID setup. -
Page 185: Chapter 10 - Channel Scanner Mode
Chapter 10 Channel Scanner Mode Introduction This chapter presents Channel Scanner (Option 27) information and procedures. Channel Scanner The Channel Scanner option measures the output power of multiple transmitted signals. The output power can be displayed as a bar graph or a text display showing the amplitude of selected channels for a given air interface standard. - Page 186 Chapter 10 Channel Scanner Mode Step 1. Press the BW/SWEEP key and select the Number of Channels soft key. Use the keypad to enter 20 and press the ENTER key. The channels will be dis- played as bar graphs. Figure 10-1. Example of Channels Displayed as Bar Graphs Step 2.
- Page 187 Chapter 10 Channel Scanner Mode Step 3. To set up the channel step size, press the FREQ/SPAN key and select the Channel Step Size soft key. Use the keypad to enter 5 and press the ENTER key. Figure 10-4. Example of Channels Displayed as Bar Graphs with Channel Step Size = 5 Step 4.
-
Page 188: Chapter 11 - Signal Generator Mode
The external splitter feeds the signal into the RF input of the instrument. The display shows the output power and frequency. Required Equipment Spectrum Master MS2711D with Option 28 Anritsu CW Signal Generator Kit, part number 61534 Procedure Step1. On the Spectrum Master, press the MODE key, use the Up/Down arrow key to select the CW Signal Generator mode and press ENTER. -
Page 189: Softkeys
Chapter 11 Signal Generator Mode Step5. Adjust the power using the attenuator knobs until the receiver being tested drops the signal. Softkeys The following soft keys are available in CW Signal Generator mode: Freq — Enter a CW frequency from 25 MHz to 3000 MHz using the Up/Down arrow key, or the keypad and the appropriate soft key for Hz, kHz, MHz or GHz. -
Page 190: Chapter 12 - Handheld Software Tools
Handheld Software Tools Introduction This chapter provides a description of the Anritsu Handheld Software Tools program. Handheld Software Tools is a Windows 95/98/NT4/2000/ME/XP program for transferring measured traces, along with markers and limit lines, to the PC display. The program Help function provides on-screen instructions on display modification, trace overlay, uploading and downloading traces, and multiple plot printing. -
Page 191: Installation
Installation To install the Handheld Software Tools program: Step 1. Insert the Anritsu Handheld Software Tools disk in the CDROM drive. Step 2. From the Windows Start menu, select Run . Step 3. Type: X:\Setup.exe where X is the drive letter of your CDROM drive. -
Page 192: Using Handheld Software Tools
(Anritsu part number 800-441) An optional USB to serial adapter, part number 551-1691, can be added if required. Note that this USB adapter is the only adapter thoroughly tested by Anritsu to be trouble-free when used with Anritsu Handheld products and Handheld Software Tools. -
Page 193: Plot Capture To The Pc
Chapter 12 Handheld Software Tools Plot Capture to the PC To open the plot capture menus, select the capture icon on the button bar, or select the Capture drop down menu from the menu bar. Select Capture to Screen to download traces to the PC. Select a folder, or individual traces within a folder, to be downloaded to the PC. - Page 194 NOTE: While all possible selections are displayed, some of these selections ap- ply only to specific models of Anritsu hand held instruments. Trace Overlay or Plot Overlay Trace Overlay is activated by the Mouse Function icon. Single-click on the Mouse Function icon to toggle.
- Page 195 Chapter 12 Handheld Software Tools Saving Traces Once the plots are captured to the PC they can be saved as individual files or as a block of files to a database. Saving a Plot as a Windows Metafile or to a Spreadsheet Plots can be saved as a Windows metafile (.wmf), a HHST .dat file, a text file (.txt) or .mdb database.
- Page 196 Entering Antenna Factors in Handheld Software Tools NOTE: Antenna Factors are available only on Anritsu Handheld Spectrum Ana- lyzers, Spectrum Masters, and the Site Master Model S332D. The Antenna Factor (AF) is a fundamental parameter of an antenna used in field measure- ments.
- Page 197 Chapter 12 Handheld Software Tools It also can be shown that in a 50 ohm system: = 9 73 Where G = the gain of the receiving antenna in dB l = wave length in meters Antennas used for radiated emissions testing are individually calibrated (the antenna factors can be measured directly) at all appropriate distances.
- Page 198 Chapter 12 Handheld Software Tools Uploading Antenna Factors All 10 available antennas are transferred to the instrument at the same time. To modify only a single antenna in the instrument, first download the current antennas (see below) then modify the appropriate antenna, then re-upload the antennas to the instrument. To upload antenna information from Handheld Software Tools to the CUSTOM list in the instrument: Step 1.
-
Page 199: Index
Index GSM....5-5 clock . 3-6, 3-8, 3-24, 3-30, 3-44, 3-47, 3-50 accessories ....1-3 connectors . - Page 200 21 ..1-8, 2-6, 2-11, 7-1 29 ..1-8, 2-7, 3-53, 6-1 hard keys ....3-1 5 .
- Page 201 performance ... . 1-11 video bandwidth ..3-40, 4-2 sampling ....2-18, 3-15 volume .
Need help?
Do you have a question about the spectrum master ms2711d and is the answer not in the manual?
Questions and answers