Table of Contents
Advertisement
Quick Links
Advertisement
Table of Contents

Related Manuals for ECOTEST MKS-UM


Summary of Contents for ECOTEST MKS-UM
- Page 1 MKS-UМ MULTIPURPOSE DOSIMETER-RADIOMETER Operating manual...
-
Page 3: Table Of Contents
1 DESCRIPTION AND OPERATION ..............3 1.1 Purpose of use ....................3 1.2 Technical Specifications ..................4 1.3 Delivery kit of MKS-UM dosimeter ..............15 2 USE OF THE DOSIMETER ................29 2.1 Operating limitations ..................29 2.2 Preparation for operation .................. 29 2.3 Use of the dosimeter .................. - Page 4 This operating manual, (hereinafter OM) is intended to inform the user about the principles of operation and rules of application of MKS-UМ multipurpose dosimeter-radiometer (hereinafter dosimeter). The OM contains all information necessary for proper operation and full realization of its technical possibilities. The OM contains the following abbreviations: - ambient dose equivalent;...
-
Page 5: Description And Operation
1 DESCRIPTION AND OPERATION 1.1 Purpose of use The MKS-UМ multipurpose dosimeter-radiometer (hereinafter dosimeter) is designed for: - measurement of gamma and X-ray radiation DER (hereinafter referred to as photon-ionizing radiation); - indication of pulse count rate from photon-ionizing radiation detectors; - measurement of photon-ionizing radiation DE;... -
Page 6: Technical Specifications
1.2 Technical Specifications 1.2.1 Key specifications are presented in Tables 1.1 – 1.3. Table 1.1 – Key specifications of the control unit of the MKS-UM dosimeter- radiometer (hereinafter the control unit) Standardized value Measurement Name according to the unit specification Measurement range of photon- μSv/h... - Page 7 Table 1.1 (continued) Standardize d value Measure- Name according to ment unit specification Accuracy of DE accumulation time 1 measurement for 24 hrs Operating supply voltage of the dosimeter from Li- Ion battery Additional relative permissible error limit during measurement caused by supply voltage deviation from the reference value in the voltage range from 3.4 V to 4.2 V, for all measured physical quantities, not more than...
- Page 8 Table 1.1 (end) Standardized Measurement Name value according to unit the specification Unstable readings of the dosimeter during DER measurement for an 8-hour continuous operation, not more than Dimensions of the control unit (in hard 166 × 70 × 132 shell with solar panel), not more than Weight of the control unit, not more than...
- Page 9 Table 1.2 – Key specifications of the BDKS-01 combined detecting unit of gamma, beta radiation (hereinafter referred to as BG Probe) Standardized value Measurement Name according to the unit specification Measurement range of photon- μSv/h – 10 ionizing radiation DER Indication range of pulse count 0 –...
- Page 10 Table 1.2 (continued) Standardized value Measurement Name according to the unit specification 0.5 – 9 000 Measurement range of surface for С0 activity of beta-emitting Bq/cm sources type radionuclides Indication range of pulse count 0 – 9999 rate from beta radiation detector Energy range of recorded beta 0.3 –...
- Page 11 Table 1.2 (end) Standardized value Measurement Name according to the unit specification Unstable readings during measurement of all physical quantities for an 8-hour continuous operation, not more than Dimensions of the BG probe, not 47 × 96 × 176 more than Weight of the BG probe, not more than...
- Page 12 Table 1.3 – Key specifications of the BDKS-02 combined detecting unit of alpha, beta, gamma radiation (hereinafter referred to as ABG Probe) Standardized value Measurement Name according to the unit specification Measurement range of photon- μSv/h – 2×10 ionizing radiation DER Indication range of pulse count 0 –...
- Page 13 Table 1.3 (continued) Standardized value Measurement Name according to the unit specification Measurement range of surface ×min) part./(cm 10– 300 000 beta-particles flux density 0.5 – 13500 Measurement range of surface for С0 activity of beta-emitting Bq/cm sources type radionuclides Indication range of pulse count 0 –...
- Page 14 Table 1.3 (continued) Standardized value Measurement Name according to the unit specification Measurement range of surface ×min) 10 – 300 000 part./(cm alpha-particles flux density 0.5 – 10 000 Measurement range of surface for П9 activity of alpha-emitting Bq/cm sources type radionuclides Energy range of detected alpha- from 4.0 to 8.0...
- Page 15 Table 1.3 (end) Standardized value Measurement Name according to the unit specification Setup time of operating mode when measuring alpha-particles flux density and surface activity of alpha- emitting radionuclides, not more than Unstable readings during measurement of all physical quantities during an 8-hour continuous operation, not more than Dimensions of the ABG probe, not 72 ×186 ×...
- Page 16 1.2.10 The dosimeter is powered from lithium-ion battery of 26650 size with an integrated protection board against overcharging, prevention of discharge and short-circuit. Battery rated voltage – 3.7 V, capacity – 4000 mAh. 1.2.11 The dosimeter warns of the battery discharge. 1.2.12 The battery can be charged from: - AC mains from of 220V voltage, frequency of 50 Hz;...
-
Page 17: Delivery Kit Of Mks-Um Dosimeter
1.3 Delivery kit of MKS-UM dosimeter 1.3.1 The delivery kit of MKS-UM dosimeter includes units and maintenance documentation presented in Table 1.4. Table 1.4 - Delivery kit of the dosimeter Q-ty, Type Name Note pcs. BICT.468166.040 Control unit, MKS-UM BICT.418259.011... - Page 18 Table 1.4 (continued) Q-ty, Type Name Note pcs. Power Supply Unit Type 2124 24 V/0.65 A See note 3 Mascot Electronics AS AC Cord art.no 131306 for the power Mascot Electronics AS supply unit Set of operational documents: ВІСТ.412129.036 Operating manual РЭ...
- Page 19 Figure 1.1 – Contents of the carrying case 1 – Control unit with hard shell and solar panel; 2 – BG probe, MKS-UM; 3 – ABG probe, MKS-UM;...
- Page 20 4 – Probe’s spiral cable; 5 – Telescopic tube; 6 – Earpiece; 7 – Storage battery; 8 – Power supply unit, 24V DC; 9 – USB/IrDA adapter; 10 – AC cord; 11 – Power cable, DC, Vehicle; 12 – Telescopic tube armrest; 13 –...
- Page 21 1.3.2 The control unit of the dosimeter coupled with a hard shell, a hoop and a solar panel The control unit of the dosimeter serves to: - control operating modes of the dosimeter; - measure photon-ionizing radiation DER and DE with the help of the detector built into the dosimeter’s control unit;...
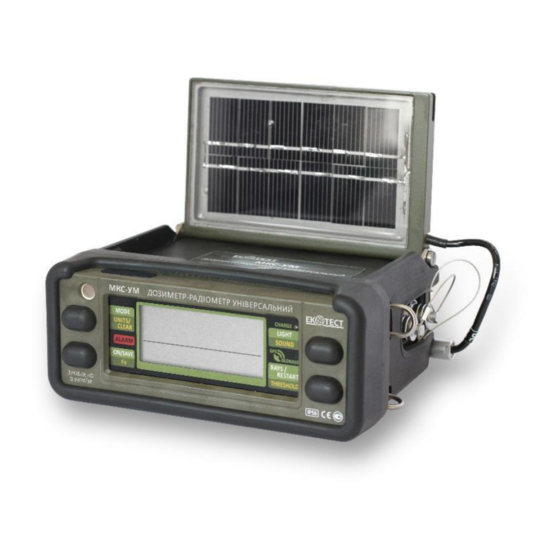
- Page 22 Figure 1.2 – Control unit of the dosimeter coupled with the hard shell and solar panel 1 – Control unit; 2 – Hard shell; 3 – Solar panel; 4 – LCD; 5, 6, 7, 8 – Buttons; 9 – Buzzer; 10, 11, 12 –...
- Page 23 1.3.3 BG Probe BG Probe serves to measure: - photon-ionizing radiation DER; - surface beta-particles flux density; - surface activity of beta-emitting radionuclides; and to communicate measurement results to the control unit via RS-485 interface. Figure 1.3 – BG probe 1 –...
- Page 24 1.3.4 ABG probe ABG probe serves to measure: - photon-ionizing radiation DER; - surface beta-particles flux density; - surface activity of beta-emitting radionuclides; - surface alpha-particles flux density; - surface activity of alpha-emitting radionuclides; and to communicate measurement results to the control unit via RS-485 interface. Figure 1.4 –...
- Page 25 1.3.5 Probe’s spiral cable Spiral cable is used to connect BG and ABG probes to the control unit. Figure 1.5 – Probe’s spiral cable 1.3.6 Telescopic tube with armrest. Telescopic tube is used to operate with BG and ABG probes. Its length is adjustable from 0.45 to 1.45 m (up to 1.68 m –...
- Page 26 1.3.7 Earpiece Earpiece allows searching for radiation anomalies using the dosimeter in the areas with high acoustic noise. When you connect the earpiece to the control unit, the buzzer of the latter stops generating all sound signals and similar sound signals begin to be generated by the earpiece.
- Page 27 1.3.9 Power supply unit, 24V DC with AC cord Power supply unit is used to charge the storage battery and supply power to the dosimeter from 100 to 240 V AC mains at 50 to 60 Hz frequency. Figure 1.9 – Power supply unit 24V DC with AC cord 1.3.10 Vehicle power cable DC The power cable is used to charge the dosimeter’s storage battery and to supply power to the dosimeter from the vehicle network.
- Page 28 PC. You can find additional information about USB/IrDA adapter in 2.3.6.12 of this operating manual. Important! To operate with the dosimeter you may use only the USB/IrDA adapter manufactured by ECOTEST. Figure 1.11 – USB/IrDA adapter 1.3.12 Pack of ABG protection gaskets Protection gaskets should be replaced with the damaged ones during the use of the ABG Probe.
- Page 29 1.3.13 Silicone-teflon grease Silicone-teflon grease is used for replacement of gaskets of the ABG Probe. Replacement of protection gaskets is described in the “Technical maintenance” section of this operating manual. Figure 1.13 – Silicone-teflon grease 1.3.14 Battery compartment lid O-ring The battery compartment lid O-ring of the control unit is used to replace the damaged one during use of the dosimeter.
- Page 30 1.3.16 O-rings for screws used to fasten ABG probe’s protection cover. O-rings for screws used to fasten ABG probe shall replace the damaged ones during use of the dosimeter. Replacement of the O-rings is described in "Technical maintenance" section of this operating manual.
-
Page 31: Use Of The Dosimeter
2 USE OF THE DOSIMETER 2.1 Operating limitations Operating limitations are presented in Table 2.1. Table 2.1 - Operating limitations Operating limitation Parameters о from – 30 to +55 С 1 Ambient air temperature о С temperature, 2 Relative humidity up to (953) % at 35 non-condensing 3 Low atmospheric pressure... - Page 32 2.2.2 External examination procedure 2.2.2.1 Unpack the dosimeter, and check if the delivery kit is complete. 2.2.2.2 Inspect for mechanical damage. 2.2.2.3 Check the condition of ABG probe’s protection gaskets. Replace them if they are dirty or damaged. 2.2.3 Connecting to the dosimeter’s connectors. 2.2.3.1 All the dosimeter’s connectors that are not currently used should be covered with protective plugs.
- Page 33 Therefore, the first time after the battery is inserted into the MKS-UM battery compartment and it is switched on, it enters the submode of time and date correction to set their accurate values...
- Page 34 2.2.5 Connecting BG probe 2.2.5.1 Set the required length of the telescopic tube. To do this, set the length of each of three segments of the tube (Figure 2.4): 1 - release the twist lock by turning it in the direction shown below; 2 - set the required length of the tube segment;...
- Page 35 2.2.5.3 Lay the probe’s spiral cable in the holder. Figure 2.7 – Laying the probe’s spiral cable in the holder 2.2.5.4 Screw the telescopic tube on the BG probe’s holder (Figure 2.8). If necessary, use the screwdriver from the delivery kit. Figure 2.8 –...
- Page 36 Figure 2.9 – Fixing telescopic tube to ABG probe 2.2.6.4 Connect one of the connectors of the probe’s cable to P connector of the control unit, and the other one - to the ABG probe’s connector. 2.2.7 Storage battery charging 2.2.7.1 Li-Ion storage battery of the dosimeter has no memory effect, so the battery can be charged regardless of its discharge status.
-
Page 37: Use Of The Dosimeter
Charging can be stopped if the battery temperature exceeded the permissible limits. Charging error may occur if the battery could not be charged over some period of time. 2.2.7.6 To charge the dosimeter battery from AC mains, connect the power supply cable connector to the DC connector of the control unit of the dosimeter and plug in the power supply to the mains. - Page 38 2.3.2 Dosimeter’s display and alarm tools 2.3.2.1 The LCD (1), “ALARM” (2) and “CHARGE” (3) LEDs, as well as the buttons (4), (5), (6), (7) are located on the front panel of the control unit. Figure 2.10 – Front panel of the control unit The status symbols of the navigation receiver and the battery located on the LCD.
- Page 39 “ALARM” LED informs about the presence of an alarm condition. If measurement results exceed the alarm threshold levels it is blinking at 4 Hz frequency. Blinking is accompanied by a two-tone audible signal. “CHARGE” LED displays the progress of the dosimeter battery charging. Possible statuses of the “CHARGE”...
- Page 40 Table 2.3 Mode Button functions (submode) UNITS/ RAYS/ THRE- of the ON/SAVE LIGHT SOUND MODE CLEAR RESTART SHOLD control unit Long press turns on the dosimeter Short Short Short press turns press – press Short press on or off Short press Display of initiates viewing...
- Page 41 Table 2.3 (continued) Mode RAYS/ (submode) of UNITS/ THRE- ON/SAVE LIGHT MODE the control CLEAR SHOLD START unit Short press - viewing Short press current turns on the local time Short Changes offset press Long backlight relative to turns on Navigation press for 8 s or...
- Page 42 Table 2.3 (end) Mode (submode) of UNITS/ RAYS/ THRE- ON/SAVE LIGHT MODE the control CLEAR RESTART SHOLD unit Short press – changes Short press corrected turns on the digit of the Proceeding Short measure- to the next press – backlight for ment object Measure- digit...
- Page 43 2.3.4 Nonvolatile memory of the dosimeter Nonvolatile memory of the dosimeter is arranged as two circular buffers. One buffer automatically saves photon-ionizing radiation DE accumulation history. It enables storing up to 2200 DE values. The other buffer, if the user decides so, stores measurements results of alpha, beta and gamma radiation characteristics.
- Page 44 From the mode of archive viewing the control unit goes back to the mode of measurement results display obtained from the probes or detectors. If the nonvolatile memory contains no saved measurement results, after pressing MODE the dosimeter immediately returns from the current time display mode to the mode of measurement results display obtained from the probes and detectors.
- Page 45 2.3.6.2 Switching LCD backlight on/off 2.3.6.2.1 Press shortly LIGHT to switch the display backlight on for 8 s. The backlight switches off automatically in 8 s. 2.3.6.2.2 To switch on continuous backlight of the dosimeter LCD, press and hold LIGHT (circa 6 s) until the backlight shortly blinks for two times. 2.3.6.2.3 Press shortly LIGHT to switch off the back-lit LCD.
- Page 46 2.3.6.4 Changing measurement units of measurement results display 2.3.6.4.1 It is possible to change measurement units in the mode of measurement results display obtained from the probes or detectors and in the mode of accumulated DE and DE accumulation time display. Shortly press UNITS to do that.
- Page 47 2.3.6.5.2 Operating mode of the control unit “Display of measurement results obtained from the probes or detectors” during DER measurement 2.3.6.5.2.1 When DER is measured, the control unit should be in the mode of measurement results display obtained from the probes or detectors. The control unit always enters this mode after being turned on.
- Page 48 Figure 2.11 – LCD of the dosimeter (Photon-ionizing radiation DER measurement) 2.3.6.5.2.4 Measurement results of photon-ionizing radiation DER (2) and the estimated limits of statistical deviations (4) of these results are generated on the LCD after the measurement starts. Measurement results are updated each 2 seconds. When DER is measured using the detector that is built in the control unit, ABG or BG probe, the alarm threshold level is constantly checked for being exceeded by measurement results with an appropriate dimension.
- Page 49 The estimated DER values when the first and all segments of the indicator are highlighted are shown in Table 2.4. Table 2.4 Probe or detector segment highlighted All segments highlighted Detector built in the 4 μSv/h 0.6 Sv/h control unit 0.8 μSv/h BG probe 10 Sv/h...
- Page 50 2.3.6.5.3 Submode of the control unit "Viewing and programming of new values of the alarm threshold level and the specified limits of statistical deviations (specified limits of the expected relative statistical deviations of the measurement result at 0.95 confidence probability)" during DER measurement 2.3.6.5.3.1 Press THRESHOLD to view current values of the alarm threshold level and the specified limits of statistical deviations.
- Page 51 Figure 2.13 – LCD of the dosimeter (submode of the alarm threshold level and the specified limits of statistical deviations programming) A blinking digit shows that its value can be programmed. The required value of the blinking digit is set by pressing RAYS/RESTART. Successive short presses and releases of RAYS/RESTART change the value per unit.
- Page 52 Important! If the submode of the alarm threshold level and the specified limits of statistical deviations programming is paused for more than 20 seconds (the user will not click any button), the control unit automatically returns to the mode of measurement results display obtained from the probes or detectors.
- Page 53 the probes or detectors. If deletion was chosen, the control unit switches to the submode of measurement object number programming. Important! If this submode is paused for more than 20 seconds (the user will not click any button), the control unit automatically returns to the mode of "Measurement results display obtained from the probes or detectors".
- Page 54 Short press of MODE fixes the value of this digit (in this case it stops blinking) and allows changing the next digit value, which starts blinking. All other digit values are programmed likewise. Upon completion of programming of the required digits of the measurement object number, shortly press ON/SAVE to save the DER measurement result, measurement object number, measurement time and geographical coordinates of measurement in the nonvolatile memory.
- Page 55 2.3.6.6.1.5 To measure beta radiation characteristics, open the beta detector window and place BG probe so that the window of its beta detector was in parallel and at a minimum distance to the surface to be examined. Figure 2.16 – Opening beta detector window of BG probe 1 –...
- Page 56 Figure 2.17 – Opening the detector windows of ABG probe 1 – pull the cover. 2 – turn the cover through circa 180°. 3 – move the cover until you feel it is fixed.
- Page 57 2.3.6.6.2 Operating mode of the control unit of the dosimeter “Measurement results display obtained from the probes or detectors” during beta radiation characteristics measurement 2.3.6.6.2.1 When measuring beta radiation characteristics the control unit should be in the mode of measurement results display obtained from the probes or detectors.
- Page 58 Figure 2.18 – LCD of the dosimeter (measurement of beta radiation characteristics) 2.3.6.6.2.4 After the measurement start, measurement results of beta radiation characteristics (3) and estimated limits of statistical deviations (5) of these results begin to be generated on the LCD. Measurement results are updated every 2 seconds. If the measurement results exceed the alarm threshold level, the dosimeter generates a two-tone audio signal and blinks with the ALARM LED.
- Page 59 Table 2.5 Probe segment highlighted All segments highlighted ·min) ·min) BG probe 0.312 kpart./(cm 145 kpart./(cm ·min) ·min) ABG probe 0.035 kpart./(cm 190 kpart./(cm 2.3.6.6.2.5 Beta radiation characteristics are measured as follows. After the measurement starts, the LCD of the dosimeter displays measurement results and estimated limits of statistical deviations of these results.
- Page 60 2.3.6.6.3 Submode of the control unit "Viewing and programming of new values of the alarm threshold level and the specified limits of statistical deviations (specified limits of the expected relative statistical deviations of the measurement result given 0.95 confidence probability)" during measurement of beta radiation characteristics 2.3.6.6.3.1 Press THRESHOLD to view the current values of the alarm threshold level and the specified limits of statistical deviations.
- Page 61 Figure 2.20 – LCD of the dosimeter (submode of the alarm threshold level and the specified limits of statistical deviations programming) Programming of the alarm threshold level and specified limits of statistical deviations when beta radiation characteristics are measured is similar to programming of the alarm threshold level and specified limits of statistical deviations in the event of photon-ionizing radiation DER measurement (2.3.6.5.3.2 of this OM).
- Page 62 Follow the procedure: - close the beta detector window; - place BG probe with the closed beta detector window so that it was in parallel to and at a minimum distance from the surface to be examined; - restart the measurement process by shortly pressing RAYS/RESTART; - wait for measurement results of gamma-component with minimum possible estimated limits of statistical deviations;...
- Page 63 Figure 2.21 – Opening the detectors windows of ABG probe 1 – pull the cover. 2 – turn the cover through circa 180°. 3 – move the cover until you feel it is fixed. 2.3.6.7.1.4 Open the alpha detector window (Figure 2.21). 2.3.6.7.1.5 Place the probe so that the window of its alpha detector was in parallel to and at a minimum distance from the surface to be examined.
- Page 64 Figure 2.22 – Twist limiter of ABG probe 2.3.6.7.2 Operation mode of the control unit “Measurement results display obtained from the probes and detectors” during alpha radiation characteristics measurement 2.3.6.7.2.1 When measuring alpha radiation characteristics the control unit should be in the mode of measurement results display obtained from the probes or detectors.
- Page 65 2.3.6.7.2.3 The LCD of the dosimeter displays the following in this mode (Figure 2.23): - “α” symbol (1) – radiation type being measured; - measurement result (2); - dimension of measurement result (3); - estimated limits of expected relative statistical deviations (5) of the measurement result (4) given 0.95 confidence probability, hereinafter referred to as the estimated limits of statistical deviations;...
- Page 66 A twenty-segment instantaneous value indicator (5) is intended for quick assessment of alpha radiation intensity. Instantaneous value of alpha radiation intensity is shown in pseudologarithmic scale. The greater the intensity, the more segments of the indicator are highlighted from left to right. The integration time during measurement of instantaneous value of alpha radiation intensity and the time of information update on the instantaneous value indicator is 500 ms Indicative values of surface alpha-particles flux density and surface activity...
- Page 67 2.3.6.7.3 Submode of the control unit of the dosimeter "Viewing and programming new values of the alarm threshold level and the specified limits of statistical deviations (specified limits of the expected relative statistical deviations of the measurement result given 0.95 confidence probability)" during measurement of alpha radiation characteristics 2.3.6.7.3.1 Press THRESHOLD to view the current values of the alarm threshold level and the specified limits of statistical deviations.
- Page 68 Figure 2.25 – LCD of the dosimeter (submode of the alarm threshold level and specified limits of statistical deviations programming) Programming of the alarm threshold level and specified limits of statistical deviations when alpha radiation characteristics are measured is similar to programming of the alarm threshold level and specified limits of statistical deviations in the event of photon-ionizing radiation DER measurement (2.3.6.5.3.2 of this OM).
- Page 69 2.3.6.8.2 Operating mode of the control unit “Display of accumulated DE and DE accumulation time” 2.3.6.8.2.1 This mode can be entered from any other operating mode with a short press of MODE. This mode follows the mode of measurement results display obtained from the probes and detectors.
- Page 70 2.3.6.8.2.5 If accumulated DE value exceeds 90 % of the alarm threshold level, the dosimeter starts generating an intermittent single-tone audio signal, which indicates to approximation of accumulated DE to the threshold level of alarm actuation. Press ON/SAVE to switch off this signal generation. When accumulated DE value exceeds the alarm threshold level, the dosimeter starts generating a two-tone audio signal and blinks with ALARM LED.
- Page 71 2.3.6.8.3.2 If you keep holding THRESHOLD for more than 4 s, the value of the alarm threshold level is returned to zero, and its low-order digit starts blinking (Figure 2.28). Then release THRESHOLD. Figure 2.28 – LCD of the dosimeter (submode of the alarm threshold level programming) Programming of the alarm threshold level relative to the accumulated DE value is done in a similar way to programming of the alarm threshold level in the event of...
- Page 72 Figure 2.29 – LCD of the dosimeter (Submode of accumulated DE, DE accumulation time and DE accumulation history clearing) Important! If the submode of accumulated DE, DE accumulation time and DE accumulation history clearing is paused for more than 20 seconds (the user will not click any button), the control unit automatically returns to the mode of accumulated DE and DE accumulation time display.
- Page 73 Figure 2.30 – LCD of the dosimeter (Navigation receiver control mode) The number of highlighted segments of the instantaneous value indicator (5) displays the number of satellites, which communicate information to the navigation receiver. 2.3.6.9.2.3 To change the navigation receiver status shortly press RAYS/RESTART.
- Page 74 Figure 2.31 – LCD of the dosimeter (viewing current local time offset relative to GMT) 2.3.6.9.3.2 If you keep holding THRESHOLD for more than 4 s, the value of the local time offset relative to GMT is cleared, and its low-order digit starts blinking (Figure 2.32).
- Page 75 A short press of ON/SAVE closes the submode of the new local time offset programming relative to GMT. The new offset blinks three times on the LCD, which means that it has been recorded in the nonvolatile memory of the control unit. After that the control unit returns to the navigation receiver control mode.
- Page 76 The current time values are displayed from the built-in clock or the navigation receiver. If the navigation receiver is on and reliable data is available, the current time is displayed from the navigation receiver, otherwise - from the built-in clock. 2.3.6.9.5 Submode of the control unit “Time and date correction”...
- Page 77 Figure 2.35 – LCD of the dosimeter (submode of time and date correction – year correction) Figure 2.36 – LCD of the dosimeter (submode of time and date correction – date and month correction) Blinking digits of the month mean that there is a possibility to correct their value.
- Page 78 2.3.6.10 Working with measurement results and DE accumulation history 2.3.6.10.1 General information Measurement results recorded in the nonvolatile memory of the control unit can be viewed on its LCD, and communicated for further processing to the personal computer. DE accumulation history can be also viewed on the LCD of the control unit.
- Page 79 During viewing, unless the user clicks a button of the control unit, measurement object number or estimated limits of statistical deviations of the measurement result are alternately displayed on the LCD area (4). symbol is highlighted on the LCD if geographical coordinates of the measurement object are stored for this measurement result in the nonvolatile memory.
- Page 80 2.3.6.10.3 Submode of the control unit “Measurement results clearing from the nonvolatile memory” 2.3.6.10.3.1 To proceed to the submode of measurement results clearing from the nonvolatile memory, press UNITS/CLEAR and hold it down (about 4 s) until “CLr” symbols appear on the LCD (Figure 2.38). After that release UNITS/CLEAR. Figure 2.38 –...
- Page 81 2.3.6.10.4 Transfer of measurement results from the nonvolatile memory of the control unit to the PC 2.3.6.10.4.1 To transfer the results do the following: - switch on the control unit; - run the custom-made software on the PC; - place the control unit so that its infrared port is opposite to the PC’s USB/IrDA adapter at a distance of 5 to 30 cm (Figure 2.39).
- Page 82 2.3.6.11 Troubleshooting The list of possible failures and troubleshooting is presented in Table 2.7. At failure to eliminate the troubles presented in Table 2.7, or at detection of more complicated problems, the dosimeter should be sent to the manufacturer for repair. Table 2.7 –...
- Page 83 2.3.6.12 USB/IrDA adapter 2.3.6.12.1 USB/IrDA adapter is designed to communicate information from the nonvolatile memory of the dosimeter to the PC. 2.3.6.12.2 USB/IrDA adapter is connected to the USB-port of the PC and operates in the mode of virtual COM-port. 2.3.6.12.3 USB/IrDA adapter operates under the following conditions: о...
- Page 84 DATA LED is blinking. 2.3.6.13 MKS-UM EventReader 1.0 custom-made software 2.3.6.13.1 MKS-UM EventReader 1.0 custom-made software is designed to process measurement results that have been saved in the nonvolatile memory of the control unit on the PC running Windows 7 and 8.1. Data from the control unit is transferred to the PC using the USB/IrDA adapter.
- Page 85 2.3.6.13.3 EventReader 1.0 installation Run setup.exe file from the CD included in the delivery kit. As soon as all the required parameters of the installer are set, the program is installed on your PC. 2.3.6.13.4 EventReader 1.0 interface Figure 2.40 – Program window The program window consists of: - Program menu - String of the dosimeter information...
- Page 86 Program menu Figure 2.41 – Program menu Actions in the program are performed using the appropriate menu options. Actions are grouped as follows: - "Data" - data control (reading, saving, downloading, printout, export) - "Settings" – program settings (connection setting: selecting a port that is connected to the USB/IrDA adapter, selecting the interface language) - "Help"...
- Page 87 - install the driver from the supplied CD; - find the number of the serial port of the USB/IrDA adapter in the Device Manager; - select the appropriate serial port from the program settings. Figure 2.44 – Serial port settings Data reading Figure 2.45 –...
- Page 88 To read data from the dosimeter’s memory turn on the dosimeter’s control unit. Select "Data - Read" menu option in the program and place USB/IrDA adapter to the infrared port of the control unit (Figure 2.39 of this OM). The status bar displays the reading process.
- Page 89 Table When displayed in a tabular form, the data is grouped in two tables placed in “Radiation” and “Dose” tabs. The information in table cells can have text or graphical representation. Tips are provided for the table's cells, which are represented by drawings. In the “Radiation”...
- Page 90 Figure 2.47 – “Radiation” table Entries in the "Radiation" table may contain information about the location coordinates. In this case, when you double-click on the appropriate table row, the program switches to the map tab, places the corresponding point in the center and opens a popup window with its detailed information.
- Page 91 - recording criterion: - automatically; - time synchronization with PC; (red) - emergency device shutdown; (green) - regular device shutdown. Figure 2.48 – “Dose” table Data saving To be able to view the read data later (especially if data was cleared from the dosimeter after reading), you can use the following options: - Save data as a binary file (menu option "Data - Save");...
-
Page 92: Technical Maintenance
3 TECHNICAL MAINTENANCE 3.1 General instructions The list of works during technical maintenance (hereinafter TM) of the dosimeter, their order and features at different stages of dosimeter operation are shown in Table 3.1. Table 3.1 - List of maintenance works Maintenance types during OM item... - Page 93 3.1.2 Safety measures Safety measures during maintenance fully comply with safety measures presented in 2.2.1 of the OM 3.1.3 Maintenance procedure of the device 3.1.3.1 External examination Exanine the device in the following order: а) check the technical condition of the device surface, integrity of seals, absence of scratches, traces of corrosion, and surface damage;...
- Page 94 Important! Only Li-Ion Batteries of 26650 size, rated voltage of 3.7V, with the intergrated board of protection against overcharging, prevention of discharge and short-circuit are allowed. Note. The clock of the dosimeter is powered from the dosimeter’s battery. The dosimeter’s clock has no additional sources of power supply. Therefore, the first time after the battery is inserted into the battery compartment and the dosimeter is switched on, it will enter the submode of time and date correction to set their accurate values (2.3.6.9.5 of this OM).
- Page 95 - apply a thin layer of silicone grease on the grid surface and put protection gaskets between them by matching the thickness: Figure 3.3 – Replacement of ABG probe’s protection gaskets - apply a thin layer of silicone grease on the inner surface of the protection cover and insert a pack with two grids and gaskets: Figure 3.4 –...
- Page 96 Figure 3.5 – Connecting the protection cover with ABG probe’s body - tighten the two captive screws: Figure 3.6 – Final clamping of the protection cover to ABG probe’s body...
- Page 97 3.1.3.7 Replacement of O ring of the ABG probe’s protection cover 3.1.3.7.1 If the O ring of the protection cover is damaged it should be replaced with the new one included in the delivery kit. Do the following: - loosen the two captive screws holding the protection cover and remove the cover (Figure 3.2);...
- Page 98 3.1.3.8 Replacement of O rings for screws used to fasten the ABG probe’s protection cover 3.1.3.8.1 If the O rings for screws used to fasten the protection cover are damaged, replace them with the new ones included in the delivery kit. Do the following: - loosen the two captive screws holding the protection cover and remove the cover (Figure 3.2);...
- Page 99 3.1.3.9 Removing the hard shell from the dosimeter’s control unit. 3.1.3.9.1 When moisture, dirt, etc., gets in the gap between the shell and the control unit, the hard shell should be removed, cleaned and dried. To do this, loosen the two captive screws (1) and remove the shell: Figure 3.9 –...
- Page 100 3.2 Verification of the dosimeter 3.2.1 MKS-UM dosimeter-radiometer shall be verified during operation and after repair. 3.2.2 The verification interval - no more than 12 months. 3.2.3 The verification operations are listed in Table 3.1. Table 3.1 - Verification operations...
- Page 101 Table 3.2 (end) Name Regulatory document or main technical specifications Л82.844.000 ПС. Temperature measurement range from –30 to С. Temperature measurement error - 0.1 С. Relative Aspiration psychrometer humidity measurement range from 10 to 100 %. Relative error of relative humidity measurement in the range from ...
- Page 102 3.2.5 The safety precautions given in 2.2.1 of this OM must be followed during verification. 3.2.6 Verification conditions The verification shall be carried out under the following conditions: - ambient temperature should be within (20 ±5) 0C; - relative humidity should be from 30 to 80%; - atmospheric pressure should be from 86 to 106.7 kPa;...
- Page 103 Note. The distance between the mechanical center of the source and the mechanical center of the detector is considered to be the distance between the mechanical center of the source and the plane perpendicular to the direction of gamma quanta beam propagation, and passes through the mechanical center of the detector in that plane.
- Page 104 3.2.9.11 Perform operations 3.2.9.6 - 3.2.9.9 for ABG probe. 3.2.9.12 The control results shall be considered satisfactory if the limit of the main relative permissible error of measurement of photon-ionizing radiation DER when measured by the control unit, BG and ABG probes does not exceed 15 %. 3.2.10 The limit of the main relative permissible error of photon-ionizing radiation DER measurement is controlled as follows: 3.2.10.1 Switch on the dosimeter’s control unit, program the values of the DER...
- Page 105 Note. With positive results of controlling the limits of the main relative permissible error of measurements of surface flux density of beta- and alpha- particles, the control of the main relative permissible error limit of measurement of surface activity of beta- and alpha-emitting radionuclides is not carried out. This happens because surface flux density of beta-particles and surface activity of beta- emitting radionuclides, as well as surface flux density of alpha-particles and surface activity of alpha-emitting radionuclides are measured by the same detectors and the...
-
Page 106: Repair
4 REPAIR 4.1 Repair of the dosiemeter shall be done by the manufacturer. PE "SPPE "Sparing-Vist Center" 79026, Ukraine, Lviv, 33 Volodymyra Velykoho St. Tel.: +38 (032) 242-15-15, fax: +38 (032) 242-20-15. 5 STORAGE 5.1 Before the long-term storage of the dosimeter, remove the battery from the battery compartment (3.1 of this OM). -
Page 107: Shipping
6 SHIPPING 6.1 The packed dosimeters may be shipped by any kinds of closed transport vehicles in conformance with the rules and standards effective for each means of transport. When shipped by railway, air, sea, or motor transport at any distances in the packing of the producer enterprise the following rules should be met: - by railway: in clean closed cars;... -
Page 108: Annex А
ANNEX А 1 – Main relative permissible error limit 2 – Specified limits of statistical deviations (specified limits of expected relative statistical deviations of measurement result given 0.95 confidence probability) determined by the dosimeter. Figure А.1 – Dependence diagram of specified limits of statistical deviations from photon-ionizing radiation DER when measured by the control unit... - Page 109 1 – Time of statistical information accumulation required to obtain measurement results with estimated limits of statistical deviations equal to the specified limits of statistical deviations determined by the dosimeter. 2 – Time of statistical information accumulation required to obtain measurement results with specified limits of statistical deviations equal to the main relative permissible error limit.
- Page 110 1 – Main relative permissible error limit 2 – Specified limits of statistical deviations (specified limits of expected relative statistical deviations of measurement result given 0.95 confidence probability) determined by the dosimeter. Figure А.3 - Dependence diagram of specified limits of statistical deviations from photon-ionizing radiation DER when measured by BG probe...
- Page 111 1 – Time of statistical information accumulation required to obtain measurement results with estimated limits of statistical deviations equal to the specified limits of statistical deviations determined by the dosimeter. 2 – Time of statistical information accumulation required to obtain measurement results with estimated limits of statistical deviations equal to the main relative permissible error limit.
- Page 112 1 – Main relative permissible error limit 2 – Specified limits of statistical deviations (specified limits of expected relative statistical deviations of measurement result given 0.95 confidence probability) determined by the dosimeter. Figure А.5 - Dependence diagram of specified limits of statistical deviations from photon-ionizing radiation DER when measured by ABG probe...
- Page 113 1 – Time of statistical information accumulation required to obtain measurement results with statistical deviations equal to the statistical deviations determined by the dosimeter. 2 – Time of statistical information accumulation required to obtain measurement results with statistical deviations equal to the main relative permissible error limit. Figure А.6 - Dependence diagram of statistical information accumulation time required to obtain measurement results with estimated limits of statistical deviations equal to the main relative permissible error limit (1) and specified limits...
-
Page 114: Annex B
ANNEX B 1 – Main relative permissible error limit 2 – Specified limits of statistical deviations (specified limits of expected relative statistical deviations of measurement result given 0.95 confidence probability) determined by the dosimeter. Figure B.1 - Dependence diagram of specified limits of statistical deviations from surface beta-particles flux density when measured by BG probe... - Page 115 1 – Time of statistical information accumulation required to obtain measurement results with statistical deviations equal to specified statistical deviations determined by the dosimeter. 2 – Time of statistical information accumulation required to obtain measurement results with statistical deviations equal to the main relative permissible error limit. Figure B.2 - Dependence diagram of statistical information accumulation time required to obtain measurement results with estimated limits of statistical deviations equal to the main relative permissible error limit (1) and specified limits...
- Page 116 1 – Main relative permissible error limit 2 – Specified limits of statistical deviations (specified limits of expected relative statistical deviations of measurement result given 0.95 confidence probability) determined by the dosimeter. Figure B.3 - Dependence diagram of specified limits of statistical deviations from surface beta-particles flux density when measured by ABG probe...
- Page 117 1 – Time of statistical information accumulation required to obtain measurement results with statistical deviations equal to the specified statistical deviations determined by the dosimeter. 2 – Time of statistical information accumulation required to obtain measurement results with statistical deviations equal to the main relative permissible error limit. Figure B.4 - Dependence diagram of statistical information accumulation time required to obtain measurement results with estimated limits of statistical deviations equal to the main relative permissible error limit (1) and specified limits...
-
Page 118: Annex C
ANNEX C 1 – Main relative permissible error limit 2 – Specified limits of statistical deviations (specified limits of expected relative statistical deviations of measurement result given 0.95 confidence probability) determined by the dosimeter. Figure C.1 - Dependence diagram of specified limits of statistical deviations from surface alpha-particles flux density when measured by ABG probe... - Page 119 1 – Time of statistical information accumulation required to obtain measurement results with statistical deviations equal to the specified statistical deviations determined by the dosimeter. 2 – Time of statistical information accumulation required to obtain measurement results with statistical deviations equal to the main relative permissible error limit. Figure C.2 - Dependence diagram of statistical information accumulation time required to obtain measurement results with estimated limits of statistical deviations equal to the main relative permissible error limit (1) and specified limits...
Need help?
Do you have a question about the MKS-UM and is the answer not in the manual?
Questions and answers