
Related Manuals for Tenma 72-14520


Summary of Contents for Tenma 72-14520
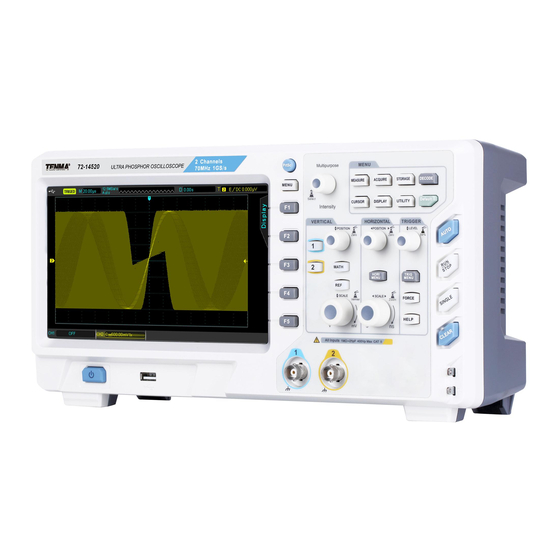
- Page 1 Digital Phosphor Storage Oscilloscope Model No. 72-14520, 72-14525, 72-14530 & 72-14535...
-
Page 2: Product Overview
When using electrical appliances, basic safety precautions should always be followed to reduce the risk of fire, electric shock and injury to persons or property. Read all instructions before using the appliance and retain for future reference. • This meter is designed to meet IEC61010-1, 61010-2-032, and 61010-2-033 in Pollution Degree 2, Measurement Category (CAT II 150V when switched to 1X and 300V CAT II when switched to 10X) and double Insulation. -
Page 3: Operating Parameters
OPERATING PARAMETERS • The oscilloscope also has high performance index and powerful functions required for faster measurements. • Faster signals can be observed with the oscilloscope via 1GS/s real‐time sampling. • Powerful trigger and analysis ability make it easier to capture and analyse waveforms. -
Page 4: Operation
OPERATION • Boot check • Power on the unit at the rear followed by the soft power button on the front panel. • The oscilloscope then run through a set on self test functions followed by the display screen showing. •... - Page 5 DISPLAY SETTING CONTROLS Vertical control panel • 1 2 3 4: open or close the four channels display. Model dependent. • MATH: Open the mathematical operations menu for add, subtract, multiply, divide, FFT, filtering, logic, and advanced operations. • REF: Recall previously stored reference waveforms, can compare currently measured waveform with reference waveforms.
-
Page 6: User Interface
Multi-purpose Control • Press the DISPLAY button and press F3 or F4 to select the brightness options, then use the control to adjust the brightness. • Press the control to confirm the setting. • During menu operations the control can be used to select various sub menu options, then press it again to confirm selection. - Page 7 USB Device Identification: This icon will be displayed when an USB storage device is connected. Trigger Status Identification: Include TRIGED (has been triggered), AUTO, READY, STOP, and ROLL (rolling) Timing Scale: Indicates the amount of time represented by one square, which can be adjusted by the horizontal scale control.
-
Page 8: Instrument Setup
INSTRUMENT SETUP Vertical system setup • The 2 analogue channels are CH1 and CH2, and for 4 channel models the channels are CH1 to CH4. Each channel should be set up individually. • Press CH1 to CH4 and the system will display the operation menu for that channel. •... - Page 9 • Press F1 to select GROUND. Both AC and DC quantities of the signal being measured are now intercepted. • The waveform is not displayed in this mode but the signal remains connected to the channel circuit. Channel bandwidth setup •...
- Page 10 Bias • When the amplitude of the DC component in the signal is relatively large, waveform observation could be very inconvenient. • Using the bias function and the superposition of a -10V bias voltage can eliminate the DC component of the waveform so the AC signal can be clearly observed. Setting up the Trigger system •...
-
Page 11: Forced Trigger
Normal Trigger - In this mode waveforms are only sampled when triggering conditions are met. The system stops acquiring data and waits when there is no trigger signal. When a trigger is generated, trigger scan occurs. Single Trigger - In this mode press RUN button once and the oscilloscope will wait for trigger. -
Page 12: Pulse Trigger
Pulse Trigger • Pulse trigger means determining the triggering time based on the pulse width. You can acquire abnormal pulse by setting the pulse width condition. • Press the TRIG MENU button then press F1 to select trigger type and then set the pulse width using the multi-purpose control. - Page 13 Functions Setup Notes Menu Type Video CH1 to CH4 Set Ch1 to CH4 as the signal source trigger signal EXT, EXT/5 Set the external trigger input channel as the signal source Trigger source trigger signal AC Line Set AC line as trigger Uses PAL format video signals Standard NTSC...
- Page 14 The slope of the low threshold level can be adjusted with the LEVEL control High The slope of the high threshold level can be adjusted with the Threshold LEVEL control High The slope of the high and low threshold level can be adjusted and Low with the LEVEL control Slew Rate = (High threshold level –...
- Page 15 • DATA SETTING: Rotate the knob under the bit setting interface to set the data. The upper and lower bounds of the data are directly related to the data bit width. ■ 5-bit corresponds to 0——31 ■ 6-bit corresponds to 0——63 ■...
- Page 16 • POLARITY: Set the signal polarity. • Normally, the positive polarity is used in RS232 protocol. The high level and low level stands for logic 1 and 0 respectively. Some users might use negative polarity, which is that the high level and low level stands for 0 and 1 respectively. Therefore, the design is optimized to meet demands from different users.
- Page 17 • Press the NEXT PAGE option key to enter the following settings: • VERTICAL POSITION: Press the VERTICAL POSITION option key and rotate the Multi-purpose control to adjust the position of decoding data on the screen. • EVENT LIST CHECK: When the Oscilloscope is in the state of decoding, the RUN/ STOP button is green.
- Page 18 • Press the SCLK EDGE button to set the clock source as rising edge or falling edge. • SDA: Select data source Press this option key and the present clock source font becomes green. Press the SDA button again to switch any channel among CH1-CH4 as clock source. The logic level can be adjusted when the corresponding signal source is selected.
- Page 19 Data Setting • Select this option to set the related data information. • BYTE: Set the data byte. Select this option and the data byte selection list pops up. Press the button again to switch between 1, 2, 3, 4, and 5 bytes. The multi-purpose control can also be used.
- Page 20 corresponding number of the present selected data. The selected decoding data will be highlighted green. The multi-purpose control can select any collected data. This function can find the content of captured multiple transmission communication and help to debug the system conveniently. •...
-
Page 21: Condition Setting
Start SPI Trigger • Press the DECODE button then press the TYPE option key to open protocol type list. Rotate Multi-purpose control to select the SPI mode. Press to confirm selection. • CS SETTING: Set Chip Selection Enable Signal Use this feature to enter the enable signal setting up interface. Press the CS SOURCE option button to switch any channel among CH1-CH4 as chip selection signal. - Page 22 • TRIGGER CHANNEL: Press the button to select comparative data channel and switch between MOSI and MISO. • FRAME LENGTH: The bit width of SPI communication is usually different due to the different situation. Now the Multi-purpose control can select the data bit of the decoding data switch either 4, 8, and 16.
- Page 23 OPERATION Set Level System • ROLL mode • When the trigger is in automatic mode and using the SCALE knob to adjust the horizontal level to slower than 50ms/div, and the oscilloscope will be in ROLL mode. At this point, the trigger system will not work, the oscilloscope will be continuous on the screen to draw the waveform of the voltage - time chart.
- Page 24 • Under the window scale mode the screen is divided into two display areas as the above picture shows. The upper part displays the original waveforms, which can move left and right through rotating the horizontal POSITIONAL control or can enlarge and reduce the selected areas through rotating the knob horizontal SCALE.
- Page 25 Trigger Release • Trigger release can observe complex waveforms (such as pulse series). • Release time is the time for the oscilloscope to re-enable the trigger. In the period of release and suppression, the oscilloscope will not be triggered. For example, a set of pulse series, which is required to trigger on the first pulse, can set the release time to the pulse width.
-
Page 26: Functions Menu
FFT spectrum analysis • Using FFT algorithm you can convert the domain signals (YT) into frequency domain signals. • With FFT you can observe the following types of signals: Measure the harmonic wave composition and distortion of the system. Demonstrate the noise characteristics of the DC power. Analyse oscillation. - Page 27 FFT Window Feature Most suitable measurement item Temporary or fast pulse. Signal level is The best frequency resolution, generally the same before and after. the worst amplitude resolution. Rectangle Equal sine wave of very similar frequency. Basically similar to a status There is broad-band random noise with without adding window.
- Page 28 Digital Filter • Press MATH button then F1 to enter the digital filter menu. Functions Menu Setup Notes Type Digital Filter Source CH1 to CH4 Set CH1 to CH4 for digital filter source Low pass Set filter to low pass Filter type High pass Set filter to high pass...
-
Page 29: Acquisition Mode
• Sampling rate refers to the time interval between two sampling points. The maximum sampling rate of the UPO2000CS series is 1 GS/s. • The sampling rate will be affected by the timing scale and the change of storage depth. UPO2000CS oscilloscopes sampling rate is displayed in real-time at the top of the screen in the status bar. - Page 30 High Resolution mode to minimize noise from small signal Average • In this acquisition mode, the oscilloscope obtains several waveforms and finds the average, and displays the final waveform. This method can reduce random noise. • By changing the acquisition mode settings, the resulting waveform display changes. •...
- Page 31 Functions Options Description Vector Using lines to display between samples Type Point Displays points directly Display level on time scale Display Lissajous graph of CH1~CH2 waveforms Format XY 1&2 Display Lissajous graph of CH3~CH4 waveforms (UPO2XX4CS XY 3&4 only) Close Displayed waveform refreshes at normal rate 100ms / 200ms...
- Page 32 Application of XY Mode • The phase difference between the two signals of the same frequency can be easily observed by Lissajous method. The following chart gives the observation of phase difference. • Since sinθ = A/B or C/D, theta (θ) is the angle between the two signals, the definition of A, B and C, D is shown above.
-
Page 33: Automatic Measurement
AUTOMATIC MEASUREMENT • Press the MEASURE button to enter the automatic measurement menu. Functions Options Description Signal source CH1 to CH4 Select the data source from any one of the channels Close all Parameters All parameters Pop-up window with all parameters is displayed Open/Close menu for user defined parameters. -
Page 34: Timing Parameters
Voltage Parameters • The following parameters can be measured automatically: Vmax: Voltage at the highest point with respect to GND Vmin: Voltage at the lowest point with respect to GND Vtop: Highest stable voltage Vbase: Lowest stable voltage Middle: Midpoint between highest and lowest stable voltage Vpp: Vmax –... - Page 35 User Defined Parameters • Press the MEASURE button to enter the automatic measurement menu. Then press the F1 key to select the source of the measurement. • The user defined parameter interface is accessed by pressing F4. User Defined Parameter Selection •...
-
Page 36: Cursor Measurement
CURSOR MEASUREMENT • The cursor can be used to measure the X axis (time) and the Y axis (voltage) of the selected waveform. Press the CURSOR button to enter the cursor measurement menu. Time Measurement • Press the CURSOR button to enter the cursor measurement menu. Then press the F1 key to select the type to measure. -
Page 37: Storage And Recall
• When the setting is set to trace mode with the F3 key, the multi-purpose control can adjust both AY and BY at the same time. • On the upper left corner of the display area, BY and AY are represented by the current position of the cursor BY and AY respectively. - Page 38 Waveform Storage and Recall • Press the STORAGE button to enter the storage setting menu. Then press the F1 key and select the type as waveform. Functions Options Description Waveform Type Storage Source CH0 to CH4 Select waveform storage source from any one of CH1~CH4 When Save is pressed, the waveform will be saved to the oscilloscope When Save is pressed, the waveform will be saved to a...
-
Page 39: Auxiliary Function Setting
• After callback, the Ref waveform will be displayed in the lower left corner, including timing scale and amplitude shift. At this point you can use the vertical and horizontal control knob to adjust the ref waveform’s position, time base, and amplitude shift. Screen Copy •... - Page 40 Waveform Recording • Press UTILITY button then F5 to enter the auxiliary function setting menu then press F1 to enter the wave recording menu. Functions Options Description Close Close the recording function Record Settings Enter the record settings menu Operation Enter the record operation menu •...
-
Page 41: System Upgrade
Functions Options Description Close Disable Pass Test Operation Open Enable Pass Test Stop setting Enters Stop Settings Menu Template setting CH1 to CH4 Enters Template Settings Menu Enter Pass Test menu • After opening the pass test, you are required to set the stop settings and template settings before you can perform the test function. -
Page 42: Other Function Keys
OTHER FUNCTION KEYS Automatic Setting • Automatic settings will according to the input signal, choose appropriate time base files, range profile, and triggering parameters so that the waveform automatically properly displays on the screen. • Press the AUTO key to enable automatic settings. •... -
Page 43: Troubleshooting
System Function Factory Setting Type Vector Format Display Duration Time 100ms Grid Brightness Waveform Brightness Storage Type Waveform Frequency Meter Measurements Off, Clears all measurements Cursor Other Systems Language Keep current Menu Display Manual Square wave output 1kHz Back-light brightness 100% Output selection Trigger... -
Page 44: Specification
0.001× 0.01× 0.1× 1× 10× 100× 1000× CATI 300 Vrms, CATII 100 Vrms Maximum input voltage Transient Overvoltage 1000 Vpk Time delay between channels 150ps (typical) Vertical Model 72-14535 72-14530 72-14525 72-14520 Bandwidth 100MHz 70MHz 100MHz 70MHz Rise Time (Typical) ≤3.5ns ≤5ns ≤3.5ns ≤5ns Channels... - Page 45 DC Gain Accuracy ≤±4% (Sampling or average sampling method) DC Offset accuracy ≤±4% (Sampling or average sampling method) Channel Separation DC to maximum bandwidth: >40 dB Horizontal 5ns/div ~ 50s/div (1-2-5 base) Timing Scale 2ns/div ~ 50s/div (1-2-5 base) (UPO2202CS) Timing Accuracy 1mV/div~20 V/div (1-2-5 base) Pre-trigger (Negative Delay): ≥1 Screen Width Post-trigger...
-
Page 46: Slope Trigger
Edge Trigger Edge type Rising, falling, any Pulse Width Trigger Pulse Condition >, <, = Polarity Positive, negative pulse width Pulse width range 4ns ~ 10s Slope Trigger Positive slope (greater than, less than, specified range) Slope Condition Negative slope (greater than, less than, specified range) Time Setup 8ns~10s Video Trigger... -
Page 47: Mathematical Operations
Mathematical Operations Waveform A+B, A-B, A×B, A/B, FFT, Logic Operation calculation FFT Window Type Rectangle, Hanning, Blackman, Hamming FFT Display Split screen; time base files can be adjusted independently FFT Vertical Scale Vrms, dBVrms Digital Filter Low pass, high pass, band pass Logical operation AND, OR, NOT, XOR Display... -
Page 48: Maintenance
MAINTENANCE Cleaning • Periodically wipe the case with damp cloth and mild detergent. Do not use abrasives or solvents for cleaning. Disconnect from the mains first. • Clean the measurement probe tips occasionally, as dirt on the probes can affect reading accuracy.
Need help?
Do you have a question about the 72-14520 and is the answer not in the manual?
Questions and answers