Sign In
Upload
Download
Table of Contents
Contents
Add to my manuals
Delete from my manuals
Share
URL of this page:
HTML Link:
Bookmark this page
Add
Manual will be automatically added to "My Manuals"
Print this page
×
Bookmark added
×
Added to my manuals
Manuals
Brands
Tenma Manuals
Test Equipment
72-9355
Manual
Tenma 72-9355 Manual
Digital storage oscilloscope
Hide thumbs
1
2
3
4
5
6
7
8
9
10
11
12
13
14
15
16
17
18
19
20
21
22
23
24
25
26
27
28
Table Of Contents
29
page
of
29
Go
/
29
Contents
Table of Contents
Troubleshooting
Bookmarks
Table of Contents
Product Overview
What's Included
Operating Parameters
Controls and Connections
Operation
Using the Autoset Function
Vertical Control
Horizontal Control
Instrument Setup
Resetting the Instrument
Setting Channel Coupling
Pulse Trigger
Functions Menu
Alternate Trigger
Auto Setup
Multimeter Measurement
Definitions of System Prompts
Troubleshooting
Specification
Edge Trigger
Video Trigger
Interface Functions
Digital Multimeter
Power Source
Maintenance
Advertisement
Quick Links
1
Power Source
Download this manual
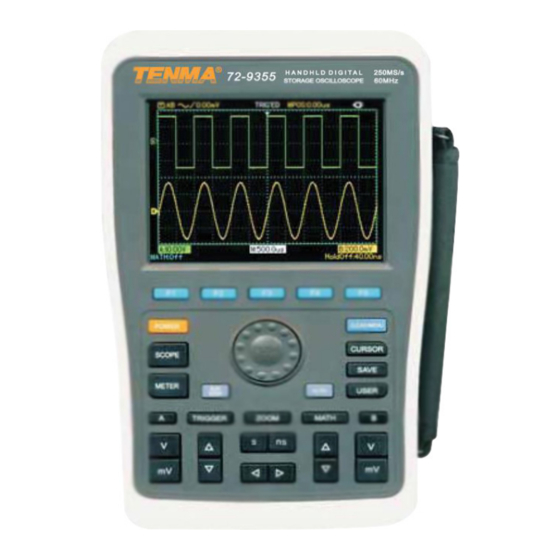
Digital Storage Oscilloscope
Model No. 72-9355, 72-9360 & 72-9365
1
Table of
Contents
Previous
Page
Next
Page
1
2
3
4
5
Advertisement
Table of Contents
Need help?
Do you have a question about the 72-9355 and is the answer not in the manual?
Ask a question
Questions and answers
Related Manuals for Tenma 72-9355
Test Equipment Tenma 72-9405 Quick Start Manual
Digital insulation resistance tester (8 pages)
Test Equipment Tenma 72-9360 Manual
Digital storage oscilloscope (29 pages)
Test Equipment Tenma 72-9966 Quick Start Manual
Cable tester (4 pages)
Test Equipment Tenma 72-9400A User Manual
Insulation resistance tester (6 pages)
Test Equipment Tenma 72-10175 User Manual
Digital oscilloscope (107 pages)
Test Equipment Tenma 72-6802 User Manual
30mhz dual trace oscilloscope (21 pages)
Test Equipment Tenma 72-8710 Operating Manual
Digital storage oscilloscope (94 pages)
Test Equipment Tenma 72-8705 Operating Manual
Digital storage oscilloscope (94 pages)
Test Equipment Tenma 72-2650 User Manual
Digital storage oscilloscope (29 pages)
Test Equipment Tenma 72-2650 Operating Manual
Digital storage oscilloscope (75 pages)
Test Equipment Tenma 72-3575 Manual
Voltage & continuity tester (12 pages)
Test Equipment Tenma 72-3580 Manual
Voltage & continuity tester (12 pages)
Test Equipment Tenma 72-6947 Instruction Manual
Audio impedance tester (8 pages)
Test Equipment Tenma 72-7630 Instructions Manual
4 channel digital storage oscilloscope (32 pages)
Test Equipment Tenma 72-7985 Manual
Hdtv + pc video pattern generator (11 pages)
Test Equipment Tenma 72-3565 Manual
Multifunction voltage tester (8 pages)
This manual is also suitable for:
72-9360
72-9365
640522695713
Table of Contents
Print
Rename the bookmark
Delete bookmark?
Delete from my manuals?
Login
Sign In
OR
Sign in with Facebook
Sign in with Google
Upload manual
Upload from disk
Upload from URL


Need help?
Do you have a question about the 72-9355 and is the answer not in the manual?
Questions and answers