Table of Contents
Advertisement
Quick Links
Advertisement
Table of Contents

Related Manuals for Keysight M9290A


Summary of Contents for Keysight M9290A
- Page 1 Keysight M9290A CXA-m PXIe Signal Analyzer Notice: This document contains references to Agilent. Please note that Agilent’s Test and Measurement business has become Keysight Technologies. For more information, go to www.keysight.com. Specification Guide...
- Page 2 CAUTION notice until the indicated Chengdu, 610041, China OF THIS DOCUMENT OR ANY INFORMA- conditions are fully understood and TION CONTAINED HEREIN. SHOULD KEYSIGHT AND THE USER HAVE A SEP- met. ARATE WRITTEN AGREEMENT WITH WARRANTY TERMS COVERING THE MATERIAL IN THIS DOCUMENT THAT...
- Page 3 Documentation is updated periodically. For the latest information about this analyzer, including firmware upgrades, application information, and product information, see the following URL: http://www.keysight.com/find/cxa-m To receive the latest updates by email, subscribe to Keysight Email Updates: http://www.keysight.com/find/emailupdates Information on preventing analyzer damage can be found at: http://www.keysight.com/find/PreventingInstrumentRepair...
-
Page 5: Table Of Contents
Contents 1. Keysight M9290A CXA-m PXIe Signal Analyzer Definitions and Requirements............10 Definitions . - Page 6 Contents Spectrum Emission Mask ............42 Options .
- Page 7 Contents Post-Demodulation............. . . 80 Frequency Modulation .
- Page 8 Contents...
-
Page 9: Keysight M9290A Cxa-M Pxie Signal Analyzer
Keysight M9290A CXA-m PXIe Signal Analyzer This chapter contains the specifications for the core signal analyzer. The specifications and characteristics for the measurement applications and options are covered in the chapters that follow. -
Page 10: Definitions And Requirements
Recommended Best Practices In Use • Use slot blockers and EMC filter panels in empty module slots to ensure proper operating temeraptures. Keysight chassis and slot blockers optimize module temerature performance and reliability of test. • Set chassis fan to high at environmental temeratures above 45°C. -
Page 11: Certification
Certification Keysight Technologies certifies that this product met its published specifications at the time of shipment from the factory. Keysight Technologies further certifies that its calibration measurements are traceable to the United States National Institute of Standards and Technology, to the extent allowed by the Institute’s calibration facility, and to the calibration facilities of other International Standards... -
Page 12: Frequency And Time
Frequency and Time Description Specifications Supplemental Information Frequency Range Maximum Frequency Option F03 3.0 GHz Option F07 7.5 GHz Option F13 13.6 GHz Option F26 26.5 GHz Preamp Option P03 3.0 GHz Preamp Option P07 7.5 GHz Preamp Option P13 13.6 GHz Preamp Option P26 26.5 GHz... -
Page 13: Standard Frequency Reference
b. In the band overlap regions, for example, 2.95 to 7.5 GHz, the analyzer may use either band for measurements, in this example Band 0 or Band 1. The analyzer gives preference to the band with the better overall specifications, but will choose the other band if doing so is necessary to achieve a sweep having minimum band crossings. -
Page 14: Precision Frequency Reference
Description Specifications Supplemental Information Precision Frequency Reference (Option PFR) [(time since last adjustment Accuracy aging rate) + temperature stability + calibration accuracy Temperature Stability 8 1.5 10 20 to 30C 8 Full temperature range 5 10 10 5 ... -
Page 15: Frequency Readout Accuracy
> 750 MHz. In most cases, the frequency readout accuracy of the analyzer can be exceptionally good. As an example, Keysight has characterized the accuracy of a span commonly used for Electro-Magnetic Compatibility (EMC) testing using a source frequency locked to the analyzer. -
Page 16: Frequency Span
Description Specifications Supplemental Information Frequency Span Range Option F03 0 Hz, 10 Hz to 3 GHz Option F07 0 Hz, 10 Hz to 7.5 GHz Option F13 0 Hz, 10 Hz to 13.6 GHz Option F26 0 Hz, 10 Hz to 26.5 GHz Resolution 2 Hz Span Accuracy... -
Page 17: Triggers
Description Specifications Supplemental Information Triggers Additional information on some of the triggers and gate sources Video Independent of Display Scaling and Reference Level 170 dBm Minimum settable level Useful range limited by noise Maximum usable level Highest allowed mixer level + 2 dB (nominal) Detector and Sweep Type relationships... -
Page 18: Gated Sweep
Description Specifications Supplemental Information Gated Sweep Gate Methods Gated LO Gated Video Gated FFT Span Range Any span Gate Delay Range 0 to 100.0 s 4 digits, 100 ns Gate Delay Settability Gate Delay Jitter 33.3 ns p-p (nominal) Gate Length Range 100.0 ns to 5.0 s Gate length for the FFT method is fixed at... -
Page 19: Resolution Bandwidth (Rbw)
Description Specifications Supplemental Information Resolution Bandwidth (RBW) Range (3.01 dB bandwidth) 1 Hz to 8 MHz Bandwidths above 3 MHz are 4, 5, 6, and 8 MHz. Bandwidths 1 Hz to 3 MHz are spaced at 10% spacing using the E24 series (24 per decade): 1.0, 1.1, 1.2, 1.3, 1.5, 1.6, 1.8, 2.0, 2.2, 2.4, 2.7, 3.0, 3.3, 3.6, 3.9, 4.3, 4.7, 5.1, 5.6, 6.2, 6.8, 7.5, 8.2, 9.1 in each decade. -
Page 20: Analysis Bandwidth
Description Specification Supplemental information Analysis Bandwidth Standard 10 MHz With Option B25 25 MHz Analysis bandwidth is the instantaneous bandwidth available around a center frequency over which the input signal can be digitized for further analysis or processing in the time, frequency, or modulation domain. Description Specifications Supplemental Information... -
Page 21: Amplitude Accuracy And Range
Amplitude Accuracy and Range Description Specifications Supplemental Information Measurement Range Preamp Off 100 kHz to 1 MHz Displayed Average Noise Level to +20 dBm 1 MHz to 26.5 GHz Displayed Average Noise Level to +30 dBm Preamp On 100 kHz to 26.5 GHz Displayed Average Noise Level to +23 dBm Input Attenuation Range Standard... -
Page 22: Marker Readout
Reference level and off-screen performance: The reference level (RL) behavior differs from previous analyzers (except PSA) in a way that makes the Keysight CXA-m Signal Analyzer more flexible. In previous analyzers, the RL controlled how the measurement was performed as well as how it was displayed. Because the logarithmic amplifier in previous analyzers had both range and resolution limitations, this behavior was necessary for optimum measurement accuracy. -
Page 23: If Phase Linearity
Description Specifications Supplemental Information (Demodulation and FFT response relative to the center frequency) Center Analysis Max Error Midwidth Error Slope (dB/MHz) Freq (GHz) Width (MHz) (Exception (95th Percentile) (95th Percentile) (nominal) 3.0 10 0.40 dB 0.12 dB 0.10 0.03 dB 3.0, 26.5 10 0.1 dB... -
Page 24: Absolute Amplitude Accuracy
Description Specifications Supplemental Information Absolute Amplitude Accuracy At 50 MHz 0.40 dB 0.34 dB (95th percentile) 20 to 30C 0.22 dB (Typical) 0.45 dB 0 to 55C At all frequencies (0.40 dB + frequency response) 20 to 30C (0.45 dB + frequency response) 0 to 55C 95th Percentile Absolute Amplitude Accuracy... -
Page 25: Resolution Bandwidth Switching Uncertainty
Description Specifications Supplemental Information RF Input VSWR Nominal (Input attenuation 10 dB, 50 MHz) 1.1:1 Input Attenuation 10 dB Frequency 10 MHz to 3.0 GHz < 1.2:1 (nominal) 3.0 to 7.5 GHz < 1.4:1 (nominal) 7.5 to 13.6 GHz <... -
Page 26: Reference Level
Description Specifications Supplemental Information Reference Level Range 170 to +23 dBm in 0.01 dB steps Log Units Linear Units 707 pV to 3.16 V with 0.01 dB resolution (0.11) Accuracy 0 dB a. Because reference level affects only the display, not the measurement, it causes no additional error in measurement results from trace data or markers. -
Page 27: Available Detectors
b. The scale fidelity is warranted with ADC dither set to Medium. Dither increases the noise level by nominally only 0.24 dB for the most sensitive case (preamp Off, best DANL frequencies). With dither Off, scale fidelity for low level signals, around 60 dBm or lower, will nominally degrade by 0.2 dB. -
Page 28: Dynamic Range
Dynamic Range Gain Compression Description Specifications Supplemental Information 1 dB Gain Compression Point Maximum power at mixer (Two-tone) 10 kHz to 7.5 GHz +6.00 dBm (nominal) 7.5 to 26.5 GHz +4.00 dBm (nominal) Large signals, even at frequencies not shown on the screen, can cause the analyzer to incorrectly measure on-screen signals because of two-tone gain compression. -
Page 29: Displayed Average Noise Level
Displayed Average Noise Level Description Specifications Supplemental Information Displayed Average Noise Input terminated Refer to the footnote for Sample or Average detector "Band Overlaps" on page 12 Level (DANL) Averaging type = Log 0 dB input attenuation IF Gain = High 1 Hz Resolution Bandwidth 20 to 30C Full range... -
Page 30: Spurious Response
Spurious Response Description Specifications Supplemental Information Spurious Response (See "Band Overlaps" on page 12 Residual Responses Preamp Off 90 dBm 200 kHz to 26.5 GHz (swept) 100 dBm (nominal) Zero span or FFT or other frequencies Image Responses Tuned Freq (f) Excitation Freq Mixer Level Response... -
Page 31: Second Harmonic Distortion
The stop frequency varies according to the option F03/F07/F13/F26 selected. The spurious response specifications only apply with the preamp turned off. When the preamp is turned on, performance is nominally the same as long as the mixer level is interpreted to be: Mixer Level = Input Level Input Attenuation ... - Page 32 Nominal Dynamic Range at 1 GHz [Plot] Nominal Dynamic Range Band 1-10 [Plot]...
- Page 33 Nominal Dynamic Range vs. Offset Frequency vs. RBW [Plot] (dBc) -100 -120 -140 1,000 10,000 100,000 1,000,000 10,000,000 Offset (Hz) Conditions: CF = 600 MHz; Mixer Level = ‐10 dBm; Average Type = Log Nominal TOI vs. Mixer Level and Tone Separation [Plot]...
-
Page 34: Phase Noise
Phase Noise Description Specifications Supplemental Information Phase Noise Noise Sidebands (Center Frequency = 1 GHz, Best-case Optimization Internal Reference Offset Frequency 20 to 30C Full range Typical 100 Hz –90 dBc/Hz (nominal) 1 kHz –102 dBc/Hz –100 dBc/Hz –105 dBc/Hz 10 kHz –106 dBc/Hz –105 dBc/Hz... - Page 35 Nominal Phase Noise at Different Center Frequencies for Option < F26...
-
Page 36: Power Suite Measurements
Power Suite Measurements Description Specifications Supplemental Information Channel Power Amplitude Accuracy Amplitude Accuracy + Power Bandwidth Accuracy Case: Radio Std = 3GPP W-CDMA, or IS-95 0.62 dB (95th percentile) 1.23 dB Absolute Power Accuracy (20 to 30C, Attenuation = 10 dB) a. -
Page 37: Adjacent Channel Power (Acp)
Description Specifications Supplemental Information Adjacent Channel Power (ACP) Case: Radio Std = None Accuracy of ACP Ratio (dBc) Display Scale Fidelity Accuracy of ACP Absolute Power Absolute Amplitude Accuracy (dBm or dBm/Hz) Power Bandwidth Accuracy Absolute Amplitude Accuracy + Accuracy of Carrier Power (dBm), or Power Bandwidth Accuracy Carrier Power PSD (dBm/Hz) 3 dB... - Page 38 “typical” specification; the factory test line limit is set commensurate with an on-going 80 yield to this typical. The ACPR dynamic range is verified only at 2 GHz, where Keysight has the near-perfect signal available. The dynamic range is specified for the optimum mixer drive level, which is different in different instruments and different conditions.
- Page 39 Description Specifications Supplemental Information Case: Radio Std = IS-95 or J-STD-008 Method RBW method ACPR Relative Accuracy 0.19 dB Offsets < 750 kHz 0.20 dB Offsets > 1.98 MHz a. The RBW method measures the power in the adjacent channels within the defined resolution bandwidth. The noise bandwidth of the RBW filter is nominally 1.055 times the 3.01 dB bandwidth.
-
Page 40: Power Statistics Ccdf
Description Specifications Supplemental Information Power Statistics CCDF Histogram Resolution 0.01 dB The Complementary Cumulative Distribution Function (CCDF) is a reformatting of a histogram of the power envelope. The width of the amplitude bins used by the histogram is the histogram resolution. The resolution of the CCDF will be the same as the width of those bins. -
Page 41: Spectrum Emission Mask
Description Specifications Supplemental Information Spectrum Emission Mask Table-driven spurious signals; measurement near carriers Case: Radio Std = cdma2000 Dynamic Range, relative 73.0 dB 78.1 dB (typical) (750 kHz offset 99.7 dBm 102.7 dBm (typical) Sensitivity, absolute (750 kHz offset Accuracy (750 kHz offset) 0.11 dB Relative... -
Page 42: Options
Options The following options and applications affect instrument specifications. Option F03: Frequency range, 10 Hz to 3 GHz Option F07: Frequency range, 10 Hz to 7.5 GHz Option F13: Frequency range, 10 Hz to 13.6 GHz Option F26: Frequency range, 10 Hz to 26.5 GHz Option B25: Analysis Bandwidth, 25 MHz Option EDP:... -
Page 43: General
— AS/NZS CISPR 11 — ICES/NMB-001 This ISM device complies with Canadian ICES-001. Cet appareil ISM est conforme a la norme NMB-001 du Canada. The M9290A is in full compliance with CISPR 11, Class A emission limits and is declared as such. - Page 44 Description Specification Supplemental Information Power Requirements 65 W Power Consumption Drawn from chassis Description Supplemental Information Nominal Measurement Speed Local measurement and display update rate 11 ms (90/s) Remote measurement and LAN transfer rate 6 ms (167/s) Marker Peak Search 5 ms Center Frequency Tune and Transfer 22 ms...
-
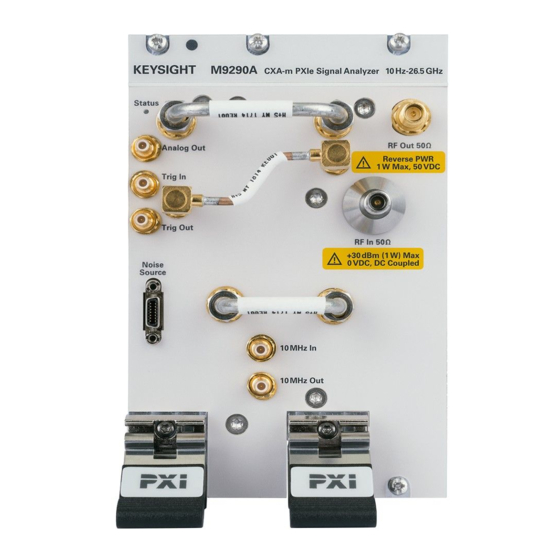
Page 45: Inputs/Outputs
Inputs/Outputs Description Specifications Supplemental Information RF In Connector Standard 3.5 mm female Impedance 50 (nominal) Description Specifications Supplemental Information 10 MHz Out Connector SMB male Impedance 50 (nominal) 0 dBm (nominal) Output Amplitude 10 MHz (1 + frequency Frequency reference accuracy) Description... - Page 46 Trigger Out Connector SMB male Impedance 50 (nominal) Level 5 V TTL Description Specifications Supplemental Information Analog Out Connector SMB male Impedance 50 (nominal) Description Specifications Supplemental Information Noise Source For use with Keysight 346 and SNS Series noise sources...
-
Page 47: Regulatory Information
(Reference WEEE Directive 2002/96/EC). To return unwanted products, contact your local Keysight office. Indicates the time period during which no hazardous or toxic substance elements are expected to leak or deteriorate during normal use. Forty years is the expected useful life of the product. -
Page 48: Declaration Of Conformity
Declaration of Conformity A copy of the Manufacturer’s European Declaration of Conformity for this instrument can be found at the following website: http://regulations.about.keysight.com/DoC/search.htm... -
Page 49: I/Q Analyzer
I/Q Analyzer This chapter contains specifications for the I/Q Analyzer measurement application (Basic Mode). -
Page 50: Specifications Affected By I/Q Analyzer
Specifications Affected by I/Q Analyzer Specification Name Information Number of Frequency Display Trace Does not apply. Points (buckets) Resolution Bandwidth specifications in this chapter. Frequency Video Bandwidth Not available. Clipping-to-Noise Dynamic Range Clipping-to-Noise Dynamic Range specifications in this chapter. Resolution Bandwidth Switching Not specified because it is negligible. -
Page 51: Frequency
Frequency Supplemental Description Specifications Information Frequency Span 10 Hz to 10 MHz Standard instrument 10 Hz to 25 MHz Option B25 Resolution Bandwidth (Spectrum Measurement) Range Overall 100 mHz to 3 MHz Span = 1 MHz 50 Hz to 1 MHz Span = 10 kHz 1 Hz to 10 kHz Span = 100 Hz... -
Page 52: Clipping-To-Noise Dynamic Range
Clipping-to-Noise Dynamic Range Description Specifications Supplemental Information Clipping-to-Noise Dynamic Range Excluding residuals and spurious responses Center frequency 20 MHz Clipping Level at Mixer 12 dBm (nominal) IF Gain = Low 22 dBm (nominal) IF Gain = High Noise Density at Mixer DANL + 2.25 dB at center frequency... -
Page 53: Data Acquisition
Data Acquisition Description Specifications Supplemental Information Time Record Length Complex Spectrum 131,072 samples (max) Res BW = 540 Hz for 10 MHz (standard) span 4,000,000 samples 335 ms at Waveform 4,000,000 samples (max) 10 MHz span Sample Rate 30 MSa/s for 10 MHz (standard) span ADC Resolution 16 Bits 10 MHz (standard) span... - Page 55 Options T03, T07, T13 and T26 - Tracking Generators This chapter contains specifications for the Option T03, T07, T13 and T26 tracking generator.
- Page 56 General Specifications Description Specifications Supplemental Information Output Frequency Range Option T03 2 MHz to 3 GHz Option T07 2 MHz to 7.5 GHz Option T13 2 MHz to 13.6 GHz Option T26 2 MHz to 26.5 GHz Description Specifications Supplemental Information Frequency Resolution 10 Hz Description...
- Page 57 Description Specifications Supplemental Information Level Accuracy Nominal 0.8 dB 2 MHz to 7.5 GHz 0.9 dB 7.5 to 13.6 GHz 1.5 dB 13.6 to 23 GHz 1.8 dB 23 to 26 GHz 2.9 dB 26 to 26.5 GHz Description Specifications Supplemental Information Maximum Safe Reverse Level 30 dBm (1 W)
- Page 58 Description Specifications Supplemental Information Spurious Outputs (Maximum output) Nominal 14 dBc 2nd Harmonic Spurs 9 dBc 3rd Harmonic Spurs Description Specifications Supplemental Information RF Power-Off Residuals < 90 dBm (nominal) 2 MHz to 26 GHz Description Specifications Supplemental Information Output VSWR Nominal 2 MHz to 7 GHz <...
-
Page 59: Option Emc - Precompliance Emi Features
Option EMC - Precompliance EMI Features This chapter contains specifications for the Option EMC precompliance EMI feature. -
Page 60: Frequency
Frequency Description Specifications Supplemental information Frequency Range 9 kHz to 3.0, 7.5, 13.6, 26.5 GHz depending on the frequency options. EMI Resolution Bandwidths Table 4-1 Table 4-2 CISPR Available when the EMC Standard is CISPR 6 dB bandwidths, subject to masks; meets 200 Hz, 9 kHz, 120 kHz, 1 MHz CISPR standard 6 dB bandwidths... -
Page 61: Amplitude
Amplitude Description Specifications Supplemental Information EMI Average Detector Used for CISPR-compliant average measurements and, with 1 MHz RBW, for frequencies above 1 GHz Default Average Type All filtering is done on the linear (voltage) scale even when the display scale is log. Quasi-Peak Detector Used with CISPR-compliant RBWs, for frequencies ... -
Page 63: Option B25 (25 Mhz) - Analysis Bandwidth
Option B25 (25 MHz) - Analysis Band wid th This chapter contains specifications for the Option B25 (25 MHz) Analysis Bandwidth, and are unique to this IF Path. -
Page 64: Specifications Affected By Analysis Bandwidth
Specifications Affected by Analysis Band wid th The specifications in this chapter apply when the 25 MHz path is in use. In IQ Analyzer, this will occur when the IF Path is set to 25 MHz, whether by Auto selection (depending on Span) or manually. Specification Name Information IF Frequency Response... -
Page 65: Other Analysis Bandwidth Specifications
Other Analysis Bandwidth Specifications Specifi Supplemental Description cation Information IF Spurious Response Preamp Off IF Second Harmonic Apparent Freq Excitation Freq Mixer Level IF Gain 15 dBm 50 dBc (nominal) Any on-screen f (f + f + 22.5)/2 25 dBm 50 dBc (nominal) High IF Conversion Image... -
Page 66: If Frequency Response
Description Specifications Supplemental Information IF Frequency Response (Demodulation and FFT response relative to the center frequency) Center Freq Analysis Max Error Midwidth Error Slope (dB/MHz) (GHz) Width (MHz) (Exceptions (95th Percentile) (95th Percentile) (nominal) 3.0 0.45 dB 0.12 dB 0.1 10 to25 0.03 dB >3.0, 26.5... -
Page 67: Full Scale (Adc Clipping)
Description Specifications Supplemental Information Full Scale (ADC Clipping) Default settings, signal at CF (IF Gain = Low) Band 0 7 dBm mixer level (nominal) Band 1 through 4 –6 dBm mixer level (nominal) High Gain setting, signal at CF (IF Gain = High) Band 0 –17 dBm mixer level... -
Page 68: Data Acquisition
Data Acquisition Description Specifications Supplemental Information Time Record Length ResBW 1.3 kHz for 25 MHz span Complex Spectrum 131,072 samples (max) 4,000,000 samples 88.89 ms at 25 MHz Waveform 4,000,000 samples (max) span Sample Rate 100 MSa/s (ADC Samples) 90 MSa/s (IF Samples) ADC Resolution 16 bits... -
Page 69: Option P03, P07, P13 And P26 - Preamplifiers
Option P03, P07, P13 and P26 - Preamplifiers This chapter contains specifications for the CXA-m Signal Analyzer Options P03, P07, P13 and P26 preamplifiers. -
Page 70: Specifications Affected By Preamp
Specifications Affected by Preamp Specification Name Information Frequency Range "Frequency Range" on page 12 of the core specifications. Nominal Dynamic Range vs. The graphic from the core specifications does not apply with Preamp On. Offset Frequency vs. RBW Measurement Range The measurement range depends on DANL. -
Page 71: Other Preamp Specifications
Other Preamp Specifications Description Specifications Supplemental Information Preamplifier (Option P03, P07, P13, P26) Gain Maximum 20 dB (nominal) 100 kHz to 26.5 GHz Noise figure 100 kHz to 26.5 GHz Noise Figure is DANL + 176.24 dB (nominal) Note on DC coupling Nominally, the noise figure of the spectrum analyzer is given by NF = D . -
Page 72: Db Gain Compression Point (Two-Tone)
Description Specifications Supplemental Information 1 dB Gain Compression Point (Two-tone) (Preamp On (Option P03, P07, P13, P26) Maximum power at the preamp for 1 dB gain compression) 10 to 50 MHz -15 dBm (nominal) 50 MHz to 26.5 GHz -19 dBm (nominal) Large signals, even at frequencies not shown on the screen, can cause the analyzer to incorrectly measure on-screen signals because of two-tone gain compression. -
Page 73: Displayed Average Noise Level (Danl) Preamp On
Description Specifications Supplemental Information Displayed Average Noise Level Input terminated Refer to the footnote for Sample or Average detector "Band Overlaps" on (DANL) Preamp On Averaging type = Log page 12 0 dB input attenuation IF Gain = High 1 Hz Resolution Bandwidth Option P03, P07, P13, P26 20 to 30C Full range... - Page 74 Description Specifications Supplemental Information Frequency Response – Preamp On (Option P03, P07, P13, P26) (Maximum error relative to reference condition (50 MHz) Swept operation Attenuation 0 dB) 95th Percentile 0.5 dB 9 kHz to 10 MHz 1.0 dB 10 MHz to 3 GHz 1.2 dB 3 to 7.5 GHz 1.2 dB...
-
Page 75: Option Paa - Precision Accuracy Amplitude Feature
Option PAA - Precision Accuracy Amplitude Feature This chapter contains specifications for the Option PAA, Precision Accuracy Amplitude feature. -
Page 76: Amplitude
Amplitude Description Specifications Supplemental Information Absolute Amplitude Accuracy (Input level: -10 to -50 dBm RBW: 1 Hz to 3 MHz) Preamp Off (10 dB Attenuation) 20 to 30C Full range Typical 0.70 dB 0.80 dB 0.31 dB 9 kHz to 10 MHz 0.85 dB 1.00 dB 0.40 dB... -
Page 77: Options Pfr - Precision Frequency Reference
Options PFR - Precision Frequency Reference This chapter contains specifications for the Option PFR Precision Frequency Reference. -
Page 78: Specifications Affected By Precision Frequency Reference
Specifications Affected by Precision Frequency Reference Specification Name Information Frequency Range "Precision Frequency Reference" on page 13 of the core specifications. -
Page 79: Analog Demodulation Measurement Application
Analog Demod ulation Measurement Application This chapter contains specifications for the N9063A Analog Demodulation Measurement Application. Add itional Definitions and Requirements The warranted specifications shown apply to Band 0 operation (up to 3.0 GHz), unless otherwise noted, for all analyzer’s. The application functions, with nominal (non-warranted) performance, at any frequency within the frequency range set by the analyzer frequency options (see table). - Page 80 ------------------------ - Where SNR is the Signal-to-Noise Ratio. The approximation is per the implementations defined with the HP/Keysight 8903A. must be limited to the bandwidth of the applied filters. NOTE Noise The harmonic sequence is limited to the 10 harmonic unless otherwise indicated.
-
Page 81: Rf Carrier Frequency And Bandwidth
RF Carrier Frequency and Band wid th Description Specifications Supplemental Information Carrier Frequency Maximum Frequency Option F03 3.0 GHz RF/mW frequency option Option F07 7.5 GHz RF/mW frequency option Option F13 13.6 GHz RF/mW frequency option Option F26 26.5 GHz RF/mW frequency option Minimum Frequency AC Coupled... -
Page 82: Post-Demodulation
Post-Demod ulation Description Specifications Supplemental Information 1/2 Channel BW Maximum Audio Frequency Span Filters High Pass 20 Hz 2-Pole Butterworth 50 Hz 2-Pole Butterworth 300 Hz 2-Pole Butterworth 400 Hz 10-Pole Butterworth; used to attenuate sub-audible\ signaling tones 300 Hz 5-Pole Butterworth Low Pass 3 kHz... - Page 83 QPD if the input signal is bursty, clicky, or impulsive; or contains non-harmonically related tones (multi-tone, intermods, spurs) above the noise level. Use the AF Spectrum trace to vali- date these assumptions. Consider using Keysight U8903A Audio Analyzer if true QPD is required.
-
Page 84: Frequency Modulation
Frequency Mod ulation Conditions required to meet specification : 200 Hz • Peak deviation • Modulation index (ModIndex) =PeakDeviation/Rate = Beta: 0.2 to 2000 1 MHz • Channel BW: • Rate: 20 Hz to 50 kHz • SINAD bandwidth: (Channel BW) / 2 •... - Page 85 Frequency Mod ulation Description Specifications Supplemental Information Post-Demod Distortion Residual 0.30% (nominal) Distortion (SINAD) 0.4%/(ModIndex) (nominal) Post-Demod Distortion Accuracy (Rate: 1 to 10 kHz, ModIndex: 0.2 to10) 2 Reading DistResidual) Distortion (SINAD) (nominal) 2 Reading DistResidual) (nominal) Distortion Measurement Range Distortion (SINAD) Residual to 100% (nominal)
-
Page 86: Amplitude Modulation
Amplitude Mod ulation Conditions required to meet specification • Depth: 1% to 99% 1 MHz • Channel BW: • Rate: 50 Hz to 100 kHz • SINAD bandwidth: (Channel BW) / 2 • Single tone - sinusoid modulation Description Specifications Supplemental Information 0.2... - Page 87 Amplitude Mod ulation Description Specifications Supplemental Information Post-Demod Distortion Residual 0.3 (nominal) Distortion (SINAD) 0.16 (nominal) Post-Demod Distortion Accuracy (Depth: 5 to 90 Rate: 1 to 10 kHz) 1 Reading DistResidual) (nominal) Distortion (SINAD) 1 Reading DistResidual) (nominal) Distortion Measurement Range Residual to 100(nominal) Distortion (SINAD)
-
Page 88: Phase Modulation
Phase Mod ulation Conditions erquired to meet specification • Peak deviation : 0.2 to 100 rad 1 MHz • Channel BW: • Rate: 20 Hz to 50 kHz • SINAD bandwidth: (Channel BW) / 2 • Single tone - sinusoid modulation Description Specifications Supplemental Information... - Page 89 Phase Mod ulation Description Specifications Supplemental Information Post-Demod Distortion Residual Distortion (SINAD) 0.8 (nominal) 0.1 (nominal) Post-Demod Distortion Accuracy (Rate: 1 to 10 kHz, Deviation: 0.2 to 100 rad) 2 Reading DistResidual) Distortion (SINAD) 2 Reading DistResidual) Distortion Measurement Range Residual to 100(nominal) Distortion (SINAD)
-
Page 90: Analog Out
Analog Out The "Analog Out" connector (SMB) is located at the analyzer’s front panel. It is a multi-purpose output, whose function depends on options and operating mode (active application). When the N9063A Analog Demod application is active, this output carries a voltage waveform reconstructed by a real-time hardware demodulator (designed to drive the "Demod to Speaker"... -
Page 91: Fm Stereo/Radio Data System (Rds) Measurements
FM Stereo/Rad io Data System (RDS) Measurements Description Specifications Supplemental Information FM Stereo Modulation Analysis Measurements MPX view RF Spectrum, AF Spectrum, Demod MPX consists of FM signal multiplexing waveform, FM Deviation (Hz) (Peak+, with the mono signal (L+R), stereo signal Peak-, (Pk-Pk)/2, RMS), Carrier Power (L–R), pilot signal (at 19 kHz), and (dBm), Carrier Frequency Error (Hz),... - Page 92 Description Specifications Supplemental Information FM Stereo Modulation FM Stereo with 67.5 kHz audio Analysis Specification deviation at 1 kHz modulation rate plus 6.75 kHz pilot deviation. SINAD A-weighted filter 59 dB (nominal) with CCITT filter 67 dB (nominal) Left to Right Ratio A-weighted filter 59 dB (nominal) with CCITT filter...
- Page 93 VXA Vector Signal Analysis Measurement Application This chapter contains specifications for the N9064A VXA vector signal analysis measurement application. Add itional Definitions and Requirements Because digital communications signals are noise-like, all measurements will have variations. The specifications apply only with adequate averaging to remove those variations. Specs &...
- Page 94 Vector Signal Analysis Performance (N9064A-1FP) Frequency Description Specs & Nominals Supplemental Information Range "Frequency Range" on page 12 Center Frequency Tuning Resolution 1 mHz Frequency Span 10 MHz (standard) wider with options, such as 25 MHz (Option B25) Frequency Points per Span Calibrated points: 51 to 409,601 Displayed points: 51 to 524,288 Resolution Bandwidth (RBW)
- Page 95 Input Description Specs & Nominals Supplemental Information Range Full Scale, combines attenuator setting and ADC gain 20 dBm to 20 dBm, 10 dB steps standard 20 dBm to 22 dBm, 2 dB steps Option FSA 40 dBm to 20 dBm, 10 dB steps, up to 3 GHz Option P03 40 dBm to 22 dBm, 2 dB steps, up to 3 GHz Option P03 and FSA...
- Page 96 Dynamic Range Supplemental Description Specs & Nominals Information 72 dBc (nominal) Third-order intermodulation distortion (Two 10 dBfs tones, 10 MHz to 7.5 GHz, tone separation 100 kHz) Noise Density at 1 GHz Input Range Density 10 dBm 137 dBfs/Hz 20 dBm to 12 dBm 127 dBfs/Hz 30 dBm to 22 dBm...
- Page 97 Analog Mod ulation Analysis (N9064A-1FP) Description Specs & Nominals Supplemental Information AM Demodulation (Span MHz, Carrier 17 dBfs) Demodulator Bandwidth Same as selected measurement span 1 Modulation Index Accuracy 50 dBc Harmonic Distortion Relative to 100 modulation index 60 dBc Spurious Relative to 100...
- Page 98 Description Specs & Nominals Supplemental Information FM Demodulation Demodulator Bandwidth Same as selected measurement span 0.1% of span Modulation Index Accuracy (deviation < 2 MHz, modulation rate 500 kHz) Harmonic Distortion Modulation Rate Deviation 200 kHz 50 dBc < 50 kHz 500 kHz 2 MHz 45 dBc...
- Page 99 Flexible Digital Mod ulation Analysis (N9064A-2FP) Description Specs & Nominals Supplemental Information Accuracy Residual Errors Modulation formats include BPSK, D8PSK, DQPSK, QPSK, (16/32/64/128/256/512/1024)QAM, Residual EVM (16/32/64/128/256)DVBQAM, p/4-DQPSK, 8-PSK. EVM normalization reference set to Constellation Maximum. Symbol Rate/Span Transmit filter is Root Raised Cosine with alpha=0.35. 0.7...
- Page 100 Description Specs & Nominals Supplemental Information 16, 32, 64, 128, 256, 512, or 1.0 (SNR 40 dB) Symbol rate = 6.9 MHz, = 0.15, frequency < 3.0 GHz, 1024 QAM 8 MHz span, full-scale signal, range 30 dBm, result length = 800, averages = 10 ...
-
Page 101: Phase Noise Measurement Application
Phase Noise Measurement Application This chapter contains specifications for the N9068A Phase Noise measurement application. -
Page 102: General Specifications
General Specifications Description Specifications Supplemental Information Maximum Carrier Frequency Option F03 3 GHz Option F07 7.5 GHz Option F13 13.6 GHz Option F26 26.5 GHz Description Specifications Supplemental Information Measurement Characteristics Measurements Log plot, RMS noise, RMS jitter, Residual FM, Spot frequency Maximum number of decades Depends on Frequency Offset range a. -
Page 103: Measurement Accuracy
Description Specifications Supplemental Information Measurement Accuracy Phase Noise Density Accuracy Default settings ±1.18 dB Overdrive On setting ±1.06 dB (nominal) RMS Markers See equation a. This does not include the effect of system noise floor. This error is a function of the signal (phase noise of the DUT) to noise (analyzer noise floor due to phase noise and thermal noise) ratio, SN, in decibels. -
Page 104: Offset Frequency
Description Specifications Supplemental Information Offset Frequency Range 3 Hz to ( : Maximum frequency determined by option : Carrier frequency of signal under test Accuracy Offset < 1 MHz Negligible error (nominal) Offset MHz 0.5of offset + marker resolution) (nominal) 0.5of offset is equivalent to 0.0072 octave a. -
Page 105: Noise Figure Measurement Application
Noise Figure Measurement Application This chapter contains specifications for the N9069A Noise Figure Measurement Application. -
Page 106: General Specification
Y factor to give the total uncertainty of the noise figure or gain measurement. See Keysight App Note 57-2, literature number 5952-3706E for details on the use of this specification. Jitter (amplitude variations) will also affect the accuracy of results. The standard deviation of the measured result decreases by a factor of the square root of the Resolution Bandwidth used and by the square root of the number of averages. -
Page 107: Noise Figure Uncertainty Calculator
See Keysight App Note 57-2, literature number 5952-3706E for details on the use of this specification. Jitter (amplitude variations) will also affect the accuracy of results. The standard deviation of the measured result decreases by a factor of the square root of the Resolution Bandwidth used and by the square root of the number of averages. - Page 108 Nominal Instrument Noise Figure...
- Page 109 This information is subject to change without notice. © Keysight Technologies 2014-2015 Edition 1, June 2015 M9290-90027 www.keysight.com...
Need help?
Do you have a question about the M9290A and is the answer not in the manual?
Questions and answers