Konica Minolta CA-410 Series Instruction Manual
Display color analyzer pc software ca-s40 ver. 1.3 probe+
Hide thumbs
Also See for CA-410 Series:
- Instruction manual (128 pages) ,
- Instruction manual (140 pages) ,
- Instruction manual (79 pages)

Related Manuals for Konica Minolta CA-410 Series


Summary of Contents for Konica Minolta CA-410 Series
- Page 1 Display Color Analyzer CA-410 PC Software Probe + CA-S40 Ver. 1.3 Instruction Manual Please read before using the instrument.
- Page 2 This symbol indicates direct current (DC). Notes on this Manual • Copying or reproduction of all or part of the contents of this manual without the permission of KONICA MINOLTA is strictly prohibited. • The contents of this manual are subject to change without prior notice.
-
Page 3: Safety Precautions
KONICA MINOLTA-authorized service facility. The instrument should not be operated if it is damaged, or if smoke or odd smells occur. Doing so may cause a fire. In such situations, turn the power OFF immediately, and contact the nearest KONICA MINOLTA-authorized service facility. -
Page 4: Introduction
Introduction The CA-410 series is an instrument designed to measure the color, luminance, and flicker of various color displays. Please read this manual carefully before using the instrument. Packing materials of the product Be sure to keep all packing materials used for shipping the instrument (cardboard box, cushioning material, plastic bags, etc.). -
Page 5: Storing The Instrument
Maintenance and Inspection • To maintain measurement accuracy, the instrument should be inspected once a year. For information on inspection, contact the nearest KONICA MINOLTA-authorized service facility. Disposal Method • Make sure that the instrument, its accessories, and the packing materials are either disposed of or recycled correctly in accordance with local laws and regulations. -
Page 6: Table Of Contents
Table of Contents Safety Precautions ........... 1 Introduction ............ 2 CA-S40 ........37 PC Software Configuration of the CA-410 Series ....6 PC Software CA-S40 ........38 1. Configuration ..........6 2. System Configuration Diagram ......7 Overview ...........39 System environment ........40 Setup ............. - Page 7 Measurement ..........46 1. Chromaticity measurement ......46 2. Common operations ........49 3. Individual functions ........49 4. Flicker measurement (JEITA) ......51 5. Flicker measurement (FMA) ......52 ......53 6. Waveform measurement Measurement condition settings ....54 1. Measurement condition settings <Setting>...
-
Page 8: Configuration Of The Ca-410 Series
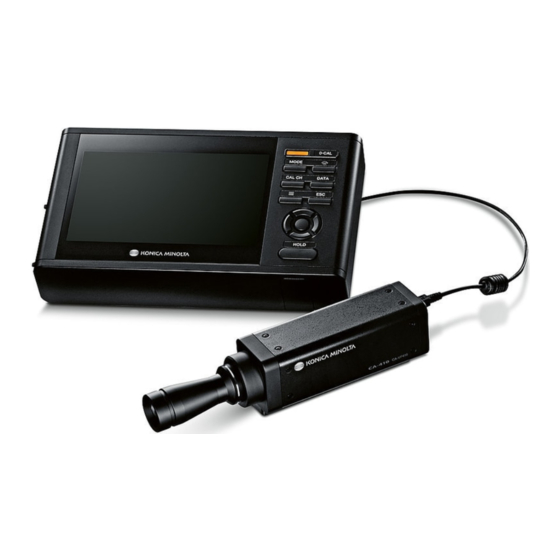
Configuration of the CA-410 Series 1. Configuration The CA-410 series consists of the following three systems: zProbes „ Sensor units for measuring displays. Can be connected to a PC to perform measurement (using PC software). Can be connected to a data processor to perform measurement. -
Page 9: System Configuration Diagram
2. System Configuration Diagram Data Processor standard accessory Probe standard accessory Optional accessory [Probe] Standard Probe High Sensitivity Probe CA-P427 CA-VP427 (miniDIN) (BNC) BNC Conversion Cable IF-A35 CA-P410 CA-VP410 (miniDIN) (D-sub) (Power Cable) (BNC) Conversion Cable IF-A29 Miniature Probe CA-MP410 RS-232C cable (Commercially available) USB Cable for... -
Page 11: Probe Guide
Probe Guide Probes ..................10 1. About Probes ................10 2. Probe Lineup (All Probes are Provided with Lens Caps) ....11 3. Standard Accessories ..............11 4. Optional Accessories ..............12 5. Description of Each Part of Probes ..........12 6. -
Page 12: Probes
Probes 1. About Probes A CA-410 series probe can be used to measure the luminance, chromaticity, and flicker values of displays. A probe can be controlled in the following three ways: • You can connect a probe to a PC and control it from PC software to perform measurement. By using the standard software, PC Software CA-S40 For Color Analyzers, you can select one of the probes connected to a PC via USB and control it to perform measurement. -
Page 13: Probe Lineup
2. Probe Lineup (All Probes are Provided with Lens Caps) Eight types of probes are available according to your application: Model Name Description Dimensions CA-P427 Ø27 Probe Probe with a measurement area of 27 mm P. 14 CA-P427H Ø27 Probe for high luminance High-luminance probe with a measurement area of 27 mm P. -
Page 14: Optional Accessories
Probes 4. Optional Accessories zConversion Cable IF-A29 „ Connects a probe to a PC or PLC (sequencer) via RS-232C and inputs synchronization signals to the probe. How to connect: Refer to page 20. zBNC Conversion Cable IF-A35 „ Inputs synchronization signals to the probe. How to connect: Refer to page 20. - Page 15 (4) Screw holes There are two types of screws for securing a probe: Tripod mount screw: Used for mounting the probe on a tripod. The depth is 6 mm. ISO screw: Used for securing the probe to jigs. Use an ISO 5 mm screw and the depth is 6 mm. • The distance from each screw to the end of the optical column is the same as that for a CA-310 series probe.
-
Page 16: Probe Dimensions
Probes 6. Probe Dimensions CA-P427 Ø27 Probe Probe with a measurement area of 27 mm CA-P427H Ø27 Probe for High Luminance High-luminance probe with a measurement area of 27 mm (unit: mm) ISO 5 mm screw (depth: 6 mm) ISO 5 mm screw (depth: 6 mm) Tripod mount screw (depth: 6 mm) Tripod mount screw... - Page 17 CA-P410 Ø10 Probe Probe with a measurement area of 10 mm CA-P410H Ø10 Probe for High Luminance High-luminance probe with a measurement area of 10 mm (unit: mm) ISO 5 mm screw (depth: 6 mm) ISO 5 mm screw (depth: 6 mm) Tripod mount screw (depth: 6 mm) Tripod mount screw...
- Page 18 Probes CA-VP427 Ø27 High Sensitivity Probe High-sensitivity probe with a measurement area of 27 mm (unit: mm) A Tripod mount screw (depth: 6 mm) ISO 5 mm screw (depth: 6 mm) ISO 5 mm screw (depth: 6 mm) When a light- shielding cylinder is mounted Viewed from A...
- Page 19 CA-VP410 Ø10 High Sensitivity Probe High-sensitivity probe with a measurement area of 10 mm (unit: mm) A Tripod mount screw (depth: 6 mm) ISO 5 mm screw (depth: 6 mm) ISO 5 mm screw (depth: 6 mm) When a light- shielding cylinder is mounted Viewed from A...
- Page 20 Probes CA-MP410 Ø10 Mini Probe Compact probe with a measurement area of 10 mm CA-MP410H Ø10 Mini Probe for High Luminance Compact high-luminance probe with a measurement area of 10 mm (unit: mm) 4 x ISO 3 mm screw (depth: 5.5 mm) ISO 3 mm screw (depth: 5 mm) ISO 5 mm screw (depth: 6 mm) ISO 5 mm screw (depth: 6 mm)
-
Page 21: How To Set A Probe
7. How to Set a Probe Secure the display. L = 30 mm Display surface of the display (when a light-shielding cylinder is not used) Secure the probe in a way to place its end 30 mm * away from the display surface. Be sure to set it perpendicular to the display. - Page 22 Probes • For RS-232C connection with a PC or PLC, connect the mini DIN plug of an optional conversion cable IF-A29 to the RS-232C connector of the probe, and the D-sub plug to the RS-232C connector of the PC or PLC via a cross cable. The baud rate of the probe is set to 38,400 bps.
-
Page 23: About Zero Calibration
For connection with a CA-DP40 data processor, you can use a mini DIN cable or a USB cable. • For RS-232C connection, connect the mini DIN plug of the RS mini DIN cable IF-A30 (or IF-A31 or IF-A32) for the data processor to the RS-232C connector of the probe and the probe RS-232C connector of the CA-DP40 data processor. -
Page 24: Measurement Functions Of Probes
Measurement Functions of Probes 1. Measurement Speeds A probe has the following four modes (measurement speeds), which are available according to the purpose. A probe outputs every measured value and a PC or data processor connected to it can retrieve all of them through communication. -
Page 25: Measurement Synchronization Modes
2. Measurement Synchronization Modes Measurement synchronization modes are designed to select a measurement time (integration time) according to the vertical scanning frequency of a display. A probe has the following six types of measurement synchronization modes. Select a mode suitable for the type of the display to be measured. Measurement Display's vertical Measurement time... - Page 26 Measurement Functions of Probes Relationship between measurement speed and measurement synchronization mode The measurement time (integration time) is determined by the selected measurement synchronization mode. Also, the measurement speed (number of measurements/outputs possible per second) is determined by the measurement synchronization mode and the following conditions: • Luminance of the display to be measured • Measurement mode...
-
Page 27: Measurement Modes
3. Measurement Modes A probe has the following measurement modes: Measurement mode Description of mode xyLv mode Mode for displaying and outputting chromaticity coordinates x, y and luminance Lv TduvLv mode Mode for displaying and outputting correlated color temperature T, color difference from blackbody locus duv, and luminance Lv u'v'Lv mode Mode for displaying and outputting u'v' chromaticity diagram coordinates (CIE1976 UCS... -
Page 28: User Memory
(1) Correction coefficient for user calibration (2) Target (3) ID CH00 is a channel for calibration in accordance with the Konica Minolta calibration standard. It can only be used for setting targets or IDs. Users can use CH01 to CH99 for calibration or saving targets. -
Page 29: About User Calibration
(x, y, Lv) to the instrument. Afterward, the value corrected with the specified correction coefficients will be displayed/output for every measurement. • Two types of user calibration can be performed for a CA-410 series probe: single-point calibration and RGB+W matrix calibration. -
Page 30: Specifications Of Each Probe
Specifications of Each Probe Specifications of Each Probe (1) CA-P427 CA-P427H Measurement area Ø27 mm Ø27 mm Acceptance angle ±2.5° ±2.5° Accuracy guaranteed measurement distance 30±10 mm 30±10 mm Display range Luminance 0.0001 to 5000 cd/m 0.0001 to 30000 cd/m Chromaticity Displayed in 4 digits Displayed in 4 digits... - Page 31 0 to 45°C, relative humidity 85% or less (at 35°C) with no condensation Measured with Konica Minolta’s specified PC and probe connected directly, using the supplied measurement software. *1: Measured under Konica Minolta's standard light source (6,500 K). *2: The luminance for monochrome is measured when reading of luminance for white is 100 cd/m *3: Temperature 23°C/±2°C, relative humidity 40%±10%...
- Page 32 Specifications of Each Probe (2) CA-P410 CA-P410H Measurement area Ø10 mm Ø10 mm Acceptance angle ±5° ±5° Accuracy guaranteed measurement distance 30±5 mm 30±5 mm Display range Luminance 0.0001 to 5000 cd/m 0.0001 to 30000 cd/m Chromaticity Displayed in 4 digits Displayed in 4 digits Luminance Accuracy guaranteed luminance range...
- Page 33 0 to 45°C, relative humidity 85% or less (at 35°C) with no condensation Measured with Konica Minolta’s specified PC and probe connected directly, using the supplied measurement software. *1: Measured under Konica Minolta's standard light source (6,500 K). *2: The luminance for monochrome is measured when reading of luminance for white is 100 cd/m *3: Temperature 23°C/±2°C, relative humidity 40%±10%...
- Page 34 Specifications of Each Probe (3) CA-MP410 CA-MP410H Measurement area Ø10 mm Ø10 mm Acceptance angle ±5° ±5° Accuracy guaranteed measurement distance 10±5 mm 10±5 mm Display range Luminance 0.0001 to 5000 cd/m 0.0001 to 30000 cd/m Chromaticity Displayed in 4 digits Displayed in 4 digits Luminance Accuracy guaranteed luminance range...
- Page 35 0 to 45°C, relative humidity 85% or less (at 35°C) with no condensation Measured with Konica Minolta’s specified PC and probe connected directly, using the supplied measurement software. *1: Measured under Konica Minolta's standard light source (6,500 K). *2: The luminance for monochrome is measured when reading of luminance for white is 100 cd/m *3: Temperature 23°C/±2°C, relative humidity 40%±10%...
- Page 36 Specifications of Each Probe (4) CA-VP427 CA-VP410 Measurement area Ø27 mm Ø10 mm Acceptance angle ±2.5° ±8.5° Accuracy guaranteed measurement distance 30±10 mm 30±5 mm Display range Luminance 0.0001 to 3000 cd/m 0.0001 to 3000 cd/m Chromaticity Displayed in 4 digits Displayed in 4 digits Luminance Accuracy guaranteed luminance range...
- Page 37 0 to 45°C, relative humidity 85% or less (at 35°C) with no condensation Measured with Konica Minolta’s specified PC and probe connected directly, using the supplied measurement software. *1: Measured under Konica Minolta's standard light source (6,500 K). *2: The luminance for monochrome is measured when reading of luminance for white is 100 cd/m *3: Temperature 23°C/±2°C, relative humidity 40%±10%...
-
Page 39: Pc Software Ca-S40
PC Software CA-S40 PC Software CA-S40 ..............38 Overview ................39 System environment ..............40 Operating requirements..............40 Instruments controlled ..............40 Language ...................40 Setup ................... 40 Major functions ................41 Operation flow ................42 Notes on measurement ..............43 Operation Guide ..............44 Preparing and starting the software .......... -
Page 40: Pc Software Ca-S40
• To connect the CA-410 series probe or data processor to a PC, you need the dedicated USB driver. • This software only controls the CA-410 series probe or data processor connected to the PC with a USB cable. It is not possible to control the probe or data processor of the CA-410 series connected by anything other than USB with this software. -
Page 41: Overview
Overview System environment......................40 Operating requirements ..................... 40 Instruments controlled ....................40 Language ........................40 Setup ..........................40 1. Installing the software (Windows) ................. 40 2. Uninstalling the software (Windows) ..............40 3. Installing the software (macOS) ................40 4. Uninstalling the software (macOS) ................ 40 Major functions ....................... -
Page 42: System Environment
[Program Files (x86)] folder. The program and manual are installed, and the CA-S40 startup menu is registered in the Start menu. [Program Files (x86)] – [KONICA MINOLTA] – [CA-S40] 2. Uninstalling the software (Windows) Open [Control Panel] - [Uninstall a program], select CA-S40 from the list, and double-click it or click [Uninstall]. -
Page 43: Major Functions
Major functions Display (Color) Lv, x, y, Lv, u', v’, Lv, Tcp, duv, X, Y, Z, Lv, λd, and Pe values, chromaticity diagram, and trend graph (JEITA) Flicker value (dB) and trend graph, spectral intensity value and graph, and waveform graph (FMA) Flicker value (%) and trend graph About displayed values • Although the CA-S40 offers a higher calculation accuracy through internal calculations using more decimal places than... -
Page 44: Operation Flow
Operation flow Connect the instrument (P.45) Start the software (P.45) When multiple instruments are connected Set up options Select the instrument (P.57) Set up the instrument Set the measurement (P.54) conditions Zero calibration User calibration (P.49, P.60) Set the target (P.65) Measurement (P.46) -
Page 45: Notes On Measurement
• Use the USB cable to connect the instrument. This software can only control probes or data processors of the CA-410 series connected by USB. It is not possible to control the probe or data processor of the CA-410 series connected by anything other than USB with this software. -
Page 46: Operation Guide
Operation Guide Preparing and starting the software ................. 45 1. Connect the instrument and start the software ............45 Measurement ........................46 1. Chromaticity measurement .................. 46 1-1. Screen layout ....................46 1-2. Measurement type ..................48 1-3. Data display ....................48 1-4. -
Page 47: Preparing And Starting The Software
Check whether the probe’s LED indicator blinks. Go to [Start menu] - [KONICA MINOLTA] - [CA-S40] and click CA-S40 to start the software. • When only one instrument is connected, the measurement screen appears. (See 1-1. Screen layout on P.46) • When multiple instruments are connected, the instrument selection screen appears. -
Page 48: Measurement
Measurement 1. Chromaticity measurement Click the [Color] tab to display the following screen. On this screen, you can measure chromaticity and display the results in the selected color space. User calibration and gamma measurement can also be performed. 1-1. Screen layout (10) (12) (13) - Page 49 (11) Chromaticity diagram After selecting a graph area, • Use the mouse wheel to zoom in and zoom out. • Drag to move the display area. • Double-click to return to the original scale. • Right-click on the graph to display the following menu, which allows you to copy the graph to the clipboard or a file.
-
Page 50: Data Display
Measurement 1-2. Measurement type Select the measurement type. Single: Single measurement Continuous: Continuous measurement (graph scrolls) * Displays up to 100 data sets and deletes data from the oldest. Interval: Interval measurement, which performs the specified number of measurements at the specified interval. ... -
Page 51: Common Operations
2. Common operations On each measurement screen, you can toggle between “Data List” display and “Trend Graph” display. Click to start the measurement with the settings applied. Click [Save to CSV] to save the data to a file. Click [Clear] to clear data. * The data is saved in CSV format. - Page 52 Measurement 3-1. Gamma measurement (only for chromaticity measurement) • Click [Gamma] among the individual functions to bring up the pop-up window for gamma measurement. Here, you can measure the color output intensity for each color’s input tone. • When measuring, configure the settings related to the color and tone to be measured. • Click the measurement start button.
-
Page 53: Flicker Measurement (Jeita)
4. Flicker measurement (JEITA) Click the [JEITA] tab to bring up the following screen, where you can set the JEITA frequency resolution. Click [Measure] to start measurement. The JEITA flicker measurement values, frequency characteristics, and waveform are displayed. JEITA frequency resolution Measured value (dB) Frequency... -
Page 54: Flicker Measurement (Fma)
Measurement Aliasing Noise During JEITA flicker measurement, when measuring a light source that includes a harmonic component such as a rectangular wave light source, aliasing noise may occur in the low-frequency range, which can be displayed as the JEITA flicker value. Peaks that vary greatly on the Power Spectrum graph when changing the JEITA frequency resolution setting by one step likely are being influenced by aliasing noise. -
Page 55: Waveform Measurement
6. Waveform measurement (Also refer to “1. Measurement condition settings <Setting> tab”) Click the [Waveform] tab to bring up the following screen where you can set various parameters. Click [Measure] to start measurement. The flicker measurement values and other measurement results will be displayed in a waveform graph and power spectrum graph. -
Page 56: Measurement Condition Settings
Measurement condition settings <Settings> window Click [Settings] among the individual functions to bring up the following pop-up window for setting the measurement conditions and optional items. 1. Measurement condition settings <Setting> tab Measurement mode Calibration channel information 1-1. Measurement mode settings [Mode tab - Mode Settings] ... - Page 57 Measurement Speed Select the measurement speed. (SLOW/FAST/LTD.AUTO/AUTO) • Selecting FAST can shorten measurement time, but may compromise measurement repeatability for low-luminance measurements. • Selecting SLOW repeats FAST measurements several times to ensure measurement with high repeatability. • When AUTO is selected, measurements are automatically selected between SLOW, FAST, and setting with a further longer integration time depending on the luminance level.
- Page 58 Measurement condition settings Text file content: Example of text file content: <Starting frequency> <End frequency> <Frequency pitch> <Number of 0.01 0.01 6500 data sets> 0.01 <Frequency> <Value> 0.02 · · · · · · · · · · · · ·...
-
Page 59: Option Settings
2. Option settings <Info> tab Display settings Instrument information 2-1. Selecting the date display format and luminance unit Application Settings Date Format : Select a date display format. Luminance Unit : Select a luminance unit. If the selection of [Luminance Unit] is not displayed on the screen, exit the software, and restart the software after adding “/u”...Tab - Page 60 Measurement condition settings 2-3. Switching between data processor and probe How to switch from "Type" on the Settings-Info screen Select the data processor in "CA Info" - "Device" - "Type". Click the [Probe] button on the "CA Info". (Select the device connected to the data processor.) Select an area that is not any probe on the Select Probe screen and click [OK] to switch to the data processor.
-
Page 61: Command Communication
3. Command communication <Command> tab The user can check the operations of communication commands when developing original software. The specifications of communication commands are available for download from the following webpage: https://www.konicaminolta.com/instruments/download/ Command : Enter a command to be sent and click [Send] to send it to the instrument. ...Tab -
Page 62: User Calibration
• As user calibration, you can select single-point calibration or RGB+W matrix calibration. • User calibration can be performed for every calibration channel (except for CH00). • User calibration cannot be performed for CH00 because it is calibrated in accordance with the Konica Minolta calibration standard. - Page 63 To measure Red, click the measurement button on the right of Red in the [Measured Value] field, which shows the color display window for measuring Red. After you align the color display window and the instrument and click [OK] on the pop-up screen, the measured value is displayed in the [Measured Value] field for Red.
- Page 64 User calibration After performing measurement and entering targets for all of Red, Green, Blue, and White, click the [Apply] button to complete RGB+W matrix calibration. • To stop the calibration, click [Close]. The change is not applied until you click the [Apply] button.
- Page 65 Correction coefficients are used for all measurement modes (Lv xy, Lv u' v', Lv Tcp duv, XYZ, and Lvλd Pe). You cannot perform user calibration for channel CH00. (CH00 is a channel for performing measurement in accordance with the Konica Minolta calibration standard.) Performing RGB+W matrix calibration for a preset channel erases the last-set value.
-
Page 66: Specifying The Calibration Coefficients
User calibration 3. Specifying the calibration coefficients <Settings> window To perform measurement using your own correction coefficients, specify which calibration channel's correction coefficients you want to use. Specify [CH00] to perform measurement without performing correction but in accordance with the Konica Minolta standard.Window -
Page 67: Target Settings
Target settings The target values used for user calibration are written as the target in a calibration channel. If you want to set a separate target for color difference assessment (this function is available with a data processor), you can set a target in a calibration channel using [Set Target]. -
Page 68: Data Processor Data
Data processor data 1. Handling of stored data The stored data are the measurement results stored in the data processor. You can measure a single data using up to 10 probes and 100 Data can be registered. When Data is selected in the Data list on the [Measurement Data] tab • When you click the [File Save] button, all the measurement results of the probe used for measurement in the selected Data are saved. -
Page 69: Handling Of Log Data
2. Handling of Log data One Log Data has the Data of the number of probes for the measured times. Log No. / date and time measurement started / date and time measurement stopped / data number tabs are displayed on the Log Data screen. -
Page 71: Appendix
Appendix Error message ......................... 70 Caution ........................... 71 Instruction ........................74 Information ........................76... -
Page 72: Error Message
Error message The operation is not correct. Follow the instructions displayed immediately. Message Details --failed to write or read on memory A memory error has occurred inside the probe. If this condition persists after --reconnect the probe reconnecting, contact a service center to deal with the possible malfunction. --System error A program operation error has occurred inside the probe or SDK. -
Page 73: Caution
Caution The setting or operation is not correct. Message Details Cannot open the manual PDF viewer software for displaying the instruction manual cannot be opened. Make sure that a PDF reader is installed and Check whether PDF viewer software is installed and set to default. it is set as the default app for PDFs. - Page 74 Caution Message Details [Times] has input value error. A non-numeric value is entered for the number of measurements for interval Please input a valid number. measurement. Use only numeric values. [Times] has input value error. An out-of-range value is entered for the number of measurements for interval Please input 0 - 40000 measurements.
- Page 75 Message Details Cannot overwrite existing file. Data cannot be saved to file due to reasons such as the save file is currently in Check that it is not in use. used. Check the file. --no sync_signal Vertical synchronization signals are not input in external synchronization --input an external synchronization signal mode.
-
Page 76: Instruction
Instruction The flow of operation is displayed. Perform the operation according to the information displayed. Message Details Please wait for a moment. A task is running. Please wait until the task is completed. Transferring to Datalist… Continuous/Interval measurement data is being transferred from the buffer to the list. - Page 77 Message Details Entering gamma measurement mode will This message appears when you try to open the gamma measurement clear previous measurement data. window while there is measurement data. If the measurement data is Do you want to proceed? necessary, save it before running the measurement. Closing the window will clear This message appears when you try to close the gamma window while there Gamma measurement data and graphs.
-
Page 78: Information
Information Updated information is provided. Message Details New CA device is connected. This message appears when a different device is connected after the USB connection has been disconnected or when there is a device switchover from the Settings screen. New probe is connected. This message appears when a separate probe is selected while a data processor is connected. - Page 79 List display color Error Code Meaning Blue 6: Δ t out of range Error code 2 and error code 4 occurred at the same time. Blue 7: Δ t out of range Error code 1, error code 2, and error code 4 occurred at the same time. Yellow 10:Problem with There is a problem with CA-410.
- Page 80 Information Error code For the error code displayed on the List in yellow, the error message shown in the table below is displayed after measurement is completed. Error message Meaning CA410 device has problem. There is a problem with CA-410. Check the setting and CA-410 status. Please check configurations or device conditions An invalid external synchronization signal...
- Page 81 < CAUTION > KONICA MINOLTA WILL NOT BE LIABLE FOR ANY DAMAGES RESULTING FROM THE MISUSE, MISHANDLING, UNAUTHORIZED MODIFICATION, ETC. OF THIS PRODUCT, OR FOR ANY INDIRECT OR INCIDENTAL DAMAGES (INCLUDING BUT NOT LIMITED TO LOSS OF BUSINESS PROFITS, INTERRUPTION OF BUSINESS, ETC.) DUE TO THE USE OF OR INABILITY...
- Page 82 En 9222-AA1J-11 ©2017 KONICA MINOLTA, INC. BIFCDA...
Need help?
Do you have a question about the CA-410 Series and is the answer not in the manual?
Questions and answers