Table of Contents
Advertisement
Advertisement
Table of Contents

Subscribe to Our Youtube Channel
Related Manuals for Hantek DSO4072


Summary of Contents for Hantek DSO4072
- Page 1 DSO4000 Series Digital Storage Oscilloscope User Manual (Version 1.2)...
-
Page 2: Table Of Contents
Contents Safety Tips ............................1 General Safety Summary ........................1 Safety Terms and Symbols ........................2 Product Scrapping ..........................2 Brief Introduction to DSO4000 Series ....................3 Chapter 1 Introduction ....................... 4 Accidence of front panel and the user interface ............... 1 1.1.1 Front Panel ........................ - Page 3 2.11.3 Measurement ........................35 2.12 Acquisition System ......................... 37 2.13 UTILITY System ........................39 2.13.1 Firmware Update ......................39 2.13.2 Self Calibration ....................... 40 2.13.3 Keypad Beep Control ...................... 40 2.13.4 Language ........................40 2.13.5 GUI Color Setting ......................40 2.13.6 Time Setting ........................
- Page 4 Cleaning ..........................76 Appendix A Harmful and Poisonous Substances or Elements ..........77...
-
Page 5: Safety Tips
Safety Tips General Safety Summary Read the following safety precautions to avoid injury and prevent damage to this product or any products connected to it. To evade potential hazards, use this product only as specified. Only qualified personnel should perform maintenance. Avoid fire or personal injury. -
Page 6: Safety Terms And Symbols
Safety Terms and Symbols Terms on Product The following terms may appear on the product: DANGER indicates an injury hazard immediately accessible as you read the marking. WARNING indicates an injury hazard not immediately accessible as you read the marking. CAUTION indicates a possible hazard to this product or other property. -
Page 7: Brief Introduction To Dso4000 Series
Model Channels Bandwidth Sample Rate 70MHz 1GS/s 7 inch color DSO4072 100MHz 1GS/s 7 inch color DSO4102 DSO4202 200MHz 1GS/s 7 inch color... -
Page 8: Chapter 1 Introduction
Chapter 1 Introduction Accidence of front panel and the user interface Functional Check Probe Examination Self Calibration... -
Page 9: Accidence Of Front Panel And The User Interface
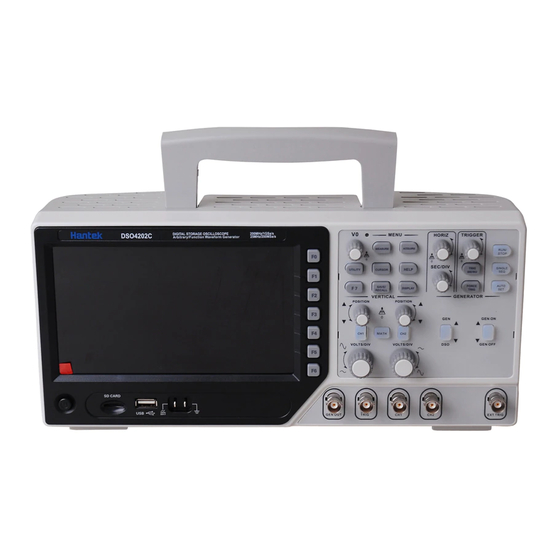
1.1 Accidence of front panel and the user interface This section will make you understand the front operation panel of this series of digital oscilloscope at first before use. 1.1.1 Front Panel The content below simply describes and introduces the front panel and the back part of this series of digital oscilloscope so that you can get familiar with this series of digital oscilloscope well within the shortest time. -
Page 10: User Interface
1.1.2 User Interface 1. Hantek mark 2. Display Format: : YT : XY : Vectors : Dots : Gray indicates auto persistence; Green means persistence display is enabled. When the icon is set to green, the time for persistence display will be shown behind it. -
Page 11: Functional Check
: This icon lights up only when the USB slave interface is connected with the computer. 6. Main Time Base Window 7. Display of window’s position in data memory and data length. 8. Window Time Base 9. Operating Menu shows different information for different function keys. 10. -
Page 12: Observe The Waveform
align the slot in the probe connector with the protuberance on the CH1 BNC and push to connect; then, turn to right to lock the probe in place; after that, connect the probe tip and reference lead to the PROBE COMP connectors. There is a mark on the panel: Probe COMP ~5V@1KHz. PROBE COMP CH1: to connect with the probe 1.2.3 Observe the waveform... -
Page 13: Use Of Probe Check Wizard
1.3.2 Use of Probe Check Wizard Every time you connect a probe to an input channel, you should use the probe check wizard to verify that this probe is operating correctly. Use the vertical menu (for example, push the CH1 MENU button) to set the Probe option attenuation factor. -
Page 14: Probe Attenuation Setting
1.3.4 Probe Attenuation Setting Probes are of various attenuation factors which affect the vertical scale of the signal. The Probe Check function is used to verify if the Probe attenuation option matches the attenuation of the probe. As an alternative method to Probe Check, you can push a vertical menu button (such as the CH 1 MENU button) and select the Probe option that matches the attenuation factor of your probe. -
Page 15: Chapter 2 Main Feature Description
Basic Operation Chapter 2 Main Feature Description This chapter provides some general information that you need to learn before using an oscilloscope. It contains: Menu and Control Keys Multi-functional Knobs and Buttons Signal Connectors Oscilloscope Setup ... -
Page 16: Menu And Control Keys
Basic Operation 2.1 Menu and control keys As shown in the figure below: Figure2-1 Control keys All the keys are described as follows: [CH1], [CH2]: display setup menus of channel 1 and channel 2. [MATH]: display “ARITHMETICAL OPERATION” and “REFERENCE WAVEFORM” menu. ... -
Page 17: Multi-Functional Knobs And Buttons
Basic Operation 2.2 Multi-functional Knobs and Buttons V0: Multi-functional knob. Under different menu options, it supports selecting menu options (MEASURE), moving cursors and levels (Slope Trigger). Press this knob to reset data (trigger holdoff, overtime of the overtime trigger and slope trigger), select menu options and so on. -
Page 18: Oscilloscope Setup
Basic Operation SYNC/TRIG: Output the Sync signal, or input trigger signal on DDS interface. CH1, CH2: Input connectors for waveform display, through which to connect and input the signal to be measured. GEN AMP: Power amplifier output. EXT.TRIG: Input connector for an external trigger source, though with to connect and input the external trigger signal. - Page 19 Basic Operation Type Source Cursor Horizontal (amplitude) ± 3.2div Vertical (time) ± 4div Type Vectors Display Persist Format Window Mode Single-window Trigger Knob Level Horizontal Position 0.00s SEC/DIV 200μs — Operation Math Source CH1-CH2 Position 0div Vertical Scale 20dB FFT Operation Source Window Hanning...
-
Page 20: Horizontal System
Basic Operation Coupling Level 0.00v Type Edge Slope Rising Mode Auto Coupling Level 0.00v Source Polarity Positive Trigger (OT) Mode Auto Time 20ns Coupling Bandwidth Limit Unlimited VOLTS/DIV Coarse Probe Voltage Vertical System, All Channels Voltage Probe Attenuation Invert Position 0.00div (0.00V) VOLTS/DIV 1.00V... -
Page 21: Horizontal Control Knob
Basic Operation HORIZONTAL POSITION Knob SEC/DIV 2.6.1 Horizontal control knob The horizontal knob [SEC/DIV] changes the horizontal scale (time base), and the [POSITION] knob changes the horizontal position (triggered displacement) triggered in the internal memory. The center of the screen in the horizontal direction is a time reference point of the waveform. Change of the horizontal scale will cause expansion or contraction of the waveform relative to the center of the screen, while the change of the horizontal position is relative to the position of a trigger point. - Page 22 Basic Operation Page2/2 Select this menu and turn the multi-functional knob to adjust the trigger holdoff time within the range of 100ns-10s. Select Holdoff None this menu and push the multi-functional knob to reset the holdoff time with the starting value 100ns. This function is usable in dual-window mode.
-
Page 23: Display Scan Mode
Basic Operation Single-window Mode Dual-window Mode (Full Screen) Location of expanded window data in memory Major Window Minor Window (Expanded Window) Notes: 1. For more information of the trigger holdoff, see Trigger Controls. 2. In single-window mode, press F0 to hide or show the menus on the right side. The dual-window mode does not support the menu hiding function. -
Page 24: Vertical System
Basic Operation 2.7 Vertical System 2.7.1 Vertical Controls Vertical controls can be used to display and remove waveforms, adjust vertical scale and position, set input parameters and perform math calculations. Each channel has a separate vertical menu to set. See below for menu description. VERTICAL POSITION Knob VOLT/DIV Knob 1. -
Page 25: Math Fft
Basic Operation Selects a value according to the probe attenuation factor so Probe Attenuation as to ensure correct vertical readouts. Reduce bandwidth to 100X 6MHz when using a 1X probe. 1000X Invert Inverts the waveform relative to the reference level. Coupling ... - Page 26 Basic Operation FFT mode to convert a time-domain (YT) signal into its frequency components (spectrum), and to observe the following types of signals: Analyze harmonics in power cords; Measure harmonic content and distortion in systems; Characterize noise in DC power supplies; ...
- Page 27 Basic Operation waveform not being triggered. This is especially true if the signal is periodic or random (such as noise). Note: You should trigger and position transient or burst waveforms as close as possible to the screen center. Nyquist Frequency The highest frequency that any real-time digital oscilloscope can measure without errors is half of the sample rate, which is called the Nyquist frequency.
- Page 28 Basic Operation Fundamental frequency component Frequency component 1. Frequency at the center graticule line 2. Vertical scale in dB per division (0dB=1V 3. Horizontal scale in frequency per division 4. Sample rate in number of samples per second 5. FFT window type 2.7.2.3 Selecting FFT Window Using windows can eliminate the spectral leakage in the FFT spectrum.
- Page 29 Basic Operation Applying a window to the YT waveform changes the waveform so that the start and stop values are close to each other, which reduces the discontinuities. The Math FFT function has three FFT Window options. There is a trade-off between frequency resolution and amplitude accuracy for each type of window.
- Page 30 Basic Operation 2.7.2.4 FFT Aliasing Problems occur when the time-domain waveform acquired by the oscilloscope contains frequency components higher than the Nyquist frequency. The frequency components above the Nyquist frequency will be undersampled and displayed as lower frequency components that ‘fold back’ from the Nyquist frequency.
-
Page 31: Trigger System
Basic Operation 2.7.2.7 Using Cursors to Measure FFT Spectrum You may use cursors to take two measurements on the FFT spectrum: amplitude (in dB) and frequency (in Hz). Amplitude is referenced to 0db that equals 1VRMS here. You may use cursors to measure at any zoom factor. -
Page 32: Trigger Controls
Basic Operation Slope Trigger uses the rise and fall times on the edge of signal for triggering. Overtime Trigger happens after the edge of signal reaches the set time. Swap Trigger, as a feature of analog oscilloscopes, gives stable displays of signals at two different frequencies. - Page 33 Basic Operation 1. Level It sets the amplitude level the signal must cross to cause an acquisition when using the Edge or Pulse Width trigger. 2. Set to 50% The trigger level is set to the vertical midpoint between the peaks of the trigger signal. 3.
- Page 34 Basic Operation trigger within a certain amount of time based on the SEC/DIV setting. The oscilloscope goes into the scan mode at 80ms/div or slower time base settings. In the Normal mode, the oscilloscope updates the display only when it detects a valid trigger condition. New waveforms are not displayed until they replace old ones.
- Page 35 Basic Operation Options Settings Comments With Pulse highlighted, the trigger occurs on pulses that meet Pulse the trigger condition (defined by the Source, When and Set Pulse Width options). Source Select the input source as the trigger signal. EXT5 ≠ When Select the trigger condition.
- Page 36 Basic Operation <, >: Triggers the oscilloscope when the source signal pulse width is less than or greater than the specified pulse width. Slope Trigger: Judges trigger according to the time for rising or falling, more flexible and accurate than the Edge trigger. Options Settings Comments...
- Page 37 Basic Operation Push F3 or F4 to select the components of the trigger signal Coupling HF Reject applied to the trigger circuitry. LF Reject Type Video Normal Polarity Inverted NTSC Standard PAL/SECAM All Lines Line Number Sync Odd Field Select by F4, F5. Even Field All Fields Type...
-
Page 38: Save/Recall
Basic Operation knob to set the time span. Overtime Trigger: In Pulse Width trigger, you may sometimes be puzzled with the long time for trigger, as you do not need a complete pulse width to trigger the oscilloscope, but want the trigger occurs just upon the overtime point. - Page 39 Basic Operation MATH RefA Location Select the reference location to store or recall a waveform. RefB Save Save the source waveform to the selected reference location. Operation Recall Recall saved source waveform to the selected reference location. Close Close Ref channel. Page 2/2 Flash Save the source waveform to flash.
-
Page 40: Display System
Basic Operation See below for waveform menus. At most 9 groups of The white waveforms on the menu is setups can be stored the recalled RefA waveform Note: The oscilloscope will save the current settings if you wait 5 seconds after the last modification, and it will recall these settings the next time you power on the oscilloscope. -
Page 41: Xy Format
Basic Operation Refresh Auto, 30 frame, 40 frame, 50frame Rate Wave 0-15 16 ranks adjustable, with a progress bar to display Intensity 2.10.1 XY Format The XY format is used to analyze phase differences, such as those represented by Lissajous patterns. - Page 42 Basic Operation 1. Manual mode: Horizontal cursors or vertical cursors appear in pair to measure time or voltage, and the distance between the cursors can be manually regulated. The signal source should be set as a waveform to be measured before the cursors are used. 2.
- Page 43 Basic Operation 3. Press “Signal source” to select CH1, CH2, MATH, RefA or RefB. 4. Select “S” and revolve the [UNIVERSAL] knob to regulate the position of “S”. 5. Select “E” and revolve the [UNIVERSAL] knob to regulate the position of “E”. 6.
-
Page 44: Measurement
Basic Operation dt: Horizontal distance (namely the time value between the two cursors) of “S” and “E”. 1/dt: Frequency of “S” and “E”. dV: Vertical distance (namely the voltage value between the two cursors) of “S” and “E”. Voltage Cursor Time Cursor 2.11.3 Measurement Push the MEASURE button to perform auto measurements. - Page 45 Basic Operation Measure the time between the first rising edge and the next falling + Width edge at the waveform 50% level. Measure the time between the first falling edge and the next rising - Width edge at the waveform 50% level. Measure the first cycle waveform.
-
Page 46: Acquisition System
Basic Operation Use the knob V0 or the functional keys F3, F4 to select the type of measurement. The readouts in big font size on the menu are just results of the corresponding measurements. Taking Measurements: For a single waveform (or a waveform divided among multiple waveforms), up to 8 automatic measurements can be displayed at a time. - Page 47 Basic Operation Normal Acquisition Intervals Sample Points Normal Mode Acquires a Single Sample Point in Each Interval Peak Detect: Use this mode to detect glitches within 10ns and to limit the possibility of aliasing. This mode is valid at the SEC/DIV setting of 4µs/div or slower. Once you set the SEC/DIV setting to 4µs/div or faster, the acquisition mode will change to Normal because the sample rate is fast enough that Peak Detect is unnecessary.
-
Page 48: Utility System
Basic Operation 2.13 UTILITY System Push the UTILITY button to display the Utility Menu as follows. Options Comments System Info Display the software and hardware versions, serial number and some other information about the oscilloscope. Update Program Insert a USB disk with upgrade program and the disk icon at the top left corner is highlighted. -
Page 49: Self Calibration
Basic Operation 4. Refer to Upgrade dialog and push F6 to upgrade. Reboot the machine after finishing upgrading, and the software version is upgraded. The oscilloscope should be self-corrected once after upgrading. 2.13.2 Self Calibration The self calibration routine helps optimize the oscilloscope signal path for maximum measurement accuracy. - Page 50 Basic Operation Source Select the signal input channel. Run pass/fail Operation Stop pass/fail Stop Close waveform pass/fail time display information. Display information Open waveform pass/fail time display information. Page 1/2 Skip to page 2 to the pass/fail menu. Page 2 of the pass/fail function menu: Option Setup Description...
-
Page 51: Recorder
Basic Operation Pass/Fail Test result Waveform recording 2.13.9 Recorder The waveform recording function can be used for recording waveforms input by channel 1 and channel 2. The user can set the time interval of the frames within 1ms-999s. At most 1000 frames of waveforms can be recorded. -
Page 52: Filter
Basic Operation Recording replay: Replay the current recorded waveforms. Page 1 of the waveform replay function menu: Option Setup Description Function Play Set a replay function menu. Repeat Repeatedly replay the recorded waveform. Mode Single Replay the recorded waveform in single run. Time interval Set the time interval of the replayed frame to frame. -
Page 53: Dvm
Basic Operation 2.13.13 DVM Press “Utility->F6->F6” to page 3 and select “Option->DVM” of utility menu to calculate the Root Mean Square voltage over the entire waveform(CRMS). 2.14 Help System This oscilloscope has a Help system with topics covering all of its features. You can use the Help system to display several kinds of information: ... -
Page 54: Fast Action Buttons
Basic Operation 2.15 Fast Action Buttons RUN/STOP: Continuously acquire waveforms or stop the acquisition. SINGLE SEQ: Acquire a single waveform and then stop the acquisition. AUTOSET: Automatically set the oscilloscope controls to generate a usable display of the input signals. Refer to the following table for relative content. 2.15.1 Autoset Autoset is one of the advantages digital oscilloscopes have. - Page 55 Basic Operation DC (if GND was chosen before); AC for the video signal; otherwise, Vertical Coupling unchanged VOLTS/DIV Adjusted The Autoset function examines all channels for signals and displays corresponding waveforms. Autoset determines the trigger source according to the following conditions. ...
-
Page 56: Waveform Generator And Power Amplifier
Basic Operation 2.16 Waveform Generator and Power Amplifier 2.16.1 Waveform Generator DSO4000 series oscilloscope is equipped with waveform generator function, with one channel of arbitrary waveform output. User can edit the arbitrary waveform or choose the regular waveforms such as Sine, Ramp, Square, Trapezia, DC, Exponent, AM/FM. Push the GEN button to display the DDS Menu. - Page 57 Basic Operation 2. Set the Wave Parameter: Frequency: Set the output wave frequency. Amplitude: Set the output wave amplitude. Y Offset: Set the output wave vertical level offset. Wave Param: Duty: The duty of the output wave. Output: Select output type continuous or single. Ext Trig: Turn on or turn off external trigger, select rise edge or falle dge.
- Page 58 Basic Operation 2. Set the Wave Parameter: Frequency: Set the output modulation wave frequency. Amplitude: Set the output modulation wave amplitude. Y Offset: Set the output modulation wave vertical level offset. Output: Select output type continuous or single. Ext Trig: Turn on or turn off external trigger, select rise edge or falle dge. Wave Param: Type: Select "AM"...
- Page 59 Basic Operation Click “Wave Parameter->Parameter” to sewaveform frequency and poin number. The maximum of point is 4096. Click “Edit->Points Edit” to set pointindex and voltage. Also user can drag left mouse to edit points. Click “File->Save CSV”, and save CSV file to U disk or other paths. Insert U disk to the USB port of the device, select wave as "Arb ".
-
Page 60: Power Amplifier(Optional)
Basic Operation 2.16.2 Power Amplifier(Optional) If users set the Power Amplifier Out to turn on, the power amplifier board will work in the instrument. When using the power amplifier, use a connecting cable to input the signal to the input terminal “GEN OUT”, there will be a 2-time-amplified signal in the output terminal “2 time power amplifier output”. - Page 61 Basic Operation short circuit output should be avoided. Please also avoid to frequently using the maximum value of the frequency, amplitude and load. Power Amp Out Power Out: Turn on or turn off power amplifier out. DSO4000 Series Digital Storage Oscilloscope...
-
Page 62: Chapter 3 Application Examples
Chapter 3 Application Examples This chapter unfolds a further description on main features of the oscilloscope by giving eleven simplified application examples for reference to help solve your own test problems. Taking simple measurements Using AUTOSET Using the Measure menu to take auto measurements Taking cursor measurements Measuring ring frequency and ring amplitude Measuring pulse width... -
Page 63: Example 1: Taking Simple Measurements
3.1 Example 1: Taking Simple Measurements When you want to observe an unknown signal in a certain circuit without having its amplitude and frequency parameters, you may use this function to take a fast measurement on the frequency, period and peak-to-peak amplitude of the signal. Follow the steps below. -
Page 64: Example 2: Taking Cursor Measurements
The figure below shows three measure items as an example. The boxes under them display the measurements in large fonts. 3.2 Example 2: Taking Cursor Measurements You can use the cursor to quickly measure the time and amplitude of a waveform. Measuring Ring Time (convertible to Frequency) and Amplitude on Rising Edge of Pulse To measure the ring time on the rising edge of the pulse, follow the steps below. - Page 65 Measuring Pulse Width To analyze a pulse signal and to know its width, follow the steps below. Push the CURSOR button to view the Cursor menu. Push F1 the Type option button and select Time. Push F2 or F3 the Source option button and select CH1. Push F4 to select a cursor.
- Page 66 Measuring Rise Time of Pulse You may need to measure the rise time of the pulse in many application environments, usually, to measure the rise time between the 10% and 90% levels of the pulse waveform. To do so, follow the steps below.
-
Page 67: Example 3: Analyzing Input Signals To Eliminate Random Noise
5 divisions 3.3 Example 3: Analyzing Input Signals to Eliminate Random Noise In certain circumstances, to display a noisy signal on the oscilloscope and to get its details, you may follow the steps below to analyze this signal. Observing Noisy Signal Press the ACQUIRE button to see the Acquire menu. - Page 68 See the figure below for better understanding. Eliminating Random Noise Press the ACQUIRE button to see the Acquire menu. Push the Type option button and select Real Time. Push the Average option button. Push the Averages option button and adjust the number of running averages to watch the change in the waveform display.
-
Page 69: Example 4: Capturing Single-Shot Signal
3.4 Example 4: Capturing Single-shot Signal You may refer to the following example to easily capture some aperiodic signals like pulses and glitches. To set for a single-shot acquisition, follow the steps below. First, set up the oscilloscope probe and the attenuation factor of CH1. Turn the vertical VOLTS/DIV and horizontal SEC/DIV knobs to a proper position for a better examination of the signal. - Page 70 Push the CH1 MENU button and set the Probe option attenuation to 10X; push the CH2 MENU button and set the Probe option attenuation to 10X. Connect the CH1 probe to the input of the network, and connect the CH2 probe to the output. Push the AUTOSET button.
-
Page 71: Example 6: Triggering On Pulse Width
3.6 Example 6: Triggering on Pulse Width Triggering on a Specific Pulse Width While testing the pulse width of a signal in a circuit, you may need to verify the pulse width is consistent with the theoretic value. Or even if the edge triggering shows that your signal has the same pulse width with the specific signal, you still doubt about the result. -
Page 72: Example 7: Triggering On Video Signal
3.7 Example 7: Triggering on Video Signal Assume that you are monitoring the video signals of a television to see if they are input normally, and the video signal is of an NTSC system. You can get a stable display by using the video trigger. Triggering on Video Fields To trigger on the video fields, follow the steps below. -
Page 73: Example 8: Using Slope Trigger To Capture Particular Slope Signal
Turn V0 to adjust the line number (NTSC: 0-525 lines). Turn the horizontal SEC/DIV and the vertical VOLTS/DIV knobs to display on the screen a complete video signal triggering on a video line. See the figure below. 3.8 Example 8: Using Slope Trigger to Capture Particular Slope Signal In many occasions, we are not only concerned about the edge of the signal, but also want to know the rise and fall times of the signal. -
Page 74: Example 9: Using Overtime Trigger To Measure Long Pulse Signal
3.9 Example 9: Using Overtime Trigger to Measure Long Pulse Signal It is not easy to observe some part of a long pulse signal by using the edge or pulse width trigger. In such case, you can use the overtime trigger by following steps. Push the TRIG MENU button to see the Trigger menu. -
Page 75: Example 10: Using Math Functions To Analyze Waveforms
Note: The difference between the overtime and the delay triggers is that the overtime trigger can identify the pulse you need according to your set time and trigger on any point of the pulse. In the other word, the overtime trigger occurs based on pulse identification. It is similar to the >... -
Page 76: Example 11: Measuring Data Propagation Delay
CH2. Follow the above steps to set up the Math menu, and observe the subtracted waveform as shown in the figure below. Those in pink are added waveforms. 3.11 Example 11: Measuring Data Propagation Delay When you doubt that there appear instabilities in a serial data propagation control circuit, you can set the oscilloscope to measure the propagation delay between the enable signal and the transfer data. - Page 77 DATA DATA DSO4000 Series Digital Storage Oscilloscope...
-
Page 78: Chapter 4 Troubleshooting
Chapter 4 Troubleshooting 4.1 Problem Settlement 1. If the oscilloscope does not start up at power on, follow these steps: 1) Check the power cord to verify it has been connected properly; 2) Check the power on/off button to ensure it has been pushed; 3)... -
Page 79: Chapter 5 Specifications
Waveform Interpolation (sin x)/x Maximum 40K samples per single-channel; maximum 20K Record Length samples per dual-channel (4K, 20K optional) DSO4072 DSO4102 DSO4202 SEC/DIV Range 4ns/div to 40s/div, in a 2, 4, 8 2ns/div to 40s/div, in a 2, 4, sequence... - Page 80 Average Acquisition Mode conditions Note: Bandwidth reduced to 6MHz when using a 1X probe. Trigger Coupling Sensitivity Source DSO4072, DSO4102 DSO4202 1.5div from 10MHz 1div from DC to 10MHz; to 100MHz; 1.5div from 10MHz to...
- Page 81 Specifications 1V from DC to 100MHz; EXT/5 1V from DC to 100MHz 1.75V from 100MHz to 200MHz Attenuates signals below 10Hz HF Reject Attenuates signals above 80kHz Same as the DC-coupled limits for frequencies above LF Reject 150kHz; attenuates signals below 150kHz Source Range CH1, CH2...
- Page 82 Specifications Slope Trigger Trigger when < (Less than), > (Greater than), = (Equal), or ≠ (Not Equal); Slope Trigger Mode Positive slope or Negative slope Equal: The oscilloscope triggers when the waveform slope is equal to the set slope. Not Equal: The oscilloscope triggers when the waveform slope is not equal to the set slope.
- Page 83 Specifications Inputs Inputs Input Coupling DC, AC or GND Input Impedance, 1MΩ±2% in parallel with 20pF± 3pF DC coupled Probe Attenuation 1X, 10X Supported Probe 1X, 10X, 100X, 1000X Attenuation Factors Overvoltage Category Maximum Voltage CAT I and CAT II 300V (10×), Installation Category CAT III...
- Page 84 Specifications Environmental Operating: 32℉ to 122℉ (0℃ to 50℃) Temperature Nonoperating: -40℉ to 159.8℉ (-40℃ to +71℃) Cooling Method Convection +104℉ or below (+40℃ or below): ≤90% relative humidity Humidity 106℉ to 122℉ (+41℃ to 50℃): ≤60% relative humidity Altitude Operating and Nonoperating 3,000m (10,000 feet) 0.31g...
-
Page 85: Accessories
Specifications 5.2 Accessories All the following accessories are available. Standard Accessories Sketch Description X1, X10 two passive probes. The passive probes have a 6MHz bandwidth (rated 100Vrms CAT III) when the switch is in the X1 position, and a maximum bandwidth (rated 300Vrms CAT II) when the switch is in the X10 position. -
Page 86: Chapter 6 General Care And Cleaning
Chapter 6 General Care and Cleaning 6.1 General Care Do not put or leave the device in a place where the LCD display will be exposed to direct sunlight for long periods of time. Note: To avoid damage to the oscilloscope or probes, do not expose them to sprays, liquids, or solvents. - Page 87 Appendix A Harmful and Poisonous Substances or Elements Harmful and poisonous substances or elements Component Cr(Vi) PBDE Shell and Chassis Display Module Circuit Board Power Supply Electric Wire and Cable Assembly Connector Fastener and Installed Hardware Other Accessories (including probes) Others ‘X’...
Need help?
Do you have a question about the DSO4072 and is the answer not in the manual?
Questions and answers