
Related Manuals for Hantek DSO8072E


Summary of Contents for Hantek DSO8072E
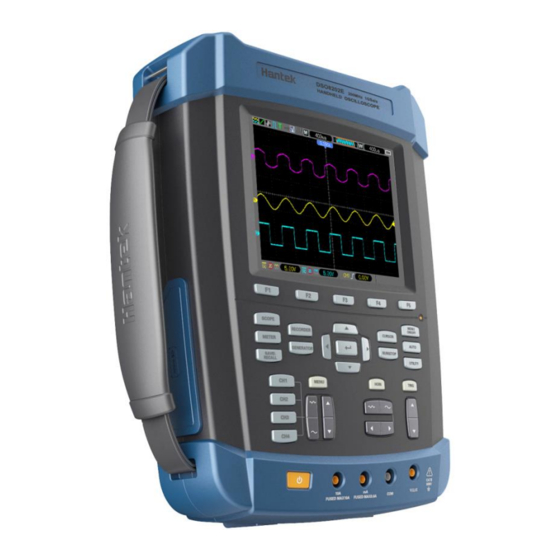
- Page 1 DSO8000E SERIES HANDHELD OSCILLOSCOPE USER’S MANUAL 8072E/8102E/8152E/8202E (V1.0.1)...
-
Page 2: Table Of Contents
Contents Contents Contents ............................i Copyright Declaration ........................iv Chapter 1 Safety Tips ......................... 1 General Safety Summary ....................1 Safety Terms and Symbols ....................1 Terms on Product ....................... 2 Symbols on Product ......................2 Product Scrapping ......................2 Chapter 2 Overview ........................ - Page 3 Contents Vertical Controls ....................... 26 5.3.1 Math FFT ........................28 Trigger Controls ....................... 33 Menu and Option Buttons ....................39 5.5.1 SAVE/RECALL ......................39 5.5.2 MEASURE ........................ 40 5.5.3 UTILITY ........................42 5.5.4 DISPLAY ........................43 5.5.5 ACQUIRE ......................... 44 5.5.6 CURSOR ........................
- Page 4 Contents 11.1 Technical Specifications ....................93 11.2 Accessories ........................99 11.3 Open Source Information ....................100 License: GPLV2 See Appendix B ..................100 Chapter 12 General Care and Cleaning ................101 12.1 General Care ......................... 101 12.2 Cleaning ......................... 101 12.3 Battery Replacement .....................
-
Page 5: Copyright Declaration
Hantek reserves all rights to modify this document without prior notice. Please contact Hantek for the latest version of this document before placing an order. Hantek has made every effort to ensure the accuracy of this document but does not guarantee the absence of errors. Moreover, Hantek assumes no responsibility in obtaining permission and authorization of any third party patent, copyright or product involved in relation to the use of this document. -
Page 6: Chapter 1 Safety Tips
Safety Tips Chapter 1 Safety Tips General Safety Summary Read the following safety precautions to avoid injury and prevent damage to this product or any products connected to it. To evade potential hazards, use this product only as specified. Only qualified personnel should perform maintenance. Avoid fire or personal injury. -
Page 7: Terms On Product
Safety Tips Terms on Product The following terms may appear on the product: DANGER indicates an injury hazard immediately accessible as you read the marking. WARNING indicates an injury hazard not immediately accessible as you read the marking. CAUTION indicates a possible hazard to this product or other property. Symbols on Product The following symbols may appear on the product: Protective... -
Page 8: Chapter 2 Overview
Overview Chapter 2 Overview Brief Introduction to DSO8000E Series Model Channel Bandwidth Sample Rate DSO8072E 70MHz 1GS/s 5.6 TFT DSO8102E 100MHz 1GS/s 5.6 TFT DSO8152E 150MHz 1GS/s 5.6 TFT DSO8202E 200MHz 1GS/s 5.6 TFT Table 2-1 Model List of DSO8000E Series DSO8000E Series oscilloscopes cover the bandwidths from 70MHz to 200MHz, and provide the real-time and equivalent sample rates respectively up to 1GSa/s and 25GSa/s. -
Page 9: Ports And Extentions
Overview Ports and Extentions On the right side of the unit, Power Input DC 12V, 3000mA Probe calibration signal output 1 KHz, 2Vpp Type USB-A port for USB flash disk LAN/Wifi connection port (optional) Mini USB OTG port On the left side of the unit, Headphone, not available for this product. -
Page 10: Chapter 3 Getting Started Guide
Getting Started Guide Chapter 3 Getting Started Guide Installation To keep proper ventilation of the oscilloscope in operation, leave a space of more than 5cm away from the top and the two sides of the product. Functional Check Follow the steps below to perform a quick functional check to your oscilloscope. 3.2.1 Power on the oscilloscope Press the ON/OFF button. -
Page 11: Observe The Waveform
Getting Started Guide PROBE COMP 3.2.3 Observe the waveform Press the AUTO button and you should see within a few seconds a square wave of about 2V peak-to-peak at 1KHz in the display. Press the CH1 MENU button and remove Channel 1. Push the CH2 MENU button and repeat Step 2 and Step 3 to observe Channel 2. -
Page 12: Use Of Probe Check Wizard
Getting Started Guide 3.3.2 Use of Probe Check Wizard Every time you connect a probe to an input channel, you should use the probe check wizard to verify that this probe is operating correctly. There are two ways to do this: 1)... -
Page 13: Probe Attenuation Setting
Getting Started Guide necessary. See the figure below for the way of adjustment. Probe Attenuation Setting Probes are of various attenuation factors which affect the vertical scale of the signal. The Probe Check function is used to verify if the Probe attenuation option matches the attenuation of the probe. -
Page 14: Communication With Pc
Getting Started Guide Communication with PC 3.7.1 Install software Caution: You must install the software before using the oscilloscope with Windows PC. 1. While in Windows, insert the installation CD into the CD-ROM drive. 2. The installation should start up automatically. Otherwise in Windows Explorer, switch to the CD-ROM driver and run Setup.exe. - Page 15 Getting Started Guide 4. Choose a destination directory. Click ‘Next’ to continue. 5. Check the setup information. Click Next to start copying of files. 6. This Status dialog is displayed during copying of files. DSO8000E Series HandHeld Oscilloscope User Manual...
- Page 16 Getting Started Guide 7. Updating your system configuration. 8. The installation is complete DSO8000E Series HandHeld Oscilloscope User Manual...
-
Page 17: Install Driver
Getting Started Guide 3.7.2 Install driver Caution: You must install the driver before connect the device with Windows PC via USB cable. 1. Connect the A-Type Plug of USB cable to your PC’s USB port. 2. Connect the B-Type Plug of USB cable to DSO’s USB port. 3. - Page 18 Getting Started Guide 5. New hardware search wizard starts to search the drive. 6. New hardware wizard installs software DSO8000E Series HandHeld Oscilloscope User Manual...
- Page 19 Getting Started Guide 7. Finish new hardware search wizard. 12. Your new hardware is installed and ready to use. DSO8000E Series HandHeld Oscilloscope User Manual...
- Page 20 Getting Started Guide 13. Now you can open the software to use. DSO8000E Series HandHeld Oscilloscope User Manual...
-
Page 21: Chapter 4 Main Feature Description
Main Feature Description Chapter 4 Main Feature Description This chapter provides some general information that you need to learn before using an oscilloscope. It contains: 1. Oscilloscope setup 2. Trigger 3. Data acquisition 4. Waveform scaling and positioning 5. Waveform measurement Oscilloscope Setup While operating the oscilloscope, you may often use thr feature: Autoset. -
Page 22: Data Acquisition
Main Feature Description two different frequencies. Mainly it uses a specific frequency to switch between two analog channels CH1 and CH2 so that the channels will generate alter trigger signals through the trigger circuitry. Trigger Mode: You can select the Auto or Normal mode to define how the oscilloscope acquires data when it does not detect a trigger condition. -
Page 23: Waveform Scaling And Positioning
Main Feature Description the input signal over each sample interval and uses these values to display the waveform. In this way, the oscilloscope can acquire and display those narrow pulses that may have otherwise been missed in Normal mode. However, noise will appear to be higher in this mode. Average: In this acquisition mode, the oscilloscope acquires several waveforms, averages them, and displays the resulting waveform. -
Page 24: Waveform Measurement
Main Feature Description Waveform Measurement The oscilloscope displays graphs of voltage versus time and can help to measure the displayed waveform. There are several ways to take measurements, using the graticule, the cursors or performing an automatic measurement. Graticule: This method allows you to make a quick, visual estimate and take a simple measurement through the graticule divisions and the scale factor. -
Page 25: Chapter 5 Basic Operation
Basic Operation Chapter 5 Basic Operation The front panel of the oscilloscope is divided into several functional areas. In this chapter we will give a quick overview of all control buttons on the front panel as well as the displayed information on the screen and relative testing operations. -
Page 26: Displayarea
23. UTILITY: Shows Utility menu 24. SAVE RECALL: Shows SAVE or RECALL menu 25. RECORDER: 26. SCOPE/DMM: Switch DMM, Scope function or Waveform Generator function interface. 27. CURSOR: Shows Cursor menu DisplayArea Hantek logo Display Format: : YT : XY : Vectors : Dots : Gray indicates auto persistence;... - Page 27 Basic Operation Acquisition Mode: Normal, Peak Detect or Average Trigger Status: The oscilloscope is acquiring pretriggered data. All pretriggered data have been acquired and the oscilloscope is ready to accept a trigger. The oscilloscope has detected a trigger and is acquiring the posttrigger information. The oscilloscope works in auto mode and is acquiring waveforms in the absence of triggers.
-
Page 28: Xy Format
Basic Operation Window Time Base Operating Menu shows different information for different function keys. 10. Trig Level. 11. Trigger Type: : Edge trigger on the rising edge. : Edge trigger on the falling edge. : Video trigger with line synchronization. : Video trigger with field synchronization. -
Page 29: Horizontal Controls
Basic Operation Horizontal Controls Use the horizontal controls to change the horizontal scale and position of waveforms. The horizontal position readout shows the time represented by the center of the screen, using the trigger time as zero. When you change the horizontal scale, the waveform will expand or contract to the screen center. - Page 30 Basic Operation This function is usable in dual-window mode. Push this menu button and auto move it from left to right at a Play/Stop specified speed. In the expanded window will display corresponding waveforms until it stops once reaching the rightmost side of the major scan window.
-
Page 31: Scan Mode Display (Roll Mode)
Basic Operation 5.2.1 Scan Mode Display (Roll Mode) With the TIME/DIV control set to 80ms/div or slower and the trigger mode set to Auto, the oscilloscope works in the scan acquisition mode. In this mode, the waveform display is updated from left to right without any trigger or horizontal position control. - Page 32 Basic Operation Ground Coupling Use to display a zero-volt waveform. Internally, the channel input is connected with a zero-volt reference level. Fine Resolution In the fine resolution setting, the vertical scale readout displays the actual VOLTS setting. The vertical scale changes only after you adjust the VOLTS control and set to coarse. Remove Waveform Display To remove a waveform from the screen, first push the menu button to display the vertical menu, then push again to remove the waveform.
-
Page 33: Math Fft
Basic Operation 5.3.1 Math FFT This chapter elaborates how to use the Math FFT (Fast Fourier Transform). You can use the Math FFT mode to convert a time-domain (YT) signal into its frequency components (spectrum), and to observe the following types of signals: ... - Page 34 Basic Operation 2. Set the Operation option to FFT; 3. Select the Math FFT Source channel. In many situations, the oscilloscope can also generate a useful FFT spectrum despite the YT waveform not being triggered. This is especially true if the signal is periodic or random (such as noise).
- Page 35 Basic Operation Fundamental frequency component Frequency component 1. Frequency at the center graticule line 2. Vertical scale in dB per division (0dB=1V 3. Horizontal scale in frequency per division 4. Sample rate in number of samples per second 5. FFT window type 5.3.1.3 Selecting FFT Window Using windows can eliminate the spectral leakage in the FFT spectrum.
- Page 36 Basic Operation Applying a window to the YT waveform changes the waveform so that the start and stop values are close to each other, which reduces the discontinuities. The Math FFT function has three FFT Window options. There is a trade-off between frequency resolution and amplitude accuracy for each type of window.
- Page 37 Basic Operation Bartlett Single frequency waveforms, to Best magnitude, worst Blackman frequency resolution. Find higher order harmonics. 5.3.1.4 FFT Aliasing Problems occur when the time-domain waveform acquired by the oscilloscope contains frequency components higher than the Nyquist frequency. The frequency components above the Nyquist frequency will be undersampled and displayed as lower frequency components that ‘fold back’...
-
Page 38: Trigger Controls
Basic Operation Vertical Zoom and Position When the FFT spectrum is being displayed, the channel vertical keys become the zoom and position controls corresponding to their respective channels. The VOLTS key provides the following zoom factors: X1(default), X2, X5 and X10. The FFT spectrum is magnified vertically to the marker M (math waveform reference point on the left edge of the screen). - Page 39 Basic Operation TRIG Level It sets the amplitude level the signal must cross to cause an acquisition when using the Edge or Pulse Width trigger. TRIG MENU TRIG Level Options Settings Comments Trigger Type By default the oscilloscope uses the edge trigger which Edge triggers the oscilloscope on the rising or falling edge of the input signal when it crosses the trigger level (threshold).
- Page 40 Basic Operation Options Settings Comments With Video highlighted, an NTSC, PAL or SECAM Video standard video signal will be triggered. The trigger coupling is preset to AC. Select the input source as the trigger signal. Ext/5 use Source the signal applied to the EXT TRIG connector as the EXT/5 source.
- Page 41 Basic Operation Triggers when pulse is Triggers when pulse is less than width setting greater than width setting Threshold level Triggers when pulse is Triggers when pulse is not equal to width setting ± 5% equal to width setting ± 5% Threshold level Tolerance Tolerance...
- Page 42 Basic Operation Alter Trigger: As a feature of analog oscilloscopes, it gives stable displays of signals at two different frequencies. Mainly it uses a specific frequency to switch between two analog channels CH1 and CH2 so that the channels will generate Alter trigger signals through the trigger circuitry. Options Settings Comments...
- Page 43 Basic Operation positive Polarity Negative Overtime 20ns to 10.0sec Set the time span. Selects the components of the trigger signal applied to the Coupling Noise Reject trigger circuitry. HF Reject LF Reject Overtime Trigger: In Pulse Width trigger, you may sometimes be puzzled with the long time for trigger, as you do not need a complete pulse width to trigger the oscilloscope, but want the trigger occurs just upon the overtime point.
-
Page 44: Menu And Option Buttons
Basic Operation Menu and Option Buttons As shown below, these four buttons at the front panel are used mainly to recall relative setup menus. SAVE/RECALL: Displays the Save/Recall menu for setups and waveforms. MEASURE: Displays the Measure menu. UTIILITY: Displays the Utility menu. CURSOR: Displays the Cursor menu. -
Page 45: Measure
Basic Operation oscilloscope to a known setup. Options Settings Comments Source Select a waveform channel to store. Open File List Open or Close File List. Close Save Save the source waveform to the selected location. Recall Display the reference waveform on the screen USB disk Media Delete waveform. - Page 46 Basic Operation Measure the time between 90% and 10% of the first falling Falling edge of the waveform. Measure the time between the first rising edge and the next + Width falling edge at the waveform 50% level. Measure the time between the first falling edge and the next - Width rising edge at the waveform 50% level.
-
Page 47: Utility
Basic Operation The readouts in big font size on the menu are just results of the corresponding measurements. Taking Measurements: For a single waveform (or a waveform divided among multiple waveforms), up to 4 automatic measurements can be displayed at a time. The waveform channel must stay in an ‘ON’... -
Page 48: Display
Basic Operation Self Cal: The self calibration routine can optimize the precision of the oscilloscope to fit the ambient temperature. To maximize the precision, you should perform the self calibration once the ambient temperature changes by 5℃ or more. Follow the instructions on the screen. Shutdown Press “UTILITY”... -
Page 49: Acquire
Basic Operation Contrast 0-15 16 ranks adjustable. Dotted line Off only displays the horizontal and vertical Grid Real line coordinates at the center graticule on the screen. Grid Intensity 0-15 16 ranks adjustable. Auto 50 Frames Refresh Rate 40 Frames 30 Frames Wave Bright 0-15 16 ranks adjustable. - Page 50 Basic Operation Normal Acquisition Intervals Sample Points Normal Mode Acquires a Single Sample Point in Each Interval Peak Detect: Use this mode to detect glitches within 10ns and to limit the possibility of aliasing. This mode is valid at the TIME/DIV setting of 4µs/div or slower. Once you set the TIME/DIV setting to 4µs/div or faster, the acquisition mode will change to Normal because the sample rate is fast enough that Peak Detect is unnecessary.
-
Page 51: Cursor
Basic Operation 5.5.6 CURSOR The Cursor Menu Options Settings Comments Select a measurement cursor and display it. Type Voltage Voltage measures amplitude while Time measures time and Time frequency. Select a waveform to take the cursor measurement. Source MATH Use the readouts to show the measurement. REFA REFB S indicates Cursor 1. -
Page 52: Fast Action Buttons
Basic Operation Fast Action Buttons AUTORANGE: Automatically set the oscilloscope controls to generate a usable display of the input signals in real time. AUTOSET: Automatically set the oscilloscope controls to generate a usable display of the input signals. Refer to the following table for relative content. RUN/STOP: Continuously acquire waveforms or stop the acquisition. -
Page 53: Signal Connectors
Basic Operation frequency signal as the trigger source. If no signals are found, the oscilloscope will use the lowest-numbered channel displayed in Autoset as the trigger source. If no signals are found and no channels are displayed, the oscilloscope will display and use Channel 1 as the trigger source. - Page 54 Basic Operation PROBE COMP 1. CH1, CH2: Input connectors for waveform display, through which to connect and input the signal to be measured. 2. OUTPUT: Waveform output BNC connector. 3. EXT TRIG/SYNC: Input connector for an external trigger source, though with to connect and input the external trigger signal.
-
Page 55: Chapter 6 Application Examples
Application Examples Chapter 6 Application Examples This chapter unfolds a further description on main features of the oscilloscope by giving eleven simplified application examples for reference to help solve your own test problems. Taking simple measurements Using AUTO Using the Measure menu to take auto measurements Taking cursor measurements Measuring ring frequency and ring amplitude Measuring pulse width... - Page 56 Application Examples The oscilloscope will automatically set the waveform to a best display. If you want to further optimize the waveform display, you may manually adjust the vertical and horizontal controls until the waveform meets your particular requirement. Taking Auto Measurements The oscilloscope can display most signals by automatic measurements.
-
Page 57: Example 2: Taking Cursor Measurements
Application Examples Example 2: Taking Cursor Measurements You can use the cursor to quickly measure the time and amplitude of a waveform. Measuring Ring Time (convertible to Frequency) and Amplitude on Rising Edge of Pulse To measure the ring time on the rising edge of the pulse, follow the steps below. Push the CURSOR button to view the Cursor menu. - Page 58 Application Examples Measuring Pulse Width To analyze a pulse signal and to know its width, follow the steps below. Push the CURSOR button to view the Cursor menu. Push F1 the Type option button and select Time. Push F2 the Source option button and select CH1. Select a cursor.
- Page 59 Application Examples Measuring Rise Time of Pulse You may need to measure the rise time of the pulse in many application environments, usually, to measure the rise time between the 10% and 90% levels of the pulse waveform. To do so, follow the steps below.
-
Page 60: Example 3: Analyzing Input Signals To Eliminate Random Noise
Application Examples 5 divisions Example 3: Analyzing Input Signals to Eliminate Random Noise In certain circumstances, to display a noisy signal on the oscilloscope and to get its details, you may follow the steps below to analyze this signal. Observing Noisy Signal Enter the Acquire menu. -
Page 61: Example 4: Capturing Single-Shot Signal
Application Examples Eliminating Random Noise Enter the Acquire menu. Push the Type option button and select Real Time. Push the Average option button. Push the Averages option button and adjust the number of running averages to watch the change in the waveform display. Note: Averaging reduces random noise and let you view the signal details more easily. -
Page 62: Example 5: Using X-Y Mode
Application Examples To set for a single-shot acquisition, follow the steps below. First, set up the oscilloscope probe and the attenuation factor of CH1. Click the vertical VOLTS and horizontal TIME/DIV keys to a proper position for a better examination of the signal. Enter the Acquire menu. -
Page 63: Example 6: Triggering On Pulse Width
Application Examples Click the VOLTS keys to display approximately the same amplitude signals on each channel. Enter the Display menu. Push the DSO Mode button and select XY. Now the oscilloscope displays a Lissajous pattern to characterize the input and output of the circuit. -
Page 64: Example 7: Triggering On Video Signal
Application Examples Push the AUTO button to trigger a stable waveform display. Push the Single Cycle option button in the Autoset menu and read out the signal pulse width. Push the TRIG MENU button. Select Pulse for the Type option; Select CH1 for the Source option; Click the TRIGGER LEVEL key to set the trigger level at the bottom of the signal. - Page 65 Application Examples Push the Source option button to select CH1; push the Polarity option button to select Normal; push the Standard option button to select NTSC. Push the Sync option button to select Odd Field, Even Field or All Fields. Push the Trigger Level button to adjust the trigger level and stabilize video signals.
-
Page 66: Example 8: Using Slope Trigger To Capture Particular Slope Signal
Application Examples Example 8: Using Slope Trigger to Capture Particular Slope Signal In many occasions, we are not only concerned about the edge of the signal, but also want to know the rise and fall times of the signal. To better observe this kind of signals, we bring in the slope trigger. -
Page 67: Example 9: Using Overtime Trigger To Measure Long Pulse Signal
Application Examples Example 9: Using Overtime Trigger to Measure Long Pulse Signal It is not easy to observe some part of a long pulse signal by using the edge or pulse width trigger. In such case, you can use the overtime trigger by following steps. Push the TRIG MENU button to see the Trigger menu. -
Page 68: Example 10: Using Math Functions To Analyze Waveforms
Application Examples Note: The difference between the overtime and the delay triggers is that the overtime trigger can identify the pulse you need according to your set time and trigger on any point of the pulse. In the other word, the overtime trigger occurs based on pulse identification. It is similar to the >... -
Page 69: Example 11: Measuring Data Propagation Delay
Application Examples from CH2. Follow the above steps to set up the Math menu, and observe the subtracted waveform as shown in the figure below. Those in pink are added waveforms. 6.11 Example 11: Measuring Data Propagation Delay When you doubt that there appear instabilities in a serial data propagation control circuit, you can set the oscilloscope to measure the propagation delay between the enable signal and the transfer data. -
Page 70: Example 12: Back Light Control
Application Examples 10. Read the data propagation delay in the Delta readout. DATA DATA 6.12 Example 12: Back light control 1. Press the UTILITY button, entering the UTILITY menu. 2. Press F5 to page down. 3. After reaching the page four, then press F3 to enter the Display menu. 4. -
Page 71: Example 13: Auto Shut Down
Application Examples 6.13 Example 13: Auto shut down 1. Press the UTILITY button, entering the UTILITY menu. 2. Press F5 to page down. 3. After reaching the page two, then press F3 to enter the Shutdown menu. 4. Press F1 button to select PowerOff, press F2 to select Time then set the time using the direction button. -
Page 72: Chapter 7 Multimeter
Multimeter Chapter 7 Multimeter About this chapter This chapter provides an introduction to the multimeter functions of DSO8000E Series. The introduction gives guides to show how to use the menus and perform basic measurements. Connecting the Meter Use the 4-mm safety banana jack inputs for the Meter functions: 10A , mA, COM,V/Ω/C. Multimeter Operation Window Figure 7-1 Multimeter operation window Description... - Page 73 Multimeter 9) Measure type, including VOLT, A, OHM, DIODE, CON, CAP. Operating the Multimeter If you are in the oscilloscope window, press SCOPE/DMM key, the oscilloscope will switch to the multimeter mode window.Then the screen will display the measure mode window that was in use the last time before you quit multimeter measure.
- Page 74 Multimeter Figure 7-3 Diode Measurement Making an On-off Measurement To perform an On-off test, do the following: 1) Press the F1 key to select CON and then On-off indictor appears on the top of the screen. 2) Insert the black lead into the COM banana jack input and the red lead into the V/O/C banana jack input.
- Page 75 Multimeter Making a Capacitance Measurement To measure a capacitance, do the following: 1) Press the F1 key to select CAP and a capacitor symbol appears on the top of the screen. 2) Insert the black lead into the COM banana jack input and the red lead into the V/O/C banana jack input.
- Page 76 Multimeter Figure 7-6 DC voltage Measurement Making an AC Voltage Measurement To measure the AC voltage, do the following: 1) Press the F1 key to select VOLT and DC appears on the screen. 2) Press the F2 key and AC appears on the screen. 3) Insert the black lead into the COM banana jack input and the red lead into the V/O/C banana jack input.
- Page 77 Multimeter To measure a DC current which is less than 600 mA , do the following: 1) Press the F1 key to select A and then DC appears on the screen. The unit on the main reading screen is mA. Press F3 to switch the measurement between mA and 10A. 600mA is acquiescently. 2) Insert the black lead into the COM banana jack input and the red lead into the mA banana jack input.
- Page 78 Multimeter Figure 7-9 DC Current Measurement for 10A Making an AC Current Measurement To measure an AC current which is less than 600 mA, do the following: 1) Press the F1 key to select A and then DC appears on the screen. The unit on the main reading screen is mA,and mA will display on the bottom of the screen, press F2 to switch the measurement between mA and 10A.
- Page 79 Multimeter To measure an AC current which is larger than 600 mA, do the following: 1) Press the F1 key to select A and then DC appears on the screen. The unit on the main reading screen is mA. 2) Press F3 key to switch to10A measurement, the unit on the main reading screen is A. 3) Press the F1 key once and AC will display on the bottom of the screen.
- Page 80 Multimeter Figure 7-12 Relative Measurement Selecting Automatic/Manual Range Adjustment The default range mode of the instrument is automatic range. Suppose you are using the DC voltage mode, to switch to the manual range, perform the following steps: 1) Press F3 key to enter the manual range mode and then Manual is displayed on the top of the screen.
-
Page 81: Chapter 8 Recorder
Recorder Chapter 8 Recorder About this Chapter This chapter provides a step-by-step introduction to the recorder functions of DSO8000E series Handheld Digital Oscilloscope. The introduction gives basic examples to show how to use the menus and perform basic operations. The recorder mainly includes the following functions: Trend Plot: Trend plot is to save the measurements in the memory and then plot a graph of Scope or Meter measurements as a function of time. -
Page 82: Multimeter Trend
Recorder Multimeter Trend 1. Current recorded time 2. The percentage of the current data in the whole memory 3. The parameter value of the recorded data at the moment 4. The real time 5. The sample time of the cursor point. 6. - Page 83 Recorder Display mode normal Display the recorded data up to the minute. All view Display all dots. Record Status Record data automatically Stop Stop record data Enter the second page of the menu Manual Record data automatically Record data manually. A Record presses a record. Save Save the trend to the U disk or SD.
-
Page 84: Oscilloscope Trend
Recorder Oscilloscope Trend Scope Trend Function Menu Option Setting Instruction Restart Quilt the current data and start to record afresh. Source Select the source CH1, CH2 Param Choose the Mean, Pk-Pk, Frequency, Period, Minimum, Maximum parameter to be measured. Status Continue recording data Stop Stop or continue recording data... -
Page 85: Waveform Recorder
Recorder 【F4】to save the trend. 9. At the second page of the menu, press File List: Open or close the file list. Save: Save the trend to the U disk. Recall: Recall the trend from the U disk. Return: Return to the previous page. Media: Choose a place to save. - Page 86 Recorder Waveform Recorder Replaying Mode Function Menu Option Instruction Start Pause playing waveform automatically, you can change the time base to observe the waveform in the memory. Pause Continue playing waveform automatically, you can change the time base to observe the waveform in the memory. Restart Replay the waveform Mode...
- Page 87 Recorder 5. Press 【F2】to replay waveform. You can replay the recorded waveform for several times and you can Prev or Next at any time. 6. Press 【F5】to exit the waveform recorder. DSO8000E Series HandHeld Oscilloscope User Manual...
-
Page 88: Chapter 9 Waveform Generator
Waveform Generator Chapter 9 Waveform Generator DSO8000E Series oscilloscope is equipped with waveform generator function, with one channel of arbitrary waveform output, 8 Bits output, synchronized signal out puts. User can edit the waveform by the mouse or choose the regular waveforms such as Sine, Ramp, Square, Trapezia, DC, Exponent, AM/FM. - Page 89 Waveform Generator Duty: The duty of the output wave. Generate the Trapezia waveform To output a Trapezia wave, please do the following steps: 1. Press F2 button to select "Trap". 2. Set the Wave Parameter: Frequency: Set the output wave frequency. Amplitude: Set the output wave amplitude.
- Page 90 Waveform Generator Output waveform: Set output type to continuous, single or OFF. Continuous: Continuous output waveform. Ext Trig: When an edge of the external trigger signal is triggered, even if the external trigger signal is disconnected, the waveform can be output continuously. If the external trigger signal is disconnected, only when the settings are changed, the settings in the front will be cleared.
-
Page 91: Generate Arbitrary Waveform
Waveform Generator Generate Arbitrary waveform User can edit arbitrary waveform directly under DDS interface for the device, or use DDS_ARB software to generate a waveform file and load it again. 9.2.1 Edit Arb waveform by DDS_ARB User can use DDS-ARB software to edit arbitrary waveform. 1. - Page 92 Waveform Generator Utility: Click “Utility->Language” to change language to English or Chinese. 4. Edit arbitrary waveform by software Double-click the icon to open the software. Click “Wave Parameter->Parameter” to set waveform frequency. Click “Wave Parameter->Arb” and drag left mouse to edit points. DSO8000E Series HandHeld Oscilloscope User Manual...
- Page 93 Waveform Generator Also user can click “Edit->Points Edit” to set pointindex and voltage. Click “Wave Parameter->Download” to download the edited waveform to DSO8000E, then you can view the waveform by oscilloscope as follows: Also, user can click “File->Save CSV”, and save CSV file to U disk or other paths. The time interval between two points The quantity of the points per cycle DSO8000E Series HandHeld Oscilloscope User Manual...
-
Page 94: Edit Arb Waveform By Slave Computer
Waveform Generator The relation: Frequency = Size∗Deltatime Insert U disk to the USB port of the device, select wave as "Arb". Then press "Recall" menu to recall saved file. View the waveform by oscilloscope as follows: 9.2.2 Edit Arb waveform by slave computer 1. - Page 95 Waveform Generator When an edge of the external trigger signal is triggered, even if the external trigger signal is disconnected, the waveform can be output continuously. If the external trigger signal is disconnected, only when the settings are changed, the settings in the front will be cleared. Sync: Synchronized output port: Only for the model with waveform generator function.
- Page 96 Waveform Generator Attention: For the editing of arbitrary waveform, DDS-ARB is much more convenient than slave computer. So it is recommended to use DDS-ARB to edit arbitrary waveform. DSO8000E Series HandHeld Oscilloscope User Manual...
-
Page 97: Chapter 10 Troubleshooting
Troubleshooting Chapter 10 Troubleshooting 10.1 Problem Settlement 1. If the oscilloscope does not start up at power on, follow these steps: 1) Check the power cord to verify it has been connected properly; 2) Check the power on/off button to ensure it has been pushed; 3)... -
Page 98: Chapter 11 Specifications
1GS/s Waveform Interpolation (sin x)/x Maximum 2M samples per single-channel; maximum 1M Record Length samples per dual-channel (4K, 40K, 512K, 1M optional) DSO8072E DSO8152E DSO8102E DSO8202E TIME/DIV Range 4ns/div to 2Ks/div, in a 2, 4, 8 2ns/div to 2Ks/div, in a 2, 4,... - Page 99 Position Range ±2V(200mV/div-50mV/div) ±400mV(20mV/div-2mV/div) Selectable Analog Bandwidth Limit, 20MHz typical ≤10Hz at BNC Low Frequency Response (-3db) DSO8072E DSO8102E DSO8152E DSO8202E Rise Time at BNC, typical <3.5ns ≤2.3ns <5.0ns <1.8ns ± 3% for Normal or Average acquisition mode, 100V/div to 10mV/div DC Gain Accuracy ±...
- Page 100 Specifications 1V from DC to 100MHz; EXT/5 1V from DC to Full 1.75V from 100MHz to Full Attenuates signals below 10Hz HF Reject Attenuates signals above 80kHz Same as the DC-coupled limits for frequencies above LF Reject 150kHz; attenuates signals below 150kHz Source Range Trigger Level Range...
- Page 101 Specifications Slope Trigger Trigger when < (Less than), > (Greater than), = (Equal), or ≠ (Not Equal); Slope Trigger Mode Positive slope or Negative slope Equal: The oscilloscope triggers when the waveform slope is equal to the set slope. Not Equal: The oscilloscope triggers when the waveform slope is not equal to the set slope.
- Page 102 Specifications Inputs Input Coupling DC, AC or GND Input Impedance, 1MΩ± 2% in parallel with 20pF± 3pF DC coupled Probe Attenuation 1X, 10X Supported Probe Attenuation 1X, 10X, 100X, 1000X Factors Overvoltage Category Maximum Voltage Maximum Input CAT I and CAT II 300V (10×), Installation Category Voltage...
- Page 103 Specifications Size 260 x 220 x 75(mm) Weight 2.5 Kg Waveform Generator Sine: 1Hz(DC)~30MHz Ramp: 1Hz~10MHz Square: 1Hz~5MHz Frenquency Range Trapezia: 1Hz~3MHz Exponent: 1Hz~60KHz AM/FM: 1Hz~10MHz Arb: 1Hz~25MHz DAC Clock 2K~200MHz adjustable Memory Depth 4KSa Vertical Resolution 12 Bits Stability <30ppm Amplitude ±...
-
Page 104: Accessories
Attention: The smallest capacitance value that can be measured is 5nF. Diode 0V~2.0V On-off Test < 25Ω 11.2 Accessories All the following accessories are available by contacting your local HANTEK distributor. Standard Accessories Two passive probes A Power Adapter A USB cable Two Multimeter Probes ... -
Page 105: Open Source Information
Specifications Open Source Information 11.3 General Information: Kernel Version Linux3.2.35 Supported File system ubi, Fat32 Buzzer Driver, DMA Driver, FPGA Driver, I2C Driver,SPI Driver, Drivers IO-bank Driver, USB Host Driver, LCD Driver, USB massstorage、gadget Driver Linux Applications busybox ,gnupg U_boot Version uboot-2009.11 License: GPLV2 See Appendix B... -
Page 106: Chapter 12 General Care And Cleaning
General Care and Cleaning Chapter 12 General Care and Cleaning 12.1 General Care Do not put or leave the device in a place where the LCD display will be exposed to direct sunlight for long periods of time. Note: To avoid damage to the oscilloscope or probes, do not expose them to sprays, liquids, or solvents. -
Page 107: Chapter 13 Services And Support
Service and Support Chapter 13 Services and Support Thank you for choosing HANTEK. Please contact us through the following ways should you have any inquiry regarding our products. We shall do our best to help you. 1. Contact your local HANTEK distributor;... -
Page 108: Appendix A Harmful And Poisonous Substances Or Elements
Appendix Appendix A Harmful and Poisonous Substances or Elements Harmful and poisonous substances or elements Component Cr(Vi) PBDE Shell and Chassis Display Module Circuit Board Power Supply Electric Wire and Cable Assembly Connector Fastener and Installed Hardware Other Accessories (including probes) Others ‘X’... -
Page 109: Gnu General Public License
Appendix Appendix B GNU GENERAL PUBLIC LICENSE Version 2, June 1991 Copyright (C) 1989, 1991 Free Software Foundation, Inc., 51 Franklin Street, Fifth Floor, Boston, MA 02110-1301 USA Everyone is permitted to copy and distribute verbatim copies of this license document, but changing it is not allowed. - Page 110 Appendix passed on, we want its recipients to know that what they have is not the original, so that any problems introduced by others will not reflect on the original authors' reputations. Finally, any free program is threatened constantly by software patents. We wish to avoid the danger that redistributors of a free program will individually obtain patent licenses, in effect making the program proprietary.
- Page 111 Appendix b) You must cause any work that you distribute or publish, that in whole or in part contains or is derived from the Program or any part thereof, to be licensed as a whole at no charge to all third parties under the terms of this License.
- Page 112 Appendix received the program in object code or executable form with such an offer, in accord with Subsection b above.) The source code for a work means the preferred form of the work for making modifications to it. For an executable work, complete source code means all the source code for all modules it contains, plus any associated interface definition files, plus the scripts used to control compilation and installation of the executable.
- Page 113 Appendix If any portion of this section is held invalid or unenforceable under any particular circumstance, the balance of the section is intended to apply and the section as a whole is intended to apply in other circumstances. It is not the purpose of this section to induce you to infringe any patents or other property right claims or to contest validity of any such claims;...
- Page 114 Appendix OTHER PARTIES PROVIDE THE PROGRAM "AS IS" WITHOUT WARRANTY OF ANY KIND, EITHER EXPRESSED OR IMPLIED, INCLUDING, BUT NOT LIMITED TO, THE IMPLIED WARRANTIES OF MERCHANTABILITY AND FITNESS FOR A PARTICULAR PURPOSE. THE ENTIRE RISK AS TO THE QUALITY AND PERFORMANCE OF THE PROGRAM IS WITH YOU. SHOULD THE PROGRAM PROVE DEFECTIVE, YOU ASSUME THE COST OF ALL NECESSARY SERVICING, REPAIR OR CORRECTION.
- Page 115 Appendix Also add information on how to contact you by electronic and paper mail. If the program is interactive, make it output a short notice like this when it starts in an interactive mode: Gnomovision version 69, Copyright (C) year name of author Gnomovision comes with ABSOLUTELY NO WARRANTY;...
Need help?
Do you have a question about the DSO8072E and is the answer not in the manual?
Questions and answers