
Related Manuals for Hantek DSO5102P


Summary of Contents for Hantek DSO5102P
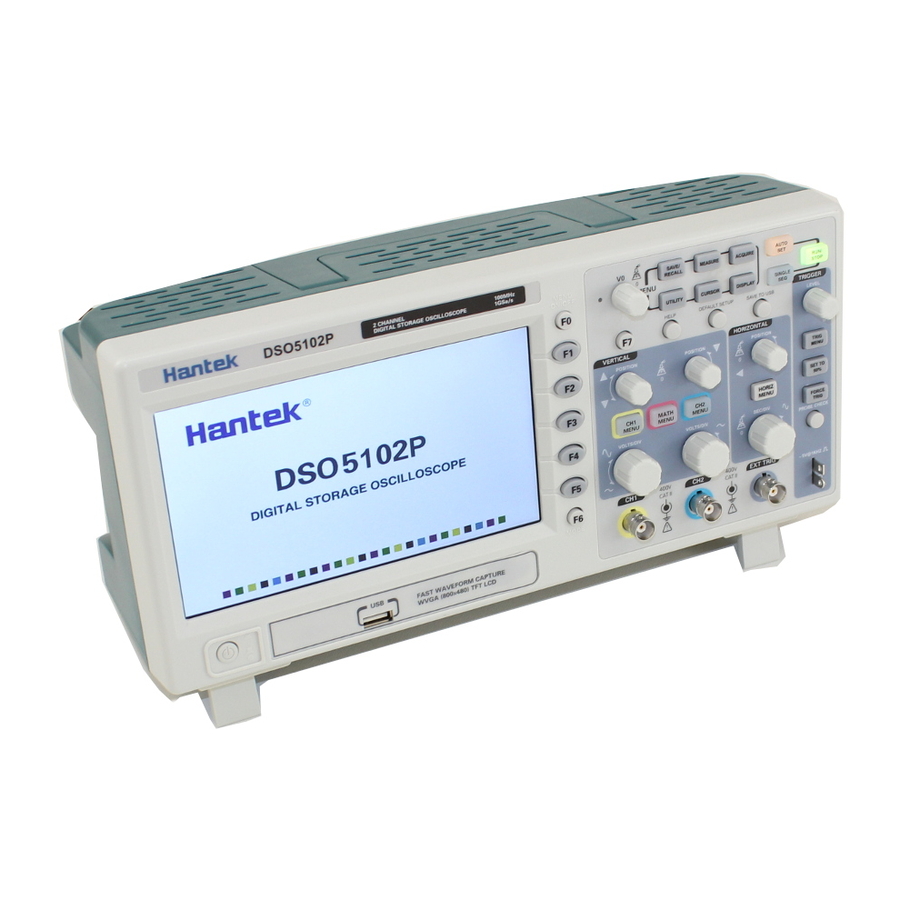
- Page 1 Hantek 100MHz 2 Channel Digital Storage Oscilloscope - DSO5102P Sold and supported in the United States, buy the Hantek DSO5102P at CircuitSpecialists.com...
-
Page 2: Digital Storage Oscilloscope
DSO5000P Series Digital Storage Oscilloscope User Manual (Version 1.1)... -
Page 3: Table Of Contents
Contents Contents Contents ..............................i Chapter 1 Safety Tips ........................1 1.1 General Safety Summary ......................1 1.2 Safety Terms and Symbols ....................... 2 1.3 Terms on Product ........................2 1.4 Symbols on Product ......................... - Page 4 Contents 5.3.1 Math FFT ........................21 5.4 Trigger Controls ........................26 5.5 Menu and Option Buttons....................... 32 5.5.1 Save/Recall ........................32 5.5.2 Measure .......................... 33 5.5.3 Acquire ..........................35 5.5.4 ...
-
Page 5: Chapter 1 Safety Tips
Safety Tips Chapter 1 Safety Tips 1.1 General Safety Summary Read the following safety precautions to avoid injury and prevent damage to this product or any products connected to it. To evade potential hazards, use this product only as specified. Only qualified personnel should perform maintenance. -
Page 6: Safety Terms And Symbols
Safety Tips 1.2 Safety Terms and Symbols .2 Safety Terms and Symbols The following terms may appear in this manual: The following terms may appear in this manual: WARNING. Warning statements point out conditions or practices that could result in injury WARNING. -
Page 7: Chapter 2 Overview
2.1 Brief Introduction to DSO 5000P Series Model Channels Bandwidth Sample Rate DSO5072P 70MHz 1GS/s 7 inch color DSO5102P 100MHz 1GS/s 7 inch color DSO5202P 200MHz 1GS/s 7 inch color Table 2-1 Model List of DSO5000P Series DSO5000P Series oscilloscopes cover the bandwidths from 70MHz to 200MHz, and provide the real-time and equivalent sample rates respectively up to 1GSa/s and 25GSa/s. - Page 8 Overview knob indicate the alternative function of the knob. If a topic uses more than one page, turn the HELP SCROLL knob to move from page to page within the topic. ‹ Hyperlinks Most of the help topics contain phrases marked with angle brackets, such as <Autoset>. They are links to other topics.
-
Page 9: Chapter 3 Getting Started Guide
Getting Started Guide Chapter 3 Getting Started Guide 3.1 Installation To keep proper ventilation of the oscilloscope in operation, leave a space of more than 5cm away from the top and the two sides of the product. 3.1.1 Power Supply Use a power supply that delivers 90 to 240 V , 45 to 440 Hz. -
Page 10: Observe The Waveform
Getting Started Guide CH1: to connect with the probe PROBE COMP 3.2.3 Observe the waveform Press the AUTOSET button and you should see within a few seconds a square wave of about 5V peak-to-peak at 1kHz in the display. Press the CH1 MENU button twice to remove Channel 1. Push the CH2 MENU button and repeat Step 2 and Step 3 to observe Channel 2. -
Page 11: Use Of Probe Check Wizard
Getting Started Guide 3.3.2 Use of Probe Check Wizard Every time you connect a probe to an input channel, you should use the probe check wizard to verify that this probe is operating correctly. There are two ways to do this: 1)... -
Page 12: Probe Attenuation Setting
Getting Started Guide 3.5 Probe Attenuation Setting Probes are of various attenuation factors which affect the vertical scale of the signal. The Probe Check function is used to verify if the Probe attenuation option matches the attenuation of the probe. As an alternative method to Probe Check, you can push a vertical menu button (such as the CH 1 MENU button) and select the Probe option that matches the attenuation factor of your probe. -
Page 13: Chapter 4 Main Feature Description
Main Feature Description Chapter 4 Main Feature Description This chapter provides some general information that you need to learn before using an oscilloscope. It contains: 1. Oscilloscope setup 2. Trigger 3. Data acquisition 4. Waveform scaling and positioning 5. Waveform measurement 4.1 Oscilloscope Setup While operating the oscilloscope, you may often use three features: Autoset, saving a setup and recalling a setup. - Page 14 Main Feature Description trigger channel or the AC power line (only for Edge triggers). The source with the AC power line shows the frequency relationship between the signal and the AC commercial power. Trigger Type: The oscilloscope has six types of triggers: Edge, Video, Pulse Width, Slope, Overtime and Swap.
-
Page 15: Data Acquisition
Main Feature Description 4.3 Data Acquisition When you acquire an analog signal, the oscilloscope will convert it into a digital one. There are two kinds of acquisition: Real-time acquisition and Equivalent acquisition. The real-time acquisition has three modes: Normal, Peak Detect, and Average. The acquisition rate is affected by the setting of time base. -
Page 16: Waveform Measurement
Main Feature Description Horizontal Scale and Position: Pretrigger Information You can adjust the HORIZONTAL POSITION control to view waveform data before the trigger, after the trigger, or some of each. When you change the horizontal position of a waveform, you are actually changing the time between the trigger position and the screen center. - Page 17 Main Feature Description Cursor Cursor Automatic Measurement: The oscilloscope performs all the calculations automatically in this mode. As this measurement uses the waveform record points, it is more precise than the graticule and cursor measurements. Automatic measurements show the measurement results by readouts which are periodically updated with the new data acquired by the oscilloscope DSO5000P Series Digital Storage Oscilloscope User Manual...
-
Page 18: Chapter 5 Basic Operation
Basic Operation Chapter 5 Basic Operation The front panel of the oscilloscope is divided into several functional areas. In this chapter we will give a quick overview of all control buttons and knobs on the front panel as well as the displayed information on the screen and relative testing operations. - Page 19 Basic Operation 1. Display Format: : YT : XY : Vectors : Dots : Gray indicates auto persistence; Green means persistence display is enabled. When the icon is set to green, the time for persistence display will be shown behind it. 2.
-
Page 20: Xy Format
Basic Operation : Pulse Width trigger, positive polarity. : Pulse Width trigger, negative polarity. 13. Pop-up Prompt 14. Readout tells trigger level. 15. Icon indicates whether the waveform is inverted or not. 16. 20M Bandwidth Limit. If this icon lights up, it means the bandwidth limit is enabled, otherwise disabled. - Page 21 Basic Operation oscilloscope also has an arrow icon at the top of the graticule to indicate the horizontal position. 1. HORIZONTAL POSITION Knob: Used to control the trigger position against the screen center. Push this button to reset the trigger point back to the screen center. AN: Used to set the horizontal position as zero.
- Page 22 Basic Operation Single-window Mode Dual-window Mode (Full Screen) Location of expanded window data in memory Major Window Minor Window (Expanded Window) Multi-functional Knob 3.SEC/DIV Knob: Used to change the horizontal time scale so as to magnify or compress the waveform horizontally. If the waveform acquisition is stopped (by using the RUN/STOP or SINGLE SEQ button), the SEC/DIV control will expand or compress the waveform.
-
Page 23: Scan Mode Display (Roll Mode)
Basic Operation Notes: 1. For more information of the trigger holdoff, see Section Trigger Controls. 2. In single-window mode, press F0 to hide or show the menus on the right side. The dual-window mode does not support the menu hiding function. 5.2.1 Scan Mode Display (Roll Mode) With the SEC/DIV control set to 80ms/div or slower and the trigger mode set to Auto, the oscilloscope works in the scan acquisition mode. - Page 24 Basic Operation Options Settings Comments DC passes both DC and AC components of the input signal. AC blocks the DC component of the input signal and Coupling attenuates signals below 10Hz. Ground Ground disconnects the input signal. Limits the bandwidth to reduce display noise; filters the 20MHz Bandwidth Unlimited signal to eliminate noise and other unnecessary HF...
-
Page 25: Math Fft
Basic Operation 5.3.1 Math FFT This chapter elaborates how to use the Math FFT (Fast Fourier Transform). You can use the Math FFT mode to convert a time-domain (YT) signal into its frequency components (spectrum), and to observe the following types of signals: ¾... - Page 26 Basic Operation 2. Set the Operation option to FFT; 3. Select the Math FFT Source channel. In many situations, the oscilloscope can also generate a useful FFT spectrum despite the YT waveform not being triggered. This is especially true if the signal is periodic or random (such as noise).
- Page 27 Basic Operation Fundamental frequency component Frequency component 1. Frequency at the center graticule line 2. Vertical scale in dB per division (0dB=1V 3. Horizontal scale in frequency per division 4. Sample rate in number of samples per second 5. FFT window type 5.3.1.3 Selecting FFT Window Using windows can eliminate the spectral leakage in the FFT spectrum.
- Page 28 Basic Operation Applying a window to the YT waveform changes the waveform so that the start and stop values are close to each other, which reduces the discontinuities. The Math FFT function has three FFT Window options. There is a trade-off between frequency resolution and amplitude accuracy for each type of window.
- Page 29 Basic Operation 5.3.1.4 FFT Aliasing Problems occur when the time-domain waveform acquired by the oscilloscope contains frequency components higher than the Nyquist frequency. The frequency components above the Nyquist frequency will be undersampled and displayed as lower frequency components that ‘fold back’ from the Nyquist frequency.
-
Page 30: Trigger Controls
Basic Operation 5.3.1.7 Using Cursors to Measure FFT Spectrum You may use cursors to take two measurements on the FFT spectrum: amplitude (in dB) and frequency (in Hz). Amplitude is referenced to 0db that equals 1VRMS here. You may use cursors to measure at any zoom factor. - Page 31 Basic Operation 1. Level It sets the amplitude level the signal must cross to cause an acquisition when using the Edge or Pulse Width trigger. 2. Set to 50% The trigger level is set to the vertical midpoint between the peaks of the trigger signal. 3.
- Page 32 Basic Operation Video Trigger Options Settings Comments With Video highlighted, an NTSC, PAL or SECAM standard Video video signal will be triggered. The trigger coupling is preset to Select the input source as the trigger signal. Ext and Ext/5 use Source the signal applied to the EXT TRIG connector as the source.
- Page 33 Basic Operation Triggers when pulse is Triggers when pulse is less than width setting greater than width setting Threshold level Triggers when pulse is Triggers when pulse is not equal to width setting ±5% equal to width setting ±5% Threshold level Tolerance Tolerance = Trigger Point...
- Page 34 Basic Operation Swap Trigger: As a feature of analog oscilloscopes, it gives stable displays of signals at two different frequencies. Mainly it uses a specific frequency to switch between two analog channels CH1 and CH2 so that the channels will generate swap trigger signals through the trigger circuitry. Options Settings Comments...
- Page 35 Basic Operation Type Slope Rising Slope Select the slope type of signal. Falling Auto Select the type of trigger. The Normal mode is best for most Mode Normal pulse width trigger applications. Selects the components of the trigger signal applied to the Coupling Noise Reject trigger circuitry.
-
Page 36: Menu And Option Buttons
Basic Operation Acquisition Interval Acquisition Interval Trigger Level Indicates Trigger Points Holdoff Holdoff 5.5 Menu and Option Buttons As shown below, these six buttons at the top of the front panel are used mainly to recall relative setup menus. SAVE/RECALL: Displays the Save/Recall menu for setups and waveforms. MEASURE: Displays the Measure menu. -
Page 37: Measure
Basic Operation Press ‘Next Page’ to recall the following menu. Options Settings Comments Setups Flash memory Operation Store the current setups to the USB disk or the memory of the Source oscilloscope. USB disk Specify the memory location in which to store the current Memory 0 to 9 waveform settings or from which to recall the waveform settings. - Page 38 Basic Operation The most negative peak voltage measured over the entire waveform. The most positive peak voltage measured over the entire waveform. Measure the time between 10% and 90% of the first rising edge of Rising the waveform. Measure the time between 90% and 10% of the first falling edge of Falling the waveform.
-
Page 39: Acquire
Basic Operation The readouts in big font size on the menu are just results of the corresponding measurements. Taking Measurements: For a single waveform (or a waveform divided among multiple waveforms), up to 8 automatic measurements can be displayed at a time. The waveform channel must stay in an ‘ON’... - Page 40 Basic Operation Normal Acquisition Intervals Sample Points Normal Mode Acquires a Single Sample Point in Each Interval Peak Detect: Use this mode to detect glitches within 10ns and to limit the possibility of aliasing. This mode is valid at the SEC/DIV setting of 4µs/div or slower. Once you set the SEC/DIV setting to 4µs/div or faster, the acquisition mode will change to Normal because the sample rate is fast enough that Peak Detect is unnecessary.
-
Page 41: Utility
Basic Operation 5.5.4 Utility Push the UTILITY button to display the Utility Menu as follows. Options Comments System Info Display the software and hardware versions, serial number and some other information about the oscilloscope. Update Insert a USB disk with upgrade program and the disk icon at the top left corner is Program highlighted. -
Page 42: Display
Basic Operation Moving Cursors: Press the key near Select Cursor to select a cursor and turn V0 to move it. Cursors can be moved only when the Cursor Menu is displayed. Voltage Cursor Time Cursor 5.5.6 Display The waveform display is affected by settings of the oscilloscope. A waveform can be measured once it is captured. -
Page 43: Fast Action Buttons
Basic Operation 5.6 Fast Action Buttons AUTOSET: Automatically set the oscilloscope controls to generate a usable display of the input signals. Refer to the following table for relative content. SINGLE SEQ: Acquire a single waveform and then stop the acquisition. RUN/STOP: Continuously acquire waveforms or stop the acquisition. -
Page 44: Help
Basic Operation ¾ If multiply channels get signals, the oscilloscope will use the channel with the lowest frequency signal as the trigger source. ¾ If no signals are found, the oscilloscope will use the lowest-numbered channel displayed in Autoset as the trigger source. ¾... - Page 45 Basic Operation Menu or System Option, Button or Knob Default Setting (Three mode options) Normal Acquire Averages Run/Stop Type Source Cursor Horizontal (amplitude) ±3.2div Vertical (time) ±4div Type Vectors Display Persist Format Window Mode Single-window Trigger Knob Level Horizontal Position 0.00s SEC/DIV 200 s...
-
Page 46: Multi-Functional Knobs And Buttons
Basic Operation Type Edge Slope Rising Mode Auto Coupling Level 0.00v Trigger (Swap) Type Edge Slope Rising Mode Auto Coupling Level 0.00v Source Polarity Positive Trigger (OT) Mode Auto Time 20ns Coupling Bandwidth Limit Unlimited VOLTS/DIV Coarse Probe Voltage Vertical System, All Channels Voltage Probe Attenuation Invert... -
Page 47: Signal Connectors
Basic Operation F0: Hide/Show button. Push it to hide the menu options on the right side of the screen and give a full screen display of waveforms. Push it again to show the menu options. F1-F5: These five buttons are all multi-functional. They are in charge of selecting corresponding menu options on the screen in different menu modes. -
Page 48: Chapter 6 Application Examples
Application Examples Chapter 6 Application Examples This chapter unfolds a further description on main features of the oscilloscope by giving eleven simplified application examples for reference to help solve your own test problems. Taking simple measurements Using AUTOSET Using the Measure menu to take auto measurements Taking cursor measurements Measuring ring frequency and ring amplitude Measuring pulse width... - Page 49 Application Examples Taking Auto Measurements The oscilloscope can display most signals by automatic measurements. To measure such parameters as the signal frequency, period, peak-to-peak amplitude, rise time and positive width, follow the steps below. Push the MEASURE button to see the Measure menu. Turn the knob V0 to select the first ‘unspecified’...
-
Page 50: Example 2: Taking Cursor Measurements
Application Examples 6.2 Example 2: Taking Cursor Measurements You can use the cursor to quickly measure the time and amplitude of a waveform. Measuring Ring Time (convertible to Frequency) and Amplitude on Rising Edge of Pulse To measure the ring time on the rising edge of the pulse, follow the steps below. Push the CURSOR button to view the Cursor menu. - Page 51 Application Examples Measuring Pulse Width To analyze a pulse signal and to know its width, follow the steps below. Push the CURSOR button to view the Cursor menu. Push F1 the Type option button and select Time. Push F2 or F3 the Source option button and select CH1. Push F4 to select a cursor.
- Page 52 Application Examples Measuring Rise Time of Pulse You may need to measure the rise time of the pulse in many application environments, usually, to measure the rise time between the 10% and 90% levels of the pulse waveform. To do so, follow the steps below.
-
Page 53: Example 3: Analyzing Input Signals To Eliminate Random Noise
Application Examples 6.3 Example 3: Analyzing Input Signals to Eliminate Random Noise In certain circumstances, to display a noisy signal on the oscilloscope and to get its details, you may follow the steps below to analyze this signal. Observing Noisy Signal Press the ACQUIRE button to see the Acquire menu. -
Page 54: Example 4: Capturing Single-Shot Signal
Application Examples Eliminating Random Noise Press the ACQUIRE button to see the Acquire menu. Push the Type option button and select Real Time. Push the Average option button. Push the Averages option button and adjust the number of running averages to watch the change in the waveform display. -
Page 55: Example 5: Using X-Y Mode
Application Examples Using this feature can help you to capture occasional events more easily. This is an advantage of the digital storage oscilloscope. 6.5 Example 5: Using X-Y Mode Viewing Phase Differences between Two Channel Signals For example, you need to measure the change in a phase across a circuit network. Connect the oscilloscope with circuitry and view the input and output of the circuit in XY mode. -
Page 56: Example 6: Triggering On Pulse Width
Application Examples As sin =A/B or C/D, in which is the phase difference angle between channels and A, B, C, D represent what shown in the figure below, you can get the value of the phase difference angle by the formula: =±arcsin(A/B) or ±arcsin(C/D). If the principal axes of the ellipse are in the first and third quadrants, the phase difference angle should be in the first and fourth quadrants, i.e. -
Page 57: Example 7: Triggering On Video Signal
Application Examples Turn the TRIGGER LEVEL knob to set the pulse width to the value read out in Step 3. Push the More option button and select Normal for the Mode option. Once triggering on normal pulses, the oscilloscope can give a stable waveform display. 10. - Page 58 Application Examples Triggering on Video Lines To trigger on the video lines, follow the steps below. Push the TRIG MENU button to see the Trigger menu. Push F1 to select Video for the Type option. Push the Source option button to select CH1; push the Polarity option button to select Normal; push the Standard option button to select NTSC;...
-
Page 59: Example 8: Using Slope Trigger To Capture Particular Slope Signal
Application Examples 6.8 Example 8: Using Slope Trigger to Capture Particular Slope Signal In many occasions, we are not only concerned about the edge of the signal, but also want to know the rise and fall times of the signal. To better observe this kind of signals, we bring in the slope trigger. -
Page 60: Example 10: Using Math Functions To Analyze Waveforms
Application Examples Turn the Trigger Level knob to adjust the trigger level and stabilize video signals. Turn V0 to adjust the line number (NTSC: 0-525 lines). Turn the horizontal SEC/DIV and the vertical VOLTS/DIV knobs to display on the screen a complete video signal triggering on a video line. -
Page 61: Example 11: Measuring Data Propagation Delay
Application Examples refer to Chapter 5.3.1 Math FFT. Note: You should compensate both probes before performing the math operation; otherwise, differences in probe compensation will appear as errors in the differential signal. As illustrated in the above figure, input a 1KHz sine wave from CH1 and a 1KHz square wave from CH2. - Page 62 Application Examples To set the propagation delay measurement, follow the steps below. Connect two oscilloscope probes respectively to the CS (chip-select) pin and the DATA pin on the chip. Set the Probe option attenuation to 10X for both probes. Open CH1 and CH2 at the same time, both with the attenuation of 10X. Push the AUTOSET button to trigger a stable waveform display.
-
Page 63: Chapter 7 Troubleshooting
Troubleshooting Chapter 7 Troubleshooting 7.1 Problem Settlement 1. If the oscilloscope does not start up at power on, follow these steps: 1) Check the power cord to verify it has been connected properly; 2) Check the power on/off button to ensure it has been pushed; 3)... -
Page 64: Chapter 8 Specifications
Waveform Interpolation (sin x)/x Maximum 40K samples per single-channel; maximum 20K Record Length samples per dual-channel (4K, 20K optional) DSO5072P DSO5102P DSO5202P SEC/DIV Range 4ns/div to 40s/div, in a 2, 4, 8 2ns/div to 40s/div, in a 2, 4, sequence... - Page 65 Average Acquisition Mode conditions Note: Bandwidth reduced to 6MHz when using a 1X probe. Trigger Coupling Sensitivity Source DSO5072P, DSO5102P DSO5202P 1.5div from 10MHz 1div from DC to 10MHz; to 100MHz; 1.5div from 10MHz to Trigger Sensitivity...
- Page 66 Specifications 1V from DC to 100MHz; EXT/5 1V from DC to 100MHz 1.75V from 100MHz to 200MHz Attenuates signals below 10Hz HF Reject Attenuates signals above 80kHz Same as the DC-coupled limits for frequencies above LF Reject 150kHz; attenuates signals below 150kHz Source Range CH1, CH2...
- Page 67 Specifications Slope Trigger Trigger when < (Less than), > (Greater than), = (Equal), or • (Not Equal); Slope Trigger Mode Positive slope or Negative slope Equal: The oscilloscope triggers when the waveform slope is equal to the set slope. Not Equal: The oscilloscope triggers when the waveform slope is not equal to the set slope.
- Page 68 Specifications Inputs Inputs Input Coupling DC, AC or GND Input Impedance, 1M ±2% in parallel with 20pF±3pF DC coupled Probe Attenuation 1X, 10X Supported Probe 1X, 10X, 100X, 1000X Attenuation Factors Overvoltage Category Maximum Voltage 300V (10×), Installation CAT I and CAT II Category CAT III 150V...
- Page 69 Specifications General Specifications Display Display Type 7 inch 64K color TFT (diagonal liquid crystal) Display Resolution 800 horizontal by 480 vertical pixels Display Contrast Adjustable (16 gears) with the progress bar Probe Compensator Output Output Voltage, About 5Vpp into • 1M load typical Frequency, typical 1kHz...
-
Page 70: Accessories
Specifications 8.2 Accessories All the following accessories are available. Standard Accessories Sketch Description X1, X10 two passive probes. The passive probes have a 6MHz bandwidth (rated 100Vrms CAT III) when the switch is in the X1 position, and a maximum bandwidth (rated 300Vrms CAT II) when the switch is in the X10 position. -
Page 71: Chapter 9 General Care And Cleaning
General Care and Cleaning Chapter 9 General Care and Cleaning 9.1 General Care Do not put or leave the device in a place where the LCD display will be exposed to direct sunlight for long periods of time. Note: To avoid damage to the oscilloscope or probes, do not expose them to sprays, liquids, or solvents. -
Page 72: Appendix A Harmful And Poisonous Substances Or Elements
General Care and Cleaning Appendix A Harmful and Poisonous Substances or Elements Harmful and poisonous substances or elements Component Cr(Vi) PBDE Shell and Chassis Display Module Circuit Board Power Supply Electric Wire and Cable Assembly Connector Fastener and Installed Hardware Other Accessories (including probes) Others...
Need help?
Do you have a question about the DSO5102P and is the answer not in the manual?
Questions and answers