Table of Contents
Advertisement
Quick Links
Advertisement
Table of Contents

Related Manuals for Hantek DSO 1062B


Summary of Contents for Hantek DSO 1062B
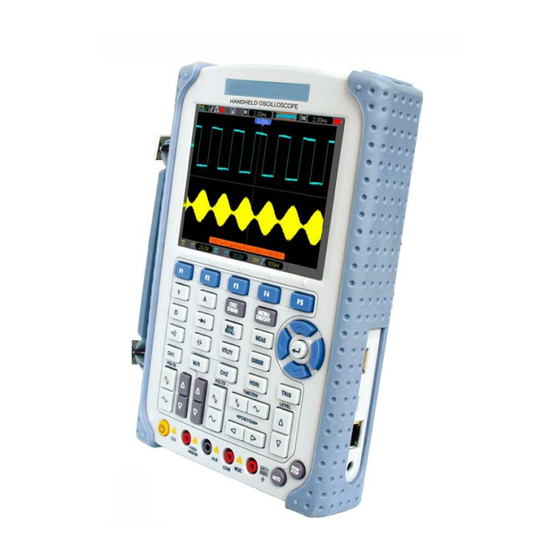
- Page 1 DSO1000B SERIES HANDHELD OSCILLOSCOPE USER’S MANUAL 1062B/1102B/1202B (V1.5)...
-
Page 2: Table Of Contents
Contents Contents CONTENTS ...............................I COPYRIGHT DECLARATION ........................IV CHAPTER 1 SAFETY TIPS ........................1 ........................1 ENERAL AFETY UMMARY ......................... 1 AFETY ERMS AND YMBOLS ..........................2 ERMS ON RODUCT .......................... 2 YMBOLS ON RODUCT ..........................2 RODUCT CRAPPING CHAPTER 2 OVERVIEW .......................... - Page 3 Contents 5.3.1.1 Setting Time-domain Waveform ........................19 5.3.1.2 Displaying FFT Spectrum ..........................20 5.3.1.3 Selecting FFT Window ..........................21 5.3.1.4 FFT Aliasing ..............................22 5.3.1.5 Eliminating Aliases ............................22 5.3.1.6 Magnifying and Positioning FFT Spectrum ....................23 5.3.1.7 Using Cursors to Measure FFT Spectrum ....................23 ..........................24 RIGGER ONTROLS .........................
- Page 4 Contents 11.2 ............................75 LEANING APPENDIX A HARMFUL AND POISONOUS SUBSTANCES OR ELEMENTS........76 DSO1000B Series HandHeld Oscilloscope User Manual...
-
Page 5: Copyright Declaration
Hantek reserves all rights to modify this document without prior notice. Please contact Hantek for the latest version of this document before placing an order. Hantek has made every effort to ensure the accuracy of this document but does not guarantee the absence of errors. Moreover, Hantek assumes no responsibility in obtaining permission and authorization of any third party patent, copyright or product involved in relation to the use of this document. -
Page 6: Chapter 1 Safety Tips
Safety Tips Chapter 1 Safety Tips 1.1 General Safety Summary Read the following safety precautions to avoid injury and prevent damage to this product or any products connected to it. To evade potential hazards, use this product only as specified. Only qualified personnel should perform maintenance. -
Page 7: Terms On Product
Safety Tips to this product or other property. 1.3 Terms on Product The following terms may appear on the product: DANGER indicates an injury hazard immediately accessible as you read the marking. WARNING indicates an injury hazard not immediately accessible as you read the marking. CAUTION indicates a possible hazard to this product or other property. -
Page 8: Chapter 2 Overview
Overview Chapter 2 Overview 2.1 Brief Introduction to DSO1000B Series Model Channels Bandwidth Sample Rate DSO1062B 60MHz 1GS/s 5.6 inch color DSO1102B 100MHz 1GS/s 5.6 inch color DSO1202B 200MHz 1GS/s 5.6 inch color Table 2-1 Model List of DSO1000B Series DSO1000B Series oscilloscopes cover the bandwidths from 60MHz to 200MHz, and provide the real-time and equivalent sample rates respectively up to 1GSa/s and 25GSa/s. -
Page 9: Chapter 3 Getting Started Guide
Getting Started Guide Chapter 3 Getting Started Guide 3.1 Installation To keep proper ventilation of the oscilloscope in operation, leave a space of more than 5cm away from the top and the two sides of the product. 3.2 Functional Check Follow the steps below to perform a quick functional check to your oscilloscope. -
Page 10: Observe The Waveform
Getting Started Guide 3.2.3 Observe the waveform Press the AUTO button and you should see within a few seconds a square wave of about 2V peak-to-peak at 1kHz in the display. Press the CH1 MENU button and remove Channel 1. Push the CH2 MENU button and repeat Step 2 and Step 3 to observe Channel 2. -
Page 11: Use Of Probe Check Wizard
Getting Started Guide 3.3.2 Use of Probe Check Wizard Every time you connect a probe to an input channel, you should use the probe check wizard to verify that this probe is operating correctly. There are two ways to do this: 1)... -
Page 12: Probe Attenuation Setting
Getting Started Guide 3.5 Probe Attenuation Setting Probes are of various attenuation factors which affect the vertical scale of the signal. The Probe Check function is used to verify if the Probe attenuation option matches the attenuation of the probe. As an alternative method to Probe Check, you can push a vertical menu button (such as the CH 1 MENU button) and select the Probe option that matches the attenuation factor of your probe. -
Page 13: Chapter 4 Main Feature Description
Main Feature Description Chapter 4 Main Feature Description This chapter provides some general information that you need to learn before using an oscilloscope. It contains: 1. Oscilloscope setup 2. Trigger 3. Data acquisition 4. Waveform scaling and positioning 5. Waveform measurement 4.1 Oscilloscope Setup While operating the oscilloscope, you may often use thr feature: Autoset. -
Page 14: Data Acquisition
Main Feature Description two different frequencies. Mainly it uses a specific frequency to switch between two analog channels CH1 and CH2 so that the channels will generate swap trigger signals through the trigger circuitry. Trigger Mode: You can select the Auto or Normal mode to define how the oscilloscope acquires data when it does not detect a trigger condition. -
Page 15: Waveform Scaling And Positioning
Main Feature Description the input signal over each sample interval and uses these values to display the waveform. In this way, the oscilloscope can acquire and display those narrow pulses that may have otherwise been missed in Normal mode. However, noise will appear to be higher in this mode. Average: In this acquisition mode, the oscilloscope acquires several waveforms, averages them, and displays the resulting waveform. -
Page 16: Waveform Measurement
Main Feature Description 4.5 Waveform Measurement The oscilloscope displays graphs of voltage versus time and can help to measure the displayed waveform. There are several ways to take measurements, using the graticule, the cursors or performing an automatic measurement. Graticule: This method allows you to make a quick, visual estimate and take a simple measurement through the graticule divisions and the scale factor. -
Page 17: Chapter 5 Basic Operation
Basic Operation Chapter 5 Basic Operation The front panel of the oscilloscope is divided into several functional areas. In this chapter we will give a quick overview of all control buttons on the front panel as well as the displayed information on the screen and relative testing operations. -
Page 18: Displayarea
Basic Operation 5.1 DisplayArea 1. Display Format: : YT : XY : Vectors : Dots : Gray indicates auto persistence; Green means persistence display is enabled. When the icon is set to green, the time for persistence display will be shown behind it. 10 13 12 11 2. -
Page 19: Xy Format
Basic Operation 4. Tool Icon: If this icon lights up, it means the keyboard of the oscilloscope is locked by the host computer via USB control. : If this icon lights up, it means the USB disk has been connected. : This icon lights up only when the USB slave interface is connected with the computer. -
Page 20: Horizontal Controls
Basic Operation display format to XY. The table below shows how to operate some controls in XY format. Controls Usable or not in XY format CH1 VOLTS and VERTICAL POSITION controls Set the horizontal scale and position Continuously set the vertical scale and CH2 VOLTS and VERTICAL POSITION controls position Reference or Math... - Page 21 Basic Operation Holdoff None Select this menu and click the up and down Arrow keys to adjust the trigger holdoff time within the range of 100ns-10s. Autoplay None This function is usable in dual-window mode. Push this menu button and auto move it from left to right at a specified speed.
-
Page 22: Scan Mode Display (Roll Mode)
Basic Operation /DIV control will expand or compress the waveform. In dual-window mode, push button F1 to select major or minor window. When the major window is selected, the F1 button provides the same functions as it provides in single-mode window. When the minor window is selected, press TIME/DIV button to scale the waveform whose magnification is up to 1000. -
Page 23: Math Fft
Basic Operation Invert Inverts the waveform relative to the reference level. Ground Coupling Used to display a zero-volt waveform. Internally, the channel input is connected with a zero-volt reference level. Fine Resolution In the fine resolution setting, the vertical scale readout displays the actual VOLTS setting. The vertical scale changes only after you adjust the VOLTS control and set to coarse. -
Page 24: Setting Time-Domain Waveform
Basic Operation Analyze vibration. To use the Math FFT mode, perform the following tasks: Set the source (time-domain) waveform; Display the FFT spectrum; Choose a type of FFT window; Adjust the sample rate to display the fundamental frequency and harmonics without aliasing; ... -
Page 25: Displaying Fft Spectrum
Basic Operation The highest frequency that any real-time digital oscilloscope can measure without errors is half of the sample rate, which is called the Nyquist frequency. Frequency information beyond the Nyquist frequency is undersampled which brings about the FFT aliasing. The math function can convert the center 2048 points of the time-domain waveform to an FFT spectrum. -
Page 26: Selecting Fft Window
Basic Operation 1. Frequency at the center graticule line 2. Vertical scale in dB per division (0dB=1V 3. Horizontal scale in frequency per division 4. Sample rate in number of samples per second 5. FFT window type 5.3.1.3 Selecting FFT Window Using windows can eliminate the spectral leakage in the FFT spectrum. -
Page 27: Fft Aliasing
Basic Operation The Math FFT function has three FFT Window options. There is a trade-off between frequency resolution and amplitude accuracy for each type of window. You shall determine which one to choose according to the object you want to measure and the source signal characteristics. Window Measurement Characteristics... -
Page 28: Magnifying And Positioning Fft Spectrum
Basic Operation Limit option to Limited. Filter the signal input from outside and limit the bandwidth of the source waveform to lower than the Nyquist frequency. Identify and ignore the aliased frequencies. Use zoom controls and cursors to magnify and measure the FFT spectrum. 5.3.1.6 Magnifying and Positioning FFT Spectrum You may scale the FFT spectrum and use cursors to measure it through the FFT Zoom option... -
Page 29: Trigger Controls
Basic Operation Frequency Cursors Amplitude Cursors 5.4 Trigger Controls The trigger can be defined through the Trigger Menu. There are six types of trigger: Edge, Video, Pulse Width, Swap, Slope and Overtime. Refer to the following tables to find a different set of options for each type of trigger. - Page 30 Basic Operation LF Reject 10Hz. DC: Passes all components of the signal. HF Reject: Attenuates the high-frequency components above 80kHz. LF Reject: Blocks DC components and attenuates the low-frequency components below 8kHz. NOTE: Trigger coupling only affects the signal passed through the trigger system. It does not affect the bandwidth or coupling of the signal displayed on the screen.
- Page 31 Basic Operation Trigger When: The pulse width of the source must be ≥5ns so that the oscilloscope can detect the pulse. Triggers when pulse is Triggers when pulse is less than width setting greater than width setting Threshold level Triggers when pulse is Triggers when pulse is not equal to width setting ±5% equal to width setting ±5%...
- Page 32 Basic Operation < > Time 20ns to 10.0sec With this option highlighted, set the time span. Swap Trigger: As a feature of analog oscilloscopes, it gives stable displays of signals at two different frequencies. Mainly it uses a specific frequency to switch between two analog channels CH1 and CH2 so that the channels will generate swap trigger signals through the trigger circuitry.
- Page 33 Basic Operation Noise Reject HF Reject LF Reject Type Slope Rising Slope Select the slope type of signal. Falling Auto Select the type of trigger. The Normal mode is best for most Mode Normal pulse width trigger applications. Selects the components of the trigger signal applied to the Coupling Noise Reject trigger circuitry.
-
Page 34: Menu And Option Buttons
Basic Operation Acquisition Interval Acquisition Interval Trigger Level Indicates Trigger Points Holdoff Holdoff 5.5 Menu and Option Buttons As shown below, these four buttons at the front panel are used mainly to recall relative setup menus. SAVE/RECALL: Displays the Save/Recall menu for setups and waveforms. MEASURE: Displays the Measure menu. -
Page 35: Measure
Basic Operation Flash memory Operation Store the current setups to the USB disk or the memory of the Source oscilloscope. USB disk Specify the memory location in which to store the current Memory 0 to 9 waveform settings or from which to recall the waveform settings. Save Complete the saving operation. -
Page 36: Acquire
Basic Operation Measure the time between 10% and 90% of the first rising Rise Time edge of the waveform. Measure the time between 90% and 10% of the first falling Fall Time edge of the waveform. Measure the time between the first rising edge and the next Positive Width falling edge at the waveform 50% level. - Page 37 Basic Operation Memory Depth 4K, 40K, 512K, 1M Select the memory depth for different board models. (Real Time) Normal: For the oscilloscope model with the bandwidth of 100MHz, the maximum sample rate is 1GS/s. For time base with insufficient sample rate, you may use the Sine Interpolation Algorithm to interpolate points between sampled points to produce a complete waveform record (4K by default).
-
Page 38: Utility
Basic Operation As shown above, acquire input signals (cycle repeatable) for more than once at a slow sample rate, arrange the sample points by the time they appear, then recover waveforms. 5.5.4 UTILITY Push the UTILITY button to display the Utility Menu as follows. Options Comments System Info... -
Page 39: Display
Basic Operation S indicates Cursor 1. E indicates Cursor 2. A selected cursor is highlighted, which can be moved freely. Both Select Cursor cursors can be selected and moved at the same time. The box behind the cursor displays the location of the cursor. Display the difference Delta... -
Page 40: Fast Action Buttons
Basic Operation For detailed information, refer to descriptions on XY format in the following text. 0-15 16 ranks adjustable, with a progress bar to Contrast display. Next Page Dotted line Off only displays the horizontal and vertical coordinates Grid Real line at the center graticule on the screen. -
Page 41: Signal Connectors
Basic Operation If multiply channels get signals, the oscilloscope will use the channel with the lowest frequency signal as the trigger source. If no signals are found, the oscilloscope will use the lowest-numbered channel displayed in Autoset as the trigger source. ... - Page 42 Basic Operation 2. Probe Compensation: Voltage probe compensation output and ground, used to electrically match the probe to the oscilloscope input circuit. The probe compensation ground and BNC shields connect to earth ground and are considered to be ground terminals. To avoid damages, do not connect a voltage source to any of these ground terminals.
-
Page 43: Chapter 6 Application Examples
Application Examples Chapter 6 Application Examples This chapter unfolds a further description on main features of the oscilloscope by giving eleven simplified application examples for reference to help solve your own test problems. Taking simple measurements Using AUTO Using the Measure menu to take auto measurements Taking cursor measurements Measuring ring frequency and ring amplitude Measuring pulse width... - Page 44 Application Examples Taking Auto Measurements The oscilloscope can display most signals by automatic measurements. To measure such parameters as the signal frequency, period, peak-to-peak amplitude, rise time and positive width, follow the steps below. Push the MEAS button to see the Measure menu. Select the first ‘unspecified’...
-
Page 45: Example 2: Taking Cursor Measurements
Application Examples 6.2 Example 2: Taking Cursor Measurements You can use the cursor to quickly measure the time and amplitude of a waveform. Measuring Ring Time (convertible to Frequency) and Amplitude on Rising Edge of Pulse To measure the ring time on the rising edge of the pulse, follow the steps below. Push the CURSOR button to view the Cursor menu. - Page 46 Application Examples Measuring Pulse Width To analyze a pulse signal and to know its width, follow the steps below. Push the CURSOR button to view the Cursor menu. Push F1 the Type option button and select Time. Push F2 the Source option button and select CH1. Select a cursor.
-
Page 47: Noise
Application Examples measure the rise time between the 10% and 90% levels of the pulse waveform. To do so, follow the steps below. Click the TIME/DIV key to display the rising edge of the waveform. Click the VOLTS and Vertical Position keys to adjust the waveform amplitude to about 5 divisions. - Page 48 Application Examples Observing Noisy Signal Enter the Acquire menu. Push the Type option button and select Real Time. Push the Peak Detect option button. If necessary, enter the DISPLAY menu and set the Contrast option to view the noise more clearly.
-
Page 49: Example 4: Capturing Single-Shot Signal
Application Examples change in the waveform display. Note: Averaging reduces random noise and let you view the signal details more easily. See the figure below for better understanding 6.4 Example 4: Capturing Single-shot Signal You may refer to the following example to easily capture some aperiodic signals like pulses and glitches. -
Page 50: Example 5: Using X-Y Mode
Application Examples 6.5 Example 5: Using X-Y Mode Viewing Phase Differences between Two Channel Signals For example, you need to measure the change in a phase across a circuit network. Connect the oscilloscope with circuitry and view the input and output of the circuit in XY mode. Follow the steps below. -
Page 51: Example 6: Triggering On Pulse Width
Application Examples should be in the first and fourth quadrants, i.e. within (0~π/2) or (3π/2~2π). If the principal axes of the ellipse are in the second and fourth quadrants, the phase difference angle should be in the second and third quadrants, i.e. within (π/2~π) or (π-3π/2). See the figure below for better understanding. -
Page 52: Example 7: Triggering On Video Signal
Application Examples condition, the oscilloscope will trigger. For example, the signal contains such aberrant pulses as shown below, you may select ‘≠’ or ‘<’ to trigger on the pulse. As shown in the above figure, you can get a stable waveform display if inputting a square wave at the frequency of 1KHz, with pulse width set to 500μs. - Page 53 Application Examples Triggering on Video Lines To trigger on the video lines, follow the steps below. Push the TRIG MENU button to see the Trigger menu. Select Video for the Type option. Push the Source option button to select CH1; push the Polarity option button to select Normal; push the Standard option button to select NTSC;...
-
Page 54: Signal
Application Examples 6.8 Example 8: Using Slope Trigger to Capture Particular Slope Signal In many occasions, we are not only concerned about the edge of the signal, but also want to know the rise and fall times of the signal. To better observe this kind of signals, we bring in the slope trigger. -
Page 55: Example 10: Using Math Functions To Analyze Waveforms
Application Examples Click the Trigger Level key to adjust the trigger level and stabilize video signals. Adjust the line number (NTSC: 0-525 lines). Clck the horizontal TIME/DIV and the vertical VOLTS keys to display on the screen a complete video signal triggering on a video line. See the figure below. Note: The difference between the overtime and the delay triggers is that the overtime trigger can identify the pulse you need according to your set time and trigger on any point of the pulse. -
Page 56: Example 11: Measuring Data Propagation Delay
Application Examples refer to Chapter 5.3.1 Math FFT. Note: You should compensate both probes before performing the math operation; otherwise, differences in probe compensation will appear as errors in the differential signal. As illustrated in the above figure, input a 1KHz sine wave from CH1 and a 1KHz square wave from CH2. - Page 57 Application Examples data. To set the propagation delay measurement, follow the steps below. Connect two oscilloscope probes respectively to the CS (chip-select) pin and the DATA pin on the chip. Set the Probe option attenuation to 10X for both probes. Open CH1 and CH2 at the same time, both with the attenuation of 10X.
-
Page 58: Example 12: Setting Net Ip
Application Examples DATA 6.12 Example 12: Setting Net IP To set net IP, follow the steps below. 1. Select the menu Utility->System->Pc Set->Mode->NET.Then there pushes up the NetCfg dialog. 2. Select Device IP or Device Port you want to set and press ENTER key.Then there pushes up the Input panel dialog. -
Page 59: Example 13: Charging
Application Examples 6.13 Example 13: Charging Your battery has been partially charged at the factory, but you may need to recharge it before you can switch on your device for the first time. If the device indicates a low charge, do the following: 1. -
Page 60: Chapter 7 Multimeter
Multimeter Chapter 7 Multimeter About this chapter This chapter provides an introduction to the multimeter functions of DSO1000B Series. The introduction gives guides to show how to use the menus and perform basic measurements. Connecting the Meter Use the 4-mm safety banana jack inputs for the Meter functions: 10A , mA, COM,V/Ω/C. Multimeter Operation Window Figure 7-1 Multimeter operation window Description... - Page 61 Multimeter Operating the Multimeter If you are in the oscilloscope window, press OSC/DMM key, the oscilloscope will switch to the multimeter mode window.Then the screen will display the measure mode window that was in use the last time before you quit multimeter measure. When you switch to the multimeter measurement the first time, the default measure mode is DC voltage mode.
- Page 62 Multimeter Figure 7-3 Diode Measurement Making an On-off Measurement To perform an On-off test, do the following: 1) Press the On-off key and then On-off indictor appears on the top of the screen. 2) Insert the black lead into the COM banana jack input and the red lead into the V/O/C banana jack input.
- Page 63 Multimeter To measure a capacitance, do the following: 1) Press the C key and a capacitor symbol appears on the top of the screen. 2) Insert the black lead into the COM banana jack input and the red lead into the V/O/C banana jack input.
- Page 64 Multimeter Figure 7-6 DC voltage Measurement Making an AC Voltage Measurement To measure the AC voltage, do the following: 1) Press the V key and DC appears on the screen. 2) Press the F1 key and AC appears on the screen. 3) Insert the black lead into the COM banana jack input and the red lead into the V/O/C banana jack input.
- Page 65 Multimeter Making a DC Current Measurement To measure a DC current which is less than 600 mA , do the following: 1) Press the A key and then DC appears on the screen. The unit on the main reading screen is mA. Press F2 to switch the measurement between mA and 10A.
- Page 66 Multimeter Figure 7-9 DC Current Measurement for 10A Making an AC Current Measurement To measure an AC current which is less than 600 mA, do the following: 1) Press the A key and then DC appears on the screen. The unit on the main reading screen is mA,and mA will display on the bottom of the screen, press F2 to switch the measurement between mA and 10A.
- Page 67 Multimeter Figure 7-10 AC Current Measurement for 600 mA To measure an AC current which is larger than 600 mA, do the following: 1) Press the A key and then DC appears on the screen. The unit on the main reading screen is mA. 2) Press F2 key to switch to10A measurement, the unit on the main reading screen is A.
- Page 68 Multimeter Taking a Relative Measurement A currently measured result relative to the defined reference value is displayed in a relative measurement. The following example shows how to take a relative measurement. At first, it is required to acquire a reference value. 1) Press the Okey.
- Page 69 Multimeter Attention: capacitance measurement without manual range mode. Then,the screen will look like the following figure 7-13. Figure 7-13 The Manual Range Mode DSO1000B Series HandHeld Oscilloscope User Manual...
-
Page 70: Chapter 8 Troubleshooting
6) In addition, you may press the Auto Measure button to perform an automatic detection of signals at first. Contact HANTEK Technical Support department in time if there is still no display of waveforms. 3. If the waveform of the input signal is distorted seriously, follow these steps: 1)... -
Page 71: Chapter 9 Specifications
Chapter 9 Specifications 9.1 Technical Specifications All specifications herein mentioned apply to the DSO1000B series oscilloscopes. Before checking an oscilloscope from HANTEK to see if it complies with these specifications, make sure it meets the following conditions: The oscilloscope must have been operating continuously for twenty minutes under the specified operating temperature. - Page 72 Specifications Vertical 8-bit resolution, A/D Converter each channel sampled simultaneously VOLTS Range 2mV/div to 5V/div at input BNC 2mV/div to 200mV/div, ±2V Position Range >200mV/div to 5V/div, ±50V Analog Bandwidth in 2mV/div to 20mV/div, ±400mV Normal and Average 50mV/div to 200mV/div, ±2V modes at BNC or with probe, DC 500mV/div to 2V/div, ±40V Coupled...
- Page 73 Specifications Full Full Attenuates signals below 10Hz HF Reject Attenuates signals above 80kHz Same as the DC-coupled limits for frequencies above LF Reject 150kHz; attenuates signals below 150kHz Source Range Trigger Level Range CH1, CH2 ±8 divisions from center of screen Trigger Level Source Accuracy...
- Page 74 Specifications set slope. Not Equal: The oscilloscope triggers when the waveform slope is not equal to the set slope. Less than: The oscilloscope triggers when the waveform slope is less than the set slope. Greater than: The oscilloscope triggers when the waveform slope is greater than the set slope.
- Page 75 Specifications Inputs Input Coupling DC, AC or GND Input Impedance, 1MΩ±2% in parallel with 20pF±3pF DC coupled Probe Attenuation 1X, 10X Supported Probe 1X, 10X, 100X, 1000X Attenuation Factors Overvoltage Category Maximum Voltage CAT I and CAT II 300V (10×), Installation Category CAT III 150V (1×)
- Page 76 Specifications Altitude Operating and Nonoperating 3,000m (10,000 feet) 0.31g from 50Hz to 500Hz, 10 Random Vibration minutes on each axis 2.46g from 5Hz to 500Hz, 10 Nonoperating minutes on each axis Mechanical Shock Operating 50g, 11ms, half sine Mechanical Length 245mm Size Height...
-
Page 77: Accessories
U_boot Version u-boot-1.1.6 Sourcecode download website www.hantek.com./download/handscope.zip 9.2 Accessories All the following accessories are available by contacting your local HANTEK distributor. Standard Accessories Sketch Description X1, X10 two passive probes. The passive probes have a 6MHz bandwidth (rated 100Vrms CAT III) when the switch is in the X1 position, and a maximum bandwidth (rated 300Vrms CAT II) when the switch is in the X10 position. - Page 78 Specifications A USB A-B line, used to connect external devices with USB-B interface like a printer or to establish communications between PC and the oscilloscope. A software installation CD. It contains the user manual of DSO1000B, giving particular descriptions on the DSO1000B series oscilloscopes.
-
Page 79: Chapter 10 Services And Support
General Care and Cleaning Chapter 10 Services and Support Thank you for choosing HANTEK. Please contact us through the following ways should you have any inquiry regarding our products. We shall do our best to help you. 1. Contact your local HANTEK distributor;... -
Page 80: Chapter 11 General Care And Cleaning
General Care and Cleaning Chapter 11 General Care and Cleaning 11.1 General Care Do not put or leave the device in a place where the LCD display will be exposed to direct sunlight for long periods of time. Note: To avoid damage to the oscilloscope or probes, do not expose them to sprays, liquids, or solvents. - Page 81 General Care and Cleaning Appendix A Harmful and Poisonous Substances or Elements Harmful and poisonous substances or elements Component Cr(Vi) PBDE Shell and Chassis Display Module Circuit Board Power Supply Electric Wire and Cable Assembly Connector Fastener and Installed Hardware Other Accessories (including probes) Others ‘X’...
Need help?
Do you have a question about the DSO 1062B and is the answer not in the manual?
Questions and answers