
Subscribe to Our Youtube Channel
Related Manuals for 3M SP-SE-2-1/1


Summary of Contents for 3M SP-SE-2-1/1
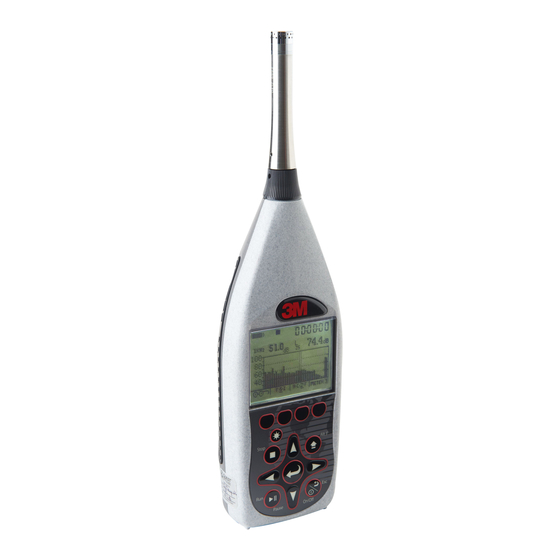
- Page 1 3M Personal Safety Division SoundPro SE/DL Series Sound Level Meters SoundPro User Manual...
- Page 2 • A non-condensing environment is required for proper measurements. • Intended Use: The SoundPro is intended to measure sound pressure levels in air. Consult your company’s safety professional for local standards, or call 3M at 1-800-243-4630. Models SE and DL...
-
Page 3: Table Of Contents
Table of Contents TABLE OF CONTENTS Introduction ......................1 Models and options ....................1 Frequency resolution ....................2 Octave bands .......................... 2 Third -octave bands ........................ 3 Naming bands ......................... 3 Analysis type ........................... 5 Logging explained....................5 Physical Characteristics ..................5 The Display .......................... - Page 4 Table of Contents Checking or changing type ....................15 Using power supply or auto adapter ..................17 Turning on ......................18 Start screen and the keypad ....................18 SoundPro functionality ..................19 The keypad explained ......................19 Indicators explained ......................20 Navigating ..........................
- Page 5 Table of Contents Setting up auto-run ....................38 Date setting ........................... 38 Days of week setting ......................40 Auto-run shutdown screen ....................42 Auto-run shutdown screen explained ................42 Timed run setting ........................43 Level-triggered auto-on setting ..................... 44 Locking setup or run mode ................... 46 Setting secure run or secure setup (locking) ................
- Page 6 Table of Contents Measurement range ......................60 Calibrate ........................61 Calibration screen ......................... 61 Pre-Calibration ......................... 61 Post-Calibration ....................... 61 Performing a calibration ......................62 Running a session/study ..................64 Measurement navigation ..................65 Using softkeys in measurement screens ................65 Changing displayed measurement ..................
- Page 7 Table of Contents Impulse noise ........................79 Reverberation options ......................80 Setting up reverberation ......................81 Running reverberation test ....................82 Reverberation results ......................83 RT60 summary screen ....................84 Viewing RT60 values of each band ................. 84 Deleting RT60 value in a filtered band ................84 Decay curve screen ......................
- Page 8 Table of Contents Conducting a level setup (for STI-PA) ................103 Running a speech intelligibility study .................. 103 STI-PA results screens ....................... 104 STI-PA measurement and scale results screen ............104 STI-PA modulation screen .................... 105 STI-PA modulation envelope screen ................106 Applying captured curves for STI-PA testing ..............
- Page 9 viii Table of Contents DC output ..........................123 Specifications ....................... 125 Conformance to standards .................. 125 Acoustics ........................125 EMC emissions and immunity ..................125 Mechanical characteristics .................. 125 Electrical characteristics ..................126 Power sources ....................... 126 Internal power ......................... 126 External power ........................
- Page 10 Auxiliary connector ......................135 Block Diagram for SoundPro ................136 Glossary of Terms ....................137 Customer service ....................149 Contacting 3M ...................... 149 Warranty ....................... 150 FIGURES SoundPro Models SE and DL and Option 1 and Option 2........... 1 Figure 1-1: Octave bands ........................
- Page 11 Table of Contents Setting Date parameters for Auto-Run #1 ..............39 Figure 4-2: Example of setting up Auto-Run (QSP-II) ..............40 Figure 4-3: Day of the Week (DOW) setup ..................41 Figure 4-4: Auto-Run Shutdown screen ..................42 Figure 4-5: Timed Run setup screen ....................
- Page 12 Table of Contents Curve results ......................... 97 Figure 6-17: Measurement type selection (STIPA) ................ 101 Figure 6-18: STI-PA setup screen ....................102 Figure 6-19: Level set-up and average decibel level ..............103 Figure 6-20: STI-PA measurement (scale results) screen ............104 Figure 6-21: STI-PA Modulation envelope screen .................
- Page 13 Table of Contents This page left blank intentionally Models SE and DL...
-
Page 14: Introduction
Octave bands Introduction The SoundPro SE and DL series of sound level meters (SLM) from 3M are advanced instruments with highly adaptable characteristics. This manual explains the features and functions of all models in the series and points out distinctions between the models. -
Page 15: Frequency Resolution
Frequency resolution Octave bands Frequency resolution The sounds we hear are rarely pure tones at a single frequency but rather a mixture of frequencies of varying amplitudes. Some sounds, such as a whistle or a horn, have frequencies concentrated in relatively narrow regions of the audio spectrum, which ranges from approximately 20 Hz to 20,000 Hz. -
Page 16: Third -Octave Bands
Frequency resolution Third -octave bands Third -octave bands Each octave band can be divided into three adjacent bands called third- octave band. Because of the logarithmic relationship between adjacent bands, the center frequencies of third-octave bands differ from each other by 26%. -
Page 17: Table 1-1: Acoustical Range Bands
Frequency resolution Naming bands Exact Center Names of Octave Names of Third-octave Bands (Hz) Frequency (Hz) Bands (Hz) 12.589 12.5 15.849 19.953 25.119 31.623 31.5 31.5 39.811 50.119 63.096 79.433 100.00 125.89 158.49 199.53 251.19 316.23 398.11 501.19 630.96 794.33 1000.0 1000 1000... -
Page 18: Analysis Type
Logging explained Analysis type Analysis type All SoundPro SE/DL instruments are capable of analyzing sound signals over the full bandwidth of the instrument also referred to as “broadband measurement”. If your instrument comes equipped with a filter, it can perform an octave or a third-octave analysis, or both, depending upon the type of filter installed. -
Page 19: Hardware Interfaces
Physical Characteristics Hardware interfaces both numerically and graphically. This is explained in further detail in Chapter 2, “The Display and keypad”). Hardware interfaces The Hardware Interface Panel, shown in Figure 1- 4, is located under a hinged cover in the base of the instrument. The cover can be lifted by a tab at one side, and snapped shut again by closing and pressing firmly at the center. -
Page 20: Ac/Dc Port
Physical Characteristics Hardware interfaces AC/DC port Connect a cable with a standard 3.5 mm stereo plug to this jack to obtain AC and DC output signals. Users are responsible for providing their own cable. Power jack DC power can be delivered to the instrument through the Power jack. Power will be taken from the external source rather than the instrument’s batteries when the external source provides 8 to 16 volts DC (300ma minimum). -
Page 21: Information Screen
Screen contents The lines indicated in Figure 1-7 will contain the following information. Line 1 - Model number showing, in order, the 3M designation (SE or DL), the Class/Type (1 or 2) and the filter, if installed (1/1, 1/3 or blank). -
Page 22: Detection Management Software Dms
DMS Start Page Detection Management Software DMS 3M™ Detection Management Software DMS is used to record, report, chart and analyze data collected for assessment of select occupational health hazards in the workplace. Designed for dosimetry, sound level measurements, heat stress assessments and environmental monitoring, the software helps safety and occupational professionals: •... - Page 23 Detection Management Software DMS DMS Start Page This page left intentionally blank Models SE and DL...
-
Page 24: Getting Started
CHAPTER Checking the equipment DMS Start Page Getting Started This chapter provides the basic information you need to “get up and go” essentially right out of the box, including getting your first glimpses of SPL. Checking the equipment If your instrument was sent to you in a storage case, you will want to remove all the packaging and acquaint yourself with the equipment, so you can quickly get started. -
Page 25: Installing The Preamp
It will fit snuggly. Connecting an extension cable Extension cables are available from 3M as options and are typically used to distance the instrument body from the microphone to reduce distorting reflections from the instrument’s case. -
Page 26: Class/Type 1 And Class/Type 2 Instrument
Windscreen Use a windscreen that fits the tip of the microphone to reduce sound disturbances caused by physical contact and wind turbulence. 3M provides the WS-7 windscreen that fits a ½-inch microphone with every instrument kit. If you didn’t order a ½-inch microphone, or if you have one of different size, you may wish to order a windscreen for the other size. -
Page 27: Providing Power
Rechargeable batteries ~ The instrument does not contain a recharging • circuit. Recharge batteries externally using the recharging device available from 3M or a compatible device available elsewhere. Selecting batteries ~ Do not mix battery types or batteries with •... -
Page 28: Battery Power Explained
Providing power Battery power explained 5. Press the top edge of the lid to snap it into the latch. 6. Verify or set the type in the Battery Check screen. (See the next section “Checking battery power”.) Battery power explained The battery check screen is used to determine the battery/power status of the instrument. -
Page 29: Selecting Setup In The Start Screen
Providing power Checking or changing type Battery Check screen 1. Turn on the SoundPro SE/DL by pressing On/Off/ESC . You will be at the start screen. If turned on, ensure you are at the start screen by pressing On/Off/Esc •... -
Page 30: Using Power Supply Or Auto Adapter
If you obtained the optional Universal power supply 9V cable or the Auto DC Jack 12 VDC adapter from Auto 3M, plug them into their respective power sources adapter and the other end into the Power jack of the instrument. If the external power source provides... -
Page 31: Turning On
Turning on Start screen and the keypad Turning on 1. To turn on the SoundPro, press the On/Off/Esc key until the start screen appears. Start screen and the keypad The Start screen is the first screen you see when you power on and the last screen you see when you shut down. -
Page 32: Soundpro Functionality
SoundPro functionality The keypad explained SoundPro functionality The keypad explained The SoundPro SE/DL keypad consists of three general types of keys: soft- keys, navigation keys and dedicated keys. Keypad Explanation Used to view data, menus, and various 1. Display indicators. Used to illuminate the background of the 2. -
Page 33: Indicators Explained
SoundPro functionality Indicators explained Indicators explained Status information is provided by the instrument at the top of the display. Below is a summary of all of the indicators. Icon Significance Battery charge status. This icon shows the status/level of the batteries. -
Page 34: Navigating
Turning off Navigating Navigating To navigate to menus and data screens, the up/down arrows and left/right arrows are primarily used. The On/Off Esc button is also used as a navigational tool at any time you wish to move back one level. If you press ESC repeatedly, you will return to the start screen. - Page 35 Turning off Navigating This page left blank intentionally Models SE and DL...
-
Page 36: Basic Setups
CHAPTER Basic setups Navigating Basic setups This chapter covers the basic features and setups of SoundPro SE/DL that establish the instrument’s operating conditions. For information about the more advanced SoundPro SE/DL features and their setups, see Chapter 4, “Advanced setups.” For information on setting-up and measuring add-on features (Reverberation, STI-PA, or Curves), please see Chapter 6. -
Page 37: Changing Microphone Settings
Basic setups Changing microphone settings Changing microphone settings Microphone settings This procedure applies only to Class/Type 1 models. 1. Turn on the SoundPro SE/DL by pressing On/Off/Esc If turned on, ensure you are at the start screen by pressing •... -
Page 38: Time And Date
Basic setups Time and date 6. Press Enter . The result will be one of the following: For Sensitivity and Range Cap fields - The highlighting moves to the • data field. Press Up/Down arrows to change the value. Polarization field - Polarization remains highlighted. Continue to press •... -
Page 39: Measurement Type (Slm, 1/1, 1/3, Sti-Pa, Rt60)
Basic setups Measurement type (SLM, 1/1, 1/3, STI-PA, RT60) NOTE: To move to between the time, day, day fields, press Enter repeatedly until one of these fields are highlighted and then press Up/Down arrow to move between the fields. 5. -
Page 40: Meter 1/Meter 2 Parameters (I.e. Response Time, Weighting)
Basic setups Meter 1/Meter 2 Parameters (i.e. response time, weighting) Meter 1/Meter 2 Parameters (i.e. response time, weighting) Setting up Meter 1 and Meter 2 parameter settings are changed through the softkeys and the Measure Set screen of the SoundPro. ... -
Page 41: Measurement Setup (For Community Noise)
28 Basic setups Measurement setup (for community noise) NOTE: For quick and easy access, there are three optional screens to change the timed response and the weighting. These are in the following SoundPro screens: Measures Set screen, View Current Study screen, and View Session study screen. -
Page 42: Table 3-2: Measures Screen Explained
29 Basic setups Measurement setup (for community noise) CNEL – Press Enter to select data field. Press Enter • repeatedly to toggle between On/Off setting. – Press Enter to select data field. If marked “N/A,” see “C- • A measurement settings.” TAKTMX ~ Press Enter one or more times to select 3 sec., 5 •... -
Page 43: C-A Measurement Settings
30 Basic setups Measurement setup (for community noise) C-A measurement settings The C-A measurement is determined from concurrent measurements of the SPL by both meters. It can only be made if certain settings for Meter 1 and Meter 2 are compatible. If any incompatibility exists, the L selection in this screen will be marked N/A (Not Available). -
Page 44: Logging
Logging Logging options Logging Logging options If the logging option was purchased, you will have the following four types of measurement options: Figure 3-7: Logged Data Chart example Average (AVG on the display), Peak, Maximum (MAX on the display), • Minimum (MIN on the display). -
Page 45: Setting Logging Options
Logging Setting logging options Setting logging options To set logging only options (Average, Peak, Maximum, Minimum) Enabling or disabling logging options 1. Ensure you are at the start screen. If turned on, repeatedly press On/Off/Esc until you return to the •... -
Page 46: Setting Up Display Options
Setting up display options Setting logging options 6. Press Enter to move to the data field. If it is Off and you want to set a percentage, press Enter repeatedly until a percentage appears. To disable, repeatedly press Enter until “Off” appears. a. -
Page 47: Language
Setting up display options Language Language You can choose a different language for the displayed text. A change in lan- guage takes effect when you exit the Language screen. Changing the language 1. Ensure you are at the start screen. If turned on, repeatedly press On/Off/ESC until you return to the •... -
Page 48: Backlight
Setting up display options Backlight Backlight Typically, the SoundPro is shipped with the backlight setting enabled. With a quick press of the backlight button from the keypad, you can quickly turn on and turn off the backlight. Backlight The backlight feature has an optional timed setting for various second intervals ranging from 1 second to 60 seconds. -
Page 49: Contrast
Setting up display options Contrast 7. To set the backlight, press the backlight button on the keypad. Contrast The contrast adjustment affects all pixels in the LCD screen. Choose a level that looks best to you. NOTE: If the contrast level is set too high, icons and the RunTime clock in the Status Region of the display can be ghosted (visible in this display although they’re not supposed to show). -
Page 50: Advanced Setups
CHAPTER Advanced setups This chapter covers the SoundPro models SE and DL features listed below, all of which provide capabilities beyond the essential ones required for basic model setup and basic sound measurement. For information about basic Chapter 3, “Basic SoundPro models SE and DL features and setups, see setups.”... -
Page 51: Auto-Run
Auto-Run Date setting Auto-Run SoundPro SE/DL has four automatic run modes which include: Date auto- start with duration, Day of the Week auto-start with duration, Timed Run (duration only setting), and Level Triggered Runs (or Level auto-start runs). Setting up auto-run All Auto-Run setups begin in the Auto-Run screen. - Page 52 Setting up auto-run Date setting 5. Press one of the four softkeys in the Auto-Run Date screen to assign a numbered setting (i.e., “Auto-Run #1). NOTE: if setting up for the first time, the Date screen will appear as “Auto-Run”...
-
Page 53: Days Of Week Setting
Setting up auto-run Days of week setting NOTE: To enable Auto-run, ensure the instrument is powered off and the date and time settings were programmed for the future. 10. When powered off, an Auto-Run shutdown screen will appear. (Please see section, “Auto-Run shutdown screen”.) Days of week setting The Days of the Week (DOW) setting is a pre-programmed weekly auto-run with... -
Page 54: Day Of The Week (Dow) Setup
Setting up auto-run Days of week setting 5. To set the Days, press Enter to move between the fields. To program a day, press Up/Down to select a day setting. The first character of the day will appear when selected. The Days field is organized in the following sequence: Sunday (S), •... -
Page 55: Auto-Run Shutdown Screen
Setting up auto-run Auto-run shutdown screen Auto-run shutdown screen When either the Date mode or the Date of the Week (DOW) settings is enabled and you power down the instrument, you will be alerted by an Auto- Run Shutdown screen just before the instrument turns off. This screen, illustrated below, appears after the normal power-down countdown and remains visible for approximately ten seconds. -
Page 56: Timed Run Setting
Setting up auto-run Timed run setting Timed run setting In Timed Run mode, you program the instrument’s duration (or timed run) and then manually start your study, which can be applied as many times as you wish. The auto-run will end when the duration expires. ... -
Page 57: Level-Triggered Auto-On Setting
Setting up auto-run Level-triggered auto-on setting Level-triggered auto-on setting The level-triggered screen contains meter 1 parameters which include a Filter mode, Frequency level, “Level On” and “Level Off” modes, and a specification for either run/stop or run/pause modes. Viewing or changing level-triggered mode From the start screen, press Up/Down to highlight Setup and press Enter... -
Page 58: Table 4-1: Level Triggered Auto-On Settings Explained
Setting up auto-run Level-triggered auto-on setting Level- Explanation of Settings Triggered After selecting specific filter mode settings, the instrument is set to trigger B. Action based on Run/Pause mode or Run/Stop mode. The source can be set to Meter 1, Meter 2, filters, curve, external trigger, C. -
Page 59: Locking Setup Or Run Mode
Locking setup or run mode Setting secure run or secure setup (locking) 10. To activate Triggered Run on the Meter 2, press the right arrow and select one of the five sources by pressing Enter repeatedly until you are viewing the appropriate feature. (If you are only setting Meter 1, please skip this step.) 11. -
Page 60: Secure/Lock Screen
Locking setup or run mode Setting secure run or secure setup (locking) Setting secure run or secure setup (locking) 1. From the start screen, press the Lock softkey. Lock: Press 4 softkey to select “Lock” screen Figure 4-8: Secure/Lock option 2. -
Page 61: Adding Code For Secure/Lock Screen
Locking setup or run mode Setting secure run or secure setup (locking) 3. (Skip this step if securing setup and see step 4.) To set Secure Run Mode, press Enter and “0000” will appear. NOTE: if you want to set the code as “0000,” press Enter repeatedly until “enabled”... -
Page 62: Disabling Secure Run Or Secure Setup (Unlocking)
Locking setup or run mode Disabling secure run or secure setup (unlocking) 4. To set Secure Setup Mode, ensure it is highlighted by pressing Down arrow. Once selected, press Enter and “0000” will appear. (See Figure 4-10 for a screen example.) (Also, you must be in stop mode.) To select a numeric code, press Up/Down arrows to select a •... -
Page 63: Digital Outputs/Triggering
Digital outputs/Triggering Tracking runs Digital outputs/Triggering All digital output signals (also referred to as “Triggering”) appear on pins of the Auxiliary Port (“Auxiliary port” on page 7). Manage these digital outputs in the Ext-Trigger screen. Tracking runs The instrument can be configured to use a digital output to signal the start or end of a run. -
Page 64: Digital Outputs And Spl
Communications Digital outputs and SPL Digital outputs and SPL The instrument can also be configured to use a digital output to signal if the current SPL measurements exceeds a specified level. Managing SPL digital outputs (See Figure 4-13 above) 1. -
Page 65: Qsp/Serial
Communications QSP/Serial QSP/Serial (Figure 4-14). For QSP-II communications, USB should be set to “QSP/Serial”. The RS-232 channel should be turned off for low power consumption. Figure 4-14: QSP/Serial Mass Storage When the USB channel is set for Mass Storage mode the user will have direct access to the instruments SD card through programs such as “Windows file manager”. -
Page 66: Viewing Real-Time Measurements Remotely
Communications Viewing real-time measurements remotely USB communications If a session is running, stop it. In the Start screen, press to select Setup, then press . The Setup screen appears. In the Setup screen, press the arrow keys to select Comm Set, then press and the Comm-Set screen appears. -
Page 67: Gps
Communications The SoundPro has the capability of embedding GPS information into study headers. To interface a GPS, you need a GPS receiver with RS-232 communications that conform to NMEA 0183 version 2 and the optional 053- 729 Serial Cable. In many cases, a Male-Male DB-9 null modem connector will be required as well. -
Page 68: Figure 4-18: Viewing Gps Coordinates In Comm-Set Screen
Communications Status line - This data field at the right on this line tells you whether GPS is • enabled or not. You may see “No Fix” below this line, which tells you that, although enabled, the instrument is not receiving the satellite signal. Position line - When the satellite signal is being received, there will be two •... - Page 69 Communications This page left blank intentionally Models SE and DL...
-
Page 70: Preparing To Measure & Running
CHAPTER Virtual meters Meter 1/Meter 2 explained Preparing to measure & running This chapter explains the steps needed to prepare the SoundPro for measuring and how to run measurements. It will also show you sample measurement result screens and explain the contents of the screens. Virtual meters SoundPro SE/DL operates with two parallel measurement systems called meters. -
Page 71: Overview Of Running A Session/Study
Overview of running a session/study Meter 1/Meter 2 explained Overview of running a session/study The list below is a brief overview of the steps for running a study. Quick Help List 1. Turn the SoundPro on and check your battery power. (See Chapter 1). 2. -
Page 72: Preparing To Measure
Preparing to measure Sessions and Studies Preparing to measure Sessions and Studies efore you begin running a session/study, there are a couple items to consider: Understanding sessions and studies • Adjusting the measurement range before running a study • Calibrating the instrument •... -
Page 73: Measurement Range
Preparing to measure Measurement range Measurement range You select the decibel range before running the first study in the session. Setting the measurement range helps keep the desired measurements within the linear range of operation. If you don’t make an optimal range selection, low levels of sound can be hidden in the instrument noise (below the noise floor of the instrument), and high levels of sound can be distorted (the instrument is “overloaded”). -
Page 74: Calibrate
You can calibrate the instrument in the field with reference to the output of a calibrated sound source. 3M offers a line of acoustic calibrators that are available (such as the QC10/20). -
Page 75: Performing A Calibration
Calibrate Performing a calibration calibrate during a pause, the new calibration results replace the previous Post- Calibration results without affecting the Pre-Calibration results. You will not see Post-Calibration results if a pre- calibration was performed but not followed by a Post-Calibration. Performing a calibration Before beginning your calibration, ensure the calibrator has sufficient battery power to perform the calibration. -
Page 76: Setting Pre-Cal Screen
Calibrate Performing a calibration Measurement value displayed graphically Measurement value Press up/down softkey to increase/decrease cal value Figure 5-3: Setting pre-cal screen Allow the measurement to stabilize and then press Arrows to set 114.0 dB level. Press Enter to store the new calibration. The Calibration History screen will appear with the new calibration values in the display. -
Page 77: Running A Session/Study
Running a session/study Performing a calibration Pause indicator Post-Cal Displays post- calibration information Figure 5-5: Post-Calibrate history screen Running a session/study You run a “session”, commonly called opening a session, by running (or starting) the first measurement. To run a “study”, you would press pause and then proceed in the run mode. -
Page 78: Measurement Navigation
Measurement navigation Using softkeys in measurement screens NOTE: The Lookup softkey is used to change the measurement options. There are five selections which include: SPL, Leq, Lpk, Lmax, Lmin.(See “Changing displayed measurement” for more information, on page 66.) Measurement navigation You can navigate through the measurement screens by repeatedly pressing . -
Page 79: Changing Displayed Measurement
Measurement navigation Using softkeys in measurement screens softkeys, the menus are visible in Softkey Region (i.e., “Cal” for Calibration menu). If necessary, press the Alternate Functions key ( ) to toggle the contents of the Softkey Region. Changing displayed measurement You can change the displayed measurement in any viewing area at any time. -
Page 80: Measurement Screen Icons
Measurement screen icons Descriptor types options, please see “Measurement type” on page 26 and “Meter 1/Meter 2 parameters” on page 27.) Measurement screen icons The measurement screen descriptors and icons identify certain conditions that exist currently in the display. Press (Alternate Functions key) to toggle the contents of the Softkey Region until you see the Viewing Descriptors. -
Page 81: Measurement Screens
Measurement screens Bar Chart and Filtered Bar Chart Measurement screens Bar Chart and Filtered Bar Chart The first screen you’ll see in a viewing area contains a bar chart for broadband or filtered measurements. For the bar chart screen, the amplitude of the displayed measurement is shown both graphically by the length of the bar and numerically below the bar. -
Page 82: Community Noise Screen
Measurement screens Community Noise screen Making changes to the Bar Chart or Filtered Bar Chart screen 1. T he Range - The scale, shown above the chart, is fixed and cannot be changed in the run or pause mode (or if you are viewing past studies). If the session is in stop mode (or closed), press to change the range. -
Page 83: Dosimetry Screen
Measurement screens Dosimetry screen Dosimetry screen The Dosimetry screen provides several types of measurements of the accumu- lated personal exposure to noise. See “Setting logging options” on page 32 for details. Dosimetry View Shows accumulated personal exposure to noise. • These measurements are affected by the settings in the “Meter Set”... -
Page 84: Tabulation Screens
Measurement screens Tabulation screens Tabulation screens The Tabulation screen shows measurements for two broadband measurements and for all the bands for the selected analysis type. For octave analysis, all bands are visible in a single tabulation screen. When viewing third-octave analysis, however, it takes three screens to display the tabulated measurements for all bands. -
Page 85: Time History/Back-Erase Screen
Time History/Back-erase screen Tabulation screens Time History/Back-erase screen When conducting a broadband study, you can view as much as the last 20 seconds of Max SPL in this screen. The current Max appears at the right border of the Time Log chart (time=0) and advances, in one-second increments, toward the left border of the chart. -
Page 86: Results Of Back-Erasing
Back-erasing Results of back-erasing Results of back-erasing Back erasing causes the following changes to the study and to the session in which the study occurs. Run times - The run time of the back-erased study is shortened by • the duration of the removed segment. The run time of the session is also reduced by the same amount. -
Page 87: Time Log Screen
Back-erasing Results of back-erasing Duration - The length, in time, of the segment to be back-erased is • given in the Softkey Region of the display. Figure 5-14: Time Log screen You can adjust the Time Line by pressing When you have the Time Line in position, press . -
Page 88: Stopping A Session
Back-erasing Stopping a session Stopping a session You can stop the session manually or with a trigger command, but only when the instrument is in the Pause state. When the session is stopped, the Stop icon , appears in the Status Area and the RunTime clock is zeroed. For information about using triggers, see “Digital Outputs/Triggers”... - Page 89 Back-erasing Stopping a session This page left blank intentionally Models SE and DL...
-
Page 90: Rt60, Curves, And Sti-Pa
In this chapter, it is important to note that these features are additional add-on options and may not be available on your SoundPro model unless you specifically purchased these features. Please see 3M’s website 3m.com/detection for more information: • Reverberation •... -
Page 91: Reverberation Time (Rt60)
Additional options Reverberation time (RT60) Reverberation time (RT60) Reverberation time is a measurement used to evaluate and measure sound decay in a specific space, tailored to speech or music, such as: classrooms, auditoriums, gymnasiums, concert halls/theatres, (etc..). For room acoustic, results are used to ensure quality sound is evenly dispersed throughout a specific room with limited echoes/refractions. -
Page 92: Interrupted Noise
Additional options Reverberation (RT60) methods Interrupted noise The Interrupted noise method, applied with pink noise, is used with a portable sound system, such as a dodecahedral speaker, or with an existing sound system (only recommended if the sound system has a quality, omni-directional, sound system.) With the interrupted noise method, the sound source emits a high-level source and falls-off, returning to its original ambient background level. -
Page 93: Reverberation Options
Additional options Reverberation options Reverberation options The following setup options are selectable via the Reverberation Time Options Setup menu (displayed in Figure 6-3). Field Description Explanation of field selections Interrupted – (This is the default method setting.) Method Interrupted method uses a constant sound source (i.e., dodecahedral Selecting the speaker), waiting for the level to stabilize, and then the source is turned calculation process... -
Page 94: Setting Up Reverberation
Additional options Setting up reverberation Setting up reverberation The Reverb Time screen is used to change or view your reverberation settings. The steps below outline how to change the parameters. Please review Table 6-1: “Reverb time set-up options” for an explanation of parameters 1. -
Page 95: Running Reverberation Test
Additional options Running reverberation test Running reverberation test There are a couple factors to consider when conducting a reverberation test. Depending on if you will be measuring voice in a room, hall, theatre (etc..), ISO 3382 standard recommends measuring reverberation time for speech from 63 HZ to 4 kHz. -
Page 96: Reverberation Results
Additional options Reverberation results 3. Select RT60 as the measurement mode from the Start screen. Measurement type Select RT60 for Reverb testing Figure 6-4: Reverb Time Setup screen 4. , Please choose one of the following methods to conduct your test: •... -
Page 97: Rt60 Summary Screen
Additional options Reverberation results studies, you may want to review the data at the end of the session. In this example, you would access the File\Session\Data File screen and select a past study. (For more information, see “Viewing past sessions/studies” in Chapter 7.) RT60 summary screen This is a vertical bar chart that will plot the T60 values taken from each octave... -
Page 98: Decay Curve Screen
Additional options Reverberation results 2. Select the band to be deleted (by pressing left or right arrows.) 3. Press the Delete softkey. (Repeat steps if you wish to delete more bands.) Decay curve screen This chart displays the (average or ensemble) results of a single Reverb Decay curve from the study (i.e., one filter band)/or the average of all studies within that session. -
Page 99: Tabular Rt60 Screen
Additional options Reverberation results Tabular RT60 screen This is a table-formatted screen which details a summary of the Reverb Decay Curve of each band. The following table is a brief summary of the tabular data. Column Explanation of data The Frequency column displays the chosen filter bands (for 1/1 Octave the Freq range is 63Hz –... -
Page 100: Curves
Curves Captured curve applications Curves Curves, also referred to as “Acoustic Spectral Curves”, is used to evaluate the quality of noise in new or existing buildings. The SoundPro models SE and DL support the following: Captured curves • Noise Criterion curves: NC curves, PNC curves, NCB curves, NR •... -
Page 101: Setting Up Captured Curves
Captured curves Setting up captured curves Setting up captured curves Setting up Captured Curves Settings and measurement settings 1. From the start screen, select either 1/1 octave or 1/3 octave for the measurement type. (Repeatedly press first softkey.) Selecting Measurement type Press first softkey until 1/1 or 1/3 is selected Figure 6-8: Selecting measurement type for curves... -
Page 102: Figure 6-9: Captured Curves And Survey Mode
Captured curves Setting up captured curves Evaluation Mode: evaluates the noise levels against specific criterion. • This is primarily used when you are capturing one to four different curves. With this option, you assign a Capture name (Cap-1, Cap-2, Cap-3, Cap-4) in the setup menu and then run a captured curve study. To assign a new captured curve name, you return to the Options menu, select a name and then return back to view session mode and run your study. -
Page 103: Running Captured Curves
Captured curves Running captured curves Running captured curves Capturing a curve allows you to take a snapshot of the current octave noise profile. Once the captured curve is selected and applied, the SoundPro will automatically calculate the captured curve results with the STI-PA measurement. -
Page 104: Criterion Curve Families
Criterion curve families Types of Criterion Curves CAP-1 Press first Curve indicator softkey to assign a captured curve name (i.e., CAP- Capture 1, CAP-2, CAP- Press Capture 3, or CAP-4) softkey to Capture a curve. Figure 6-11: Capturing a curve (CAP-1) b. -
Page 105: Setting Up Criterion Curves
Criterion curve families Setting up criterion curves Preferred Noise Criterion Curves (PNC) – uses a tangency method but • accounts for lower frequencies compared with the NC method. Room Criterion Curves (RC) –calculates a numerical rating based on • speech interference and indicates any interference such as hissing, rumbling, or vibration. -
Page 106: Curves Setup Screen Example
Criterion curve families Setting up criterion curves 3. Press On/Off/Esc to return to the start screen. 4. Select Setup (use up/down arrows to highlight) and press Enter 5. Select Options menu (use up/down arrows to highlight) and press Enter 6. Select Curves menu (use up/down arrows to highlight) and press Enter Curves screen Evaluation mode Figure 6-13: Curves setup screen example... -
Page 107: Audiometric Background Curves
Audiometric background curves Setting up audiometric background curves Audiometric background curves The SoundPro SE/DL series supports the following two types of audiometric test room sound level curves: Audiometric Test Room Background Sound Level Curves (OSHA) • which compares the ambient noise readings to the maximum permissible ambient noise levels (MPANLs) at 500 Hz, 1K, 4K, 8K as specified by the OSHA Hearing Conservation Amendment (1983). -
Page 108: Selecting Measurement Type For Curves
Audiometric background curves Setting up audiometric background curves Next, select the measurement settings, by selecting View Session (use Up/Down Arrow to select) and press Enter 3. Select the following recommended meter 1 settings using the softkeys using the softkeys: measurement to Leq, Slow response, and Z- weighting. -
Page 109: Running And Viewing Curves
Running and viewing curves Curve measurements and results 10. (Skip this step if you selected OSHA AM Booth). To select a Criterion, press the down arrow and repeatedly press Enter . You have the following three settings in the testing ranges of 125Hz-kHz, 250Hz – 8kHz, and 500Hz-8kHz octave or one-third octave bands. -
Page 110: Figure 6-17: Curve Results
Running and viewing curves Curve measurements and results 3. To view your results, press Enter . The following screens appear. Sample bar chart – displays 1/1 octave band with curve and sound values plotted on the spectrum. (See “a” below: A- selected band, B- curve indicator, C- amplitude in band). -
Page 111: Speech Intelligibility
Speech Intelligibility STI-PA testing Speech Intelligibility Another available add-on feature is Speech Transmission Index (STI) used to evaluate and classify speech intelligibility dependent of background noise level. STI is the standardized measurement in the IEC 60268-16:1998 standard. STI-PA testing STI refers to the amount of modulation preserved in the broadcasting of an artificial speech signal through an alarm system. -
Page 112: Sti Scale
Speech Intelligibility Selecting STI scale or CIS scale STI scale The scale identifies if the mass notification system is intelligible or unintelligible based on a STI scale ranging from 0.0 to 1.0 where 0.5 to 1.0 is considered a passing score, per NFPA 72 and IEC 60849. -
Page 113: Conducting A Sti-Pa Test (Overview Of Steps)
NOTE: the Verifier default setting is Male. If using the test signal supplied by 3M, this uses a male test signal; so; you will not have to change this field if you only use the male test tone signal. -
Page 114: Measurement Type Selection (Stipa)
Speech Intelligibility STI-PA setup An optional “captured curve” feature can be applied to your STI-PA Post Process testing. Essentially, you take a snap shot of the current sound level field measurement and store it as your background noise. Once the background noise data is gathered, you can apply the captured noise during your STI-PA measurement. - Page 115 Speech Intelligibility STI-PA setup To change the Scale field, press Up/Down arrows until Scale is highlighted and press Enter to change to either STI or CIS. Speech Intelligibility screen Setup screen • Captured Curve selection If you captured background • noise and want to apply it, select Cap1, Cap2, Cap3, or Cap4 to apply during STI-PA...
-
Page 116: Conducting A Level Setup (For Sti-Pa)
Speech Intelligibility Conducting a level setup (for STI-PA) Conducting a level setup (for STI-PA) • From a fixed-point, measure the A-weighted Sound Pressure Level of your mass notification system (or alarm system). When in the STI-PA screen, adjust the range as needed via the Up/Down Arrows. •... -
Page 117: Sti-Pa Results Screens
Speech Intelligibility STI-PA results screens Play the signal over the loudspeaker and then locate yourself in the appropriate zone/room. Verify that the range setting is appropriate for the level being measured. It is desirable to select the longest range that does not overload. (To change the range, press Up/Down Arrows from the STI-PA screen.) Press the Run key to begin your study. -
Page 118: Sti-Pa Modulation Screen
Speech Intelligibility STI-PA results screens STI-PA modulation screen In the Modulation measurement screen, the average decibel level over the run- time in seven octave bands ranging from 125HZ to 8KHz with 14 frequencies is displayed in a tabular format. These values are the signal to noise ratio (accounts for any interfering background noise such as non-linear distortions, electronics, reverberation, HVAC systems) in each attenuation band and indicates which values are intelligible/unintelligible based on the CIS/STI scale. -
Page 119: Sti-Pa Modulation Envelope Screen
Speech Intelligibility STI-PA results screens STI-PA modulation envelope screen This screen reports a summary of the STI-PA modulation screen. To view each band’s results, press Arrow key. NOTE: The results can be used to assess each frequency’s band modulation level to determine why it passed or failed (in order to correct any issues). - Page 120 Speech Intelligibility STI-PA results screens Setting up Curves: Select Setup and press Enter • Select Options (via the Down Arrow and press Enter • Curves will be highlighted, press Enter • Choose Survey as the Mode and Captured (CAP) as the Type and then press On/Off/Esc repeatedly to return to the Start screen.
-
Page 121: Applying Captured Curves For Sti-Pa Testing
Speech Intelligibility STI-PA results screens CAP-1 Press first Curve indicator softkey to assign a captured curve name (i.e., CAP- Capture 1, CAP-2, CAP- Press Capture 3, or CAP-4) softkey to save the background noise/SPL. Figure 6-26: Captured curves/background noise 5. Once all background noise has been captured, refer to, “Applying captured curves” below. - Page 122 Speech Intelligibility STI-PA results screens Press the Run/Stop key while playing the test signal in the appropriate location/zone. The captured curve will automatically calculate with the STI- PA results. NOTE: press the left/right arrow to view the modulation screen and/or the modulation envelope screen if desired.
- Page 123 Speech Intelligibility STI-PA results screens This page left blank intentionally Models SE and DL...
-
Page 124: Viewing Past Measurements
CHAPTER Files STI-PA results screens Viewing Past Measurements This chapter explains how to view your past sessions and studies. It will also explain how to rename your sessions/studies and how to clear/reset the data on the memory card. Files A session file is automatically created when you begin the first study in that session. -
Page 125: File Directory Screen Explained
File directories File directory screen explained automatically stored in the Session Directory, and Configuration Files are automatically stored in the Configuration Directory. The File directories screen can be used to: • View past sessions/studies via the Session Directory menu • View Configuration directory •... - Page 126 File directories Viewing past sessions/studies (review mode) or session via the Data File screen. The results will be played back (also called review mode) in accordance with the analysis type that was selected when the measurements were stored. 1. From the Start screen, press the File softkey. Softkeys File Figure 7-2: Start menu screen...
-
Page 127: Figure 7-4: Data File Screen
File directories Viewing past sessions/studies (review mode) In the Data File screen, press Arrows to select one of the saved sessions and press Enter (to load the file). Data file Press “Load” softkey Figure 7-4: Data File screen 4. It will state “Loaded”. Press either Enter or On/Off/Esc key. -
Page 128: Loading And Deleting Files
File directories Loading and deleting files 6. A bar chart or a filtered bar chart may appear (depending on your measurement setting). Press Enter to view various measurement screens. Review mode indicator Bar chart (SLM mode) results File path – indicates the name of session/study, the analysis type (SLM, 1/1, 1/3) Figure 7-6: Viewing past data example... -
Page 129: Session Directory
File directories Session directory 4. To delete a file (if not applicable see step five), press to select appropriate file and press Delete softkey (see “a”). (The display will state the file was deleted.) Press key to return to the Data File screen. To delete more files, repeat this step. -
Page 130: Navigating In A Session/Config. Directory
File directories Session directory Navigating in a session/config. directory Press any arrow key to move around in the directory. If there are multiple files, press the More softkey to navigate to additional screens. Press On/Off/Esc key to return to previous screen(s). Naming and renaming files There are common procedures that you can use to name and rename files, including a lookup capability that allows you to determine if a filename is already... -
Page 131: Configuration Directory
Configuration directory Saving (& naming) setup file (config. file) Add a character by pressing the right arrow key. • Delete a character by pressing the left arrow key. • Repeat this step as necessary. • 5. When finished, press and Save will appear. 6. -
Page 132: Viewing, Loading, Deleting Setup Files (Config.)
Configuration directory Viewing, loading, deleting setup files (config.) 4. To change the file name follow below: • Press to change the selected character (denoted by the underline). • Optional Shortcut: press a softkey (has a character range) and then press to quickly move to the appropriate value. -
Page 133: Memory Card
3M can only guarantee operation with cards available from 3M. If using a memory card with 2GB or less, FAT 16 format is required. For cards ranging from 2GB to 32GB, a FAT 32 format is required. -
Page 134: Communicating
CHAPTER Communicating with a PC Using Detection Management Software DMS Communicating This chapter covers issues related to the memory card, the USB port and the AC/DC outputs. Communicating with a PC Using Detection Management Software DMS When you download the data via the the download feature, the data is stored and viewable via the data finder page with advanced charting, tables, and reporting capability. -
Page 135: Dms And Working With Soundpro Data
AC/DC output Using Detection Management Software DMS DMS and working with SoundPro data Viewing data and Data Finder Page 2. DMS Welcome page and instrument communication 1. Communicating/connecting the Edge to the pc A. Click on icon (see A) to access the Instrument download panel. -
Page 136: Ac/Dc Output
AC/DC output AC output AC/DC output Output signals are available at the AC/DC jack in the hardware interface panel at the base of the instrument (“Hardware interfaces” on page 6). Users are responsible for providing the cable to attach to this jack. For information about the pinout, see “AC/DC jack”... - Page 137 AC/DC output DC output This page left blank intentionally Models SE and DL...
-
Page 138: Specifications
Appendix A APPENDIX Specifications Conformance to standards Acoustics IEC 61672-1 (2003) (2002-05) - Electroacoustics, Sound level meters, Part 1: Specifications. IEC 61672-2 (2003-04) - Electroacoustics, Sound level meters, Part 2: Pat- tern evaluation tests. IEC 61260 (1995-08) - Electroacoustics, Octave-band and fractional-octave- band filters. -
Page 139: Electrical Characteristics
Appendix A Size - 7.9 cm(W) X 28.2 cm (H) X 4.1 cm (thick); (with preamp and microphone) 3.1"(W) X 11.1"(H) X 1.6" (thick) (with preamp and microphone) • The width is measured across the face of the instrument. The length, which includes the preamplifier but not the microphone, is measured along the longest axis of the instrument. -
Page 140: External Power
AC adapters - Included are different snap-on adapters that allow it to plug into various outlets. DC power source - 3M offers a cable as an option that plugs into an auto- mobile auxiliary jack, 3M part number 053-870. 9.0 Volts is the nominal power supply voltage to be applied to the DC power jack. -
Page 141: Octave Filters (Optional)
Appendix A Octave filters (optional) Number of bands ~ Eleven bands, with center frequencies (f ) ranging from 16 Hz to 16 kHz. The octave filters are flat within < 0.3 dB in each passband. The half-power points are at 0.707 f and 1.414 f Octave skirts ~ With respect to f •... -
Page 142: Humidity
(200 Volts must be set to “On”). Use for very high dB level free-field measurements. Requires a special preamp to handle high levels. Please contact 3M. QE4130 - Free field, Class/Type 1 (optional), ½-inch diameter (.52"), con- Models SE and DL... -
Page 143: Ac/Dc Outputs
Appendix A denser (200 volts must be set to “On”). Use for general, higher-level, free- field measurements. QE4150 - Free-field, Class/Type 1 (optional) ½-inch diameter (.52"), con- denser (200 volts must be set to “On”). Use for general free-field measure- ments. -
Page 144: Communications Ports
Appendix A Communications ports Auxiliary - For trigger signals and RS-232 communication. USB - Mini USB connector. This port is used for data and file transfers between the instrument and a personal computer. Measurements Types SPL measures - SPL, Average value (L or L ), Maximum value (L Minimum value (L... -
Page 145: Other
Storage - All calibrations for a session are stored in the related session file. Calibrators - All 3M Calibrators have an output of 114dB at 1 kHz, and some may have other settings. See “Preparing to calibrate” in Chapter 6) or additional information about calibrators. -
Page 146: Back-Erase
Appendix A Back-erase Erasing - Up to 20 seconds of sampled SPL data can be removed from the end of the last study. When removed, all calculations based on the removed segment of data are immediately updated. Editing - The length of the back-erased segment can be edited. Storage - Data removed by back-erasing is retained in the session file. -
Page 147: Optional Parts
Appendix A Optional parts Part Description Number 053-842 SoundPro SE/DL Class/Type 1 QE4170 microphone kit (QE4170 microphone and machined adapter to preamp). 053-843 SoundPro SE/DL Class/Type 1 QE4130 microphone kit (QE4130 microphone, 056-990 microphone-to-calibrator adapter and 059-344 windscreen). 053-844 SoundPro SE/DL Class/Type 1 QE4110 microphone kit (QE4110 microphone, microphone-to-calibrator adapter and 059-344 windscreen). -
Page 148: Port Pinouts
Appendix A Port pinouts AC/DC jack The pinout for the jack used for the AC/DC signals is displayed below in Figure A-1. This 3.5 millimeter jack is the same type of jack commonly used for stereo outputs in music systems. Figure A-1: Pinout for the AC/DC output jack Auxiliary connector The auxiliary connector in the base of the instrument can be used for input... -
Page 149: Block Diagram For Soundpro
Appendix A Block Diagram for SoundPro Models SE and DL... -
Page 150: Glossary Of Terms
APPENDIX Appendix B Glossary of Terms The C-A measurement is an SPL average that enhances the low- frequency components of the sound signal. Figure B-1: C-A weighting response curve Center frequency The center frequency of each octave and third octave filter band. CNEL Community Noise Exposure Level. -
Page 151: Dynamic Range
Appendix B Criterion Time. At the Criterion Level, the time period over which the resulting dose is 100%. Usually is 8 hours. Sound Level Meters use the decibel as the unit of measure known as Sound Pressure Level (SPL). SPL uses the ratio between a reference level of 20 microPascals (.00002 Pascals) and the level being measured. - Page 152 Appendix B Exceedance Level (Ln) Exceedance levels represent the percent of the run time that was spent at or above the corresponding dB level. Example: An L40 equal to 73 dB would mean that for 40% of the run time, the ...
- Page 153 Appendix B Exchange Rate of 3 dB. The display will switch to ExpHrs if RTIME is greater than 3600 seconds. ) 3.01 ⁄ – ] R TIM E Pa Level (L Notation used to represent sound pressure level measurements in IEC/ISO notation, where the measurements are made with particular frequency (F) and time (T) response parameters.
- Page 154 Appendix B Representing the Day/Night sound level, this measurement is a 24-hour average sound level where 10 dB is added to all of the readings that occur between 10pm and 7am. This is primarily used in community noise regulations where there is a 10 dB “penalty” for night time noise.
- Page 155 Appendix B NCB (Balanced Noise Criterion Curves ) This is the most recent incarnation of the curves based on Beranek’s work (1987). This curve family goes beyond a simple tangency method to try to ensure a more neutral characteristic to the noise spectrum and also accounts for speech interference such as: rumble, rattle, and hiss.
- Page 156 Appendix B PTWA This is a projected TWA determined for a projected time (Prt) in relation to the Criterion Time (CT) as follows. dB -------- - Peak –C The following chart illustrates the range of Sound Level with C-weighted Peak. Peak C Level Range Level Range (dB) Peak C Level Range (dB)
- Page 157 Appendix B Response time (F,S, I) Selectable time response settings used in SoundPro SE/DL measurements. The response time is a standardized exponential time weighting of the input signal according to fast (F), slow (S) or impulse (I) time response relationships. Time response can be described with a time constant.
- Page 158 Appendix B Burst duration, t (milliseconds) Figure B-4: Impulse response to a tone burst Room Criterion Curves (RC) Room Criterion curve’s was introduced in 1981 by Blazier to primarily rate noise in offices/room acoustics. This methodology calculates a numerical rating based on speech interference and indicates any interference such as hissing, rumbling, or vibration.
- Page 159 Appendix B Taktmx A time average over a sampling interval that uses the highest level occurring during the preceding Taktmaximal Interval, either three or five seconds, and assumes that it was present for the whole Taktmaximal Interval. Third-octave band A Third-octave band is defined as a frequency band whose upper band- edge frequency is 1.26 times the lower band frequency.
- Page 160 Appendix B Weighting (A, C, Z, F) SPL measurements are commonly weighted (scaled) in relation to their frequency components in order to provide a consistent basis for comparison to other measurements of the same type. In addition to the standardized A, C and Z weighting curves, you can select F- weighting (flat) which provides no weighting at all.
- Page 161 Appendix B This page left blank intentionally Models SE and DL...
-
Page 162: Customer Service
Customer service Contacting 3M Instrumentation Should your 3M equipment need to be returned for repair or for recalibration, please contact the service department at the following number or access the online form via the website. For technical issues, please contact Technical Support. -
Page 163: Warranty
FITNESS FOR PARTICULAR PURPOSE ARE LIMITED TO ONE YEAR FROM THE PURCHASE DATE. 3M shall not be liable for any other warranty, express or implied, arising out of or related to the appropriate use of hearing protection devices. Manufacturer or its agent’s liability shall be limited to replacement or repair as set forth above. - Page 164 Defined ..........137 Audiometric Background curves Communications Running ..........96 ... 53 View measurements remotley (log-to-port) Auto-Run Contacting 3M ......... 149 Date setting ........... 38 Criterion curves Days of week ......... 40 Running ..........96 Setting date ........... 39 Setting-up ..........92 Auto-run shutdown screen ......
- Page 165 Index ExpHrs Setting measurement type ..... 26 Defined ..........139 Third-octave band ........3 ExpSec Measurements Defined ..........139 Audiometric background curves .... 94 File Setups(Config) Bar chart ..........68 Creating or saving ....... 118 Changing what is displayed ....66 Files Community noise ........
- Page 166 Index Identified..........18 Room Criterion Curves (RC) Turning off ..........21 Defined ..........145 Overload Indicator ..........20 Indicator ..........20 Overload (OL) Lock ............47 Defined ..........142 Run Mode security ........46 Pascal (Pa) Running Defined ..........142 Quick help list ........
- Page 167 Index Loading ..........119 Steps, applying captured curves ..108 Setup files(Config.) Viewing result screens ......104 Viewing ..........119 Stop ............19 Setup screen Indicator ..........20 Auto-run with date of week ....40 Stop and pause Backlight..........35 Explained ..........
- Page 168 About Us 3M Detection Solutions is a world class manufacturer of rugged, reliable instrumentation and software systems that help monitor and evaluate occupational and environmental health and safety hazards, including noise dosimetry, sound level monitoring, heat stress, indoor air quality and select toxic/combustible gases. The 3M Detection brand of instrumentation is used by safety and industrial hygiene professionals to help comply with applicable occupational standards and regulations.
Need help?
Do you have a question about the SP-SE-2-1/1 and is the answer not in the manual?
Questions and answers