Table of Contents
Advertisement
Quick Links
Th ree Ph ase Pow er Meter
PCE-83 0+PCE-6801/6802/300 7
Users Manual
PCE Americas Inc.
711 Commerce Way
Suite 8
Jupiter
FL-33458
USA
From outside US: +1
Tel: (561) 320-9162
Fax: (561) 320-9176
info@pce-americas.com
www.pce-instruments.com/english
www.pce-instruments.com
PCE Instruments UK Ltd.
Units 12/13
Southpoint Business Park
Ensign way
Hampshire / Southampton
United Kingdom, SO31 4RF
From outside UK: +44
Tel: (0) 2380 98703 0
Fax: (0) 2380 98703 9
info@industrial-needs.com
Advertisement
Table of Contents

Related Manuals for PCE Instruments PCE-830


Summary of Contents for PCE Instruments PCE-830
- Page 1 PCE Americas Inc. PCE Instruments UK Ltd. 711 Commerce Way Units 12/13 Suite 8 Southpoint Business Park Jupiter Ensign way FL-33458 Hampshire / Southampton United Kingdom, SO31 4RF From outside US: +1 From outside UK: +44 Tel: (561) 320-9162 Tel: (0) 2380 98703 0...
- Page 2 EN 61010-2-032 CAT III 600V Pollution Degree 2 Definition of Symbols: Caution: Refer to Accompanying Documents Caution: Risk of Electric Shock Double Insulation Over-voltage category III (CAT III): equipment in fixed installations. WARNING: If the power analyzer is used in a manner Not specified by the manufacturer, the protection Prov ided by the clamp meter may be impaired.
- Page 3 Do not use the flexible current probe before you read the following instructions. 1. Do not install the flexible current probe around bare conductors carrying a voltage from 30V to 600V unless you are wearing protective clothing and glove suitable for high-voltage work.
-
Page 4: Table Of Contents
TABLE OF CONTENTS I. FEATURES......................... 1 II. PANEL DESCRIPTION ..................2 III. OPERATING INSTRUCTIONS..............11 III.0. Set up before operation....................13 III.1. Power Quality of a 3 Phase 4 Wire (3P4W) System............. 15 III.2 Power Quality of a 3 Phase 3 Wire (3P3W) System............17 III.3 Power Quality of a Single Phase (1P2W) System ............ - Page 5 IX. SET THE CALENDER CLOCK ..............47 X. PROTOCOL OF RS-232C INTERFACE ............48 XI. SPECIFICATIONS (23℃± 5℃)................49 XII. BATTERY REPLACEMENT.................59 XIII. MAINTENANCE & CLEANING ..............61 XIV. NOMENCLATURE..................62...
-
Page 6: Features
I. FEATURES ■ Analysis for 3P4W, 3P3W, 1P2W, 1P3W ■ True RMS value (V and I ■ Active Power (W, KW, MW, GW) ■ Apparent and Reactive Power (KVA, KVAR) ■ Power Factor (PF), Phase Angle (Φ) ■ Energy (WH, KWH, KVARH, PFH) ■... -
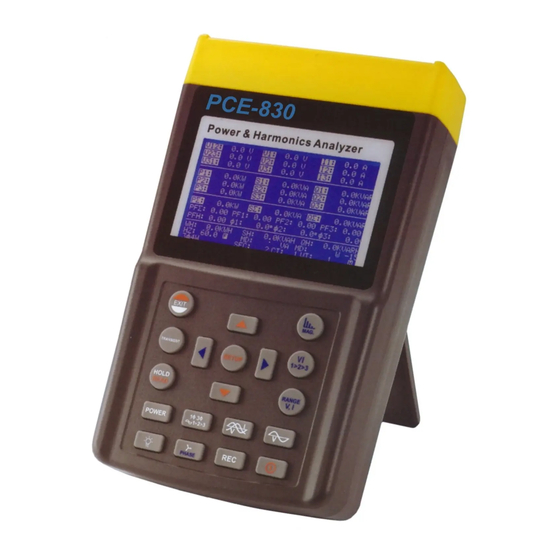
Page 7: Panel Description
II. PANEL DESCRIPTION PCE-830... - Page 8 1. Input Terminal for Neutral Line (Voltage) 2. Voltage Input Terminals for Each Phase (V1, V2, V3) 3. External DC Input (The AC adaptor must be 600V isolated) 4. Current Input Terminals for Each Phase (I1, I2, I3) 5. LCD Display 6.
- Page 9 Press this button to exit transient detection or to exit SETUP menu. Press this button to perform transient detection. Press this button to hold the data displayed in LCD. Press this button and then REC button to record the displayed data. Press HOLD button again to continue operation.
- Page 10 Press this button to select V1, I1, V2, I2, V3, or I3 for harmonics analysis Press this button for the voltage or current input range Press this button to enter SETUP mode and then select the parameter to be adjusted Press this button to increment value by one.
- Page 11 indicator. In the mode of power measurement, press this button to display the phasor diagram. In the mode of harmonic analysis, press this button to display phase angle instead of magnitude. Press this button to turn the back light on. Press it again to turn the back light off.
- Page 12 PCE-6801 Current Probe (100A) 100A 1. Jaw Assembly 2. Trigger 3. Range Selector 4. 6 pin mini DIN connector NOTE: To setup 100A current probe as selected probe, press the SETUP button to select CLAMP. When the CLAMP is reverse video, press the ▲ or ▼ button to select 100.
- Page 13 PCE-6802 Current Probe (1000A) 1000A 100A 1. Jaw Assembly 2. Trigger 3. Range Selector 4. 6 pin mini DIN connector NOTE: To setup 1000A current probe as selected probe, press the SETUP button to select CLAMP. When the CLAMP is reverse video, press the ▲ or ▼ button to select 1000.
- Page 14 1. Coupling Assembly 2. Flexible Loop 3. Mini-DIN connector for Output Output Range Select Switch...
-
Page 15: Operating Instructions
III. OPERATING INSTRUCTIONS NOTE: Select the correct CLAMP in the SETUP menu. When the current probe is connected to the power analyzer, power analyzer will automatically detect the range selected. NOTE: Select the correct frequency (Hz) in the SETUP menu. WARNING: All the current probes connected to the power analyzer must be of the same model and same range. - Page 16 NOTE: Please pay special attention to the flexible current probes (model 3007/3009) connected to the power analyzer. 1. Connect the flexible probe around the conductor. 2. Make sure the current flowing direction is in consistent with the arrow marked on the probe coupling. If the flexible current probe is connected in the right orientation, the correct phase will be displayed in the oscilloscope.
-
Page 17: Iii.0. Set Up Before Operation
III.0. Set up before operation a. Press SETUP button to enter setup screen. Press SETUP again to select the item for setting (the selected item will be displayed in reverse video). b. After selecting the item, press ▲ or ▼ buttons to set up its value. c. - Page 18 4. Hz: set up the frequency (50, 60 or AUTO) of the system. 5. PT: set up PT value. 6. CT: set up CT value. 7. SEC: set up the interval seconds of logged data. 8. CLAMP: set up the clamps selected (100A, 1000A, 3000A or 1200A). 9.
-
Page 19: Iii.1. Power Quality Of A 3 Phase 4 Wire (3P4W) System
III.1. Power Quality of a 3 Phase 4 Wire (3P4W) System 3 4W POWER 100A (HARMON) 100A (POWER) (HARMON) 100A (HARMON) 100A (POWER) (HARMON) 100A (HARMON) 100A (POWER) (HARMON) a. Turn the power on. Press the POWER and the 1Φ3Φ buttons to select... - Page 20 the 3P4W system. The type of system will be displayed at the left bottom corner in the LCD. b. Connect the four test leads to the voltage terminals V1, V2, V3 and the V (Neutral) of the system. c. Connect the test leads to L1, L2, and L3 of the 3P4W system. d.
-
Page 21: Iii.2 Power Quality Of A 3 Phase 3 Wire (3P3W) System
III.2 Power Quality of a 3 Phase 3 Wire (3P3W) System... - Page 22 3 3W 100A (HA RMON ) 100A (POWER) (HA RMON ) POWER 100A (HARMON) 100A (POWER) (HARMON) 100A (HARMON) 100A (POWER) (HARMON) a. Turn the power on. Press the POWER and the 1Φ3Φ buttons to select the 3P3W system. The type of system will be displayed at the bottom right of the LCD.
-
Page 23: Iii.3 Power Quality Of A Single Phase (1P2W) System
III.3 Power Quality of a Single Phase (1P2W) System 1 2W POWER 100A (HARMON) 100A (POWER) (HARMON) a. Turn the power on. Press the POWER and the 1Φ3Φ buttons to select the 1P2W system. The type of system will be displayed at the bottom right of the LCD b. -
Page 24: Iii.4 Power Quality Of A 1 Phase 3 Wire (1P3W) System
III.4 Power Quality of a 1 Phase 3 Wire (1P3W) System 1 3W 100A (HARMON) 100A (POWER) (HARMON) POWER 100A (HARMON) 100A (POWER) (HARMON) a. Turn the power on. Press the POWER and the 1Φ3Φ buttons to select the 1P3W system. The type of system will be displayed at the bottom right of the LCD. -
Page 25: Iii.5 Measurement Of A System With Ct Or Vt
III.5 Measurement of a System with CT or VT 3 4W+PT+CT PT 3 Y-Y連接 a. Turn the power on. Press the POWER and the 1Φ3Φ buttons to select the 3P4W system. The type of system will be displayed at the bottom right of the LCD. - Page 26 Press the SETUP button and the VT symbol will be shown in reverse video in LCD. g. Press the ▲ or ▼ buttons to increment or decrement the RATIO specified by the VT. h. Press EXIT to return to POWER mode. All the parameters of the system will be shown in LCD For the meaning of each parameter, refer to XIV.
-
Page 27: Iii.6 Harmonic Analysis Of Voltage Or Current
III.6 Harmonic Analysis of Voltage or Current (Normal Voltage without Distortion and Harmonics) (Distorted Current with Harmonics) a. Set up the analyzer for measurement of any power system (3P4W, 3P3W, 1P2W, or 1P3W). To see the harmonic analysis of voltage or current, users can press the MAG. - Page 28 b. Once the MAG. button is pressed, the waveform will be shown in the left part in LCD, and the 1 to 50 order harmonics will be shown in the right part in LCD. c. The positive and negative peak values will be shown in the waveform (Vpk). d.
-
Page 29: Iii.7 Display The Phase Angle Of Harmonics
III.7 Display the Phase Angle of Harmonics When the MAG. is pressed the magnitude of each harmonics is displayed. To review the phase angle of each harmonic, users can press the PHASE button. The phase angle shall be displayed next to the %. This phase angle is measured from the sampled waveform. -
Page 30: Iii.8 Measurement Of Maximum Demand
III.8 Measurement of Maximum Demand 1. Set the time interval for maximum demand (refer to section VII) 2. The analyzer will integrate the KW and KVA over the specified interval. 3. The maximum demand (MD) will be updated if new demand is greater than the previous value. -
Page 31: Iii.9 Waveform Of Voltage And Current
III.9 Waveform of Voltage and Current Press this button to display waveform of voltage and current at the same time. Press this button to select different inputs (V1, I1), (V2, I2), or (V3, I3). NOTE: The triggering point is the zero crossing point of V1 for V2, V3, I2, and I3. The triggering point for I1 is its own zero crossing point in case V1 is not present. -
Page 32: Iii.10 Waveform Of Voltage Only
III.10 Waveform of Voltage Only Press this button to display voltage waveform only. The true RMS value of voltage will be displayed at the bottom in LCD. Press this button to select V1, V2, or V3. NOTE: The triggering point is the zero crossing point of V1 for V2 and V3. NOTE: In the mode of displaying waveform, one period/cycle of 1024 data is displayed. -
Page 33: Iii.11 Graphic Phasor Diagram
III.11 Graphic Phasor Diagram Press this button to display the phasor diagram. The voltages and currents will be displayed in phasor format (magnitude, angle). V1 will be referred as reference. The angle of V1 is always 0. The phase angles of V2, V3, I1, I2, and I3 will be displayed with respect to V1. - Page 34 NOTE: The phasor is drawn only when the reading is more than 200 counts. And if the reading of V is zero, then phasor of current will not be drawn. Press this button to change the display from VUR to IUR dA%: Historical maximum % value of (Max (I1, I2, I3) –...
-
Page 35: Iii.12 Phase Sequence Of A 3 Phase System
III.12 Phase Sequence of a 3 Phase System Press this button to display phasor diagram. In this mode, the analyzer also detects the correctness of the phase sequence. If the voltage of L1, L2, and L3 is not connected in right sequence, the analyzer will show L1-3-2 in the right top corner, and beep to warn the users of incorrect phase sequence. -
Page 36: Iii.13 Balanced And Unbalanced 3 Phase (3P3W, 3P4W) Power Source System
III.13 Balanced and Unbalanced 3 Phase (3P3W, 3P4W) Power Source System In order to check if a system is balanced, press this button to display the phasor diagram with the VUR displayed. Balanced System If a 3 phase power source system is balanced, the parameters should be as following: V1 = V2 = V3 V12 = V23 = V31... -
Page 37: Iii.14 Balanced And Unbalanced 3 Phase (3P3W Or 3P4W) Load System
III.14 Balanced and Unbalanced 3 Phase (3P3W or 3P4W) Load System In order to check if current of a system is balanced, press the button twice to display the phasor diagram with the IUR displayed. Balanced System If a 3 phase load system is balanced, the parameters should be as following: I1 = I2 = I3 The phase angle of phasors I2 and I1 (I2 ±... -
Page 38: Iii.15 Transient Capture Setup (Dips, Swells, Outage)
III.15 Transient Capture Setup (Dips, Swells, Outage) 1. Press button to enter the mode of PHASOR DIAGRAM. 2. Press the SETUP button to let TRANS REF is displayed in reverse video. 3. Press the ▲ or ▼ buttons to increment or decrement nominal voltage as reference. - Page 39 5. Press the ▲ or ▼ button to increment or decrement threshold in % (SDVP). To exit, press the EXIT button. 6. Press the TRANSIENT button to start operation of “Transient Capture”. 7. The backlight will be turned off when the TRANSIENT button is pressed. 8.
- Page 40 Code Table: SWELL OUTAGE COMMENT CODE Codes can be added together DISPLAY FORMAT: First column: sequential number of events. Second column: elapsed time since the time of start. The elapsed time format is (DAYS, HOURS, MINUTES). The maximum time is 99 day 24 hours 60 minutes. The third column: number of cycles.
-
Page 41: Iii.16 Download Transient Data
III.16 Download Transient Data When users press the TRANSIENT button to display CAPTURED EVENTS, the data is also output through RS-232 at the same time. The data output is in the same format as in LCD in ASCII format YEAR MONTH DAY HOUR MINUTE SECOND CT REF CODE 01 ELAPSED_TIME CYCLES CODE 02 ELAPSED_TIME CYCLES CODE 03 ELAPSED_TIME CYCLES CODE... -
Page 42: Iii.17 Data Logging Of Power Data (3P4W, 3P3W, 1P2W, 1P3W)
III.17 Data Logging of Power Data (3P4W, 3P3W, 1P2W, 1P3W) 1. Set the sampling time of data logging. 2. Press the POWER button to enter mode of power measurement. 3. Press the 1Φ3Φ button to select appropriate system (3P4W, 3P3W, 1P3W, or 1P2W). -
Page 43: Iii.18 Download Power Data
III.18 Download Power Data 1. Press the SETUP button. 2. The “Down Load File” will be shown in reverse video. 3. Press the ▲ or ▼ button to select file number. 4. If the data stored in a selected file is power data, a leading symbol “P” will be shown in front of the file number 5. -
Page 44: Iii.19 Data Logging Of Harmonics
III.19 Data Logging of Harmonics 1. Set the sampling time of data logging/ 2. Press MAG. button to enter mode of harmonics measurement. 3. Press the VI button to select desired input (V1, I1, V2, I2, V3, or I3). 4. Press the REC button to start data logging. A REC symbol will be displayed at the bottom line in LCD. -
Page 45: Iii.20 Download Harmonics Data
III.20 Download Harmonics Data 1. Press the SETUP button. 2. The “Down Load File” will be shown in reverse video. 3. Press the ▲ or ▼ button to select file number. 4. If the data stored in a selected file is harmonics data, a leading symbol “H” will be shown in front of the file number. -
Page 46: Hardcopy Of Screen
IV. HARDCOPY OF SCREEN 1. Press the HOLD/READ button. 2. Press the REC button. It takes few seconds to hardcopy the screen, and store the screen in an internal file. The LCD will show REC in reverse video when in operation. -
Page 47: Read The Saved Screen
V. READ THE SAVED SCREEN 1. Press the SETUP button. The DOWN LOAD FILE is displayed in reverse video. If the data in the selected file is hardcopy of screen, a leading symbol of H is displayed in reverse video. 2. -
Page 48: Set The Ct And Vt Ratio
VI. SET THE CT AND VT RATIO Press the SETUP button several times until CT or VT is shown in reverse video. Press the ▲ or ▼ button to increment or decrement the value by 1. Holding the ▲ or ▼ button will speed up the process of incrementing or decrementing. To exit, press the EXIT button. -
Page 49: Set The Time Interval For Maximum Demand
VII. SET THE TIME INTERVAL FOR MAXIMUM DEMAND Press the SETUP button several times until MD TIME is displayed in reverse video. Press the ▲ or ▼ buttons to increment or decrement the value by 1. Holding the ▲ or ▼ buttons will speed up the process of incrementing or decrementing. To exit, press the EXIT button. -
Page 50: Set The Sampling Time For Data Logging
VIII. SET THE SAMPLING TIME FOR DATA LOGGING Press the SETUP button several times until SEC is displayed in reverse video. Press the ▲ or ▼ buttons to increment or decrement the value (users can set up the sampling time from 2 sec. to 3000 sec., step by 2, e.g. 2 sec., 4 sec., 6 Holding the ▲... -
Page 51: Set The Calender Clock
IX. SET THE CALENDER CLOCK 1. Press the SETUP button to select (Year, Month, Date, Hour, Minute). 2. Press the ▲ or ▼ buttons to increment or decrement the number. NOTE: Second can not be adjusted. -
Page 52: Protocol Of Rs-232C Interface
X. PROTOCOL OF RS-232C INTERFACE RS-232C Interface: Baud Rate 9600 Data bits 8 Stop bit 1 No Parity... -
Page 53: Specifications (23℃± 5℃)
(50 or 60 Hz, PF 0.5 to 1, CT = 1, Voltage > AC 20V, Current > AC 40mA for 1A range, Current > AC 0.4A for 10A range, Current > AC 4A for 100A range, and continuous waveform) PCE-830 + PCE-6801 (100A) Range (0 to 100A) Resolution Accuracy of Readings 5.0 –... - Page 54 AC Active Energy (mWH, WH, or KWH, from 0 mWH to 999,999 KWH) WH = W * Time (in hours) AC Current (50 or 60 Hz, Auto Range, True RMS, Crest Factor < 4, CT=1) PCE-830+PCE-6801 (Overload Protection AC 200A) Range Resolution Accuracy of Readings 0.04 –...
- Page 55 4, 5, 6 For CT ≠ 1, the accuracy in percentage is the same (±0.5%). But the additional digits should be multiplied by the CT ratio. For example, ±0.5A becomes ±0.5A * CT ratio AC Voltage (50 or 60 Hz, Auto Range, True RMS, Crest Factor < 4, Input Impedance 10 MΩ, VT (PT) = 1, Overload Protection AC 800V) Range Resolution...
- Page 56 Range Resolution Accuracy 1 – 20 ±2% 0.1 % 21 – 49 ±4% of reading ± 2.0% 50 – 99 ±6% of reading ± 2.0% PCE-830 + PCE-3007 Range Resolution Accuracy 1 – 20 0.1% ±2% – 50 0.1% ±6% –...
- Page 57 ± 0.04 ±0.1 Phase Angle (Φ) PCE-830+PCE-6801 or PCE-830+PCE-6802 Range Resolution Accuracy -180° to 180° 0.1° ± 1° PCE-830+3PCE-3007 (Φ, V > 20V, A > 30A) Range Resolution Accuracy -180° to 180° 0.1° ± 2° 0° to 360° 0.1° ± 2°...
- Page 58 Range Resolution Accuracy of Readings 1.00 – 99.99 0.01 ± 5% ± 30 digits Frequency in AUTO mode PCE-830+PCE-6801 or PCE-830+PCE-6802 Range Resolution Accuracy 45 – 65 Hz 0.1Hz ± 0.1Hz Frequency of ACV (RMS value > 10V) or ACA (RMS value > 30A)
- Page 59 6802> 20A; 830+ 3007> 30A. Calculation is done over 1 to Harmonics. If the voltage or current is 0 at 50 or 60 Hz, all the percentage (%) display is 0). PCE-830 + PCE-6801 Range Resolution Accuracy 0.0 – 20.0 % ±...
- Page 60 GENERAL SPECIFICATIONS PCE-830 Analyzer Indoors Use Battery Type: 1.5V SUM-3 x 8 Use only power supply adapter Model PHAPSA External DC Input: Display: Dot Matrix LCD (240x128) with backlight LCD Update Rate: 1 time / second Power Consumption: 140mA (approx.) No.
- Page 61 PCE-6801 Current Probe (100A) Conductor Size: 30mm (approx.) Range Selection: Manual (1A, 10A, 100A) Cable Length: 3000mm Battery: powered by power analyzer Dimension: 210mm (L) x 62mm (W) x 36mm (H) 8.3" (L) x 2.5" (W) x 1.4" (H) Weight: 200g PCE-6802 Current Probe (1000A) Conductor Size:...
-
Page 62: Battery Replacement
XII. BATTERY REPLACEMENT When the low battery symbol is displayed on the LCD, replace the old batteries with eight new batteries. - Page 63 Turn the power off and remove all the test leads and current probes from the unit. 1. Remove the screw of the battery cover. 2. Lift and remove the battery cover. 3. Remove the old batteries. 4. Insert eight new 1.5V SUM-3 batteries. 5.
-
Page 64: Maintenance & Cleaning
XIII. MAINTENANCE & CLEANING Servicing not covered in this manual should only be performed by qualified personnel. Repairs should only be performed by qualified personnel. Periodically wipe the case with a damp cloth and detergent; do not use abrasives or solvents. For flexible probes (PCE-3007): Always inspect the flexible current probe for any damage. -
Page 65: Nomenclature
XIV. NOMENCLATURE V12, V23, V31: Line Voltage V1, V2, V3: Phase Voltage I1, I2, I3: Line Current P1, P2, P3: True Power (W) of Each Phase S1, S2, S3: Apparent (VA) Power of Each Phase Q1, Q2, Q3: Reactive Power (VAR) of Each Phase PΣ: Total System Power (W) SΣ: Total System Apparent Power (VA) QΣ: Total System Reactive Power (VAR)
Need help?
Do you have a question about the PCE-830 and is the answer not in the manual?
Questions and answers