Furuno COLOR VIDEO PLOTTER 1833C Operator's Manual
Color video plotter
Hide thumbs
Also See for COLOR VIDEO PLOTTER 1833C:
- Operator's manual (260 pages) ,
- Installation manual (100 pages) ,
- Quick start manual (7 pages)

Related Manuals for Furuno COLOR VIDEO PLOTTER 1833C


Summary of Contents for Furuno COLOR VIDEO PLOTTER 1833C
- Page 1 MODEL 1833C MARINE RADAR MODEL 1933C MARINE RADAR MODEL 1943C MARINE RADAR COLOR VIDEO PLOTTER GD-1900C...
- Page 2 9 - 5 2 , A s h i h a r a - c h o , N i s h i n o m i y a , J a p a n T e l e p h o n e : 0 7 9 8 - 6 5 - 2 1 1 1 T e l e f a x : 0 7 9 8 - 6 5 - 4 2 0 0...
-
Page 3: Safety Instructions
This is possible - Ask your FURUNO representative or dealer to provide this feature. Distance to MODEL 100 W/m... -
Page 4: Table Of Contents
TABLE OF CONTENTS FOREWORD... viii SYSTEM CONFIGURATIONS ... x 1. OPERATIONAL OVERVIEW ... 1-1 1.1 Operating Controls... 1-2 1.1.1 Display unit controls ... 1-2 1.1.2 Remote controller... 1-4 1.2 Inserting a Chart Card... 1-5 1.3 Turning the Unit On/Off... 1-6 1.4 Display Brilliance, Panel Brilliance, Hue... - Page 5 2.10 Measuring the Range... 2-11 2.10.1 Measuring range by range rings ... 2-11 2.10.2 Measuring range by cursor ...2-12 2.10.3 Measuring range by VRM ...2-13 2.10.4 Erasing a VRM, VRM indication...2-14 2.10.5 Erasing EBL/VRM data boxes ...2-14 2.10.6 Hiding EBL/VRM data boxes ...2-14 2.10.7 Moving EBL/VRM data boxes ...2-14 2.11 Measuring the Bearing...2-14 2.11.1 Measuring bearing by cursor ...2-14...
- Page 6 3.4 Chart Scale ... 3-9 3.5 Chart Cards... 3-10 3.5.1 Chart card overview ... 3-10 3.5.2 Indices and chart enlargement ... 3-11 3.5.3 FURUNO and NavCharts 3.5.4 C-MAP charts... 3-14 3.6 Working with Track...3-18 3.6.1 Displaying track... 3-18 3.6.2 Stopping, restarting plotting of own ship track... 3-19 3.6.3 Changing track color ...
- Page 7 3.8.3 Erasing waypoints...3-33 3.8.4 Changing waypoint mark size (FURUNO, NavCharts™)...3-34 3.8.5 Searching waypoints...3-35 3.9 Routes...3-36 3.9.1 Creating routes ...3-36 3.9.2 Connecting routes ...3-40 3.9.3 Inserting waypoints ...3-41 3.9.4 Removing waypoints from a route...3-43 3.9.5 Erasing routes ...3-43 3.10 Navigation ...3-44 3.10.1 Navigating to a “quick point”...
- Page 8 5.3.1 Navigation options... 5-9 5.3.2 Function key setup ... 5-10 5.4 Chart Setup ... 5-12 5.4.1 Chart offset... 5-12 5.4.2 FURUNO, NavCharts 5.4.3 C-MAP chart attributes ... 5-15 5.5 Data Boxes Setup ... 5-18 5.6 Hot Page Setup... 5-19 5.7 Navigator Setup ... 5-21 5.7.1 Navigation data source...
- Page 9 6. DATA TRANSFER ... 6-1 6.1 Memory Card Operations... 6-1 6.1.1 Formatting memory cards ...6-1 6.1.2 Saving data to a memory card ...6-2 6.1.3 Playing back data from a memory card...6-4 6.2 Uploading, Downloading Data ... 6-5 6.2.1 Setting communication software on the PC...6-5 6.2.2 Uploading or downloading data...6-5 6.3 Loading Waypoint Data from Yeoman ...
-
Page 10: Foreword
Marine Radar, GD-1900C Color Video Plotter. We are confident you will discover why the FURUNO name has become synonymous with quality and reliability. For over 50 years FURUNO Electric Company has enjoyed an enviable reputation for quality and reliability throughout the world. This dedication to excellence is furthered by our extensive global network of agents and dealers. - Page 11 Bright 10.4” screen visible even under direct sunlight. User friendly operation with combination of discrete keys, soft keys, alphanumeric keys and trackball. Accepts FURUNO and Nav-charts™ (NAVIONICS) charts, or C-MAP charts, depending on specification. Fast chart redraw. Built-in NavNet interface circuit board.
-
Page 12: System Configurations
SYSTEM CONFIGURATIONS All NavNet products incorporate a “network circuit board” to integrate each NavNet product on board through an optional LAN cable (Ethernet 10BASE-T). Each NavNet product is assigned an IP address to enable transfer of images between other NavNet products. For example, video plotter pictures can be transferred to a radar and vice versa. - Page 13 Single-unit NavNet system (GD-1900C) Remote Controller RMC-100 Display unit RDP-138/139 Other NavNet Unit (Model 1833C, etc.) : Standard : Option Single-unit NavNet system (GD-1900C) GPS receiver GP-310B Network Sounder ETR-6/10N 12 - 24 VDC External buzzer Echo sounder VGA monitor Remote display Video equipment Echosounder...
- Page 14 Two-unit NavNet system Radar Antenna Unit GPS Receiver GP-310B Radar, plotter data Three-or-more-unit NavNet system (Max. 4 NavNet capable display units) Radar Antenna Unit GPS Receiver GP-310B Radar data Radar Antenna Unit GPS Receiver GP-310B RADAR PLOTTER Radar, plotter data Two-unit NavNet system Radar Antenna Unit GPS Receiver GP-310B...
-
Page 15: Operational Overview
OPERATIONAL OVERVIEW This chapter provides the basic information needed to get you started using your radar, video plotter. The following topics are presented: Control overview Chart card insertion Power on/off Brilliance and hue adjustments Display selection MOB (Man OverBoard) mark entry Data boxes Function keys Simulation display... -
Page 16: Operating Controls
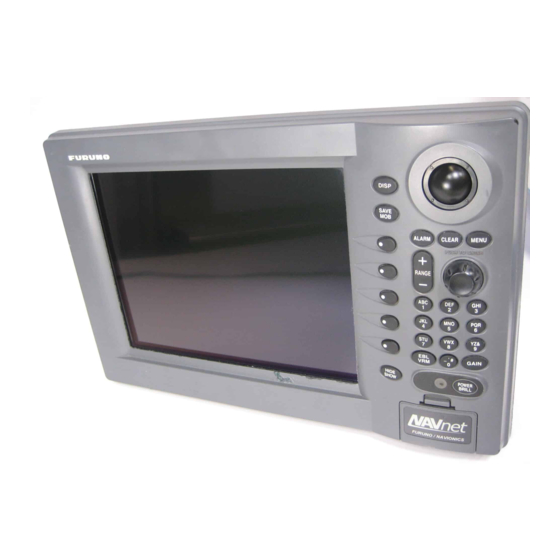
1. OPERATIONAL OVERVIEW Operating Controls 1.1.1 Display unit controls Overview of display unit controls The radar, video plotter, sounder and chart systems are operated with the controls of the display unit (and the remote controller). Ten keys are labeled and they provide the function shown on their labels. - Page 17 Soft keys The function of the five soft keys changes according to the operation. Their labels for their current functions are shown on the screen to the left of the keys. To hide or show the soft keys, press the [HIDE/SHOW] key. Each press of the key shows preset soft keys, user function keys or turns off navigation information (at the top of the screen).
-
Page 18: Remote Controller
1. OPERATIONAL OVERVIEW 1.1.2 Remote controller RANGE EBL/VRM ’# MARK CLEAR BRILL TONE Function RANGE Same as RANGE key on display unit. DISP Same as DISP key on display unit. SAVE MOB Same as SAVE/MOB key on display unit. Ten keys Enter alphanumerics. -
Page 19: Inserting A Chart Card
Inserting a Chart Card Your unit reads FURUNO and Nav-Charts ™ (NAVIONICS) chart cards, or C-MAP chart cards, depending on the type of display unit you have. Insert the appropriate chart card for your area as follows: 1. Open the chart drive. -
Page 20: Turning The Unit On/Off
Host Name RADAR PLOTTER STATION NAME: RADAR# FURUNO ELECTRIC CO., LTD. CHARTS AVAILABLE LICENSE NO. For start up with the radar display, the magnetron takes from one minute to two minutes and thirty seconds (depending or radar model) to warm up before the radar can be operated. -
Page 21: Display Brilliance, Panel Brilliance, Hue
Display Brilliance, Panel Brilliance, Hue You can adjust display brilliance, panel brilliance and hue as shown below. 1.4.1 Display brilliance, panel brilliance 1. Press the [POWER/BRILL] key momentarily. A set of soft keys for adjustment of brilliance and hue appear. Active soft key is highlighted. -
Page 22: Hue
1. OPERATIONAL OVERVIEW 1.4.2 You may select the colors for the radar, plotter and overlay displays as below. 1. Press the [POWER/BRILL] key momentarily. 2. Press the HUE soft key to show the hue setting window. 3. Operate the trackball to select hue desired, referring to the table below. MANUAL SET follows the color settings on the CHART DETAILS menu for the plotter and the RADAR DISPLAY SETUP menu for the radar. -
Page 23: Selecting A Display
Selecting a Display 1.5.1 Display modes If you have a radar, navigator, network sounder and external video source (video recorder, etc., optional PIP board required) six full-screen displays are available: radar, plotter, echo sounder, nav data, overlay, and external video. In addition to the full-screen display, you can divide the screen into halves and thirds to show two and three sets of images on a combination display. - Page 24 1. OPERATIONAL OVERVIEW 1.5.2 Selecting a display 1. Press the [DISP] key to show the display selection window. The icons of modes not available are marked with an “X.” HOTPAGE 1-HOTPAGE 6 are user-arrangeable displays called “hot pages,” which you can configure as you like.
-
Page 25: Switching Control In Combination And Overlay Screens
1.5.3 Switching control in combination and overlay screens A soft key is provided in relevant combination and overlay screens to switch control between displays. In the example below, the PLOTTR CNTRL and SNDR CNTRL soft keys enable switching control between the plotter and sounder screens in the plotter/sounder combination display. -
Page 26: Selecting Image Source
1. OPERATIONAL OVERVIEW 1.5.4 Selecting image source When more than one network radar or network sounder is connected to the equipment, you may select an image source for each as shown below. This is not necessary when only one network radar or network sounder is connected. 1. -
Page 27: Trackball, Cursor
Trackball, Cursor The trackball functions to shift the cursor, for measurement of range and bearing to a location (radar) and latitude and longitude position (plotter). Roll the trackball to shift the cursor. The cursor moves in the direction of trackball rotation. -
Page 28: Entering The Mob Mark, Setting Mob As Destination
1. OPERATIONAL OVERVIEW Entering the MOB Mark, Setting MOB as Destination The MOB (Man Overboard) mark functions to mark man overboard position. You can inscribe this mark from any mode, except while playing back data or conducting any test. Note that this function requires position data. 1. -
Page 29: Data Boxes
Data Boxes Data boxes, providing navigation data, may be shown on any full-screen display. Up to six data boxes (two in case of large characters) may be shown, and the default data boxes are position (in latitude and longitude), course over ground, speed over ground and trip log. -
Page 30: Rearranging Data Boxes
1. OPERATIONAL OVERVIEW 1.8.2 Rearranging data boxes You may select the location for data boxes as follows: 1. Using the trackball, place the cursor inside the data box you wish to move. As the cursor enters the box it changes to a hand. Push the [ENTER] knob, and the hand changes to a fist, meaning the box is correctly selected. -
Page 31: Function Keys
Function Keys The function keys provide for one-touch execution of a desired function. The default function key settings are as shown in the table below. Function Heading line on/off, HL Rings on/off, RNG Echo trail, TRL Offcenter, SFT Radar source, RSR 1.9.1 Executing a function 1. -
Page 32: Simulation Display
1. OPERATIONAL OVERVIEW 2. Press function key desired. Note: Function keys can be individually programmed for the plotter, radar and sounder displays. For further details see the following: Radar: paragraph 5.2.3 Plotter: paragraph 5.3.2 Sounder: paragraph 5.9.4 1.10 Simulation Display The simulation display, for use by service technicians for demonstration purposes, provides simulated operation to help acquaint you with the many features your unit has to offer. - Page 33 Radar NavNet display unit-generated echoes 1. Select RADAR, then press the EDIT soft key. 2. Select SIMULATION 1, then push the [ENTER] knob. 3. Press the [MENU] key to close the menu. NavNet radar antenna-generated echoes (not available with the GD-1900C) 1.
- Page 34 1. OPERATIONAL OVERVIEW 11. Enter longitude (setting range, 180 E-180 W, default setting, 125 00.000’W), then push the [ENTER] knob. 12. Select START DATE & TIME, then press the EDIT soft key. 13. Enter start date and time, then push the [ENTER] knob. 14.
-
Page 35: Radar Operation
RADAR OPERATION This chapter covers radar operation, including the ARP (Auto Plotter) function. ARP requires a Model 1800/1900 series network radar equipped with the ARP circuit board. Radar Display North marker (Head-up, Course-up mode) Range/ Pulselength range ring interval Presentation H-UP mode Alarm icon... -
Page 36: Transmitting, Stand-By
2. RADAR OPERATION Transmitting, Stand-by 1. Confirm that the network radar is plugged in. 2. Press the [DISP] key to select a radar display. 3. Press the [POWER/BRILL] key momentarily. 4. Press the RADAR STBY soft key to highlight TX on its label. 5. - Page 37 1. Press the [GAIN] key to show the “gain adjustment” soft keys, and the last-used adjustment window appears. The example below shows the gain sensitivity adjustment window. The gain soft keys shown depend on radar source as shown below. 319. 9 H-UP GAIN SENSITIVITY ¤...
-
Page 38: Reducing Sea Clutter
2. RADAR OPERATION Reducing Sea Clutter 2.5.1 How the A/C SEA works Echoes from waves can be troublesome, covering the central part of the display with random signals known as “sea clutter”. The higher the waves and the higher the antenna above the water, the further the clutter will extend. Sea clutter may affect radar performance because real targets are sometimes hidden by the echoes of small waves. -
Page 39: Reducing Precipitation Clutter
5. When the radar source is the Model 1800/1900 series, A/C SEA and A/C RAIN can be automatically adjusted. Press the A/C AT ON/OFF soft key to select ON or OFF as appropriate. When turned on, it overrides A/C SEA and A/C RAIN settings. -
Page 40: Range Scale
2. RADAR OPERATION Range Scale The range setting determines the size of the area (in nautical miles) that will appear on your display. In addition, the range setting will also automatically adjust the range ring interval so that accurate range measurements may be made while operating on any range setting. -
Page 41: Pulselength
Pulselength The pulselength in use is displayed at the upper left corner of the display. Appropriate pulselengths are preset to individual range scales. Therefore, you are not usually required to select them. If you are not satisfied with the current pulselength setting, however, it is possible to change it for the ranges shown below. -
Page 42: Presentation Mode
2. RADAR OPERATION Presentation Mode This unit provides four radar presentation modes: head-up, course-up, north-up and true motion. Heading data is required for modes other than head-up. 2.9.1 Selecting a presentation mode 1. If not displayed, press the [HIDE/SHOW] key to show the radar soft keys. 2. -
Page 43: Description Of Presentation Modes
2. RADAR OPERATION 2.9.2 Description of presentation modes Head-up (HU) A display without azimuth stabilization in which the line connecting the center with the top of the display indicates own ship’s heading. Targets are painted at their measured distances and in their directions relative to own ship’s heading. The short line on the bearing scale is the north marker. - Page 44 2. RADAR OPERATION North-up (NU) In the north-up mode, targets are painted at their measured distances and in their true (compass) directions from own ship. North is maintained at the top of the screen. The heading line changes its direction according to ship’s heading. True motion (TM) Fixed radar targets maintain a constant position on the screen, while your own ship moves across the radar image at the correct speed and heading.
-
Page 45: Measuring The Range
2.10 Measuring the Range You can measure the range to a radar target three ways: by the range rings, by the cursor, and by the VRM (Variable Range Marker). 2.10.1 Measuring range by range rings Count the number of rings between the center of the display and the target. Check the range ring interval and judge the distance of the echo from the inner edge of the nearest ring. -
Page 46: Measuring Range By Cursor
2. RADAR OPERATION 2.10.2 Measuring range by cursor Operate the trackball to place the cursor intersection on the inside edge of the radar target. The range to the target, as well as the bearing, appears to the right of “+” at the bottom of the display. H-UP How to measure range to a target with the cursor 2-12... -
Page 47: Measuring Range By Vrm
2.10.3 Measuring range by VRM 1. Press the [EBL/VRM] key to display the EBL/VRM soft keys. 2. Press the VRM1 ON (dotted ring VRM) or VRM2 ON (dashed ring VRM) soft key to select the desired VRM. The selected VRM’s indication, at the bottom of the screen, is highlighted. -
Page 48: Erasing A Vrm, Vrm Indication
2. RADAR OPERATION 2.10.4 Erasing a VRM, VRM indication Press appropriate VRM soft key, then press the [CLEAR] key. The VRM is erased and its indication becomes blank. 2.10.5 Erasing EBL/VRM data boxes Press the EBL or VRM soft key associated with the EBL/VRM data box you wish to erase. -
Page 49: Erasing An Ebl, Ebl Indication
EBL1 (Dotted line) EBL2 (Dashed line) EBL2 bearing EBL1 bearing 4. You may hide the EBL/VRM soft keys by pressing the [EBL/VRM] key. Note: The bearing to a target may be shown relative to own ship’s heading (Relative) or True bearing (requires heading data). This may be done with “EBL REFERENCE,”... -
Page 50: Erasing The Heading Line, North Marker
2. RADAR OPERATION 2.12 Erasing the Heading Line, North Marker The heading line indicates the ship's heading in all presentation modes. It is a line from the own ship position to the outer edge of the radar display area and appears at zero degrees on the bearing scale in head-up mode;... -
Page 51: Rejecting Radar Interference
2.14 Rejecting Radar Interference Radar interference may occur when near another shipborne radar that is operating in the same frequency band as your radar. Its on-screen appearance looks like many bright dots either scattered at random or in the form of dotted lines extending from the center to the edge of the display. -
Page 52: Zoom
2. RADAR OPERATION 2.15 Zoom The zoom feature allows you to double the size of the area selected with the “zoom circle.” It is available on any range but is inoperative in true motion and when the display is shifted. 2.15.1 Zooming in on radar targets 1. -
Page 53: Shifting The Picture
4. Press the ARP TGT ZM soft key. 5. Use the [ENTER] knob to select number (1-10), then push the [ENTER] knob. If the target number does not exist several beeps sound and the zoom function is cancelled. To cancel, press the CURSOR LOCK soft key. Note: The zoom window blends in with the background when the background color for the radar picture is white. -
Page 54: Automatic Shift
2. RADAR OPERATION 2.16.2 Automatic shift The amount of automatic shift is calculated according to ship’s speed, and the amount of shift is limited to 50% of the range in use. For example, if you set the shift speed setting for 15 knots and the ship is running at 10 knots the amount of shift will be about 34%. -
Page 55: Using The Offset Ebl
2.17 Using the Offset EBL The offset EBL can be used to predict a potential collision course. It can also be used to measure the range and bearing between two targets. 2.17.1 Predicting collision course The procedure below may be used to check if a radar target is on a potential collision course with your vessel. -
Page 56: Measuring Range & Bearing Between Two Targets
2. RADAR OPERATION 2.17.2 Measuring range & bearing between two targets The procedure which follows shows how to measure the range and bearing between two targets, using the targets “A” and “B” in the figure below as an example. 1. Operate the trackball to place the cursor on the target “A.” 2. -
Page 57: Echo Trails
2.18 Echo Trails Echo trails are simulated afterglow of target echoes that represent their movements relative or true to own ship. This function is useful for alerting you past possible collision situations. 2.18.1 Trail time 1. If not displayed, press the [HIDE/SHOW] key to show the radar soft keys. 2. -
Page 58: Starting Echo Trails
2. RADAR OPERATION 2.18.2 Starting echo trails 1. If not displayed, press the [HIDE/SHOW] key to show the radar soft keys. 2. Press the TARGET soft key. 3. Press the TRAIL soft key. 4. Press the TRAIL ON/OFF soft key to select ON. 5. -
Page 59: Trail Color
2.18.4 Trail color Trails may be shown target trails in blue, yellow, green or white. 1. If not displayed, press the [HIDE/SHOW] key to show the radar soft keys. 2. Press the TARGET, TRAIL and TRAIL COLOR soft keys in that order. 3. -
Page 60: Echo Stretch
2. RADAR OPERATION 2.19 Echo Stretch Normally, the reflected echoes from long range targets appear on the display as weaker and smaller blips even though they are compensated by the radar’s internal circuitry. The echo stretch function magnifies these small blips in all ranges. -
Page 61: Echo Averaging
2.20 Echo Averaging The echo average feature, which requires a Model 1800/1900 series network radar, effectively suppresses sea clutter. Echoes received from stable targets such as ships appear on the screen at almost the same position during every rotation of the antenna. On the other hand, unstable echoes such as sea clutter appear at random positions. -
Page 62: Outputting Tll Data
2. RADAR OPERATION 2.21 Outputting TLL Data Target position data can be output to units of the network and shown on their plotter screen with the TTL mark ( heading data. 1. Operate the trackball to place the cursor on the target whose position you wish to output. -
Page 63: Guard Alarm
2.22 Guard Alarm The guard alarm allows the operator to set the desired range and bearing for a guard zone. When ships, islands, landmasses, etc. violate the guard zone, an audio alarm sounds and the offending target blinks to call the operator’s attention. -
Page 64: When The Alarm Is Violated
2. RADAR OPERATION The equipment then searches for targets inside the guard zone to determine guard alarm type. If a target is found inside the guard zone, the guard zone type becomes an “Outward guard alarm,” and any target exiting the guard zone will trigger the audio alarm. -
Page 65: Watchman
2.23 Watchman 2.23.1 How watchman works The watchman function periodically transmits radar pulses for one minute to check for targets in a guard zone. If a target is found in the zone, watchman is cancelled, the audio alarm sounds and the radar continues transmitting. If no target is found the radar goes into standby for the number of minutes specified on the RADAR DISPLAY SETUP menu. -
Page 66: Suppressing Second-Trace Echoes
2. RADAR OPERATION 2.24 Suppressing Second-trace Echoes In certain situations, echoes from very distance targets may appear as false echoes (second-trace echoes) on the screen. This occurs when the return echo is received one transmission cycle later, or after a next radar pulse has been transmitted. -
Page 67: Waypoint Marker
2.25 Waypoint Marker A waypoint marker, showing the location of the destination waypoint set on the plotter, may be inscribed on the radar display. 1. If not already shown, press the [HIDE/SHOW] key to display the radar soft keys. 2. Press the NAV FUNC soft key. 3. -
Page 68: Arp, Ttm Operation
Once a target is acquired automatically or manually it is automatically tracked within 0.1 to 32 nm. If the FURUNO heading sensor PG-1000 is used, the data sentence “RMC” is necessary. -
Page 69: Activating/Deactivating Arp, Ttm
2.26.1 Activating/deactivating ARP, TTM 1. Press the [MENU] key followed by the ARP SETUP soft key to show the ARP SETUP menu. 2. Select ARP TARGET INFO, then press the EDIT soft key to show the ARP target info window. 3. -
Page 70: Acquiring And Tracking Targets (Arp)
2. RADAR OPERATION 2.26.2 Acquiring and tracking targets (ARP) Ten targets may be acquired and tracked manually and automatically. When you attempt to acquire an 11th target, the message “ARP FULL – ALREADY TRACKING 10 TARGETS!” appears for five seconds. To acquire another target, terminate tracking of an unnecessary target as shown in the paragraph “2.26.4 Terminating tracking of ARP targets.”... -
Page 71: Displaying Target Number (Arp, Ttm)
6. Press the [MENU] key to close the menu. An acquisition area of 2.0 to 2.5 miles in range and ±45º on either side of the heading line in bearing appears. Note: Targets being tracked in automatic acquisition are continuously tracked when switching to manual acquisition. -
Page 72: Terminating Tracking Of Arp Targets
2. RADAR OPERATION 2.26.4 Terminating tracking of ARP targets When ten targets have been acquired, no more acquisition occurs unless targets are cancelled. If you need to acquire additional targets, you must first cancel one or more individual targets, or all targets, using one of the procedures below. Terminating tracking of selected targets 1. -
Page 73: Setting Vector Attributes (Arp)
2.26.5 Setting vector attributes (ARP) What is a vector? A vector is a line extending from a tracked target which shows estimated speed and course of the target. The vector tip shows an estimated position of the target after the selected vector time elapses. It can be useful to extend the vector length (time) in order to evaluate the risk of collision with any target. -
Page 74: Displaying Past Position (Arp)
2. RADAR OPERATION 2.26.6 Displaying past position (ARP) This ARP can display time-spaced dots (maximum ten dots) marking the past positions of any targets being tracked. You can evaluate a target’s actions by the spacing between dots. Below are examples of dot spacing and target movement. (a) Ship turning To turn the past position display on or off: 1. -
Page 75: Arp, Ttm Target Data
2.26.7 ARP, TTM target data You can show motion trends (range, bearing, course, speed, CPA and TCPA) for ARP or TTM targets. Note that TARGET ID NUMBER, in the ARP SETUP menu, must be turned on to display this data. 1. -
Page 76: Cpa/Tcpa Alarm (Arp)
2. RADAR OPERATION 2.26.8 CPA/TCPA alarm (ARP) When the predicted CPA of any target becomes smaller than a preset CPA alarm range or its predicted TCPA less than a preset TCPA alarm limit, an audio alarm sounds and the speaker icon appears (in red). In addition, the target plot symbol of the offending target changes to a triangle and flashes together with its vector. -
Page 77: Lost Target Alarm (Arp)
8. Select a TCPA limit from 30 sec, 1 min, 2 min, 3 min, 4 min, 5 min, 6 min and 12 min. 9. Press the ENTER soft key. 10. Press the [MENU] key to close the menu. 2.26.9 Lost target alarm (ARP) When the system detects a lost target, the target symbol becomes a diamond and tracking is discontinued after one minute. -
Page 78: Interpreting The Radar Display
2. RADAR OPERATION 2.27 Interpreting the Radar Display 2.27.1 General Minimum and maximum ranges Minimum range The minimum range is defined by the shortest distance at which, using a scale of 1.5 or 0.75 nm, a target having an echoing area of 10 m from the point representing the antenna position. - Page 79 2. RADAR OPERATION Radar resolution There are two important factors in radar resolution (discrimination): bearing resolution and range resolution. Bearing resolution Bearing resolution is the ability of the radar to display the echoes received from two targets, which are at the same range and close together, as separate targets. Bearing resolution is directly proportional to the antenna length, and inversely proportional to the radar's wavelength.
-
Page 80: False Echoes
2. RADAR OPERATION 2.27.2 False echoes Occasionally echo signals appear on the screen at positions where there is no target or disappear even if there are targets. False target situations may be recognized, however, if you understand why they are displayed. Typical false echoes are shown below. - Page 81 Virtual image A relatively large target close to your ship may show at two positions on the screen. One of them is the true echo directly reflected by the target and the other is a false echo which is caused by the mirror effect of a large object on or close to your ship as shown in the figure below.
-
Page 82: Sart (Search And Rescue Transponder)
2. RADAR OPERATION 2.27.3 SART (Search and Rescue Transponder) A Search and Rescue Transponder (SART) may be triggered by any X-Band (3 cm) radar within a range of approximately 8 nm. Each radar pulse received causes it to transmit a response which is swept repetitively across the complete radar frequency band. - Page 83 2. RADAR OPERATION General procedure for detecting SART response 1. Use the range scale of 6 or 12 nm as the spacing between the SART responses is about 0.6 nm (1125 m) to distinguish the SART. 2. Turn off the automatic clutter suppression (if applicable). 3.
-
Page 84: Racon (Radar Beacon)
Some sets have automatic/manual anti-clutter rain control facilities in which case the operator should switch to manual. Note: This SART information is excerpted from IMO SN/Circ 197 Operation of Marine Radar for SART Detection. 2.27.4 Racon (Radar Beacon) A racon is a radar transponder which emits a characteristic signal when triggered by a ship’s radar (usually only the 3 centimeter band). -
Page 85: Plotter Operation
Waypoint name Waypoint marker Note: The own ship marker blinks when the FURUNO GPS Receiver GP-310B loses the GPS signal. For the NavNet display units receiving the GPS signal, the message “No GPS fix!” appears approx. one minute after the signal is lost and is accompanied by the audio alarm. - Page 86 3. PLOTTER OPERATION Nav data window The data shown in the nav data window depends on the status of the NAV soft key and the cursor. Latitude and longitude of cursor intersection Waypoint data (waypoint selected with cursor) Own ship position soft key Destination...
-
Page 87: Compass Display
3.1.2 Compass display The compass display, shown in combination displays, provides steering information. The compass rose shows two triangles: the red triangle shows own ship’s course and the black triangle, which moves with ship’s course, shows the bearing to destination waypoint. The water temperature and depth graphs, which require appropriate sensors, show the latest 10 minutes of water temperature and depth data. - Page 88 3. PLOTTER OPERATION Reading the XTE (cross-track error) monitor The XTE monitor, located below the compass rose, shows the distance you are off course and the direction to steer to return to course. The own ship marker moves according to direction and distance off course. It is shown in black when the amount of cross-track error is within the XTE monitor range and yellow when it is over.
-
Page 89: Highway Display
3.1.3 Highway display The highway display, shown in combination displays, provides a graphic presentation of ship’s track along intended course. It is useful for monitoring ship’s progress toward a waypoint. The own ship marker shows the relation between ship and intended course. The XTE monitor shows the direction and amount your vessel is off course –... -
Page 90: Nav Data Display
3. PLOTTER OPERATION 3.1.4 Nav data display The nav data display provides comprehensive navigation data, and it is shown in a three-screen combination display. The user may select what data to display and where to display it. For details see the paragraph “5.8 Nav Data Display Setup.”... -
Page 91: Presentation Mode
Presentation Mode Three types of presentation modes are provided for the plotter display: north-up, course-up and auto course-up. To change the presentation mode, press the [HIDE/SHOW] key followed by the MODE soft key. Each press of the key changes the presentation mode and presentation mode indication (top right-hand corner of the screen) cyclically in the sequence of North-up, Course-up and Auto course-up. -
Page 92: Course-Up
3. PLOTTER OPERATION 3.2.2 Course-up The course-up mode is useful for monitoring ship’s progress towards a waypoint. The destination is at the top of the screen when a destination is set. When no destination is set, the course or heading is at the top of the screen at the moment the course-up mode is selected. -
Page 93: Shifting The Display
Shifting the Display The plotter display can be shifted as below. 1. Use the trackball to locate the cursor at a screen edge. The screen shifts in the direction opposite of cursor location. 2. To turn off the cursor, press the CENTER soft key. This also returns the own ship marker to the screen center. -
Page 94: Chart Cards
3.5.1 Chart card overview Your system reads FURUNO and NavCharts ™ (NAVIONICS) charts, or C-MAP charts, depending on the type of display unit you have. When you insert a suitable chart card in the slot and own ship is near any cartographic object, a chart appears. -
Page 95: Indices And Chart Enlargement
When this happens, select proper chart scale. Note: Indices can be turned on or off. For further details see “Chart border line” on page 5-14 for FURUNO and NAVIONICS charts and page 5-16 for C-MAP charts. Sample chart (Japan), showing indices 3. -
Page 96: Furuno And Navcharts ™ Charts
3. PLOTTER OPERATION 3.5.3 FURUNO and NavCharts Chart symbols The table below shows FURUNO and NavCharts ™ chart symbols and their meanings. Symbol Data for aids to navigation Selected FURUNO and NavCharts ™ charts can show buoy and lighthouse data. - Page 97 Port service icons (NavCharts ™ only) Selected NavCharts show services available at ports, with icons. 1. Use the trackball to place the cursor on the sailboat icon (denotes a port or harbor) desired. 2. Push the [ENTER] knob. 3. Roll the trackball horizontally to select icon desired at the top of the display. The services available appear directly below the icon selected.
-
Page 98: C-Map Charts
3. PLOTTER OPERATION 3.5.4 C-MAP charts Cursor and data display Besides its fundamental functions of providing position data, the cursor can also show information about caution area, depth area, source of data, etc. on C-MAP charts. In addition, you can display information about an icon by placing the cursor on it. - Page 99 Icon data You may place the cursor on any icon to find information about the selected icon. 1. For example, place the cursor on a lighthouse icon. Place the cursor on a lighthouse icon. 080 22. 3456'E 16.0nm 2. Push the [ENTER] knob to show data. For example, the following window appears for a lighthouse.
- Page 100 3. PLOTTER OPERATION 5. Press the RETURN soft key to finish. Tide information The C-MAP NT chart card provides for calculation of the tide heights for any date. Additionally it displays the times of sunrise and sunset. 1. Press the trackball to place the cursor on a Tide icon ( 2.
- Page 101 Horizontal Cursor Vertical Cursor 5. Press the DATE soft key to open the DATE window. (DAY. MONTH. YEAR) 6. Use the trackball to position the cursor where desired, then enter value with the alphanumeric keys. Repeat to enter complete date. 7.
-
Page 102: Working With Track
3. PLOTTER OPERATION Working with Track Your ship’s track is plotted on the screen using navigation data fed from position-fixing equipment. This section shows you what you can do with track, from turning it on or off to changing its plotting interval. In the default setting, own ship’s track is turned on and is displayed in red. -
Page 103: Stopping, Restarting Plotting Of Own Ship Track
Target track Target track, NMEA format TTM (Tracked Target Message) data sentence, may be turned on or off as desired. The default setting is ON. 1. Press the [MENU] key followed by the CHART SETUP and TRACKS & MARKS CONTROL soft keys to open the TRACK CONTROL menu. 2. -
Page 104: Changing Track Color
3. PLOTTER OPERATION 3.6.3 Changing track color Track can be displayed in red (default setting), yellow, green, light-blue, purple, blue and white. It can be useful to change track color on a regular basis to discriminate between previous day’s track, etc. Own ship’s track 1. -
Page 105: Track Plotting Method And Interval For Own Ship Track
3.6.4 Track plotting method and interval for own ship track In drawing the own ship track, first the ship’s position fed from position-fixing equipment is stored into the unit’s memory at an interval of time or distance. A shorter interval provides for better reconstruction of the track, but the storage time of the track is reduced. -
Page 106: Changing Own Ship Track/Mark Distribution Setting
3. PLOTTER OPERATION 4. Use the trackball to select digit and enter value with the alphanumeric keys. The CLEAR soft key functions to clear an entire line of data. 5. Push the [ENTER] knob or ENTER soft key. 6. Press the [MENU] key to close the menu. 3.6.5 Changing own ship track/mark distribution setting The equipment stores a total of 8000 points of track and marks. -
Page 107: Erasing Track
3.6.6 Erasing track This paragraph shows you how to erase own ship’s track and target tracks. You can erase ship’s track three ways: collectively, by color and by area. Erasing own ship track by area You can erase own ship’s track by area as below. This feature is not available when the overlay mode is in use. - Page 108 3. PLOTTER OPERATION Erasing own ship track by color You may erase own ship’s track by color as follows: 1. Press the [MENU] key followed by the CHART SETUP, TRACKS & MARKS CONTROL and ERASE T & M soft keys to show the ERASE menu. 2.
-
Page 109: Marks, Lines
Marks, Lines Marks are useful for denoting important points such as a good fishing spot. Marks can be inscribed in seven shapes and seven colors: Red, yellow, green, light-blue, purple, blue and white. 3.7.1 Entering a mark, line 1. Place the cursor where you want a mark to appear. 2. -
Page 110: Selecting Line Type
3. PLOTTER OPERATION 7. Use the trackball to select mark shape desired, then press the ENTER soft key. 8. Select MARKS SIZE, then press the EDIT soft key. 9. Use the trackball to select LARGE (default setting) or SMALL as appropriate. 10. -
Page 111: Erasing Marks, Lines
3. Use the trackball to select line style desired, then press the ENTER soft key. The line style “dot” disables line drawing. The joint between lines is determined by mark shape. For example, selecting the circle shape will join lines with a circle as below. 4. -
Page 112: Waypoints
3. PLOTTER OPERATION Waypoints In navigation terminology, a waypoint is a particular location on a voyage whether it be a starting, intermediate or destination point. A waypoint is the simplest piece of information your equipment requires to get you to a destination, in the shortest distance possible. - Page 113 6. Press the SELECT MARK soft key. 7. Press the MARK SHAPE soft key to open the mark shape selection window. Waypoint mark shape selection window 8. Operate the trackball to select shape desired. 9. Press the ENTER soft key. 10.
- Page 114 3. PLOTTER OPERATION Entering a waypoint by range and bearing This method is useful when you want to enter a waypoint using range and bearing to a target found on a radar. 1. Press the [MENU] key to open the menu. 2.
-
Page 115: Editing Waypoint Data
Entering a waypoint from the waypoint list You can manually enter waypoint position from the waypoint list as follows: 1. Press the [MENU] key to open the menu. 2. Press the WAYPOINTS/ROUTES and WAYPOINTS soft keys. 3. Press the LOCAL LIST (lists waypoints in order from nearest to furthest) or ALPHANUMERIC LIST (lists waypoints in ALPHANUMERIC order) soft key. - Page 116 3. PLOTTER OPERATION Editing a waypoint from the plotter display You may edit waypoints from the plotter display as follows: 1. Press the [MENU] key followed by the WAYPOINTS/ROUTES and WAYPOINTS soft key to open the waypoint menu. 2. Press the WAYPOINT BY CURSOR soft key. 3.
-
Page 117: Erasing Waypoints
3.8.3 Erasing waypoints Erasing a waypoint directly from the plotter display 1. Operate the trackball to place the cursor on the waypoint you want to erase. A flashing diamond mark appears over the waypoint when the waypoint is correctly selected. 2. -
Page 118: Changing Waypoint Mark Size (Furuno, Navcharts™)
3. PLOTTER OPERATION 3.8.4 Changing waypoint mark size (FURUNO, NavCharts™) You may change the size of all waypoint marks to small or large (default), or you may turn them off. 1. Press the [MENU] key to open the menu. 2. Press the CHART SETUP and CHART DETAILS soft keys. -
Page 119: Searching Waypoints
3.8.5 Searching waypoints You can search for a waypoint through the alphanumeric waypoint list as follows: 1. Press the [MENU] key. 2. Press the WAYPOINTS/ROUTES, WAYPOINTS and ALPHANUMERIC LIST soft keys to show the alphanumeric list. 3. Use the trackball and the alphanumeric keys to enter up to three alphanumeric characters in the search window. -
Page 120: Routes
3. PLOTTER OPERATION Routes Often a trip from one place to another involves several course changes, requiring a series of route points (waypoints) which you navigate to, one after another. The sequence of waypoints leading to the ultimate destination is called a route. - Page 121 4. Press the NEW ROUTE soft key to open the new route entry screen. ROUTE NAME 5. If desired you can change the route name shown and/or add a comment. A route name may consist of six characters; comment, 13 characters. 6.
- Page 122 21.1 nm WAYPOINTS LENGTH 21.1 nm WAYPOINTS PUSH ENTER KNOB TO SEARCH FOR Save route menu ROUTE NAME COMMENT USE FURUNO BACK TRACK FUNCTION TO AUTOMATICALLY CREATE ROUTE BY TIME OR DISTANCE. Save route window SAVE ROUTE SELECT ROUTE RETURN SAVE...
- Page 123 6. Choose how to record points for your route, by time, by range or manual entry, by pressing BCKTRK TIME, BCKTRK RANGE or MANUAL soft key as appropriate. For manual entry, go to step 8. For BCKTRK TIME, BCKTRK DIST one of the following displays appears. TIME INTERVAL 00h01m (When selecting BCKTRK TIME.)
-
Page 124: Connecting Routes
3. PLOTTER OPERATION 3.9.2 Connecting routes Two routes which you have created can be connected as follows to form a new route. 1. Press the [MENU] key to open the menu. 2. Press the WAYPOINTS/ROUTES soft key. 3. Press the ROUTES soft key. 4. -
Page 125: Inserting Waypoints
3.9.3 Inserting waypoints Waypoints can be inserted in a route as follows: Inserting a waypoint from the route list 1. Press the [MENU] key to open the menu. 2. Press the WAYPOINTS/ROUTES soft key. 3. Press the ROUTES soft key. 4. - Page 126 3. PLOTTER OPERATION 9. Use the trackball to select the waypoint you want to insert. (You can switch between the local list and alphanumeric list by using the LOCAL LIST and ALPHA LIST soft keys.) 10. Press the SELECT WPT or CHANGE WPT soft key, whichever is displayed. 11.
-
Page 127: Removing Waypoints From A Route
3.9.4 Removing waypoints from a route Removing a waypoint from the route list 1. Press the [MENU] key to open the menu. 2. Press the WAYPOINTS/ROUTES soft key. 3. Press the ROUTES soft key. 4. Select a route. 5. Press the EDIT ROUTE and LOCAL LIST soft keys. 6. -
Page 128: Navigation
3. PLOTTER OPERATION 3.10 Navigation This section shows you how to get to a desired destination by “quick points,” waypoints, port services and routes. Note: Reciprocal setting and canceling of destination is available by outputting the data sentence ZDA from the NavNet unit connected to the navigator. 3.10.1 Navigating to a “quick point”... -
Page 129: Navigating To Waypoints
Navigating to multiple quick points 1. Select “35 POINTS” following the procedure in “Selecting quick point entry method” on the previous page. 2. Press the GOTO soft key. 3. Place the cursor on an existing waypoint (SELECT WPT soft key appears) or a new location (ADD QP soft key appears). -
Page 130: Navigating To Ports, Port Services
3. PLOTTER OPERATION 3.10.3 Navigating to ports, port services (NavCharts NavCharts ™ have a port service list which shows services available at ports or harbors. (See page 3-13.) You can use the list to set your destination as follows: 1. Select “35 PTS/PORT SVC” following the procedure in “Selecting quick point entry method”... - Page 131 4. If you selected PORT at step 3, use the trackball to select a port, then press the ENTER soft key. Make a route using the soft keys, then push the [ENTER] knob. (If you want to go directly to that port, simply press the ADD QP soft key followed by the [ENTER] knob.) If you selected NEAR SRVC at step 3, select service mark desired with the trackball and then push the ENTER soft key or the [ENTER] knob.
-
Page 132: Following A Route
3. PLOTTER OPERATION 3.10.4 Following a route Selecting the route to follow 1. Press the [MENU] key to open the menu. 2. Press the WAYPOINTS/ROUTES soft key. 3. Press the ROUTES soft key to open the route list. 4. Select a route. 5. - Page 133 Restarting navigation When you steer to avoid an obstacle or the vessel drifts, you may go off your intended course, as in Line 1 in the figure below. Also, if you don’t need to return to the original course, you can go directly to the next waypoint, as in Line 2 in the figure below.
- Page 134 3. PLOTTER OPERATION Setting speed for ETA calculation Speed, which may be input manually or automatically, is required to calculate ETA (Estimated Time of Arrival) to a destination. 1. Press the [MENU] key to open the menu. 2. Press the WAYPOINTS/ROUTES soft key. 3.
-
Page 135: Canceling Route Navigation
3. PLOTTER OPERATION To select waypoint switching method do the following: 1. Press the [MENU] key. 2. Press the PLOTTER SETUP soft key. 3. Use the trackball to select WAYPOINT SWITCHING. 4. Press the EDIT soft key to show the waypoint switching window. 5. -
Page 136: Alarms
3. PLOTTER OPERATION 3.11 Alarms The plotter section has eight conditions which generate both audio and visual alarms: arrival alarm, anchor watch alarm, XTE (Cross Track Error) alarm, proximity alarm, speed alarm, trip alarm, water temperature alarm and bottom alarm. (The bottom and water temperature alarms, which require depth and water temperature data, may also be set on the sounder alarm menu. -
Page 137: Arrival Alarm
3.11.2 Arrival alarm The arrival alarm informs you that your boat is approaching a destination waypoint. The area that defines an arrival zone is that of a circle which you approach from the outside of the circle. The alarm will be released if your boat enters the circle. -
Page 138: Anchor Watch Alarm
3. PLOTTER OPERATION 3.11.3 Anchor watch alarm The anchor watch alarm informs you that your boat is moving when it should be at rest. When the anchor watch is active, a red dashed circle with an “X” at its center marks the anchor watch area. 1. -
Page 139: Xte (Cross-Track Error) Alarm
3.11.4 XTE (Cross-Track Error) alarm The XTE alarm warns you when your boat is off its intended course. When the XTE alarm is active two red dashed lines mark the XTE alarm area. Own ship position Intended course 1. Press the [ALARM] key to open the alarm menu. 2. -
Page 140: Proximity Alarm
3. PLOTTER OPERATION 4. Use the trackball to select WITHIN, UNDER/OVER, or OFF as appropriate 5. For WITHIN and UNDER/OVER use the trackball and the alphanumeric keys to enter alarm range: Operate the trackball to select digit; use the alphanumeric keys to enter value. 6. -
Page 141: Trip Alarm
3.11.7 Trip alarm The trip alarm informs you when you have traveled a certain distance. 1. Press the [ALARM] key to open the alarm menu. 2. Use the trackball to select TRIP ALARM. 3. Press the EDIT soft key to show the trip alarm window. 4. -
Page 142: Alarm Information
3. PLOTTER OPERATION 3.11.8 Alarm information When an alarm setting has been violated, the buzzer sounds and the speaker icon appears and is red. Press the [CLEAR] key to silence the alarm. You can see which alarm has been violated on the ALARM menu. In the example below the arrival alarm has been violated. - Page 143 Alarm messages The table below shows the plotter alarm messages and their meanings. Plotter alarm messages and their meanings Message ARRIVED AT WAYPOINT XXX! (XXX = waypoint name) ENTERED INTO AVOIDANCE AREA! EXCEEDED ANCHOR WATCH LIMIT! EXCEEDED XTE LIMIT! SPEED ALARM! TEMPERATURE ALARM! TRIP ALARM! MILEAGE EXCEEDED 3.
-
Page 144: Resetting Trip Distance
3. PLOTTER OPERATION 3.12 Resetting Trip Distance Trip distance is shown on the navigation data display. You can reset the trip distance to zero as follows: 1. Press the [MENU] key. 2. Press the SYSTEM CONFIGURATION and GENERAL SETUP soft keys in that order to show the GENERAL SETUP menu. -
Page 145: Video Sounder Operation
VIDEO SOUNDER OPERATION With connection of the optional Network Sounder ETR-6/10N you can show video sounder images on the display. Principle of Operation The video sounder determines the distance between its transducer and underwater objects such as fish, lake bottom or seabed and displays the results on screen. -
Page 146: Sounder Displays
4. VIDEO SOUNDER OPERATION Sounder Displays 4.2.1 Selecting a sounder display There are seven display modes from which to choose: dual frequency, single frequency, marker zoom, bottom zoom, bottom lock, bottom discrimination, and A-scope. To select a display; 1. Press the [DISP] key and then select sounder display desired. 2. -
Page 147: Description Of Sounder Displays
4.2.2 Description of sounder displays Single-frequency display Zero line Icons (alarm, battery, ° simulation) Color bar Temp. scale Water temp. graph Water temp. display Depth Note: The water temperature display requires an appropriate water temperature sensor. It can be turned on or off with TEMPERATURE GRAPH on the SOUNDER MENU. - Page 148 4. VIDEO SOUNDER OPERATION Dual-frequency display The dual-frequency display provides both 50 kHz and 200 kHz pictures. This display is useful for comparing the same picture with two different sounding frequencies. 50 kHz picture The sounder uses ultrasonic pulses to detect bottom conditions. The lower the frequency of the pulse, the wider the detection area.
- Page 149 Fish school MARKER-ZOOM DISPLAY Marker-zoom display plus normal sounder display Bottom-zoom display The bottom-zoom display expands bottom and bottom fish echoes by the zoom range selected on the SOUNDER RANGE SETUP menu (see paragraph 5.9.3), and is useful for determining bottom hardness. A bottom displayed with a short echo tail usually means it is a soft, sandy bottom.
- Page 150 4. VIDEO SOUNDER OPERATION Bottom-lock display The bottom-lock display provides a compressed normal picture on the right half of the screen and a 10 or 20 feet (3 or 6 meter) wide layer in contact with the bottom is expanded onto the left half of the screen. This mode is useful for discriminating bottom fish from the bottom echo.
- Page 151 Bottom discrimination display The bottom discrimination mode displays the bottom echo to help you determine bottom hardness. A bottom displayed with a short echo tail usually means it is a soft, sandy bottom. A long echo tail means a hard bottom. Bottom tail Long tail = Hard bottom Short tail = Soft bottom...
-
Page 152: Selecting Screen Split Method In Combination Displays
4. VIDEO SOUNDER OPERATION 4.2.3 Selecting screen split method in combination displays On combination sounder displays you can split the screen vertically or horizontally, using the SPLIT soft key as below. How to use the SPLIT soft key (example: dual frequency display) SPLIT SPLIT 200k... -
Page 153: Automatic Sounder Operation
Automatic Sounder Operation Automatic sounder operation is useful when you are preoccupied with other tasks and do not have the time to adjust the display. 4.3.1 How the automatic sounder works The automatic sounder function automatically selects the proper gain, range scale and clutter suppression level according to the depth. -
Page 154: Manual Sounder Operation
4. VIDEO SOUNDER OPERATION Manual Sounder Operation Manual operation is useful for observing fish schools and bottom using a fixed gain setting. The gain, range and range shift functions used together give you the means to select the depth you can see on the screen. The basic range can be thought of as providing a “window”... -
Page 155: Shifting The Range
Press the [GAIN] key to show the gain window, and adjust the [ENTER] knob or trackball. Current level is shown on the bar, and the setting range is 0-100(%). Press the RETURN soft key to finish. Note 1: On the dual-frequency display, the gain can be independently set for 50 kHz and 200 kHz. -
Page 156: Measuring Depth, Time
4. VIDEO SOUNDER OPERATION Measuring Depth, Time The VRM measures the depth and the cross-hair cursor, time. 1. Rotate the [ENTER] knob to shift the VRM; counterclockwise to shift it downward, clockwise to shift it upward. You may also use the trackball to shift the VRM. -
Page 157: Reducing Interference
Reducing Interference Interference from other acoustic equipment operating nearby or other electronic equipment on your boat may show itself on the display as shown below. To reduce interference, do the following: 1. Press the [MENU] key. 2. Press the SOUNDER MENU soft key. 3. -
Page 158: Reducing Low Level Noise
4. VIDEO SOUNDER OPERATION Reducing Low Level Noise Light-blue dots may appear over most of the screen. This is mainly due to sediment in the water, or noise. This noise can be suppressed by adjusting CLUTTER on the SOUNDER SETUP menu. When the automatic sounder mode is used, clutter is automatically adjusted. -
Page 159: Erasing Weak Echoes
Erasing Weak Echoes Sediments in the water or reflections from plankton may be painted on the display in green or light blue. These weak echoes may be erased as below. 1. Press the [MENU] key. 2. Press the SOUNDER MENU soft key. 3. -
Page 160: White Marker
4. VIDEO SOUNDER OPERATION White Marker The white marker functions to display a particular echo color in white. For example, you may want to display the bottom echo in white to discriminate fish echoes near the bottom. Note that the bottom must be displayed in reddish-brown (default color arrangement) for the white marker to function. -
Page 161: Picture Advance Speed
4.10 Picture Advance Speed The picture advance speed determines how quickly the vertical scan lines run across the screen. When selecting a picture advance speed, keep in mind that a fast advance speed will expand the size of the fish school horizontally on the screen and a slow advance speed will contract it. -
Page 162: Advancement Synchronized With Ship's Speed
4. VIDEO SOUNDER OPERATION 4.10.2 Advancement synchronized with ship’s speed With speed data provided by a speed-measuring device, picture advance speed may be automatically synchronized with ship’s speed. As shown in the figure below the horizontal scale of the display is not influenced with the speed-dependent picture advance mode active, thus it permits judgment of fish school size and abundance at any speed. -
Page 163: Display Colors
4.11 Display Colors You can select the number of colors and background color to display as follows: 1. Press the [MENU] key. 2. Press the SOUNDER MENU soft key. 3. Select HUE, then press the EDIT soft key to show the hue window. 4. -
Page 164: Alarms
4. VIDEO SOUNDER OPERATION 4.12 Alarms The sounder section has five conditions which generate audio and visual alarms: bottom alarm, fish alarm (bottom lock), fish alarm (normal) and water temperature alarm (temperature sensor required). You may set up the sounder alarms on the ALARM menu, which may be displayed by pressing the [ALARM] key. -
Page 165: Bottom Alarm
4.12.2 Bottom alarm The bottom alarm sounds when the bottom echo is within the alarm range set. To activate the bottom alarm, the depth must be displayed. Note that the bottom alarm is turned on or off reciprocally with the bottom alarm on the plotter alarm menu. -
Page 166: Fish Alarm (B/L)
4. VIDEO SOUNDER OPERATION 4.12.4 Fish alarm (B/L) The bottom-lock fish alarm sounds when a fish echo is within a predetermined distance from the bottom. Note that the sensitivity of the fish alarm can be set on the SOUNDER SYSTEM SETUP menu. 1. -
Page 167: Water Temperature Alarm
4.12.5 Water temperature alarm There are two types of water temperature alarms: WITHIN RANGE and OUT OF RANGE. The WITHIN RANGE alarm sounds when the water temperature is within the range set, and the OUT OF RANGE alarm sounds when the water temperature is higher or lower than the range set. -
Page 168: When An Alarm Setting Is Violated
4. VIDEO SOUNDER OPERATION 4.12.6 When an alarm setting is violated... When an alarm setting has been violated the buzzer sounds and the speaker icon appears in red. Press the [CLEAR] key to silence the alarm. At this time the color of the speaker icon changes from red to background color. -
Page 169: Water Temperature Graph
Alarm messages The table below shows the sounder alarm messages and their meanings. Message DEPTH ALARM! FISH ALARM! TEMPERATURE ALARM! 4.13 Water Temperature Graph The water temperature graph (appropriate sensor required) plots water temperature on the sounder display. (See the figure on page 4-3.) It can be turned on or off as below. -
Page 170: Interpreting The Sounder Display
4. VIDEO SOUNDER OPERATION 4.14 Interpreting the Sounder Display 4.14.1 Zero line The zero line (sometimes referred to as the transmission line) represents the transducer’s position, and moves off the screen when a deep phased range is used. 4.14.2 Bottom echo Echoes from the bottom are normally the strongest and are displayed in reddish-brown, but the color and width will vary with bottom composition, water depth, frequency, sensitivity, etc. -
Page 171: Fish School Echoes
4.14.3 Fish school echoes Fish school echoes will generally be plotted between the zero line and the bottom. Usually the fish school/fish echo is weaker than the bottom echo because its reflection property is much smaller compared to the bottom. The size of the fish school can be ascertained from the density of the display. -
Page 172: Customizing Your Unit
CUSTOMIZING YOUR UNIT This chapter describes the various options which allow you to set up your unit to suit your needs. For mode-specific menus, e.g. radar, plotter and sounder, make sure that you select the appropriate display when making changes or viewing menu options. - Page 173 5. CUSTOMIZING YOUR UNIT Item Description Key Beep Turns key beep on/off. Language Chooses menu language. Range Unit Chooses unit of range and speed measurement. Temperature Chooses unit of water temperature Unit measurement. Depth Unit Chooses unit of depth measurement. Temperature Chooses source of water temperature Source...
-
Page 174: Radar Setup
Contents of general setup menu (con’t from previous page) Item Description Bearing Chooses bearing display format for Readout course, course over ground and cursor bearing. Magnetic The magnetic variations for all areas of Variation the earth are preprogrammed into this unit. - Page 175 5. CUSTOMIZING YOUR UNIT Item Description References EBL bearing, shown in Reference the EBL data box, to North (True) or heading (Relative). Relative with no heading input. True only in course-up, north-up and true motion. Cursor Chooses how to display cursor Position position.
- Page 176 Contents of radar display setup menu (con’t from previous page) Item Description Background Chooses colors of background, Color range rings and characters. Effective when HUE soft key is set for MANUAL. Echo Color Chooses echo color. 2ND Echo Reduces second-trace echoes. See Rejection the paragraph “2.24 Suppressing Second-trace Echoes.”...
-
Page 177: Radar Range Setup
5. CUSTOMIZING YOUR UNIT 5.2.2 Radar range setup You may choose the radar ranges you wish to use, from the RADAR RANGE SETUP menu. After choosing the ranges desired, change the range with the [RANGE] key to activate range settings. Available ranges depends on the radar used. -
Page 178: Function Key Setup
5.2.3 Function key setup The function keys provide one-touch execution of a desired function. The default radar function key settings are as shown in the table below. Function Key If the above settings are not to your liking you may change them as follows: 1. - Page 179 5. CUSTOMIZING YOUR UNIT 4. Select function desired with the trackball, then press the ENTER soft key or [ENTER] knob to register your selection. 5. Press the [MENU] key to close the menu. Menu Item Assigns no function. HL: HDG LINE OFF Turns heading line off.
-
Page 180: Plotter Setup
Plotter Setup This paragraph provides the information necessary for setting up the plotter display. 5.3.1 Navigation options Navigation options, for example, waypoint switching method, may be set on the PLOTTER SETUP menu. 1. Show the plotter display, then press the [MENU] key open the main menu. 2. -
Page 181: Function Key Setup
5. CUSTOMIZING YOUR UNIT 5.3.2 Function key setup The function keys provide one-touch execution of a desired function. The default plotter function key settings are as shown in the table below. Function Start/stop recording/plotting own ship’s track. Edit mark/line. Ruler (measure range and bearing between two points). - Page 182 4. Select function desired with the trackball, then press the ENTER soft key or [ENTER] knob to register your selection. 5. Press the [MENU] key to close the menu. Menu Item Assigns no function. ADD: ADD NEW WPT Registers waypoint at cursor position. Place cursor for waypoint location, then press function key.
-
Page 183: Chart Setup
5. CUSTOMIZING YOUR UNIT Chart Setup This paragraph shows you how to setup digital charts, from offsetting chart position to turning chart attributes on or off. 5.4.1 Chart offset In some instances position may be off by a few seconds. For example, the position of the ship is shown to be at sea while it is in fact moored at a pier. -
Page 184: Furuno, Navcharts ™ Chart Attributes
5.4.2 FURUNO, NavCharts FURUNO, NavCharts ™ chart attributes may be turned on or off from the CHART DETAILS menu, which you may display as follows: 1. Press the [MENU] key. 2. Press the CHART SETUP and CHART DETAILS soft keys. - Page 185 5. CUSTOMIZING YOUR UNIT Contents of chart details menu (FURUNO, NavCharts ™ ) Item Description Lat/Lon Grid Latitude and longitude grids Text Geographic place, name Information Waypoints Waypoint size Waypoint Waypoint name Names Chart Border Border lines (indices) Lines Landmass...
-
Page 186: C-Map Chart Attributes
DEPTH < 10m DEPTH = 10m YELLOW DEPTH > 10m LIGHT BLUE DEPTH INFORMATION 10m = APPROX. 30ft OR 5fa OR 6pb Contour line menu (FURUNO, NavCharts ™) CHART PLACE NAME DETAILS COMPASS TIDE & CURRENT EDIT NATURAL FEATURE RIVER & LAKE... - Page 187 5. CUSTOMIZING YOUR UNIT Item Description Waypoint Waypoint display Waypoint Waypoint name Name Lat/Lon Grid Latitude and longitude grids Chart Border Border lines Line (indices) Background Chart background color Color Port & Port services icon display Service Attention Attention area icon display Area Nav Lane Navigation lanes...
- Page 188 Contents of chart details menu for C-MAP (con’t from previous page) Item Description DEPTH INFO Bathymetric Line soft key (See below.) Spot Sounding Bottom Type Depth Area Limit Bathymetric Range Settings description Basic: Shows basic characteristics of objects. Detailed: Shows detailed characteristics of objects. Multiple: Shows multiple icons for complex objects.
-
Page 189: Data Boxes Setup
5. CUSTOMIZING YOUR UNIT Data Boxes Setup You may select the data to show in the data boxes for the plotter, radar and sounder displays. Six boxes may be displayed in case of small size data box and two for large size data box. 1. -
Page 190: Hot
Hot Page Setup Six user-arrangeable hot pages are provided for quick selection of desired display. If the default hot pages are not to your liking you may change them as shown below. 1. Press the [MENU] key followed by pressing the SYSTEM CONFIGURATION, SYSTEM SETUP, HOT PAGE &... - Page 191 5. CUSTOMIZING YOUR UNIT 4. Rotate the [ENTER] knob to select a main screen, then press the [ENTER] knob. For example, select the radar display. Your choice is then marked with an “X” to show that is has been selected. Hot page setup menu, SPLIT X 3 screen, sub screen selection 5.
-
Page 192: Navigator Setup
LOCAL TIME OFFSET* +00:00 TEMP CALIBRATION ° DEPTH CALIBRATION 00ft Contents of nav setup menu FURUNO BB GPS: GPS Receiver GP-310B GP: GPS navigator (via NETWORK or NMEA port) LC: Loran C navigator (via NETWORK or NMEA port) ALL: Multiple navaid connection... -
Page 193: Gps Receiver Setup
5. CUSTOMIZING YOUR UNIT 5.7.2 GPS receiver setup The GPS SETUP menu sets up the GPS Receiver GPS-310B. Press the [MENU] key followed by the SYSTEM CONFIGURATION, NAV OPTION and GPS SENSOR SETTINGS soft keys to display this menu. Item Local Time GPS uses UTC time. - Page 194 Contents of GPS setup menu (con’t from previous page) Item Position When the DOP or receiving condition is Smoothing unfavorable, the GPS fix may change greatly, even if the vessel is not moving. This change can be reduced by smoothing the raw GPS fixes. A setting between 000 to 999 is available.
- Page 195 5. CUSTOMIZING YOUR UNIT Contents of GPS setup menu (con’t from previous page) Item Description Disable Every GPS satellite is broadcasting Satellite abnormal satellite number(s) in its Almanac, which contains general orbital data about all GPS satellites, including those which are malfunctioning.
-
Page 196: Td Display Setup
5.7.3 TD display setup The TD SETUP menu sets which Loran C or Decca chain to use to display TD position. (Connection of a Loran C or Decca navigator is not necessary to display TD position.) 1. Press the [MENU] key. 2. - Page 197 5. CUSTOMIZING YOUR UNIT 6. If necessary, you may enter a position offset to refine Loran C position accuracy. Select (GRI) CORRECTION 1 or CORRECTION 2, then press the EDIT soft key. Enter correction value with the trackball and alphanumeric keys.
-
Page 198: Nav Data Display Setup
Nav Data Display Setup The nav data display shows various navigation data, fed from a navigator, network equipment, etc. You may select the data to display and where to display it as follows: 1. Press the [MENU] key to open the main menu. 2. -
Page 199: Sounder Setup
5. CUSTOMIZING YOUR UNIT Sounder Setup This section shows you how to customize your network sounder to your liking. You can set fish alarm sensitivity, fine tune sensors, etc. 5.9.1 System setup 1. Show the sounder display, then press the [MENU] key. 2. - Page 200 Sounder system setup menu description (con’t from previous page) Item Description TVG (Time Varied Gain) (50 kHz, 200 compensates for propagation kHz) attenuation of the ultrasonic waves. It does this by equalizing echo presentation so that fish schools of the same size appear in the same density in both shallow and deep waters.
-
Page 201: Sensor Setup
5. CUSTOMIZING YOUR UNIT 5.9.2 Sensor setup The SENSOR SETUP menu lets you further refine speed, water temperature and depth data fed from the network sounder. 1. Show the sounder display, then press the [MENU] key. 2. Press the SOUNDER SYSTEM SETUP and SENSOR SETUP soft keys to show the SENSOR SETUP menu. -
Page 202: Sounding Range, Zoom Range, Bottom Lock Range
5.9.3 Sounding range, zoom range, bottom lock range This paragraph shows you how to set custom ranges for basic range, zoom range (marker and bottom zoom) and bottom lock range. All default basic ranges are restored whenever the unit of depth measurement is changed. Therefore, change the depth unit before changing the basic ranges. -
Page 203: Function Key Setup
5. CUSTOMIZING YOUR UNIT 5.9.4 Function key setup The function keys provide one-touch execution of a desired function. The default sounder function key settings are as shown in the table below. Function Output current position . Suppress clutter. Erase weak signal. Suppress noise. - Page 204 5. Select function desired with the trackball, then press the ENTER soft key or [ENTER] knob to register your selection. 6. Press the [MENU] key to close the menu. Menu Item Assigns no function. MOD: AUTO MODE Display automatic mode selection window. G20: GAIN 200 kHz Displays 200 kHz gain adjustment window.
-
Page 205: Data Transfer
DATA TRANSFER This chapter provides information for saving and replaying data to and from memory cards, uploading and downloading data, loading waypoint data from Yeoman, and outputting data through the network. Memory Card Operations The memory cards store these data: marks, lines, waypoints, routes, track, and setting data. -
Page 206: Saving Data To A Memory Card
6. DATA TRANSFER 6.1.2 Saving data to a memory card 1. Insert a formatted memory card into the slot. 2. Press the [MENU] key followed by the CONFIGURATION, DATA TRANSFER, UPLOAD/DOWNLOAD DATA and SAVE DATA TO MEMORY CARD soft keys to show the SAVE DATA menu. TRACKS MARKS &... - Page 207 Memory card messages Various memory card messages appear to alert you to memory card-related error. These are tabulated below. Message Memory card is not Memory card not inserted. Please insert inserted. memory card. Push ENTER knob to continue. Memory card is not Unformatted memory formatted.
-
Page 208: Playing Back Data From A Memory Card
6. DATA TRANSFER 6.1.3 Playing back data from a memory card Data (track, marks, lines, waypoints, routes and setting data) can be loaded from a memory card and displayed on the screen. This feature is useful for observing past data and setting up the equipment for a specific purpose with “setting data.” 1. -
Page 209: Uploading, Downloading Data
Uploading, Downloading Data You can upload/download waypoints, routes, marks and lines from/to a PC, through the DATA 4 port at the rear of the display unit. Note that radar and sounder data cannot be uploaded or downloaded. 6.2.1 Setting communication software on the PC The communication format (RS-232C) with the PC is as follows: Baud Rate: Character Length: 8 bits... - Page 210 6. DATA TRANSFER 7. To change the baud rate, press the SELECT BPS soft key. 8. Select baud rate, then press the ENTER soft key. 9. Press the DWLOAD or UPLOAD soft key. You are asked if you are ready to download or upload waypoints and routes.
- Page 211 Route data menu $GPRTE, x, x, a, ccc, c----c, c----c, ... , c----c <CR><LF> 1 2 3 1: Number of sentences required for one complete route data (1 to 4). See Note 2: Number of sentences currently used (1 to 4) 3: Message mode (Always set to C) 4: Route No.
-
Page 212: Loading Waypoint Data From Yeoman
6. DATA TRANSFER Loading Waypoint Data from Yeoman Waypoint data can be loaded from a Yeoman to this equipment. Connect the Yeoman to a DATA port on this equipment and then follow the procedure below. 1. Press the [MENU] key. 2. -
Page 213: Receiving Data Via Network Equipment
Receiving Data Via Network Equipment You can receive waypoints, routes, marks and lines from NavNet equipment. 1. Press the [MENU] key. 2. Press the SYSTEM CONFIGURATION soft key. 3. Press the DATA TRANSFER soft key. 4. Press the RECEIVE DATA VIA NETWORK soft key. 5. -
Page 214: Outputting Data Through The Network
6. DATA TRANSFER 10. Press the RCV soft key followed by the [ENTER] knob. The message “NOW RECEIVING DATA.” is displayed. If no data could be found, the message “(HOST NAME)’ IS NOT FOUND.” appears. 11. When the transfer is completed, the message “DATA TRANSFER COMPLETED. -
Page 215: Maintenance, Troubleshooting
MAINTENANCE, TROUBLESHOOTING This chapter provides information necessary for keeping your unit in good working order and remedying simple problems. Preventive Maintenance Regular maintenance is important for optimum performance. A maintenance program should be established and should at least include the items shown in the table below. -
Page 216: Replacement Of Fuse
7. MAINTENANCE, TROUBLESHOOTING Replacement of Fuse The fuse on the power cable protects the equipment from reverse polarity of the ship’s mains and equipment fault. If the fuse blows, find out the cause before replacing it. Use the correct fuse (15A for 12 V device, 7A for 24 V device). Using the wrong fuse will damage the equipment and void the warranty. -
Page 217: Simple Troubleshooting
Simple Troubleshooting This section provides simple troubleshooting procedures which the user can follow to restore normal operation. If you cannot restore normal operation do not attempt to check inside the unit. Any trouble should be referred to a qualified technician. 7.5.1 General If…... -
Page 218: Plotter
7. MAINTENANCE, TROUBLESHOOTING 7.5.3 Plotter Requires GPS Receiver GP-310B. If… position is not fixed within three minutes position is wrong the track is not plotted the bearing is wrong Loran C (or Decca) TDs do not appear Loran C (or Decca) TDs are wrong the ship’s speed indication is not zero... -
Page 219: Sounder
7.5.4 Sounder Requires Network Sounder ETR-6/10N. If… you selected a sounder display with the DISP key marks and characters appear the picture appears picture sensitivity is too low the depth indication is not displayed noise or interference shows on the display the water temperature graph appears 7. -
Page 220: Diagnostics
7. MAINTENANCE, TROUBLESHOOTING Diagnostics This paragraph provides the procedures for testing the equipment for proper operation. Four tests are provided: Memory I/O test, Keyboard test, Remote controller test, and Test pattern. 7.6.1 Memory I/O test The memory I/O test provides for individual testing of the display unit, GPS Receiver GP-310B, Network Sounder ETR-6/10N and ARP, displaying program number and checking for proper operation. - Page 221 Chart number shown when chart is inserted. Press the RETURN soft key to return the MEMORY I/O TEST menu. * = For FURUNO, NAVIONICS model. 19500010XX for C-MAP model. Program No. 19500020XX* ROM1, 2...
- Page 222 7. MAINTENANCE, TROUBLESHOOTING Network sounder test (Requires Network Sounder ETR-6/10N) Press the NETWORK SOUNDER TEST soft key at the MEMORY I/O TEST menu to test the Network Sounder ETR-6/10N. The equipment displays network sounder program version number, checks the ROM and RAM, and displays water temperature (appropriate sensor required) and depth.
-
Page 223: Test Pattern
7.6.2 Test pattern The test pattern test checks the display for proper display of colors. 1. Press the [MENU] key to show the menu. 2. Press the SYSTEM CONFIGURATION soft key. 3. Press the SYSTEM SETUP soft key. 4. Press the TEST & CLEAR soft key. 5. -
Page 224: Keyboard, Remote Controller Test
7. MAINTENANCE, TROUBLESHOOTING 7.6.3 Keyboard, remote controller test The keyboard test checks the controls on the display unit and remote controller for proper operation. 1. Press the [MENU] key to show the menu. 2. Press the SYSTEM CONFIGURATION soft key. 3. -
Page 225: Gps Status Display
GPS Status Display The GPS status display provides data about the GPS satellites. It is available with connection of the GPS Receiver GP-310B or a GPS navigator outputting the data sentence GSA or GSV. 1. Press the [MENU] key. 2. Press the SYSTEM CONFIGURATION, NAV OPTION and GPS SENSOR SETTINGS soft keys to display the GPS SENSOR SETTINGS menu. -
Page 226: Clearing Memories
7. MAINTENANCE, TROUBLESHOOTING Clearing Memories Your equipment has a memory for each of the plotter, radar and sounder sections. These memories can be cleared to restart operation with default settings. The following data are not cleared: Heading adjustment, timing adjustment, MBS level, tuning point, tuning indication (short, medium, long), video level, dead sector, antenna height, STC curve, antenna type, on time, tx time. -
Page 227: Error Messages
Error Messages In addition to alarm messages your equipment also displays error messages. Error Message Connection with the ETR was cut. Connection with the RADAR was cut. Low Voltage! Internal Battery No bearing pulse detected. No GPS fix! No heading pulse detected. 7. -
Page 228: Appendix
APPENDIX Menu Overview MENU key Radar MENU Key RADAR DISPLAY SETUP RADAR RANGE SETUP# # = Not used on GD-1900C. ARP SETUP (Requires ARP circuit board in network radar 1800/1900.) FUNCTION KEY SETUP* * Default settings for function keys: SOFT KEY 1, HDG LINE OFF; SOFT KEY 2, RINGS ON/OFF; SOFT KEY 3, ECHO TRAIL; SOFT KEY 4, OFFCENTER, SOFT KEY 5, RADAR SOURCE EBL REFERENCE (TRUE, RELATIVE) CURSOR POSITION (LAT/LON, TD, RNG&BRG-REL, RNG&BRG-TRUE) - Page 229 (GREAT CIRCLE, RHUMB LINE) BEARING READOUT (TRUE, MAGNETIC) MAGNETIC VARIATION (AUTO 07.0 W, MANUAL) POSITION SOURCE SOURCE (FURUNO BB GPS, GP, LC, ALL) SETTINGS SPEED AVERAGING (0-9999 seconds, 60 seconds) LOCAL TIME OFFSET (-13:30-+13:30 hr, 00:00) TEMP CALIBRATION (-40 DEPTH CALIBRATION (-15 - +90 ft, 0 ft)
- Page 230 DD MM. MMM’ SELECT SNTNC soft key* DD MM. MMM’ SELECT SNTNC soft key* 4800 RMB RMC APPENDIX 8 bits 1 bit NONE...
- Page 231 APPENDIX LIVE LIVE LIVE 0 kt 000.0 45 35.000’N 125 00.000’W 00:00 01 APR 00 4800...
- Page 232 Plotter WHITE TIME 10 seconds 0.1 nm 2000 points RESUME YELLOW ¡ LARGE GREEN LARGE YELLOW BLACK WHITE LARGE YELLOW LIGHT BLUE APPENDIX...
- Page 233 APPENDIX PLOTTER/OVERLAY PLOTTER/OVERLAY PLOTTER/OVERLAY 33 ft PLOTTER/OVERLAY PLOTTER/OVERLAY PLOTTER/OVERLAY PLOTTER/OVERLAY BLACK PLOTTER/OVERLAY PLOTTER/OVERLAY PLOTTER/OVERLAY PLOTTER/OVERLAY PLOTTER/OVERLAY PLOTTER/OVERLAY PLOTTER/OVERLAY PLOTTER/OVERLAY PLOTTER/OVERLAY PLOTTER/OVERLAY PLOTTER/OVERLAY PLOTTER/OVERLAY PLOTTER/OVERLAY PLOTTER/OVERLAY PLOTTER/OVERLAY PLOTTER/OVERLAY BASIC 0-33 ft LINE 1 POINT MULTIPLE ARRVL ALM CRCL...
- Page 234 WAYPOINTS/ WAYPOINTS ROUTES ROUTES Destination is required. CREATE VOYAGE- BASED ROUTE FUNCTION SOFT KEY 1 - SOFT KEY 5 KEY SETUP* (OFF, ADD NEW WPT, MOVE WPT, RULER, GOTO WPT, GOTO ROUTE, EDIT MK/LINE, TRACK ON/OFF, TTM ON/OFF, DEL TGT TRK, ALPHA LIST, LOCAL LIST, ROUTE LIST, D.
- Page 235 APPENDIX Sounder AUTO MEDIUM INTERNAL SM3, 0 ft 0 m/s 10 m 30 ft 10 fa 10 P/B 20 ft 3 fa 3 P/B...
-
Page 236: Radar Alarms
EXT VIDEO MENU Key CONFIGURATION ALARM key Radar Alarms ALARM key SET GUARD 1 (ERASE GUARD 1) SET GUARD 2 (ERASE GUARD 2) Plotter Alarms ALARM key AUDIO ALARM (INT & EXT BUZZ, INTERNAL BUZZ, OFF) ARRIVAL ALARM (ON, OFF, default range: 0.010 nm(km/sm)) ANCHOR WATCH ALARM (ON, OFF, default range: 0.010 nm(km/sm)) PROXIMITY ALARM (ON, OFF) XTE ALARM (ON, OFF, default range: 0.050 nm(km/sm)) -
Page 237: Geodetic Chart List
APPENDIX Geodetic Chart List 001: WGS84 002: WGS72 003: TOKYO : Mean Value (Japan, Korea, and Okinawa) 004: NORTH AMERICAN 1927 : Mean Value (CONUS) 005: EUROPEAN 1950 : Mean Value 006: AUSTRALIAN GEODETIC 1984 : Australia and Tasmania Island 007: ADINDAN : Mean Value (Ethiopia and Sudan) 008: : Ethiopia 009: : Mall... -
Page 238: World Time Chart
APPENDIX World Time Chart A-11... -
Page 239: Icons
APPENDIX Icons Icon North marker. Points to North. Correct chart and suitable scale - full chart reliability. Chart overenlarged. Chart card not inserted. Wrong chart card inserted. Chart scale too small. Plotter, radar, sounder alarm setting violated. Track is not being recorded or plotted. Chart offset applied. -
Page 240: Specifications
SPECIFICATIONS OF MARINE RADAR 1. GENERAL 1.1. Indication System 1.2. Range, Pulse length (PL) & Pulse Repetition Rate (PRR) Range (nm) Pulse length (µs) 0.125 to 1.5 0.08 1.5 to 3 3 to 64* *Maximum Range: M1833C: 36nm, M1933C: 48nm, M1943C: 64nm 1.3. - Page 241 2.3. MODEL1943C: 2.3.1. Radiator 2.3.2. Polarization 2.3.3. Antenna Rotation 2.3.4. Radiator Length 2.3.5. Horizontal Beamwidth 1.9° 2.3.6. Vertical Beamwidth 2.3.7. Sidelobe Attenuation 3. TRANSCEIVER MODULE 3.1. Frequency and Modulation 9410 MHz ±30MHz (X band), P0N 3.2. Peak Output Power 3.3. Modulator 3.4.
- Page 242 Red, yellow, green purple, light-blue, blue, white Track/mark: 8000 points, Waypoint: 999 points Simple route: 200 routes with 35 waypoints each 1 point 1 course with 35 waypoints max. FURUNO chart card or NAVIONICS chart card available SP - 3 E3503S02C...
- Page 243 5.14. Alarms 6. POWER SUPPLY 6.1. Rated Voltage/Current M1833C M1933C (24rpm) M1933C (48rpm) M1943C (24rpm) M1943C (48rpm) 6.2. Rectifier (option) RU-3423: 7. ENVIRONMENTAL CONDITION 7.1. Ambient Temperature 7.2. Relative Humidity 7.3. Waterproofing 7.4. Bearing Vibration 8. COATING COLOR 8.1. Display Unit 8.2.
- Page 244 Red, yellow, green purple, light-blue, blue, white Track/mark: 8000 points, Waypoint: 999 points Simple route: 200 routes with 35 waypoints each 1 point 1 course with 35 waypoints max. FURUNO chart card or NAVIONICS chart card available SP - 5 E3503S02C...
- Page 245 2.14. Alarms 3. POWER SUPPLY 3.1. Rated Voltage/Current 3.2. Rectifier (option) 4. ENVIRONMENTAL CONDITION 4.1. Ambient Temperature 4.2. Relative Humidity 4.3. Waterproofing 4.4. Bearing Vibration 5. COATING COLOR 5.1. Display Unit 6. COMPASS SAFE DISTANCE 6.1. Display Unit C-MAP chart card also available for C-MAP NT Model Arrival and Anchor watch, Cross track error and proximity alarms, Ship’s speed in and out alarms, Water temperature, Trip alarm, Fish alarm, Bottom alarm (ETR required)
-
Page 246: Index
CHART OFFSET soft key... 5-12 Charts C-MAP chart attributes ... 5-15 cursor and data display (C-MAP) ... 3-14 data for aids to navigation ... 3-12 FURUNO chart attributes ... 5-14 icon data (C-MAP) ... 3-15 icons ... 3-10 indices... 3-11 inserting ... 1-5 NavCharts chart attributes ... - Page 247 INDEX Colors radar display ...5-5 radar echoes ...5-5 sounder echoes ...4-19 Compass display...3-3 Controls display unit ...1-2 remote controller ...1-4 Course-up mode plotter ...3-8 radar...2-9 CPA/TCPA alarm ...2-42 Cursor display format...5-4 shifting...1-13 CURSOR soft key ...2-18 Data boxes erasing ...1-16 hiding...1-15 rearranging...1-16 setup ...5-18...
- Page 248 HIWAY CNTRL soft key ...3-5 HL OFF soft key ...2-16 Hot page setup...5-19 radar, plotter...1-8 sounder ...4-19 I. REJ. soft key...2-17 Icons... A-12 Interference rejection radar...2-17 sounder ...4-13 Keyboard test...7-10 Keying pulse ...5-29 Language ...5-2 Latitude, longitude display ...5-2 Lines entering ...3-25 erasing ...3-27 type ...3-26...
- Page 249 INDEX Port, port services icons...3-13 navigating to...3-46 Position offset (GPS Receiver GP-310B) ...5-23 Position smoothing (GPS Receiver GP-310B) ...5-23 POWER/BRILL key ... 1-6, 1-7 Presentation mode plotter ...3-7 radar...2-8 Proximity alarm ...3-56 Pulselength (radar)...2-7 Racon ...2-50 RADAR SETTING menu...5-3 RADAR TX/ST-BY soft key ...2-2 Range measurement by cursor (radar) ...2-12 measurement by range rings (radar) ...2-11...
- Page 250 Track displaying other targets'... 3-19 displaying own ship's... 3-18 erasing all own ship's ... 3-24 erasing all targets' ... 3-24 erasing own ship's by area ... 3-23 erasing own ship's by color ... 3-24 memory distribution setting ... 3-22 plotting interval ... 3-21 plotting method ...
Need help?
Do you have a question about the COLOR VIDEO PLOTTER 1833C and is the answer not in the manual?
Questions and answers