Table of Contents
Advertisement
Quick Links
Advertisement
Table of Contents

Related Manuals for Proceq PM8500


Summary of Contents for Proceq PM8500
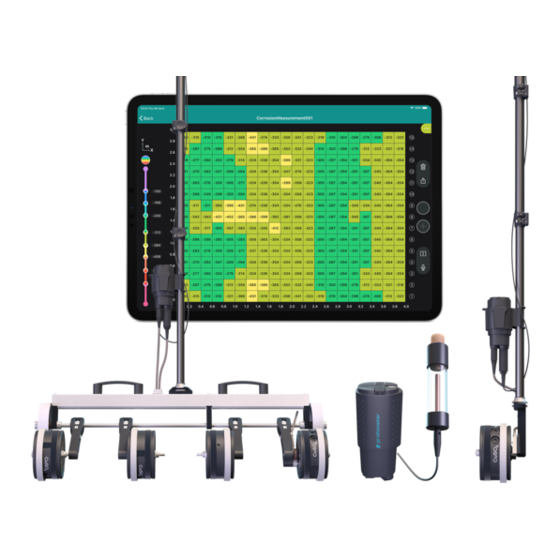
- Page 1 PM8500 Profometer Corrosion User Manual...
- Page 2 Document Revision: Revision Date: Sep 13, 2023 Document State: Live Company: Proceq SA Ringstrasse 2 CH-8603 Schwerzenbach Switzerland Classification: Technical Manual Revision History Date Author, Comments Sep 13, 2023 DFH - Initial document 25. September 2023 © Copyright 2023, PROCEQ SA...
-
Page 3: Table Of Contents
Typical Potential Range ....................10 3.1.3 Factors affecting the potential measurement .............. 10 3.1.4 Application limits of the potential measurement technique .......... 12 PM8500 Operation ....................... 13 Preliminary Operations ...................... 13 4.1.1 Prepare the electrode(s) ....................13 4.1.2 Selecting the correct grid and marking the surface ............. 13 4.1.3... - Page 4 Reserved Rights The content of this document is intellectual property of Proceq SA and prohibited to be copied neither in a photomechanical or electronic way, nor in excerpts, saved and/or be passed on to other persons and institutions.
- Page 5 7 days. However, the period could vary depending on the courier. Hence, it is recommended to check the exact time limit when receiving the goods. If there are any damages also inform your authorized Proceq agent or Proceq SA immediately. Shipment Should the device be transported again, it must be packaged properly.
-
Page 6: Introduction
Profometer app. Given mobile data connectivity (Wi-Fi or mobile network), the pm app automatically and safely stores all measurements on the Screening Eagle Workspace. 1.1 Scope of this document This document is the user manual for all products of the PM8500 Product family. 25. September 2023 © Copyright 2023, PROCEQ SA... -
Page 7: Product Versions
Profometer PM8500 License 1.3 Product applications In general, two measurement types can be differentiated: Spot measurement using the rod electrode, Area measurement using the one wheel or the four-wheel electrode. 25. September 2023 © Copyright 2023, PROCEQ SA... -
Page 8: Scope Of Delivery
2 Scope of Delivery Please refer to the Quick Start Guide, and Quick Reference Guide provided in the standard delivery and available in download section of the product webpage: 25. September 2023 © Copyright 2023, PROCEQ SA... -
Page 9: Measurement Principle
The reference electrode of PM8500 system is a Cu/ CuSO4 half-cell. It consists of a copper rod immersed in a saturated copper sulphate solution, which maintains a constant, known potential. -
Page 10: Typical Potential Range
3.1.3 Factors affecting the potential measurement Provided that the corrosion conditions are equal (chloride content or carbonation of the concrete at the steel surface) the main influences upon the half-cell potentials are: 25. September 2023 © Copyright 2023, PROCEQ SA... - Page 11 Without checking the actual corrosion state this may lead to misinterpretation of the potential data. The air permeability of the concrete may be tested with Proceq’s Torrent instrument. 25. September 2023 © Copyright 2023, PROCEQ SA...
-
Page 12: Application Limits Of The Potential Measurement Technique
However, corrosion rate readings are of limited value as the rebar corrosion rate varies considerably with time. It is more reliable to work with corrosion readings taken over a period of time. 25. September 2023 © Copyright 2023, PROCEQ SA... -
Page 13: Pm8500 Operation
For large areas such as parking and bridge decks the wheel electrode is preferable. The integrated path measurement ensures the correct grid in the direction of measurement. To 25. September 2023 © Copyright 2023, PROCEQ SA... -
Page 14: Choosing The Appropriate Electrode
The connections should be situated as far as possible in opposing corner areas of the surface under test. The measured resistance should not be more than 1 Ω above the resistance of the cable used. 25. September 2023 © Copyright 2023, PROCEQ SA... -
Page 15: Sensor Unit Overview
4.1.5 Sensor Unit overview Figure 4 : PM8500 Sensor Unit: Keys Overview Figure 5 : PM8500 Sensor Unit: LED behavior 25. September 2023 © Copyright 2023, PROCEQ SA... -
Page 16: Connecting The Electrode Cables With The Sensor Unit
4.1.6 Connecting the electrode cables with the sensor unit Rod Electrode: Figure 6 : PM8500 Rod electrode cabling set up Figure 7 : PM8500 Rod electrode cabling set up 25. September 2023 © Copyright 2023, PROCEQ SA... - Page 17 One Wheel and Four-Wheel Electrode: Figure 8 : PM8500 One wheel electrode cabling set up Figure 9 : PM8500 Four-wheel electrode cabling set up 25. September 2023 © Copyright 2023, PROCEQ SA...
-
Page 18: How To Mount The Sensor On The Harness
4.1.7 How to mount the sensor on the harness PM8500 includes a chest harness to carry the iPad, helping the user for free hands operation. This harness is also very useful to carry the sensor unit when using the rod electrode. To do so, you can use the universal holder, and connect the inner clamp to the harness belt. -
Page 19: How To Mount The Telescopic Rod On The One Wheel And Four-Wheel Electrode
This foam might be deteriorated within the time, and that is why some replacements are provided in the standard kit. Replacing a deteriorated foam is very easy following the next steps: Figure 13 : PM8500 Rod Electrode: Foam replacement 25. September 2023 © Copyright 2023, PROCEQ SA... -
Page 20: How To Change The Distance Between The Wheels
250mm is recommended when a big surface must be tested. This task is very easy to do, and all the tools are included in the four-wheel kit. Figure 14 : PM8500 Four Wheel Electrode: 150, 200 and 250mm spacing options 25. September 2023 © Copyright 2023, PROCEQ SA... -
Page 21: Coated Surfaces
Figure 15 : PM8500 Four Wheel Electrode. Wheel spacing set up 4.1.11 Coated surfaces It is not possible to make a measurement through an electrically isolating coating (e.g. an epoxy resin coating, sealing sheets or asphalt layers.) It is possible to make a measurement through thin dispersion coatings, that are often used, for example on the walls and ceiling of underground car parks, however this can cause a small shift of the potentials. -
Page 22: Starting A Measurement
This is only possible with the Rod Electrode. Proceq provides an additional sponge that connects to the rod electrode to increase the overall surface contact area, to prevent testing immediately above a large aggregate. - Page 23 Once the app is downloaded, user needs to create a Screening Eagle account. Should you already have and Eagle ID, please log in. Figure 17 : PM8500 Profometer App: Singing and logging in Figure 18 : PM8500 Profometer App: Singing and logging in 25.
-
Page 24: Turning On And Off The Device
Figure 19 : PM8500 Profometer App: Singing and logging in 4.2.2 Turning on and off the device Press the button during 2 seconds until the LED turns green solid. To turn it off, press it also during 2 seconds until the LED turns off. -
Page 25: Connect The Sensor Unit To The Profometer App
4.2.3 Connect the sensor unit to the Profometer App The PM8500 sensor unit uses Bluetooth wireless connectivity to be paired with the iPad. Just select the “Probe” icon, and then click “Connect” whenever you find your sensor unit. Figure 21 : PM8500 Profometer App: connecting the probe 4.2.4 Create a new file and start your first measurement... -
Page 26: Profometer App Overview
4.3 Profometer App Overview 4.3.1 Quick overview Figure 23 : PM8500 Profometer App: settings panel Figure 24 : PM8500 Profometer App: settings panel 25. September 2023 © Copyright 2023, PROCEQ SA... - Page 27 Disabling this feature will correct the potential readings manually taking into consideration the potential value included under the “Potential Shift” setting. Figure 25 : PM8500 Profometer App: potential shift according to temperature 25. September 2023 © Copyright 2023, PROCEQ SA...
- Page 28 (Left to right, bottom to top, horizontal zig zag, vertical zig zag). Fixed Grid This applies both to the rod electrode and the wheel electrode. The grid dimension is prefixed but can be defined by the user. 25. September 2023 © Copyright 2023, PROCEQ SA...
- Page 29 By placing thumb and index finger apart on the screen and pinching them together. The potential values associated to each cell can be visualized by zooming in at the needed level. The image from left to right by dragging. 25. September 2023 © Copyright 2023, PROCEQ SA...
-
Page 30: Tutorial Videos
4.3.2 Tutorial videos For more information to understand how to use the app, please download the tutorial videos in the app: Figure 26 : PM8500 Profometer App: tutorial videos The following videos are available: Firmware updates Getting started Odometer calibration... - Page 31 Zoom and scroll to any desired location, change the color palette and the potential thresholds to enhance the readability and highlight the desired details. Text notes can be added to any cells. Figure 27 : PM8500 Profometer App: Potential View Statistic View Distribution and cumulative distribution graphs are shown in the same view.
- Page 32 Figure 28 : PM8500 Profometer App: Statistic View If the surface under test has both actively corroding as well as passive rebars, then the two states exhibit two distinct partially overlapping distributions, with the corroding areas centered on a more negative potential.
- Page 33 NOTE! It is always advisable to perform direct visual check on open locations to confirm/refine the expected corrosion potential thresholds. Figure 29 : PM8500 Profometer App: Chipping Graph View BASIC MODE: Chipping Graph The threshold limits can be selected manually or using the limits suggested by ASTM C 876-...
-
Page 34: Operation And Handling
3. Connect either the rod or the wheel electrode to the Electrode - Input (blue cable). 4. Put both probes together to close the electrical circuit. Recommendation for wheel electrodes: measure direct on the wooden spigot (copper sulphate side). 25. September 2023 © Copyright 2023, PROCEQ SA... - Page 35 Saturated Calomel + 242 mV* *(at 25°C, regard to the standard hydrogen reference electrode) The potential difference that theoretically should be read on the PM8500 is given by: ΔE = E1 – E2, : potential of the reference electrode : the theoretical potential of the electrode to be checked.
-
Page 36: Measurement Files Visualization & Storage
(Wifi or mobile network) allowing synchronization of the iPad. Reading, sharing & reporting (pdf printing of tab) is possible. The tabs provide all the statistical values, screenshot views & logbook information. Figure 32: Screening Eagle Workspace 25. September 2023 © Copyright 2023, PROCEQ SA... -
Page 37: Maintenance And Support
6 months. An extended warranty for one, two or three years for the electronic portion of the instrument may be purchased up to 90 days of date of purchase. 25. September 2023 © Copyright 2023, PROCEQ SA... -
Page 38: Disposal
25. September 2023 © Copyright 2023, PROCEQ SA... -
Page 39: Technical Specifications
Sensor Unit: 150g / 0.33 lbs. without holder; 220g / 0.49 lbs. Weight --> g / lb. Rod electrode: 120g / 0.26 lbs. without cable / without copper sulfate, without Sensor Unit 25. September 2023 © Copyright 2023, PROCEQ SA... - Page 40 P67 with closing caps inserted. IP Classification IP64 when cables are connected. Standards and Guidelines ASTM C876, RILEM TC 154-EMC, DGZfP B3, SIA 2006, UNI 10174, JGJ/T 152, JSCE E 601, CE certification 25. September 2023 © Copyright 2023, PROCEQ SA...
- Page 41 For safety and liability information, please check www.screeningeagle.com/en/legal Subject to change. Copyright © Proceq SA. All rights reserved. 25. September 2023 © Copyright 2023, PROCEQ SA...
- Page 42 OUTH MERICA ROCEQ UROPE Proceq SAO Equipamentos de Mediçao Ltda. Ringstrasse 2 Rua Paes Leme 136 CH-8603 Schwerzenbach Pinheiros, Switzerland Sao Paulo SP 05424-010 Brasil +41 43 355 38 00 T +55 11 3083 3889 UROPE ROCEQ IDDLE Screening Eagle UK Limited...
Need help?
Do you have a question about the PM8500 and is the answer not in the manual?
Questions and answers