Table of Contents
Advertisement
Quick Links
Whole or part of this manual may not be copied or reproduced without the written permission of Futaba Corporation.
This manual is a copyrighted work of Futaba Corporation and the copyright belongs to Futaba Corporation.
The contents of this instruction manual may be changed without prior notice.
Mold Marshalling System for Measuring
Melt Front Speed inside the Mold
Melt Front Speed
MFS02
Instruction Manual
Thank you for your purchasing a product of Futaba Corporation.
Please read this instruction manual carefully and patronize the
product for many years to come.
Do not use the product in any way other than explained in this
instruction manual.
Measuring Amplifier
Advertisement
Table of Contents

Related Manuals for FUTABA MFS02

Summary of Contents for FUTABA MFS02
- Page 1 Do not use the product in any way other than explained in this instruction manual. Whole or part of this manual may not be copied or reproduced without the written permission of Futaba Corporation. This manual is a copyrighted work of Futaba Corporation and the copyright belongs to Futaba Corporation.
-
Page 2: Table Of Contents
Contents 安全上のご注意 Safety Precautions 5. Using the System Preface Standard Accessories 5-1 Adjusting Light Intensity Handling Precautions 5-2 Selecting Setting File 5-3 Starting Measurement System Configuration 5-4 Observing Flow Velocity Waveforms 19 1. Names and Major Functions of Components 4 6. -
Page 3: Safety Precautions
After reading the manual, keep it in a safe place so that it can be used whenever needed. When using the product, be sure to observe the following safety precautions. Futaba Corporation assumes no liability for the injury caused by using the product contrary to these precautions. -
Page 4: Preface
・Warranty and Certificate of Registration ・・・・・・・・・・・・・・・・・・・・・・・・・・・・・・・・・・・・・・・・・・・・・・・・ ■ Optional Accessories (Sold Separately) ・Relay amplifier “UPV01” ・・・・・・・・・・・・・・・・・・・・・・・・・・・・・ 1 (or 2 if two amplifiers are ordered) If you purchased this at the same time with the MFS02 main unit, please make sure it is included in the package. -
Page 5: Handling Precautions
Handling Precautions Turn on the power to the amplifier after connecting between the systems. Be sure to connect the power cable of the amplifier to the AC outlet. Do not turn on/off the power supply by disconnecting and connecting the I/O cable connector. -
Page 6: System Configuration
AC outlet Relay amplifier As shown in the above figure, the “MFS02” is designed to connect an optical fiber sensor to the input. The flow velocity sensor is connected to a relay amplifier, and connected to the connector of the MFS02 main unit amplifier via a junction cable. -
Page 7: Names And Major Functions Of Components
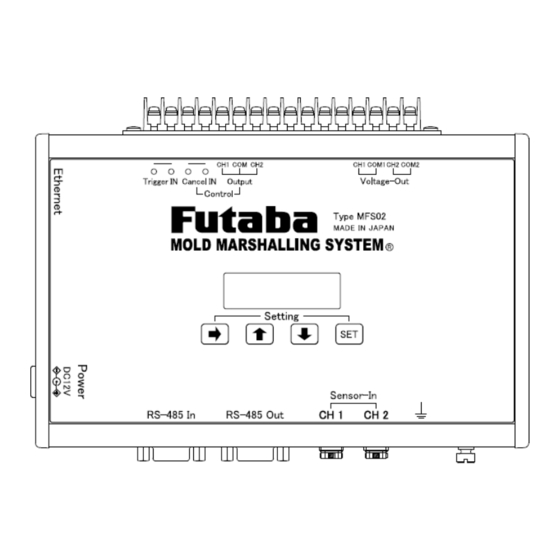
1. Names and Major Functions of Components 1-1 Front ⑥ ⑤ ⑦ ① ② ⑧ ③ ④ ① Display panel ・・・・・・・・・・・・・・・・・・・・・・・・・・・・・Displays version information, IP address, input voltage and flow velocity measurement values, etc. ② Control keys”→”, “↑”, “↓”, “SET” ・・・・・・・・・・・”→” key: Changes the display contents when held down. -
Page 8: Preparation
This section explains the preparation required before turning on the power. 2-1 Setting up the Network Connections ■ Make settings for communication between the amplifier MFS02 and PC. * For the Network setting procedure, refer to the “Measurement Software (PFS) Installation Manual”. -
Page 9: Installing The System
2-3 Installing the System 2-3-1 Installing the Flow velocity Sensor The following figure shows an example of the installation. One fixation screw (sold separately) is required for one sensor. A wrench (sold separately) is needed to tighten the fixation screw. ※Provided, however, that this does not apply to the cases where the customer determines the fixation method of the sensor. -
Page 10: Connections In System
2-4 Connections in the System ■ Connect the components in order of the numbers shown in the following figure. Connect the power supply ⑥ after completing the connections ① to ⑤. ④ Data logger, etc. ⑤ ⑥ ③ ② AC outlet ①... -
Page 11: Connecting The I/O Signals
③ Connect the “GND” terminal to ground. ④ Connect the trigger signals from the injection molding machine. ⑤ Connect the LAN cable to the amplifier and PC. Make sure that the connector is locked with a “click”. ⑥ Connect the AC adapter. 2-5 Connecting I/O Signals <<What is the input signal?>>... - Page 12 ●Input signal circuit specification (trigger signal, clear control signal) Input the signal to the amplifier via the electromechanical relay. Caution Do not apply voltage. 注意 Example 1: When the output of the molding machine connected to the amplifier is ”relay output”: Example of connection of input signal when the molding machine output signal is contact output Molding machine output signal...
-
Page 13: Connecting The Power Supply
●Output signal circuit specifications (control output signal) The control output from the amplifier is up to 100 mA (30 V or less) in the Warning NPN open collector. Use the power supply with the negative side connected to the ground. Example: Connect I/O signals using the 24 VDC power supply and 24 VDC relay. -
Page 14: Basic Operation Of Measurement Amplifier
3.Basic Operation of Measurement Amplifier This section describes the basic operation of amplifier “MFS02”. 3-1 Turning Power ON/OFF ■Turning power ON Turn on the power to the amplifier by referring to Section 2-6 “Connecting the Power Supply” on Page 10. -
Page 15: Lcd Window Display
3-2-2 LCD window display Turning on the power displays the following LCD window (The photo below shows the default window when shipped). ■ Holding down “→” key (for over one second) changes the display content. Window changes as follows. Start window Input voltage Change Measured... -
Page 16: Basic Operation Of Measurement Software
4-1 Starting and Exiting Software ■ Starting software Double-click the shortcut “PFS” on the desktop. *If the shortcut “PFS” is not found, specify the “PFS” executable file in c:¥Program files¥Futaba¥pfs and click “Create Link” to create a shortcut. ■ Exiting software Select “Quit”... -
Page 17: Setting Conditions
■ Toolbar The frequently used commands are provided as buttons. The functions of individual commands are explained below. ① ② ③ ④ ⑤ ⑥ ⑦ ⑧ 取 ① Show/Hide Template wave Shows or hides the Template waveforms read into the frame screen. ②... - Page 18 Click the “Settings” button. The Settings screen appears. ■ Measurement conditions Set the time to make measurements. ① ② ① Measurement time Set in units of seconds from 1 to 120. Set a shorter time than the molding cycle time. ②...
- Page 19 ■ Setting trigger conditions Set trigger conditions for detecting velocity waveform. ※ When running two-point measurements, input the values for CH1 and CH2 respectively. The tab can be switched by clicking the channel tab. ① ② ③ ⑤ ④ ① Set a point to capture a Time until a trigger occurs after the trigger conditions are met.
- Page 20 ③ Number of contiguous The number of contiguous data on the decay wave slope data on the decay wave slope ④ Set inclination of a Set the angle of the inclination of a waveform for conditions of searching a waveform passage start point.
-
Page 21: Saving Settings As
■ After completion of “setting the measurement conditions”, “flow front”, “trigger conditions”, “waveform search algorithm” and “control output conditions”, save the new settings. Select “Save As” from “File” in the Settings window and input a file name to save the file. ・ Save the file in :C:¥Program Files¥/Futaba/pfs/... -
Page 22: Using The System
5.Using the System The previous operations have completed the necessary preparations. Now, the user can run the system and observe flow velocity waveforms. 5-1 Adjusting Light Intensity ■Close the mold once and check the voltage level before the resin passes over the sensor. Adjust the light intensity of the relay amplifier in the range of 2000 to 3000 mV. -
Page 23: Observing Flow Velocity Waveforms
5-4 Observing Flow Velocity Waveforms ■ When molding is started, flow velocity waveforms are displayed Measurement result window (P.26) Indicates the measurement range of passage waveform Display check button Passage start point Passage end point Minimum voltage value Maximum voltage value ※... -
Page 24: Function Description
6.Function Description This section explains specific functions and advanced operations. 6-1 Displaying Template Waveforms Flow velocity waveforms stored in the past can be displayed in the frame window. Overlaying the template waveforms on the waveforms being measured makes it possible to visually check “flow velocity transition at molding condition adjustment”, “flow velocity variation during mass production”, and “flow velocity change when the molding conditions are changed”. -
Page 25: Overlaying Waveforms
■ Open a template waveform of velocity waveforms Select [Open a velocity waveform (HSp File)as a template waveform] from “File” in the menu bar. Velocity waveforms are stored in the following folder along with other measured waveforms. C:/Documents and Settings¥<User name>¥My Documents¥MMS_DATA Select a file from the folder displayed with the date and press [Open]. -
Page 26: Using The Cursor Functions
※If you want to hide overlay, set the overlay count to 0. 6-3 Using the Cursor Functions Time and voltage values can be displayed by placing the cursor on the waveforms being measured. To do so, use “Cursor tool” on the toolbar. 6-4 Waveform Display Settings 6-4-1 Enlarging waveforms (zoom) ■... -
Page 27: Moving The Waveform Position
6-4-2 Moving the waveform position ■ A position in the enlarged part can be moved by using the “Hand” button on the toolbar. 6-4-3 Displaying the entire waveform (zoom out) ■ The entire waveform display can be restored by using the “Fit to measurement conditions” button on the toolbar. -
Page 28: Result Display Settings
6-5 Result Display Settings Select [Display results] from [View] in the menu bar. Flow velocity window opens. Grab the lower right corner with the mouse and drag it to resize a window. -
Page 29: Saving Data
Save destination folder Remarks (default) Setting file Condition settings .xml C:/Program A setting file contains conditions that are Files/Futaba/pfs set to perform measurement and monitoring. Select one from the relevant folder in the PC to use. Waveform Measured waveforms .csv C:/Users/<User Saved for each shot number. - Page 30 ■ Velocity data file (int_HSp_<Shot number>_<Year, month, day, hour, minute, second>.csv) Format The numbers on the far left are the respective line numbers. High Speed Data Time:xxxx/xx/xx xx:xx:xx Observation Period: 200ms Sampling Interval:50us Shot No:xxxx Trigger at: Transit time before minimum voltage: Minimum voltage at:...
- Page 31 ■ Log file (log_<year, month, day>.csv) Format The numbers on the far left are respective line numbers. Time Shot Result CHxx Result CHxx Peak CHxx Start voltage CH1-CH2 CH1-CH2 CH1-CH2 … … … … … … … CHxx CHxx CHxx CHxx CHxx Hi Trigger...
-
Page 32: Checking The Operation
7. Checking the Operation This section explains how to check whether the system runs normally. 7-1 Checking the Communication between Amplifier and PC The amplifier communicates with the PC through LAN connection. Whether the communication is implemented normally can be checked with the color of the indicator at the upper right of the operation window. -
Page 33: Checking The Operation Of Sensor
7-3 Checking the Operation of Sensor Follow the procedure below to simply check the operation of the sensor. ■ Press “Free run”. Sensor begins producing its outputs. ■ Move an appropriate reflective plate closer to the tip of the sensor and check whether the voltage level changes. -
Page 34: Specifications
8.Specifications ■ List of specifications <Flow velocity measuring amplifier MFS02> Number of measurement points Sampling period 1ms / 5ms / 10ms / 20ms Sampling speed Up to 120 sec ※ Velocity measurement range 10 to 1000 mm/sec Operating ambient temperature 0 to +50℃... - Page 35 ■ Outline drawing [Unit: mm] <Flow velocity Measurement Amplifier MFS02> Mounting magnet <AC Adapter> 6 3 . 5 1 6 5 0 ± 5 <Relay Amplifier UPV01> (Sold separately)
-
Page 36: Reference Materials
9.Reference Materials 9-1 How to Connect Sensor to the Relay Amplifier Do not insert a sensor with the locking lever in a locking position. Caution Doing so could cause damage or failure of the devices. 意 Do not push the sensor too strongly against the bottom as it may Caution damage or break the parts inside the amplifier. -
Page 37: How To Adjust Light Intensity
9-2 How to Adjust Light Intensity 9-2-1 Adjustment of light intensity If the light intensity is insufficient or excessive on the measurement screen as shown in the following figures, adjust the light emitting power of the relay amplifier. 5000mV 1000mV time Appropriate light intensity Saturated... -
Page 38: Adjusting The Light Intensity Of
9-2-2 Adjusting the light intensity of relay amplifier 1. Open the top cover of the relay amplifier and hold down the “MODE” (for over 3 seconds). Initial screen The 【hSP】indicator flashes 2. Here, press “MODE” five times to put the unit in light emission power switching mode 【Att】. -
Page 39: Other Search Algorithms
9-3 Other Search Algorithms 9-3-1 Variation Search This algorithm searches the points where the voltage reaches its minimum and maximum values. It sets these points as origins to detect the points where the variations begin to be continuously within the specified range respectively in minimum and maximum voltage directions. -
Page 40: Percentage Time Search
9-3-2 Percentage time search This algorithm searches the points where the voltage reaches its minimum and maximum values and sets these points as origins. It adds specified percentages of the time to the time at these points respectively in minimum and maximum voltage directions with the period between the minimum and maximum voltage points as 100% to determine the passage time. - Page 41 The specifications may be changed for improvement without prior notice. MFS-1512W-A1E...
Need help?
Do you have a question about the MFS02 and is the answer not in the manual?
Questions and answers