Table of Contents
Advertisement
Quick Links
Advertisement
Table of Contents

Subscribe to Our Youtube Channel
Related Manuals for ADInstruments DSA2016TG


Summary of Contents for ADInstruments DSA2016TG
- Page 1 USER’S MANUAL Handheld Spectrum Analyzer DSA2016TG V1.0.0...
- Page 2 Notice AD INSTRUMENTS . All Rights Reserved. AD INSTRUMENTS . reserves the right to modify or change parts of or all the specifications without special notification. AD INSTRUMENTS . promises that the information is all correct and reliable but does not guarantee no mistake in this document. Please confirm that the relevant document and specification is the latest valid version before using.
-
Page 3: Table Of Contents
Contents CHAPTER1 QUICK START ................7 1.1 Instrument Introduction ..................8 1.2 General Inspection ..................... 9 1.3 To Prepare for Use ..................... 9 CHAPTER2 OPERATING BASICS ..............10 2.1 Front Panel ....................... 11 2.1.1 Menu Reference ......................11 2.1.2 Front Panel Function Keys .................... 12 2.1.3 Numeric Keyboard ...................... - Page 4 5.2.1 Clear Status ........................48 5.2.2 Identification Query ...................... 48 5.2.3 Reset ..........................49 5.2.4 ABORt Command ......................49 5.3 CALCulate Subsystem ..................49 5.3.1 CALCulate: MARKer Subsection ..................49 5.4 DEMOdulation Subsystem ................51 5.4.1 AM Demodulation ......................51 5.4.2 FM Demodulation ......................
- Page 5 General Safety Summary Please review the following safety precautions carefully before putting the instrument into operation so as to avoid any personal injuries or damages to the instrument and any product connected to it. To prevent potential hazards, please use the instrument only specified by this manual.
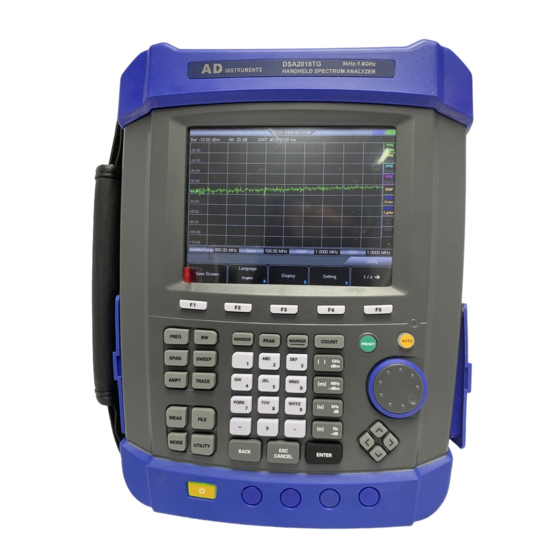
- Page 6 Model Number The model in DSA2016TG instrument Instrument Model Number Model No. Spectrum Analyzer DSA2016TG 9 kHz to 1.6 GHz 5M-1.6G...
-
Page 7: Chapter1 Quick Start
Chapter1 Quick Start Instrument Introduction General Check Preparation... -
Page 8: Instrument Introduction
1.1 Instrument Introduction DSA2016TG spectrum analyzers which are small, light and cost-effective, are portable spectrum analyzers designed for starters. Configured with easy-to-operate numeric keyboard, high-resolution color LCD display and various remote communication interfaces, they can be widely used in various fields, such as education, company research and development as well as industrial manufacture. -
Page 9: General Inspection
1.2 General Inspection 1. Inspect the shipping container for damage Keep the damaged shipping container or cushioning material until the contents of the shipment have been checked for completeness and the instrument has passed both electrical and mechanical tests. 2. Inspect the instrument In case of any damage, or defect, or failure, notify the AD INSTRUMENTS representative. -
Page 10: Chapter2 Operating Basics
Chapter2 Operating Basics Front Panel Menu Reference Top Panel Side Panel User Interface Menu Operation Parameter Setting... -
Page 11: Front Panel
2.1 Front Panel 2.1.1 Menu Reference 1. LCD 2. Menu softkeys/menu control keys 3. Charge indicator (Only lights up when charging) 4. Knob 5. Direction keys 6. Numeric Keyboard 7. Power switch (Lighting-normal work status) 8. Function key area... -
Page 12: Front Panel Function Keys
AUTO: Search for signals automatically within full frequency range. 2.1.3 Numeric Keyboard DSA2016TG provides a numeric keyboard at the front panel (as shown in the figure below). The numeric keyboard which supports the Chinese characters, numbers and common symbols (including decimal point, and -) are mainly used to edit file or folder name. - Page 13 The numeric keyboard consists of the following parts: • The input mode is fixed at number input during parameter setting. During parameter setting, press this key to input the symbol (“-”) of the figure. When the key is pressed for the first time, the parameter symbol is “-”.
-
Page 14: Top Panel
2.2 Top Panel 1. RF OUT Connector: The output for the built-in tracking generator. Enabled with Option TG3. 2. EXT TRIG IN/REF IN (BNC, Female): Connects to an external TTL signal or a 10 MHz reference signal. The TTL signal is used to the analyzer’s internal sweep. 3. -
Page 15: Left Panel
2.3.2 Left Panel Left Panel Headphone Connects to a headphone SD card slot... -
Page 16: User Interface
2.4 User Interface User interface: 1. Reserved 2. Time: System time 3. USB storage device status: is displayed when USB storage device is installed. 4. Operation status: Display “Local” (in local mode) or “Rmt” (in remote mode). 5. Power display 6. -
Page 17: Menu Operation
15. Trigger type: Free. 16. Average type: Average type in BW, logarithmic power, power, voltage. 17. Preamplifier status: Enable or disable the preamplifier. 18. Average times: Average times of trace. 19. Menu title: Function of the current menu. 20. Menu items: Menu items of the current function. 21. -
Page 18: Parameter Setting
4. Enter Lower Menu (without parameter) Press the corresponding menu key to enter the lower menu. For example, press “Corrections” to enter directly. 5.Function Switch + Parameter Input Press the corresponding menu key to switch between functions; change the parameter directly using the numeric keys. For example, press “CF Step”... - Page 19 Note: in the storage function, the direction keys can also be used to select the current path or file.
-
Page 20: Chapter3 Basic Settings
Chapter3 Basic Settings This chapter describes in detail the function keys at the front panel and the associated functions. Subjects in this chapter: Basic Settings Sweep and Function Settings Marker Measurements Shortcut Key... -
Page 21: Basic Settings
3.1 Basic Settings 3.1.1 FREQ Set the frequency parameters of the analyzer. The analyzer sweeps within a specified frequency range, and the sweep is restarted every time you change the frequency parameters. The frequency range of a channel can be expressed by either of two groups of parameters: Start Frequency and Stop Frequency( );... - Page 22 • In Zero Span mode, the start frequency, stop frequency and center frequency are always the same. If one is changed, the others are updated to match. • You can modify this parameter using the numeric keys, knob or direction keys. Refer to “Parameter Setting”...
-
Page 23: Span
Direction Key Step in 1, 2, 5 sequence 3.1.2 SPAN Set the span of the analyzer. The change of this parameter will affect the frequency parameters and restart the sweep. Span Set the frequency range of the current channel. Press this key to switch to center frequency/span input mode and the center frequency and span are displayed at the lower left and right sides of the grid respectively. -
Page 24: Ampt
gain more information about the signal. 3.1.3 AMPT Set the amplitude parameters of the analyzer. Through modifying these parameters, signals under measurement can be displayed in a proper mode for easier obsercation and minimum error. Ref Level Set the maximum power or voltage can be currently displayed in the window and the value is displayed at the upper left corner of the screen grid. - Page 25 Scale/Div Set the logarithmic units per vertical grid division on the display. This function is only available when the scale type is set to “Log”. Key Points: • By changing the scale, the amplitude range available is adjusted. Scale Type Set the scale type of Y-axis to Lin or Log, the default is Log.
-
Page 26: Sweep And Function Settings
Range -300 dB to 300 dB Unit Knob Step Direction Key Step RF Preamp Set the status of the preamplifier located at the front of the RF signal path. Turning on the preamplifier reduces the displayed average noise level in order to distinguish small signals from the noise when the signal under measurement is small. -
Page 27: Sweep
Key Points: • Reduce VBW can make the spectral line be smooth, and the small signal which is submerged in noise can stand out. But the scan time will be longer. (When scan time is automatic, it is influenced by RBW and VBW together). •... -
Page 28: Trace
number. 2. Continue Set the sweep mode to “Cont”. The character Continue on the parameter icon denotes the analyzer is sweeping continuously. Key Points: • If the instrument is in single sweep mode and no measurement function is enabled, press this key and the system will enter the continuous mode and sweep continuously if all the trigger conditions are satisfied. -
Page 29: Marker Measurement
1. Clear Write The trace continuously displays the points during the sweep of the analyzer. 2. Max Hold Maintain the maximum for each point of the trace, and update the trace point if a new maximum is generated in successive sweeps. 3. - Page 30 Keypoints: • It can show four pairs of marker on time at the most, but there is only one pair or one single marker which is in activated status each time. • You can use numeric keys, knobs or direction keys to modify this parameter. The detail method refers to the specification in “Parameter Setting”.
- Page 31 “Difference Value”, “Difference Value Pair” and “Span Pair” marker shows the frequency difference of reference marker relative to differenct value marker. In the mode of non-zero sweeping width, the default reading method is “Frequency”. Period “Normality” marker shows the reciprocal of marker frequency, when choose this type of reading method.
- Page 32 • This function is invalid in the mode of zero sweeping width. Reference Line Set reference level of spectrum analyzer as the frequency of current marker. • Reference level is set as the amplitude of marker when choosing normality marker. •...
-
Page 33: Shortcut Key
Parameter Instruction Default 10 dB Range 0 dB ~ 200 dB Unit Knob Step 1 dB Direction Key Step 1 dB Peak thresh Specify the minimum value of peak amplitude. The peak which is higher than peak thresh can be judged as peak. -
Page 34: Preset
After Auto Search: Key Points: • In the process of auto search, the backlight of Auto turns on and “Auto Tune” is shown in the status bar on the screen until the search is finished. • Some parameters such as the reference level, scale, input attenuation and maximum mixing level may be changed during the auto search. -
Page 35: Utility
Frequency Center Freq 1.6GHz (800MHz) Start Freq 0 Hz Stop Freq 1.6GHz (1.6GHz) CF Step Auto,150 MHz Span Span 1.6GHz (1.6GHz) Amplitude Ref Level 40 dBm Ref Offset 20 dB Scale/Div 5/DIV Input Atten Auto,40 dB Scale Type Unit RF Preamp Auto, 1 MHz Auto, 1 MHz V/R Ratio... - Page 36 3. Display Control the screen display of the analyzer, such as setting the graticule brightness, screen state, brightness. u Brightness Set the LCD brightness of the analyzer. Default is 100. You can modify this parameter using the numeric keys, knob or direction keys. u Backlight Keeping Set the On/Off status of backlight, default is “Off”...
- Page 37 Reference Clock DSA2016TG provides internal clock or external clock. User can select the internal or external clock sourse directly. Default is internal clock. u Keytone It can be turn on or off. u Power by USB when shut down User can select whether it will still be powered by USB after shuting down.
- Page 38 The system time is displayed in “hh:mm:ss YYYY-MM-DD” format in the DSA800 user interface. The output file can include the time information when printing or storing interface image according to your setting. u Set Time Set the display time of the analyzer. The time format should be hhmmss, for example, 231211 (denotes 23:12:11).
-
Page 39: Chapter4 Test Case
Chapter4 Test Case u Testing Low Level Signal Testing Signal Distortion 4.1 Testing Low Level Signal This section introduces how to test low level signal, and how to differentiate it with the noice in the same spectrum. The following is three methods to test low level signal. 4.1.1 Reduce the Loss of Input The ability of spectrum analyzer to test low signal is limited by the noice produced internally. - Page 40 1) Reduce the span to 1 MHz. If need, move the peak value to the center of screen again. l Press SPAN →1 MHz 2) Set the attenuation as 20 dB. Pay attention that when the attenuation increases, the bottom of noice will be more close to signal level. l Press AMPT→Attenuation→...
-
Page 41: Reduce The Resolution Bandwidth
4.1.2 Reduce the Resolution Bandwidth The internal noice level is influenced by resolution bandwidth, but continuous wave signal is not. Decrease RBW into 10%, and the bottom noise will also decrease 10 1) Reset spectrum analyzer 2) Set the frequency of signal source and amplitude as 1 GHz and -80 dBm. Connect the RF OUT port of signal source to the RF IN port of spectrum analyzer and turn on the signal output. -
Page 42: Trace Average
4.1.3 Trace Average Taking the average is the digital processing. It is to plus current value in each trace point and previous average value, and then take the average. Choose the operation of taking average. When spectrum analyzer is doing the automatic coupling, it can make the displayed noise level get smooth to change detection mode into sampling mode. -
Page 43: Measuring Signal Distortion
4.2 Measuring Signal Distortion This selection introduces how to recognize and measure signal distortion. Recognize the distortion produced by spectrum analyzer. The high level input signal may cause the distortion signal produced by spectrum analyzer. This distortion signal will cover the true signal that needs to be measured in the input signal. - Page 44 1. The center frequency should be changed as the frequency value at the first harmonic wave. Press [MARKER] → PEAK 2. Change the span as 50 MHz, and display the signal in the center of screen again. l Press [SPAN] → 50MHz l Press [MARKER] →...
- Page 45 6. Press [AMPT] → Attenuation → 10dB to turn up the RF attenuation to 10 dB. The reading of amplitude difference is influenced by two factors: 1) To increase input attenuation will make signal to noise ratio (SNR) worse which will cause the reading to be positive.
-
Page 46: Chapter5 Scpi Programme
Chapter5 SCPI Programme User can control DSA2016TG spectrum analyzer by USB, LAN or remote interface. This manual to guide the user to use SCPI commands to control DSA2016TG spectrum analyzer by USB, LAN or remote interface. Contents of this chapter:... -
Page 47: Scpi Brief Introduction
5.1 SCPI Brief Introduction SCPI (Standard Commands for Programmable Instrument) is an ASCII- based instrument command language designed for test and measurement instruments, with the goal of reducing automatic test equipment (ATE) program development time. SCPI accomplishes this goal by providing a consistent programming environment for instrument control and data usage. -
Page 48: Punctuation
5.1.4 Punctuation • A curly brackets “{ }” indicates a variable parameters to be defined. • A vertical bar "|" dictates a choice of one element from a list. For example: <A>|<B> indicates that either A or B can be selected, but not both. •... -
Page 49: Reset
5.2.3 Reset Command format: *RST Function description: This command returns the instrument to a factory defined condition that is appropriate for remote programming operation. 5.2.4 ABORt Command Command format: :ABORt Function description: Give up the current operation. Restart the sweep. 5.3 CALCulate Subsystem 5.3.1 CALCulate: MARKer Subsection •... - Page 50 Function description: Set measurement type of current mark Query measurement type of current mark Parameter specification : OFF: Turn off current cursor POSition: to set measurement type as Normal DELTa: to set measurement type as Different value BAND: to set measurement type as Band SPAN: to set measurement type as Span Return format :...
-
Page 51: Demodulation Subsystem
• Check the minimum amplitude value on the trace. Command format: CALCulate:MARKer:MINimum Function description: Check the minimum amplitude value on the trace, and mark it with current marker. Instruction It shows “No peak found” when can not find any peak. •... -
Page 52: Display Subsystem
5.5 DISPlay Subsystem 5.5.1 Trace Y-Axis Scaling Command format: DISPlay:WINDow:TRACe:Y[:SCALe]:PDIVision <rel_ampl> DISPlay:WINDow:TRACe:Y[:SCALe]:PDIVision? Function description: Set Y-Axis Scaling Check Y-Axis Scaling Parameter specification rel_ampl, float data,range from 0.1 dB to 20 dB Return format Return Y-Axis Scaling as float data 5.5.2 Trace Y-Axis Reference Level Command format: DISPlay:WINDow:TRACe:Y[:SCALe]:RLEVel <rel_ampl>... -
Page 53: Trace Subsystem
Check scale type Parameter specification LOG:Log LIN: Line Return format Return LIN or LOG 5.6 TRACe Subsystem 5.6.1 Read appointed trace data Command format: TRACe[:DATA]:TRACE<n>? Function description: Read out appointed trace data from spectrum analyzer Parameter specification Value of n : 1|2|3|4 Return format Return appointed trace data, its format depends on the set of commands: FORMat:TRACe:DATA... -
Page 54: Set On/Off Of The Average Function In Appointed Trace
Function description: Set appointed trace average time Check appointed trace average time Parameter specification Value of n : 1|2|3|4 int_avg, integral data,range from 1 to 1000 Return format Return appointed trace average time 5.6.4 Set on/off of the average function in appointed trace. Command format: TRACE<n>:AVERage 0|1 TRACE<n>:AVERage? -
Page 55: Sense Subsystem
5.7 SENSe Subsystem 5.7.1 FREQuency Subsection • Set start frequency Command format: SENSe:FREQuency:STARt <freq> SENSe:FREQuency:STARt? Function description: Set start frequency Query start frequency Parameter specification freq, integral data, range 0Hz to 1.6GHz Return format Query and return start frequency as an integer, unit is Hz. •... -
Page 56: Span Mode
Parameter specification freq, integral data, range 0Hz to 1.6GHz Return format Query and return span frequency as an integer, unit is Hz. 5.7.2 Span Mode • Set span mode Command format: SENSe:FREQuency: SPAN FULL|PREVious|ZIn|ZOUT Function description: Set span mode Parameter specification FULL: Set as full span PREVious: Set as previous span ZIn: Zoom-in span... -
Page 57: Bandwidth
Function description: This command indicates detection mode. The detector will show every sampling everage in the intervel between each trce. The everage will be achieved through the following two methods. Power Methods (RMS) Video Methods (Y-axis unit) These two methods is controlled by trace detection. Parameter specification The value of n: 1|2|3|4 NORMal: normal... -
Page 58: Average
Query vedio bandwidth. Parameter specification freq, integral data, range from 1Hz to 1MHz. Return format Query and return the value of video bandwidth (VBW) as integral data format, unit is • Set video bandwidth VBW as AUTO mode. Command format: SENSe:BANDwidth: VIDeo:AUTO OFF|ON|0|1 SENSe:BANDwidth: VIDeo:AUTO? Function description:... -
Page 59: Initiate Subsystem
• Turn on or off the autoset of input attenuation Command format: SENSe:POWer[:RF]:ATTenuation:AUTO OFF|ON|0|1 SENSe:POWer[:RF]:ATTenuation:AUTO? Function description: Turn on or off the autoset of input attenuation. Query the autoset status of input attenuation. Return format Query and return the autoset on(1) or off(0) status of input attenuation. •... -
Page 60: Start Single Sweep
Turn on or off the function of continuous sweep. When continuous sweep is turned off, it enters into single sweep status. Query the status of continuous sweep function. Return format Query and return the ON or OFF status of continuous sweep function as the format of characters. -
Page 61: Trigger Level In Video Trigger
Query and reture POSitive or NEGative as the format of characters. 5.9.3 Trigger Level in Video Trigger. Command format: TRIGger:SEQuence:VIDeo:LEVel <level> TRIGger:SEQuence:VIDeo:LEVel? Function description: Set trigger level in video trigger. Query trigger level in video trigger. This command is only valid when select video trigger. Parameter specification level, floating-point data, range from -300.0dBm to 50 dBm. -
Page 62: Preset
5.10.3 Preset Command format: SYSTem:PRESet Function description: This command makes the relevant setting of spectrum analyzer into preset status. -
Page 63: Chapter6 Specifications
Chapter6 Specifications This chapter lists the specifications and general specifications of the analyzer. All the specifications apply to the following conditions unless otherwise noted. The instrument has been warmed-up for 30 minutes. The instrument is within the calibration period and a self-calibration has been performed. Typical value and nominal value are defined as follows. -
Page 64: Technical Specifications
6.1 Technical Specifications Parameters Model DSA2016TG Frequency Frequency Range 9KHz~1.6HGz AC Coupled 5M~3GHz (1.6GHz) TG Frequency Resolution Reference Frequency 10MHz ±(frequency indication*frequency reference Frequency Readout Accuracy uncertainty+1%*span+20%RBW+marker resolution+1Hz) Internal 10MHz Reference Aging rate ±1ppm/year (0℃~50℃, Reference is 25℃) Temperature stability ±1ppm... - Page 65 Linear Scale and Units 0 to 100%, 10 divisions displayed Scale Unit dBm, dBmV,dBuV,Watts,Volts Sweep (Trace) Points Number of Markers Detectors Normal, positive peak, dample, negative peak, RMS Number of Traces Trace Functions Clear/write, maximum hold, minimum hold, average, check,close ±1.5dB(excluding input VSWR mismatch) Level Measurement Error 20~30℃,peak detector, preamplifier off, input signal -50dBm to 0dBm...
- Page 66 input 220VAC±15% AC frequency range 40Hz to 60Hz Power consumption Maximum 32W...
-
Page 67: Chapter7 Appendix
Chapter7 Appendix Appendix A Appendix B... -
Page 68: Appendix A:accessories
Appendix A : Accessories u Power: Input voltage range, AC 100 V to 240 V, standard value; AC frequency range 45 Hz to 440 Hz; Power consumption 35 W, typical value; All chosen work<50 W. u Software installation CD, including PC communication software, which can easily transfer the data from spectrum analyzer to PC. -
Page 69: Chapter8 General Care And Cleaning
Chapter8 General Care and Cleaning 8.1 General Care Do not put or leave the device in a place where the LCD display will be exposed to direct sunlight for long periods of time. Note: To avoid damage to the oscilloscope or probes, do not expose them to sprays, liquids, or solvents.
Need help?
Do you have a question about the DSA2016TG and is the answer not in the manual?
Questions and answers