Table of Contents
Advertisement
Quick Links
Advertisement
Table of Contents

Subscribe to Our Youtube Channel
Related Manuals for sauter FP Series


Summary of Contents for sauter FP Series
- Page 1 Sauter GmbH Ziegelei 1 Tel: +49-[0]7433- 9933-199 D-72336 Balingen Fax: +49-[0]7433-9933-149 E-Mail: info@sauter.eu Internet: www.sauter.eu Instruction Manual Diagram Force Gauge SAUTER FP Version 1.0 01/2016 PROFESSIONAL MEASURING FP-BA-e-1610...
-
Page 2: Table Of Contents
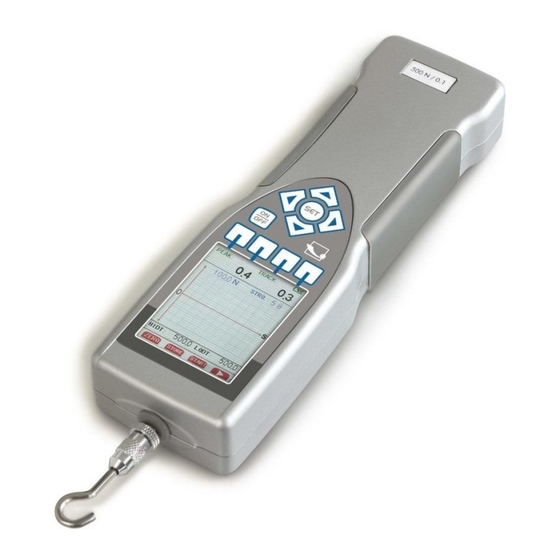
Instruction Manual Diagram Force Gauge Thank you for buying a SAUTER digital Diagram Force Gauge. This force gauge is compact and convenient, suitable for tension and compression measurement appl i- cations. It is small sized, low in weight, multifunctional, high in accuracy and the force curve is displayed on the screen. -
Page 3: Parameters
1 Parameters Capacity and sensor types: FP 2N up to FP 500N with integrated force sensor FP 1KN up to 50 KN with external force sensor Display: 240x320 Pixel TFT 65535 Color screen Units: N, kgf, lbf, ozf Accuracy: within +/- 0.5% Power: Adaptor: DC 12V/400mA, battery inside: Ni-MH 7.2V, 1200mAH Battery life: ≥... - Page 4 Internal measurement frequency: 2.000 Hz Overload protection: 150% of max Application in use with following SAUTER test stands: TVP, TVP-L, TVL, TPE, THM, TVO, TVM-N, TVS FP-BA-e-1610...
-
Page 5: Features
Peak hold, automatic peak zero Material strength measurement by inputting area Shutdown design without any operation Adaptation to several SAUTER test stands, automatic stop after reaching the pre -set force USB output, multiple test mode options after connecting to a computer, infinite data... -
Page 6: Names Of Items, Buttons And Functions
3 Names of items, buttons and functions FP-BA-e-1610... -
Page 7: Fast Operating Guide
Fast operating guide FP-BA-e-1610... -
Page 8: Function And Introduction Into Details
1) Turn on power by pressing button. The instrument will start a self checking program. After “SAUTER and model name” is displayed on the screen, it gets into working state (see picture 7). If the screen shows , this means a lack of electricity. - Page 9 1. Upper limit: if the measured value is above the upper limit, the buzzer alarms con- tinuously. 2. Lower limit: if the measured value is below the upper limit, the buzzer alarms once. 3. Machine stop: When the instrument is connected to a test stand, the test stand will stop when the value on the instrument is bigger than the stop value of the test stand.
- Page 10 7. Data: peak and tracking value storage place If typeface is white, this means that it has a storage data If typeface is not white, this means that it has no storage data 8. Zero: press to clean the peak and tracking value 9.
- Page 11 6) Storage interface 1. Peak: max. value during testing 2. Time: total time during testing, unit: seconds 3. Upper and lower limit/sectional area、 pressure. If material pressure parameter is “Yes”, sectional area and intensity are displayed; See picture 11 If material pressure parameter is “No”, upper and lower limit are displayed; see Picture 12.
- Page 12 1. Cursor line: point at the view point of the current curve, move the cursor…line by pressing the button 2. Force: value of curve spot that the cursor line points at 3. Time: time of curve spot that the cursor line points at. Unit: seconds 4.
- Page 13 1. Storage test value In every grid you can put one peak and one track value, every page has 10 grids, Totally there are 7 pages, totally 70 grids to put in 70 peak and 70 track values. means current storage grid The current storage grid can be adjusted by and view data.
-
Page 14: Configuration Needed For Software Installation
Configuration needed for software installation With USB connection to PC, memory, transmission, tracking, testing curve data un- limited by configured software. The configuration is as follows: 1. Hardware condition - CPU: Celeron 1G or over - Memory: 256MB or over - Hardware disc available capacity: over 300MB - Driver: CD-ROM or DVD-ROM 2. - Page 15 FP-BA-e-1610...
- Page 16 2. Connect the force gauge with the PC by using a USB cable 3. Start the force gauge and make it work 4. Software interface introduction is shown (see pic. 19) Interface includes 8 parts according to the whole module (1) Startup menu bar: all the function menu of software (2) Function bar: includes the buttons of data base operation, connect operating, Drew point operating, data save operating and exiting...
- Page 17 Software default data base is the data base file titled “data.rmd” under the root list of installing route. By being connected to testing, it is better to appoint the title of new data base to convenient for future management. (2) Open the test base: open the saved test base (pic. 21) This function is used to exchange and display the data base file between users.
- Page 18 The configured print form editor in this software can go on simple type setting and amending display details. As a general rule, the user can only amend the descriptive content in the test report. (7) Associate files: associate rmd type data base file. (8) Exit system: exit system 2) Set menu: Set menu includes the following commends: (1) Graph setting: set the form property in draw pointing region (pic.
- Page 19 To get more sectional area values, the corresponding sensor parameter has to be changed (pic. 29) (2) Start testing: starts curve pointing (3) Stop testing: stops curve pointing (4) Save test result: saves current curve pointing data 4) Graph menu: Graph menu includes the following commends: (1) Graph save: saves current curve pointing form as Photoshop file.
- Page 20 6) Help menu: Help menu includes the following commends: (1) Company homepage: to open company homepage (2) Animation help: plays the software operation process by flash (3) Help: provides the illustration of usage help (4) About: displays the version number of the software B) Function bar order: Function bar order includes the following commends: opens the original saved data base saves the current test result by a pointed title...
- Page 21 same time. When opening the software, it will call out the last time saved data base file. If there are some rude mistakes with it, you will be warned to choose the next step in prompt box (pic. 31) Now you can choose the corresponding step: 1) Press “Next test base”...
-
Page 22: Rechargeable Battery
After confirming the information, press “Start testing” button in function bar or in test menu of menu bar to carry out draw pointing record. Press “delete test” button to d e- lete the current testing and information. When having finished testing, press “Stop testing”... -
Page 23: Maintenance
Note: Frequent and long-playing charging will shorten life of battery. Please only re-charge when the battery only has one grid left or less than one grid power. This avoids not to charge fully because of too low power. Battery may only be charged fully at least once every three months. 6 Maintenance The force gauge has to be cleaned with a soft cloth. -
Page 24: Declaration Of Conformity
Digital Force Gauge: EMV-Guideline Normatives 89/336EEC EMC EN 61326: 1997+A1:1998+A2:2001+A3:2003 2004/108/EG Signa- Date 25.02.2014 ture Place of issue 72336 Balingen Albert Sauter SAUTER GmbH Manager SAUTER GmbH, Ziegelei 1, D-72336 Balingen, Tel. +49-[0]7433/9933-199 Fax +49-[0]7433/9933-149, E-Mail: info@sauter.eu, Internet: www.sauter.eu FP-BA-e-1610...
Need help?
Do you have a question about the FP Series and is the answer not in the manual?
Questions and answers