Table of Contents
Advertisement
Quick Links
Advertisement
Table of Contents
Troubleshooting

Related Manuals for Zeiss CIRRUS HD-OCT 500

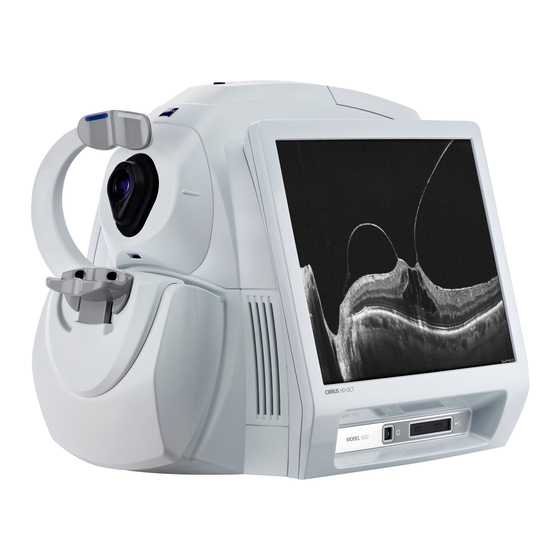
Summary of Contents for Zeiss CIRRUS HD-OCT 500
- Page 1 2660021156446 B2660021156446 B CIRRUS HD-OCT User Manual – Models 500, 5000...
- Page 2 © 2017 Carl Zeiss Meditec, Inc. All rights reserved. Trademarks CIRRUS, AngioPlex, ChamberView, FastTrac, FORUM, GPA, and Live OCT Fundus. are either registered trademarks or trademarks of Carl Zeiss Meditec, Inc. in the United States and/or other countries. Windows, Windows Media, Windows Server, and Microsoft are either registered trademarks or trademarks of Microsoft Corporation in the United States and/or other countries.
-
Page 3: Table Of Contents
1 Safety and Certifications Symbols and Labels ......Warning and Caution Definitions ....Warnings. - Page 4 Software ........Overview ........Licensed Applications.
- Page 5 Daily Tasks ........Start of Day........End of Day.
- Page 6 Center Corneal Scans on the Corneal Vertex ....Anterior Chamber and Cornea External Lenses ... Attaching an External Lens .
- Page 7 Fundus ..........OCT .
- Page 8 viii Advanced Export ........8-31 Guided Progression Analysis .
- Page 9 Straighten Volume Data ........8-66 Transparent Surfaces ........8-67 Reset .
- Page 10 High Definition Images Report (Raster Scan Options) ..10-10 Guided Progression Report Options ....10-11 Summary..........10-12 Latest Scan .
- Page 11 LCD (Monitor) Screen ......12-3 Top Fan Filter........12-3 User Replacement Accessories .
- Page 12 Data Analysis ......... A-10 Results .
- Page 13 xiii B CIRRUS Algorithm Studies Study 1: Retinal Segmentation and Analysis ....Introduction..........Purpose .
- Page 14 Study 2: Repeatability and reproducibility of Wide Angle to Angle and HD Angle scan measurements in subjects with glaucoma, including repeatability, reproducibility, and comparison to Visante Purpose ......... Data Collection.
-
Page 15: Safety And Certifications
1- 1 Symbols and Labels 1 Safety and Certifications Before using the CIRRUS HD-OCT, you must fully understand potential safety hazards. Read the following safety warnings and cautions in their entirety before using the HD-OCT instrument. Additional warnings and cautions are found throughout the instructions for use. -
Page 16: Warning And Caution Definitions
Warnings WARNING: To prevent electric shock, the instrument must be plugged into an earth grounded outlet. Do not remove or disable the ground pin. Only an authorized Zeiss service representative may install the instrument. WARNING: Do not open the instrument covers. (Exception: You may remove the rear cover to access labels and connectors.) Opening the instrument covers could expose you to... -
Page 17: Cautions
CAUTION: Users are not authorized to dismantle (except to remove the rear cover) or modify the CIRRUS HD-OCT hardware. To transport the instrument outside the office, you must consult with a Zeiss service technician. CAUTION: Avoid tipping. Do not use the instrument on an uneven or sloped surface. -
Page 18: Protection Of Patient Health Information
Zeiss. Such actions could result in failure of the table height adjustment mechanism, instability of the table, tipping and damage to the instrument, and injury to operator and patient. -
Page 19: Cirrus Hd-Oct User Manual 2660021169012 Rev. A
Product Safety WARNING: To prevent electric shock, the instrument must be plugged into an earth grounded outlet. Do not remove or disable the ground pin. Only an authorized Zeiss service representative may install the instrument. WARNING: Do not open the instrument covers. Opening the instrument covers could expose you to electrical and optical hazards. - Page 20 Zeiss. Such actions could result in failure of the table height adjustment mechanism, instability of the table, tipping and damage to the instrument, and injury to operator and patient.
- Page 21 CAUTION: We strongly recommend you use peripheral devices supplied or approved by Zeiss, when available, because they will have been tested to work with the instrument. If you do use a peripheral device that conforms with the requirements in this section but is not supplied by Zeiss, do not install any unapproved third party software on the instrument.
- Page 22 CAUTION: We strongly recommend you use peripheral devices supplied or approved by Zeiss, when available, because they will have been tested to work with the instrument. If you do use a peripheral device that conforms with the requirements in this section but is not supplied by Zeiss, do not install any unapproved third party software on the instrument.
-
Page 23: Record And Data Safety
The following activities are prohibited using the CIRRUS HD-OCT instrument. CAUTION: Attempting to perform these prohibited activities may void your CIRRUS HD-OCT warranty and may result in damage to your CIRRUS HD-OCT system. Zeiss is not responsible for software upgrades or repairs necessitated by the attempted performance of the following prohibited activities. -
Page 24: Networking Guidelines
NOTE: Users are responsible for network setup and maintenance, including installation and configuration of all necessary hardware and software. Zeiss Technical Support is limited to testing network connectivity of the CIRRUS HD-OCT. Technical Support cannot troubleshoot or repair problems with network connectivity. - Page 25 1- 11 Electromagnetic Compatibility (EMC) Guidance and manufacturer’s declaration – electromagnetic emissions The CIRRUS HD-OCT is intended for use in the electromagnetic environment specified below. The customer or user of the CIRRUS HD-OCT should assure that it is used in such an environment. Emissions Test Compliance Electromagnetic environment –...
-
Page 26: Rohs Compliance
1- 12 RoHS Compliance Guidance and manufacturer’s declaration – electromagnetic immunity The CIRRUS HD-OCT is intended for use in the electromagnetic environment specified below. The customer or user of the CIRRUS HD-OCT should assure that it is used in such an environment. Immunity Test IEC 60601 test level Compliance level... -
Page 27: Introduction
Intended Use 2 Introduction Intended Use The CIRRUS™ HD-OCT with Retinal Nerve Fiber Layer (RNFL), Macular, Optic Nerve Head, Ganglion Cell and Asian Normative Databases is indicated for in-vivo viewing, axial cross-sectional, and three-dimensional imaging and measurement of anterior and posterior ocular structures. -
Page 28: Intended Operator Profile
Intended Operator Profile Intended Operator Profile CIRRUS operators are clinicians or technicians with professional training or experience in the use of ophthalmic imaging equipment. Specific assumptions regarding the profiles of individuals performing instrument operation are given below. Demographic An adult with one of the following qualifications: •... -
Page 29: Data Analyst Profile
Installation and Setup If you have purchased a new CIRRUS HD-OCT instrument, it will arrive with licensed software fully installed. Your Zeiss Service Representative will arrive shortly thereafter, and CIRRUS HD-OCT User Manual 2660021169012 Rev. A 2017-12... -
Page 30: User Documentation
The User Manual is delivered in PDF format, but you may request a hardcopy manual at any time. Training is offered by Zeiss in the use of CIRRUS. Such training does include training in diagnostic interpretation of the data and analyses. -
Page 31: Instruction Conventions
User Documentation • Data acquisition and acceptance • Analysis and interpretation of CIRRUS data A set of normative data studies is provided for comparison during patient assessment. In addition, instructions and information are provided to ensure that data is safely managed and that the system is properly maintained. - Page 32 User Documentation 2660021169012 Rev. A 2017-12 CIRRUS HD-OCT User Manual...
-
Page 33: System Overview
Hardware 3 System Overview Hardware As shown in Figure 3-1, the CIRRUS HD-OCT system is delivered as a single unit, except for keyboard, mouse, and an optional height–adjustable worktable. Motorized Patient Alignment Unit Integrated Video Monitor 11 Keyboard Dual Chinrest with Automatic Right/Left Sensors Connectors (USB, network, etc.) and labels under rear cover 12 System Power Switch Imaging Aperture... -
Page 34: Power Up
The software will start automatically, and run a Data Validation Check which, once passed, will allow you to begin setting up your instrument, by pressing Continue. Should the software fail for any reason, contact Zeiss Customer Service immediately. Power Down You can power down the system either through hardware or through software. -
Page 35: Software
• HD Angle • HD Cornea • Pachymetry • Wide Angle-to-Angle To add a license to your CIRRUS HD-OCT instrument, contact your Zeiss Sales CIRRUS HD-OCT Installation Guide Representative for a license key. See the for information on how to unlock licenses. - Page 36 Software • Acquire Screen – Described in connection with each of the scans available with your software license. See Chapter 6 "Acquiring Scans" for detailed descriptions. • Quality Check Screen – After the completion of any scan, the Quality Check Screen will appear, allowing the clinician who made the scan, to review it for quality.
-
Page 37: Toolbar Options
Software The Toolbar and Navigation Bar options are discussed below. The main Working portion of the screen will be described as they appear in the discussion of software functionality in the chapters which follow. cáÖìêÉ=PJR=^ää=`foorp=ëçÑíï~êÉ=ëÅêÉÉåë=~êÉ=ÅçãéêáëÉÇ=çÑ=íÜÉ=qççäÄ~ê=~í=íÜÉ=íçéI=íÜÉ=ã~áå=tçêâ= éçêíáçå=çÑ=íÜÉ=ëÅêÉÉå=áå=íÜÉ=ÅÉåíÉê=EïÜáÅÜ=ÅÜ~åÖÉë=ÇÉéÉåÇáåÖ=çå=íÜÉ=ÑìåÅíáçå~äáíó=çÑ=íÜÉ= ëÅêÉÉåFI=~åÇ=íÜÉ=k~îáÖ~íáçå=_~ê=~äçåÖ=íÜÉ=ÄçííçãK Toolbar Options Each of the main CIRRUS screens has a series of associated menus and options that pertain to the way in which the screen is used. - Page 38 Software The table below identifies and describes the items in each menu, and indicates when each item is enabled. Note the keyboard shortcuts to the right of applicable menu items. Menu Items and Descriptions Enabled in Mode • Clear Archived Exams: Prompts you to clear exams when ID Patient mode disc space is low.
- Page 39 Software Menu Items and Descriptions Enabled in Mode • Preferences...: Archive/Synchronize: During instrument ID Patient mode startup or shutdown, alerts the user to archive exams. Selecting DICOM Archive, user may disable Auto–Query of Modality Worklist. Display Options allows change to default setting.
- Page 40 Software Menu Items and Descriptions Enabled in Mode • Live OCT Center Lines: Toggles the display of a vertical Acquire mode “centering” line on OCT images. The default is checked (center lines visible). • Auto Repeat: Automatically adjusts the ocular lens and Acquire mode chinrest to the previous settings for the same patient, eye, and acquisition function.
-
Page 41: Navigation Bar
Software Menu Items and Descriptions Enabled in Mode Help • Keyboard Mouse Shortcuts...: Displays a categorized Always listing of keyboard shortcut keys and mouse functions. • On–Line Manual: Opens the CIRRUS User Manual PDF. Always • License Registration...: Enables you to register a license Always through the License Registration Utility that appears when you select a license type. -
Page 42: Components Of Status
3-10 Software • Yellow means warning: The instrument is operational but a problem or set of problems exist. • Red means critical: One or more serious problems exists that restricts use of the instrument. Components of Status The following components contribute to the overall status. NOTE: Mouse over the status indicator and popup text will explain the current status in terms of the status components below. - Page 43 3-11 Software DICOM Connectivity Status • Green: DICOM functions, if DICOM was selected during installation, are normal. NOTE: On rare occasions, the DICOM features may not actually be available even though the Status Indicator is green, indicating that you are connected to DICOM. If this occurs, CIRRUS HD-OCT Models 500, check the DICOM Gateway Configuration IP address (see the 5000 Installation Guide...
- Page 44 3-12 Software 2660021169012 Rev. A 2017-12 CIRRUS HD-OCT User Manual...
-
Page 45: System Administration
Institution Setup 4 System Administration The person assigned as the Administrator for the CZMI network in your clinic will oversee the administrative functions of the software. These functions can be broken down into the following parts: • Institution Setup • Station Setup •... -
Page 46: Station Setup
Station Setup 3. Add the value of the Issuer of Patient ID in this field. The Issuer of Patient ID field denotes assigning authority of patient IDs entered at a particular site or practice. As a recommendation, it should be set to the same value on every instrument in the practice and to the same value as in the leading patient information system, if applicable. -
Page 47: Staff Accounts
Staff Accounts 2. In the Station Name and AE Title fields, type in the desired information. The remainder of the information is already set. NOTE: The AE Title is originally determined during setup of the DICOM Gateway which is discussed in Chapter 11 "Data Management". -
Page 48: Edit Staff Records
Category Registration and Maintenance Edit Staff Records To edit medical staff records, follow these steps: 1. In the Staff Registration dialog, select a staff record and click Edit. The Staff Edit dialog opens. It resembles Figure 4-3 above except that the name of the selected staff appears in the title bar. -
Page 49: Edit Categories
Category Registration and Maintenance cáÖìêÉ=QJR==`~íÉÖçêó=oÉÖáëíê~íáçå=aá~äçÖ All categories already registered appear in the list, sorted alphabetically. None is selected by default. 2. Select New. The Category Edit dialog will appear as shown in Figure 4-6. cáÖìêÉ=QJS==`~íÉÖçêó=bÇáí=aá~äçÖ 3. In the Name field, type in a name for the new category, up to 64 characters, including spaces. -
Page 50: Archive Setup And Selection
Archive Setup and Selection Archive Setup and Selection Operators as well as Admin’s may set up and specify archives. However, it is recommended that the Admin oversee archive setup, in order to ensure that patient data is kept cohesive and transparent within the institutional environment. NOTE: You cannot set up an archive from a Review Station in instrument mode. - Page 51 Archive Setup and Selection cáÖìêÉ=QJU=kÉï=^êÅÜáîÉ=içÅ~íáçå In the New Archive Location, your label will be made up of made up of two parts. The first part, shown at the top of the dialog box, is generated automatically and cannot be changed. It is composed of the model number, serial number and archive sequence number.
-
Page 52: Change The Current Archive
Set Preferences Change The Current Archive 1. From the Toolbar, select Records > Archive Management. The Archive Registration dialog box appears (see Figure 4-7). 2. Select the archive of interest. 3. Check Mark as Current. 4. Close. Set Preferences Archive/Synchronize CIRRUS HD-OCT gives you a way to modify the default archive behavior for both Native and DICOM Archive modes. -
Page 53: Normative Data Settings
Set Preferences Normative Data Settings If you have the Asian Normative Database License, the Normative Data Settings tab is displayed in the Preferences dialog. cáÖìêÉ=QJNN==mêÉÑÉêÉåÅÉë=[=kçêã~íáîÉ=a~í~=pÉííáåÖë The normative database selected from the Normative Data menu becomes the default setting used for image normative data analysis for all patients on the system, unless a different normative database is specified in a patient’s record (see "Add New Patients"... -
Page 54: Display Options
4-10 Set Preferences only performed using Records > DICOM Retrieve. This is the option available under this tab for Native Mode. In Native Mode, this dialog appears as shown in Figure 4-13. cáÖìêÉ=QJNP=qÜÉ=af`lj=^êÅÜáîÉ=í~Ä=áå=k~íáîÉ=jçÇÉ Purge Archived Data for Current Patient after Finishing Analysis: With data already saved to the DICOM Archive, this option automatically deletes current patient data from the local database when you click Finish on the Analysis screen. -
Page 55: Ipv4 / Ipv6
4-11 Set Preferences cáÖìêÉ=QJNQ==mêÉÑÉêÉåÅÉë=[=aáëéä~ó=léíáçåë IPv4 / IPv6 CIRRUS instruments work on networks that support Internet Protocol version 6, as well as version 4. CIRRUS Review Software works only on IPv4. This option allows you to select the desired Internet Protocol version, as shown in Figure 4-15. -
Page 56: User Login/Logout
4-12 User Login/Logout cáÖìêÉ=QJNS==mêÉÑÉêÉåÅÉë=[=mêÉîÉåíáîÉ=j~áåíÉå~åÅÉK=låäó=íÜÉ=wÉáëë=cáÉäÇ=pÉêîáÅÉ=qÉÅÜåáÅá~å=Å~å=ëÉí= íÜÉ=ã~áåíÉå~åÅÉ=Ç~íÉK User Login/Logout User Login The User Login dialog appears when the instrument passes the system check upon startup, and each time a user logs out of the system software. cáÖìêÉ=QJNT==rëÉê=içÖáå=aá~äçÖ Select a user name from the drop–down list and enter the corresponding password to access the system software. -
Page 57: User Logout
4-13 User Login/Logout User Logout Logout Locks the System To prevent unauthorized access, you can lock the CIRRUS HD-OCT software at any time by selecting Logout at upper right. When you lock the CIRRUS HD-OCT, it reverts to the User Login dialog, enabling login again. - Page 58 4-14 User Login/Logout 2660021169012 Rev. A 2017-12 CIRRUS HD-OCT User Manual...
-
Page 59: Clinical Workflow
Or if a Database, Installation Files, or Instrument failure occurs, you will not be able to use the instrument. Contact your Zeiss representative. CIRRUS HD-OCT User Manual... -
Page 60: End Of Day
Patient Records End of Day Archive Saved Exams On the ID Patient screen, on the Menu bar, click Records, and then click Archive Now and Shut Down the System 1. On the ID Patient screen, next to the Menu bar, click Logout. 2. - Page 61 Patient Records cáÖìêÉ=RJN=pÉäÉÅí=íÜÉ=“^ÇÇ=kÉï=m~íáÉåí=q~ÄÒ=áå=íÜÉ=m~íáÉåí=ëÅêÉÉåK=pÉäÉÅí=jçêÉ=íç=ïêáíÉ=ÅçããÉåíëK= cêçã=íÜáë=äçÅ~íáçå=óçì=Å~å=~äëç=~ÅÅÉëë=íÜÉ=^ÇÇLoÉãçîÉ=`~íÉÖçêáÉë=Çá~äçÖK=qÜáë=ÅçìäÇ=ÄÉ=ìëÉÑìä=áå= ëáíì~íáçåë=áå=ïÜáÅÜ=~=é~êíáÅìä~ê=é~íáÉåí=Ñ~ääë=áåíç=~=Å~íÉÖçêó=åçí=óÉí=Éëí~ÄäáëÜÉÇK= 4. Click Generate ID to have the system automatically create a unique ID for this patient. CIRRUS generated ID’s all start with the prefix “CZMI”. If your institution has its own Patient ID protocol, type that in here. A Patient ID is required for all patient files. No patient data can be saved without a patient ID.
-
Page 62: Find Existing Patients
Patient Records cáÖìêÉ=RJP=qÜÉ=m~íáÉåí=bÇáí=Çá~äçÖ=~ééÉ~êë=ïÜÉå=óçì=ÅäáÅâ=jçêÉ=Ñêçã=íÜÉ=^ÇÇ=kÉï=m~íáÉåí=Çá~äçÖ 8. Click Add to add a category to the patient’s record. Remove to remove it. 9. Click Save. The new patient information is saved to the database and to the list of today’s patients. If data is missing from required fields, the Save button will not be enabled. -
Page 63: Advanced Search
Patient Records cáÖìêÉ=RJQ==fa=m~íáÉåí=ëÅêÉÉåÔaÉÑ~ìäí=q~ÄW=cáåÇ=bñáëíáåÖ=m~íáÉåí To search a database (or DICOM archive) for a patient using additional criteria: 1. Select the Find Existing Patient tab from the Patient screen ("Basic Screens" on page 3-3). The ID Patient screen will appear as shown in Figure 5-4. - Page 64 Patient Records Zeiss Carl cáÖìêÉ=RJR=^Çî~åÅÉÇ=pÉ~êÅÜ=aá~äçÖK=fÑ=óçì=Ü~îÉ=êÉÖáëíÉêÉÇ=é~íáÉåí=Å~íÉÖçêáÉëI=íÜÉ=`~íÉÖçêó= ÇêçéJÇçïå=äáëí=ïáää=~ääçï=óçì=íç=óçìê=ìëÉêÓëéÉÅáÑáÉÇ=ÅêáíÉêá~=Ñçê=íÜÉ=é~íáÉåí=ëÉ~êÅÜK 1. Using the available fields, enter or select search parameters and then click Search. "Data Management" on page 11-1 for information on the Obscured ID field. NOTE: The following parameters are disabled in Advanced Search when in DICOM Archive mode: •...
-
Page 65: Add Or Remove Categories For Existing Patient Records
Patient Records Search parameters you type in are not case–sensitive, except for Patient ID and Issuer of Patient ID. The Search Preview dialog (Figure 5-6) returns all matching patients, sorted alphabetically by last name. cáÖìêÉ=RJS==pÉ~êÅÜ=mêÉîáÉï=aá~äçÖ 2. In the Search Preview dialog, select the patients of interest. •... -
Page 66: View Today's Patients
Patient Records cáÖìêÉ=RJT==^ÇÇLoÉãçîÉ=`~íÉÖçêáÉë=q~Ä=çÑ=íÜÉ=m~íáÉåí=bÇáí=aá~äçÖ 4. Add the categories of interest to the patient record or Remove them. 5. Click Save. View Today’s Patients To select patients who have either been scheduled to be scanned, or have been scanned today (DICOM mode only), select the View Today’s Patients (Figure 5-8) tab. -
Page 67: How Today's Patients List Is Populated
Patient Records How Today’s Patients List Is Populated Today’s patients list is populated automatically with the following: • New patients added today on local CIRRUS instrument. • Patients with new exams completed today. If in DICOM Archive mode, and FORUM is being used as the DICOM Archive, this includes exams completed today from all CIRRUS instruments connected to your network. -
Page 68: Patient Preparation
5-10 Patient Preparation cáÖìêÉ=RJNM==réÇ~íáåÖ=m~íáÉåí=a~í~ Patient Preparation In preparation for all patient visits, first clean Instrument Surfaces and adjust table height. 1. Wipe the chin rest and forehead rest with an alcohol pad, and allow the assembly to dry. 2. Adjust the table so the embossed line on the ocular cover is approximately at the same height as the patient’s eye. -
Page 69: Optional Eyelid Elevation
5-11 Patient Preparation the internal lens into position (you may hear a click while this occurs) and dim the illumination to avoid pupillary constriction by default. The patient’s exam experience with the CIRRUS HD-OCT is normally brief and comfortable. An experienced operator can acquire several scans from each eye in the space of 5–7 minutes. -
Page 70: Patient Instructions
5-12 Patient Preparation CAUTION: The operator should check that the patient is not holding on to the instrument before or during tests. Although movement of the motorized chinrest is slow, giving plenty of warning for patients to remove their fingers, there is potential for fingers to be squeezed and possibly injured if left in the area shown below. - Page 71 5-13 Patient Preparation You will begin to see an image once the patient is positioned in the chinrest. The image may be poorly resolved until properly focused (see "Acquiring Scans" on page 6-1). Alignment progresses through a series of steps, although the order in which many of the steps are performed (and whether they are repeated) will vary depending on the cooperativeness of the patient (e.g., whether patients can fixate steadily at a requested location, opacity of their eye, etc.).
- Page 72 5-14 Patient Preparation 2660021169012 Rev. A 2017-12 CIRRUS HD-OCT User Manual...
-
Page 73: Acquiring Scans
Overview of Scan Types 6 Acquiring Scans Overview of Scan Types CIRRUS HD-OCT software provides a large set of scan acquisition options that provide the basis for in depth analysis of ocular features and possible abnormalities. These are shown in Table 6-1 and discussed in the sections of this chapter which follow. Anterior Segment Scan Acquisition Anterior Chamber Scan... -
Page 74: Posterior Segment Scans
Posterior Segment Scans Posterior Segment Scans CIRRUS OCT Angiography CIRRUS OCT Angiography is a method that uses differences between B-scans to generate contrast associated with motion, in particular the motion of blood through the vasculature. CIRRUS OCT Angiography can be subject to several of the same artifacts seen in OCT structural imaging, and may also have some artifacts particular to this type of imaging. -
Page 75: Macula
Posterior Segment Scans Macula The scans used for viewing the macula are: Macular Cube 200x200 and Macular Cube 512x128. Macular Cube 200x200 This scan generates a cube of data through a 6 mm square grid by acquiring a series of 200 horizontal scan lines each composed of 200 A-scans and a central horizontal HD B-scan. -
Page 76: Integration
Posterior Segment Scans the scan pattern. In addition, the scan pattern overlay consists of concentric rings to assist in the alignment of the optic disc (see Figure 6-17). Optic Disc Cube 200x200 Integration For an integrated view, both the Macular Cube scan and Optic Disc Cube scan are used. Macular and Optic Disc Cube Scans For an integrated view, the Macular Cube (512x128 mm or 200x200 mm) and Optic Disc Cube (200x200 mm) scans are generated by combining a series of A-scans taken at varying... -
Page 77: Guidelines For Raster Scans
If you do not have this feature and want to purchase it, contact Zeiss. In the U.S.A., call 1-877-486-7473; outside the U.S.A., contact your local Zeiss distributor. -
Page 78: Anterior Segment Scans
Anterior Segment Scans Drag blue bar left or right to adjust line length Drag rotation icon to adjust the angle of rotation Drag blue bar up or down to adjust line spacing cáÖìêÉ=SJN==ea=R=iáåÉ=o~ëíÉê=pÅ~å=m~ííÉêå=lå=^ÅèìáêÉ=cìåÇìë=fã~ÖÉ Enhanced Depth Imaging (EDI) Enhanced Depth Imaging (EDI) is an optional mode for single and multi–line raster scans that improves visibility of structures at the bottom of B-scans. -
Page 79: Scan Acquisition Controls
Anterior Segment Scans Scan Acquisition Controls Not all posterior scan acquisition controls are available for anterior segment scans. For anterior segment scans: • There is no fundus image, and therefore the Auto Focus button and Z controls (left– right Focus arrows) are not displayed. However, the Focus bar is still displayed, showing the last focus for the patient. -
Page 80: Attaching An External Lens
Anterior Segment Scans • Wide Angle-to-Angle Scan Cornea External Lens: • HD Cornea Scan • Pachymetry scan Attaching an External Lens Anterior Chamber Lens Cornea Lens Lens symbol Lens symbol English lens English lens label label To attach an external lens and select a scan 1. -
Page 81: Guidelines For Anterior Chamber Scan Acquisition
Anterior Segment Scans horizontally. The scan is adjustable from –89 to 90 degrees, though rotation may reduce the field The 5.8 mm scan depth is achieved by allowing the source and mirror images to overlap. Note that in the overlap region (indicated by blue overlay), source image detail may be compromised. -
Page 82: Anterior Segment Cube Scan
6-10 Anterior Segment Scans • Click the center of the pupil and use the screen X-Y and Z controls or keyboard arrow keys and mouse scroll wheel to center the scan on the corneal vertex with the anterior chamber visible in the B-scan viewport. A strong vertical central reflection line on the B-scan indicates the scan is centered on the corneal vertex. -
Page 83: Guidelines For Anterior Segment Cube 512X128 Scan Acquisition
6-11 Anterior Segment Scans 1 Grey bar for aligning OCT scan cáÖìêÉ=SJR==^ÅèìáêÉ=ëÅêÉÉåI=^åíÉêáçê=pÉÖãÉåí=`ìÄÉ=RNOñNOU Guidelines for Anterior Segment Cube 512x128 Scan Acquisition • Instruct the patient to fixate on the center of the fixation target. • Use the screen X, Y and Z controls or keyboard arrow keys and mouse scroll wheel to center the scan on the corneal vertex with the anterior chamber visible in the B-scan viewport.to center the scan between the gray bars on either side of the B-scan display, as shown in... -
Page 84: Hd Angle Scan
6-12 Anterior Segment Scans cáÖìêÉ=SJS==píêçåÖ=êÉÑäÉÅíáçå=Ñêçã=íÜÉ=~åíÉêáçê=ÅçêåÉ~ NOTE: For the Anterior Segment Cube 512x128 and Anterior Segment 5 Line Raster scans, the instrument focuses the OCT beam onto the anterior segment. The OCT beam scans in an arc to allow the curved cornea to better fit into the 2mm scan depth. This will cause the cornea to appear flat in the display during alignment and acquisition. -
Page 85: Guidelines For Hd Angle Scan Acquisition
6-13 Anterior Segment Scans cáÖìêÉ=SJT==^ÅèìáêÉ=ëÅêÉÉåI=ea=^åÖäÉ Guidelines for HD Angle Scan Acquisition • For an HD Angle scan, you may need to use the external fixation device if the patient has difficulty fixating without the internal fixation target, which is not in view when the limbus of the scan eye is optimally exposed. -
Page 86: Hd Cornea Scan
6-14 Anterior Segment Scans HD Cornea Scan This (anterior segment) scan generates a single high–definition scan with a depth of 2.0 mm that has a wider field of view than the Anterior Segment 5 Line Raster. The scan uses 20 B-scans, each composed of 1024 A scans. The scan is 9.0 mm in length when oriented horizontally and has a depth of 2.0 mm. -
Page 87: Wide Angle-To-Angle Scan
6-15 Anterior Segment Scans • Click the center of the pupil and use the X-Y and Z controls to center the scan on the corneal vertex, positioning the anterior corneal surface to the upper red line in the B-scan viewport as shown in Figure 6-8. -
Page 88: Guidelines For Wide Angle-To-Angle Acquisition
6-16 Anterior Segment Scans Guidelines for Wide Angle-to-Angle Acquisition • Attach the external Anterior Chamber lens to the instrument lens mount, see "Anterior Chamber and Cornea External Lenses" on page 6-7. • Instruct the patient to fixate on the center of the fixation target even though it may not appear to be in focus. -
Page 89: Guidelines For Pachymetry Scan Acquisition
6-17 Anterior Segment Scans cáÖìêÉ=SJNM==^ÅèìáêÉ=ëÅêÉÉåI=m~ÅÜóãÉíêó Guidelines for Pachymetry Scan Acquisition The Pachymetry scan is similar to the HD Cornea scan, but you must align two scans rather than one. • Attach the external Cornea lens to the instrument lens mount, see "Anterior Chamber and Cornea External Lenses"... -
Page 90: Anterior Segment 5-Line Raster Scan
6-18 Anterior Segment Scans • The horizontal B-scan is correctly positioned when it fits between the two red lines on the viewport with the anterior corneal surface aligned with the upper red line, as shown in Figure 6-10. NOTE: Minimize eyelash and eye interference as much as possible. Anterior Segment 5–Line Raster Scan This scan can be positioned anywhere on the Iris image and has an adjustable line length of 3, 6, or 9 mm, an adjustable angle of –89 to 90 degree, and adjustable spacing from 0... -
Page 91: Guidelines For Anterior Segment 5 Line Raster Scan Cornea Acquisition
6-19 Acquire Screen and Controls Guidelines for Anterior Segment 5 Line Raster Scan Cornea Acquisition • Instruct the patient to fixate on the center of the fixation target. • Use the screen X-Y and Z controls or keyboard arrow keys and mouse scroll wheel to center the scan between the gray bars on either side of the B-scan display, as shown Figure 6-11. -
Page 92: Acquire Screen Toolbar
6-20 Acquire Screen and Controls The Scan Screen for Montage Angio scans, as shown in the Figure 6-13, consists of 6 main portions and is discussed in the Montage Angio scan areas of this chapter. Toolbar Available Scans Scan Position Montage Iris Live Scan... -
Page 93: Scan Organizer
6-21 Acquire Screen and Controls cáÖìêÉ=SJNQ==^î~áä~ÄäÉ=pÅ~åëK=kçíÉ=íÜÉ=äçÅ~íáçå=çÑ=íÜÉ=ëäáÇÉê=Ñçê=É~ÅÜ=ÉóÉ=Ela=~åÇ=lpFK=^î~áä~ÄäÉ= ëÅ~åë=ã~ó=åçí=~ééÉ~ê=~í=Ñáêëí=E~ë=ëÜçïå=çå=íÜÉ=äÉÑí=ElaF=éçêíáçå=çÑ=íÜÉ=äáëíFK=eçïÉîÉêI= Äó=ãçîáåÖ=íÜÉ=ëäáÇÉê=Ççïå=E~ë=ëÜçïå=çå=íÜÉ=êáÖÜí=ElpF=éçêíáçå=çÑ=íÜÉ=äáëíFI=~ää=ëÅ~åë=Å~å= ÄÉ=ÑçìåÇK=qÜáë=äáëí=Å~å=ÄÉ=ëáãéäáÑáÉÇ=Äó=ìëáåÖ=íÜÉ=pÅ~å=lêÖ~åáòÉê=E"Scan Organizer" on page 6-21FK Selecting the scan type populates the Acquire screen with the correct image layout. NOTE: Only the scans which your institution has licensed will be shown in the Available Scans list. -
Page 94: Iris Viewport
6-22 Acquire Screen and Controls Iris Viewport The Iris Viewport lies in the upper left quadrant of the main Acquire screen Viewport (Figure 6-12). During scanning the iris and pupil of the current patient is shown in real time. Within this viewport you can: •... -
Page 95: 8X8 Mm Montage Angio Scan
6-23 Acquire Screen and Controls The initial scan location for this type of scan is Superior Nasal (SN), and the scan progression and fixation target automatically flows in the following sequence: • Superior (S) • Superior Temporal (ST) • Inferior Temporal (IT) •... -
Page 96: Fundus Viewport
6-24 Acquire Screen and Controls Fundus Viewport The Fundus Viewport lies in the lower left quadrant of the main Acquire screen Viewport as shown in Figure 6-12, and shows a live fundus image from the line scanning ophthalmoscope (LSO). The Fundus Viewport is not available for Anterior scans. As with the Iris Viewport, there are a number of options available for optimizing the patient scan: •... - Page 97 6-25 Acquire Screen and Controls centered vertically–”Z” monitored–and stops the tracking progress when some or all of the tissue is outside the B-scan window. In some patients, it may be difficult to align the tissue within the B-scan entirely, such as those with high myopia or other kinds of atypical anatomies;...
- Page 98 6-26 Acquire Screen and Controls For Optic Disc Cube 200x200 scans, it is not necessary to precisely center the optic disc in the scan image because the analysis algorithm can correctly place the Calculation Circle around the optic disc even when it is not well centered. Though it is sufficient to keep the optic disc within the outer dashed circle, it is best to center the scan on the optic disc as En Face well as possible.
-
Page 99: Mouse Controls
6-27 Acquire Screen and Controls retinal tracking system tracks eye movement and enables tracking of the current scan to the position of a prior scan. The FastTrac retinal tracking system on CIRRUS HD-OCT uses multiple channels of concurrent imaging to monitor the motion of the eye in real–time. -
Page 100: General Acquire Procedure
6-28 General Acquire Procedure • Enhance Live Scan allows you to adjust the polarization (X,Y–offsets) of posterior segment live scans. Associated up and down arrow buttons enable you to adjust each manually. NOTE: HD Angle scans are not aligned to the corneal vertex. NOTE: If a button or menu option does not appear on the Acquisition screen for your current scan selection then that function is not available for the current scan. - Page 101 6-29 General Acquire Procedure 9. Adjust the region of the iris visible in the Iris Viewport. Typically, make coarse adjustments using the X-Y controls (that move the chinrest) as needed until the pupil is visible. 10.Focus the iris image using the controls to the right of the viewport. For focusing, primarily use the Z controls.
- Page 102 6-30 General Acquire Procedure cáÖìêÉ=SJOM==oÉéÉ~í=pÅ~å=aá~äçÖ The Repeat Scan dialog lists all previous scans in the same scan type category for this patient by exam date and eye and shows the fundus image for the scan you select. This is especially useful when a scan had been captured away from the central fixa- tion area or if a patient had been scanned previously with a Macular Cube 200x200 scan but now will be scanned using the Macular Cube 512x128 scan.
-
Page 103: Set Up For Maximum Image Quality
6-31 General Acquire Procedure indicating completion, and the next position in the visual representation sequence is now selected. Repeat the Capture process again up to the maximum number of scans you want (6 scans possible for 6x6 mm and 5 scans possible for 8x8 mm). You can skip scans by selecting clicking on an other retinal scan position. -
Page 104: For All Scans
6-32 Tracking and Repeat Scans • The OCT B-scan should be flattened to fit into all acquisition windows horizontally, avoiding top of the window. • A tilted retina may be corrected for by moving the pupil alignment off–center to allow for a more level OCT scan. -
Page 105: Fasttrac
6-33 Tracking and Repeat Scans When the prior scan is found, its scan setup parameters are used, and a Prior Scan link is created (showing the eye, and exam date and time). Auto Repeat can aid your workflow in the following situations: •... - Page 106 6-34 Tracking and Repeat Scans cáÖìêÉ=SJON=aìêáåÖ=c~ëíqê~Å=ëÅ~ååáåÖI=íÜÉêÉ=áë=~=ÄçêÇÉê=~êçìåÇ=íÜÉ=`~éíìêÉ=Äìííçå=ïÜáÅÜ=íìêåë=Ñêçã= êÉÇ=íç=ÖêÉÉå=ïÜÉå=íÜÉ=ëÅ~å=Å~å=ÄÉ=éÉêÑçêãÉÇ=ïáíÜ=c~ëíqê~ÅK= Three buttons are located beneath the Capture button. When FastTrac is turned on, the button on the left is green . Clicking this button toggles FastTrac on and off for the current scan. The button turns gray when tracking is off. Clicking the button in the middle provides information on how to ensure the scan can be performed with FastTrac.
- Page 107 6-35 Tracking and Repeat Scans 4. To achieve uniform illumination, ensure the scan beam is aimed through or near the center of the pupil and the iris and pupil are in focus. Corneal opacities may be minimized by realignment of the pupil. This can be assessed and adjusted in the iris camera viewport.
-
Page 108: Troubleshooting Fasttrac
6-36 Tracking and Repeat Scans cáÖìêÉ=SJOO==c~ëíqê~Å=pÅ~å=áå=mêçÖêÉëë Troubleshooting FastTrac Indicator Potential Problem What you should do OCT image The OCT image is not centered Use the up and down arrows (or centered properly and the scan is too high or mouse wheel) to center the scan. too low in the window. - Page 109 6-37 Tracking and Repeat Scans cáÖìêÉ=SJOP==_JëÅ~å=qçç=eáÖÜ=çå=ëÅêÉÉå In the example above, the B-scan is too high on the screen. If this occurs, use the up and down arrows next to the scan window or the mouse wheel to center the scan. In this case (Figure 6-24), because light is not passing directly through the center of the...
- Page 110 6-38 Tracking and Repeat Scans 2660021169012 Rev. A 2017-12 CIRRUS HD-OCT User Manual...
-
Page 111: Scan Quality Check
Overview 7 Scan Quality Check Overview Once data acquisition is complete, scans must be reviewed for acceptance and saved prior to being released for analysis. The Scan Quality Check Screen appears automatically, upon completion of data acquisition. The screen is partitioned exactly like the scan acquisition screen for the selected scan type, with the exception that the data on the right is scanned data (as opposed to live data). -
Page 112: Overview
Overview acquired scan and you will see a gray circular redo arrow. Click again to select for a redo, and then the arrow will turn green. 7-2) 1 Iris image 2 Fundus image Red X: Indicates that this acquired scan was unable to be montaged. -
Page 113: Quality Check Tools
Quality Check Tools All scans should be carefully reviewed and accepted only if the quality of the scans fulfills the requirements of the analyses for which the data was required. Tools are provided that allow you to enhance the images, where feasible. These tools and the criteria for acceptance are described in the following sections. - Page 114 Quality Check Tools Drag slice navigators to change current slices Blue line and slice number indicate current fast B-scan (X slice) seen in top scan viewport Magenta line and slice number indicate current slow B-scan (Y slice) seen in middle scan viewport cáÖìêÉ=TJP==cìåÇìë=fã~ÖÉ=ïáíÜ=lîÉêä~ó=áå=oÉîáÉï=ëÅêÉÉå...
-
Page 115: Criteria For Image Acceptance
Criteria for Image Acceptance Criteria for Image Acceptance During scan review, use the following criteria to ensure that an image you have captured is acceptable. Fundus • The focus should be sharp and clear, preferably with good visibility of the branching blood vessels. -
Page 116: Advanced Rpe Analysis Acceptance Criteria
Criteria for Image Acceptance OCT fundus image banding examples (A and B) below. As long as there are no saccades, scans with OCT fundus images like these should be acceptable for analysis and the operator is advised to save them. Example A: OCT Fundus image banding Example B: OCT Fundus image banding Advanced RPE Analysis Acceptance Criteria... -
Page 117: Cirrus Oct Angiography Acceptance Criteria
Criteria for Image Acceptance CIRRUS OCT Angiography Acceptance Criteria When reviewing CIRRUS OCT Angiography Scans for acceptability, the following should be considered: • Signal Quality • Decorrelation Tails • Segmentation Errors Each of these is discussed in the sections which follow. Signal Quality CIRRUS OCT Angiography is more sensitive to signal quality than structural OCT imaging. -
Page 118: Decorrelation Tails
Criteria for Image Acceptance cáÖìêÉ=TJR=oÉíáå~ä=Éå=Ñ~ÅÉ=áã~ÖÉ=E^F=~åÇ=Éå=Ñ~ÅÉ=ëíêìÅíìê~ä=áã~ÖÉ=E_F=~åÇ=_JëÅ~å=E`F=Ñêçã=~å= ^åÖáçÖê~éÜó=SñS=ëÅ~åK=få=íÜáë=Éñ~ãéäÉI=íÜÉ=ëÜ~Ççï=EÄäìÉ=~êêçïF=áë=Å~ìëÉÇ=Äó=~=Ñäç~íÉêK=qÜÉ=_JëÅ~å= ~åÇ=Éå=Ñ~ÅÉ=áã~ÖÉ=ÄçíÜ=ëÜçï=~=ÇÉÅêÉ~ëÉÇ=ëáÖå~ä=áå=íÜÉ=ë~ãÉ=~êÉ~K=qÜÉ=êÉÇ=~êêçï=ëÜçïë=ÖççÇ=ëáÖå~ä=áå= íÜÉ=ëíêìÅíìê~ä=Éå=Ñ~ÅÉ=~åÇ=íÜÉ=_JëÅ~å=~åÇ=ã~ó=ÄÉ=~ëëçÅá~íÉÇ=ïáíÜ=áãé~áêÉÇ=Å~éáää~êó=ÑäçïK= Decorrelation Tails Decorrelation Tails: Frequently seen as bright shadows of more superficial vessels that appear in posterior layers, decorrelation tails result from light that passes through the moving blood cells and returns to be detected. This creates a signal that is below the original motion, but caused by the motion, and therefore is always found posterior to the en face original signal. -
Page 119: Segmentation Errors
Criteria for Image Acceptance overlaid on the B-scan in Figure 7-6F. There are no normal vessels at the level of the RPE, en face so the vasculature seen in the Figure 7-6C is entirely due to decorrelation tails. A: SRL En Face B: DRL En Face... - Page 120 7-10 Criteria for Image Acceptance the B-scan (see Figure 7-8, below). It is always important to examine the segmentation to confirm the presence or absence of flow is associated with the layers of interest. Figure provides an example where the layer that should be avascular shows a bright area. Examination of the B-scan demonstrates that the drusen at this location has pushed the segmentation up into the hyper-reflective outer plexiform layer, and any bright signal detected at this location is likely due to ordinary inner retinal vasculature.
-
Page 121: Anterior Segment Acceptance Criteria
7-11 Criteria for Image Acceptance Anterior Segment Acceptance Criteria General Anterior Chamber, Wide Angle-to-Angle, HD Cornea, HD Angle, and Pachymetry scans are corrected to account for beam scanning geometry and refraction on the corneal surfaces. These corrections are most accurate when acquired corneal scans are centered on the corneal vertex, which generates a strong central reflection line on the live OCT image. - Page 122 7-12 Criteria for Image Acceptance 2660021169012 Rev. A 2017-12 CIRRUS HD-OCT User Manual...
-
Page 123: Analysis
Overview 8 Analysis Overview CIRRUS HD-OCT includes a broad set of analytical tools with which to view, characterize, and measure scanned data. Analyses are generated depending on the type of acquired data, as shown in Table 8-1. Anterior Segment Scan Acquisition Analysis Anterior Chamber Scan Anterior Chamber... -
Page 124: Image Menu Options
Overview Anterior Segment Scan Acquisition Analysis Visualization Macular Cube Scan 3D Visualization 200x200 / 512x128 En Face - or - Advanced Visualization Optic Disc Cube Scan 200x200 All Raster Scans HD Images Table 8-1 Relationships between Scan Acquisition Type and CIRRUS HD-OCT Analysis Methods Analysis of specific ocular features is often available via multiple CIRRUS analysis views, as described below. -
Page 125: Normative Database Comparisons
Overview Normative Database Comparisons Appendix A "Normative Data Results" includes the results of Normative database studies for the following populations that have been used as the basis for deviation calculations in the CIRRUS HD-OCT software: • RNFL and Macula Normative Database (Diversified) •... -
Page 126: Preset Slab Views
Overview Preset Slab Views Standard Presets Some Review options have sets of preset slab views that can be selected for a quick inspection of ocular features at various locations of significance in the retina. For example, the En Face analysis provides 6 preset options as described in "En Face Analysis Preset Slabs"... - Page 127 Overview cáÖìêÉ=UJO=qÜÉ=qÜìãÄå~áä=lêÖ~åáòÉê=aá~äçÖ 3. Select one of the 2 Scan Custom squares to the right of the Standard and Global Presets. If you have not created a custom view previously, the square will be blank. If you have previously created a custom view, your previous view will contain the last custom view you create.
-
Page 128: Posterior Segment
Posterior Segment Posterior Segment Posterior Segment features are viewed and measured by accessing the following CIRRUS HD-OCT analyses. If you are unsure as to which scans need to be acquired in order to access the appropriate analysis Macular Thickness Analysis The CIRRUS Macular Thickness Analysis (MTA) provides interactive scan images as well as the Fundus image with a scan cube overlay as shown in Figure 8-3. -
Page 129: Etdrs Position
Posterior Segment CIRRUS software identifies the Fovea location automatically by looking for the reduced reflectivity below the retina. You can also change the Fovea location manually (see "ETDRS Position" on page 8-7), which will update the data table and the ETDRS grid thickness measurements. -
Page 130: Ilm-Rpe Layers
Posterior Segment The thickness grid also moves in conjunction with the repositioning of the ETDRS Grid position on the overlay, as shown in Figure 8-4. ETDRS Grid position moved Thickness grid moves in conjunction with ETDRS Grid cáÖìêÉ=UJQ=qÜáÅâåÉëë=dêáÇ=jçîÉãÉåí This interactive analysis screen gives you several options to view patient data. Use the button tools to line up the slice navigators with ETDRS Grid position and vice versa. - Page 131 Posterior Segment values will also change. The position of the Fovea and the center of the ETDRS grid appear below the grid. In this figure, the Fovea is located at the intersection of slice 253 and 64. The colors of the ILM–RPE color bar represent the depth in micrometers, ranging from 0 (blue) to 350 (white) in increments of 17.5 µm for each bar.
-
Page 132: Additional Features
8-10 Posterior Segment Additional Features The buttons above appear from left to right in the Macular Thickness analysis. If you mouse over the buttons, their function appears in the form of a tooltip. The following paragraphs describe the additional features available on the Macular Thickness Analysis screen. •... -
Page 133: Macular Change Analysis
8-11 Posterior Segment Note that when you mouse over a line, it “pops,” or becomes thicker. The boundary lines you trace will never break. However, they will not cross each other. The buttons (shown at left) enable you to copy changes from one slice to the next slice or to the prior slice Buttons 1 and 4 allow you to move through the layers. -
Page 134: Manual Selection
8-12 Posterior Segment Manual Selection Should you decide that the current scan does not have the best signal strength or that it was taken in a position away from the center and, therefore, would not be a good match you can manually choose a different scan using the manual selection process. This option is also available in •... -
Page 135: Macular Registration
8-13 Posterior Segment Macular Registration Automatic Registration registers CIRRUS automatically the fundus images from the two dates so that the images you see are synchronized to show the equivalent location of the retina in each image. In addition, the color–coded thickness maps for the two images, as well as the thickness difference map, are displayed. - Page 136 8-14 Posterior Segment Select Review Registration to view the manually adjusted overlay. Use the slider above the overlay, as needed, to change the transparency to see more of Image 1 or Image 2. By moving the slider back and forth, you can see if blood vessels or other features from one image align with the identical features in the other image.
- Page 137 8-15 Posterior Segment Registration Review Registration between the two Fundus images may be compared by selecting the Registration Review button: . The results appear on a popup screen, as shown in Figure 8-10. cáÖìêÉ=UJNM=oÉÖáëíê~íáçå=oÉîáÉï=çÑ=cìåÇìë=fã~ÖÉë Figure 8-10, Image 1 is the an image taken from (an earlier) previous exam. Image 2 is the image from the most recent visit.
-
Page 138: Synchronized Data Review
8-16 Posterior Segment Synchronized Data Review Once the images are synchronized, you can manipulate the data on one exam image, while the identical movements are tracked on the second exam for a side by side comparison. When the sync lock is selected you can adjust the slice navigator or image slider bar to simultaneously move through the images and view the data. -
Page 139: Advanced Rpe Analysis
8-17 Posterior Segment cáÖìêÉ=UJNN=j~Åìä~ê=qÜáÅâåÉëë=lr=^å~äóëáë If the fovea is not found, the fovea location and measurement circles are centered in the 6 mm square and the calculations are made based on this position. The background Fundus image is not on the main analysis screen. To see the Fundus image, double–click a thickness map or OCT Fundus image to see the full page view, which will have the Fundus image in the background. -
Page 140: Rpe Elevation Considerations
8-18 Posterior Segment RPE Elevation Considerations The RPE Analysis view displays an RPE Elevation Map as an overlay on the Fundus image. The transparency can be adjusted using the transparency slider. The color coding aids in identifying bumps and discontinuities in the RPE. The map shows circles corresponding to 3 mm and 5 mm in diameter centered on the fovea. -
Page 141: Sub-Rpe Considerations
8-19 Posterior Segment The possible impact of such pathologies on the analysis can be taken into account by reviewing the individual B-scans and determining where areas of RPE elevation overlap with them. As with all retinal pathology, check the retinal segmentation in questionable cases. View the horizontal tomogram and check the black and lavender lines indicating the borders of the RPE elevation measurement. - Page 142 8-20 Posterior Segment addition, poor signal strength, pigmentation of the Fundus, and peripapilliary atrophy can occasionally cause misleading sub–RPE illumination findings. To edit sub–RPE illumination: 1. Open an edit screen by clicking the Segmentation Tool (shown at left). The screen displays the sub–RPE illumination segmentation as a colored region on the sub–RPE slab.
- Page 143 8-21 Posterior Segment cáÖìêÉ=UJNQ=^Çî~åÅÉÇ=omb=^å~äóëáë=Ó=pÅêÉÉå=O On Screen 2 (Figure 8-14), the sub-RPE illumination segmentation is overlaid on the RPE Elevation Map. The sub-RPE illumination segmentation is shown with an outline. This image shows the fovea location with a dot marking and a circle corresponding to 3 mm and 5 mm diameter circles centered on the fovea.
-
Page 144: Ganglion Cell Ou Analysis
1 Ganglion Cell OU Analysis is an optional feature that may not be available in all markets, and when available in a market, may not be activated on all instruments. If you do not have this feature and want to purchase it, contact ZEISS. In the U.S.A., call 1-877-486-7473;... - Page 145 8-23 Posterior Segment The screen allows editing the fovea location and navigating through the B-scans. Visually evaluate the image to determine if the segmentation lines are correctly finding the inner boundary of the Ganglion Cell layer and outer boundary of the Inner Plexiform Layer in such cases.
- Page 146 8-24 Posterior Segment Double-clicking on the image of choice will show the thickness map overlaid on the Fundus Image. This can be very useful in ensuring fovea is entirely centered. NOTE: Of particular importance for Ganglion Cell Guided Progression Analysis (see "Ganglion Cell Guided Progression Analysis"...
-
Page 147: En Face Analysis
8-25 Posterior Segment En Face Analysis Information regarding VRI, Mid–Retina, IS/OS Ellipsoid, and Choroid layers is provided by the CIRRUS HD-OCT En Face Analysis (Figure 8-18). 1 Show/Hide Fundus Image 4 OCT slice navigator 6 OCT B-scan slice 2 Fundus image 5 Available Presets 7 Image Toolbar (shown for B-scan, but available by... - Page 148 8-26 Posterior Segment En Face Preset Description Default Settings Designed to highlight disorders Upper: 133 μm above the ILM layer of the VRI, such as epiretinal membranes Lower: 33 μm below the ILM layer (Vitreoretinal Interface) (ERM) and vitreomacular traction (VMT). Vitreous attachments show as bright areas, while macular pucker appears as variations in the background intensity.
- Page 149 8-27 Posterior Segment NOTE: The Mid-Retina B-Scan shown in the En Face Report indicates the ILM and RPE through the use of white dashed lines. For this preset, it is not possible to move the magenta segmentation lines above or below the bounding lines of the retina. Figure 1.
-
Page 150: Onh And Rnfl Ou Analysis
8-28 Posterior Segment ONH and RNFL OU Analysis The ONH and RNFL OU Analysis is derived from Optic Disc Cube 200x200 scans. Along with the current scan image, a second scan image is shown of the opposite eye from the same visit (if available). -
Page 151: Rnfl Thickness Maps And Deviation From Normal Maps
8-29 Posterior Segment The ONH and RNFL OU Analysis derives the its elements from two kinds of thickness measurements: along the Calculation Circle and in super-pixels. RNFL Thickness Maps and Deviation from Normal Maps RNFL Thickness Maps and Deviation from Normal Maps are all based on calculated thickness data for the cube as follows: •... -
Page 152: Changing Rnfl Calculation Circle Placement
8-30 Posterior Segment 2. The normative database consisted of a population with a limited range of spherical error (-12 D to +6 D) and axial length (22 to 28 mm). Subjects with strongly myopic or hyperopic eyes may have a different distribution of measured RNFL thickness values, and may tend to flag more often than subjects who fall within the range of the population used to create the normative database. -
Page 153: Rnfl Data Table
8-31 Posterior Segment RNFL Data Table RNFL Summary Data The data table reports average thickness around the RNFL calculation circle. It also reports a percentage calculation of thickness Symmetry between the eyes. The color associated with each measurement derives from comparison to the age-matched RNFL normative data. -
Page 154: Parameter Summary Graphs
8-32 Posterior Segment The earliest two exams are treated as baseline exams (Baseline 1 and Baseline 2). The later or follow–up exams (3rd exam through last exam) are compared to the baselines to see if they have changed. All scans, including the Baseline 2, are registered to the first Baseline 1 in order to ensure accurate correspondence from the first scan to the last scan. -
Page 155: Summary Charts
8-33 Posterior Segment These plots are generated using linear regression in order to calculate the rate of loss. Confidence bands for the regression line are also shown. They are determined based on comparing the variability in the data to the rate of change. The slope (rate of change) is displayed in micrometers/year with 95% confidence interval values. -
Page 156: Rnfl & Onh Guided Progression Analysis
8-34 Posterior Segment RNFL & ONH Guided Progression Analysis RNFL Thickness Profiles RNFL Thickness Change maps RNFL Summary RNFL Thickness maps Average RNFL Thickness Graphs cáÖìêÉ=UJOM=dìáÇÉÇ=mêçÖêÉëëáçå=^å~äóëáë=Ó=okci=ëÅêÉÉå RNFL Thickness Profiles The RNFL Thickness Profiles (Figure 8-21) plot RNFL thickness values around the CIRRUS RNFL Calculation Circle. - Page 157 8-35 Posterior Segment and the current exam that report significant change are displayed with “Possible Loss” shown in yellow, “Likely Loss” shown in red, and “Possible Increase” shown in lavender. cáÖìêÉ=UJON=okci=qÜáÅâåÉëë=mêçÑáäÉë RNFL & ONH Parameter Summary Graphs As described in "Guided Progression Analysis"...
- Page 158 8-36 Posterior Segment RNFL & ONH Summary Chart RNFL GPA has three different indicators for detecting RNFL change and one indicator for detecting ONH change, each with a checkbox in the summary: • RNFL Thickness Map Progression (best for focal change) •...
- Page 159 8-37 Posterior Segment Optic Nerve Head Changes RNFL Guided Progression Analysis includes features to follow changes to the optic nerve head. This includes the following: • A graphical plot of the Average Cup–to–Disc Ratio as a function of patient age using the same layout as the graphical plots of RNFL average thickness measurements versus patient age.
-
Page 160: Ganglion Cell Guided Progression Analysis
8-38 Posterior Segment Ganglion Cell Guided Progression Analysis cáÖìêÉ=UJOP=d~åÖäáçå=`Éää=dìáÇÉÇ=mêçÖêÉëëáçå=^å~äóëáë 1 Ganglion Cell Guided 4 Previous two “normal” GC 7 GCL+IPL Summary Progression Analysis is thickness maps selectable for any Macular 5 Ganglion Cell thickness Cube scan change shown quantitatively 2 Thickness Map Color Legend 6 Overall avg. - Page 161 8-39 Posterior Segment GCL+IPL Summary Graphs As described in "Guided Progression Analysis" on page 8-31 GCL+IPL Average Thickness Graphs identify global thinning in the retinal nerve fiber layer by calculating a trend over time. cáÖìêÉ=UJOQ=^îÉê~ÖÉ=d`iHfmi=qÜáÅâåÉëë=~åÇ=qçí~ä=pìéÉêáçêLfåÑÉêáçê=qÜáÅâåÉëë=dê~éÜë=çîÉê=íáãÉ Figure 8-24: For Ganglion Cell GPA three graphs can be seen as shown in 1.
- Page 162 8-40 Posterior Segment The summary box reports progressive change as one of “Possible Loss” (yellow), “Likely Loss” (red), or “Possible Increase” (lavender). “Possible Loss” means progressive loss has been detected once. “Likely Loss” means it has been confirmed by consecutive follow–up examinations.
-
Page 163: Anterior Segment
8-41 Anterior Segment Anterior Segment Anterior Segment features are viewed and measured by accessing the following CIRRUS HD-OCT analyses. If you are unsure as to which scans need to be acquired in order to access the appropriate analysis, see Table 8-1. Anterior Chamber Depth and Lens Vault To measure Anterior Chamber depth and the Lens Vault, you must have scanned Anterior Chamber data (see... - Page 164 8-42 Anterior Segment Corneal Surfaces ACD Tool Vertical Base line cáÖìêÉ=UJOS=tçêâáåÖ=ïáíÜ=íÜÉ=^`a=íççä=íç=ãÉ~ëìêÉ=~åíÉêáçê=ÅÜ~ãÄÉê=ÇÉéíÜ=~åÇ=äÉåë=î~ìäí 2. Click and drag the center of the base line of the ACD Tool (Figure 8-26), to the anterior surface of the crystalline lens to measure anterior chamber depth (ACD) and the lens vault (LV).
-
Page 165: Angle-To-Angle Distance
8-43 Anterior Segment Angle-to-Angle Distance Using Anterior Chamber Analysis Click and drag the ends of ACD tool baseline to place the right and left endpoints in each angle of the posterior portion of the Anterior Chamber, to measure the Angle-to-Angle distance (ATA) or the Corneal Diameter. -
Page 166: In Pachymetry Analysis
8-44 Anterior Segment the scan directly over the central cornea for a single measurement. It is recommended that you use the pachymetry central thickness value. In Pachymetry Analysis Once a Pachymetry Scan is acquired (see "Pachymetry" on page 6-16) the CIRRUS HD-OCT Pachymetry Analysis will be selectable. - Page 167 8-45 Anterior Segment reports. Right-click a map and check Clear User Selection to clear the thickness marker you have selected. Right-click at a location on a map to deselect Show Mean Only (the default setting), to show only all three values per sector: Min, Max, Avg. Right-click and select Hide Data to hide all data values on a map.
- Page 168 8-46 Anterior Segment cáÖìêÉ=UJPM=qÜÉ=béáíÜÉäá~ä=qÜáÅâåÉëë=j~éë=~êÉ=~ÅÅÉëëÉÇ=Ñêçã=íÜÉ=m~ÅÜóãÉíêó=^å~äóëáë=ëÅêÉÉå=Äó= ëÉäÉÅíáåÖ=áí=Ñêçã=íÜÉ=sáÉï=ÇêçéÇçïå=äáëí=áå=íÜÉ=ìééÉê=äÉÑí=èì~Çê~åí=çÑ=íÜÉ=ëÅêÉÉå=EPF=áå= Figure 8-29K 2660021169012 Rev. A 2017-12 CIRRUS HD-OCT User Manual...
- Page 169 8-47 Anterior Segment All Maps Select this option from the View dropdown of the Pachymetry Analysis screen, to change the screen so that both the Pachymetry thickness maps and the Epithelial thickness maps are shown, as shown in Figure 8-31. cáÖìêÉ=UJPN=pÉäÉÅíáåÖ=^ää=j~éë=Ñêçã=íÜÉ=sáÉï=ÇêçéÇçïå=äáëí=áå=íÜÉ=ìééÉê=äÉÑí=èì~Çê~åí=çÑ=íÜÉ=ëÅêÉÉå= ïáää=ÅÜ~åÖÉ=íÜÉ=Çáëéä~ó=íç=ëÜçï=ÄçíÜ=íÜÉ=m~ÅÜóãÉíêó=j~éë=EqçéF=~åÇ=íÜÉ=béáíÜÉäá~ä= qÜáÅâåÉëë=j~éë=E_çííçãFK...
- Page 170 8-48 Anterior Segment Viewing Thumbnails of Cornea Scans To view the 24 thumbnail scans used to generate the Pachymetry scan for a selected eye, select either Images (OD) or Images (OS) from the View dropdown list in the upper right quadrant of the Pachymetry Analysis screen (“1”...
-
Page 171: In Hd Cornea Analysis
8-49 Anterior Segment In HD Cornea Analysis The HD Cornea Analysis screen shows the iris viewport with the scan line, the length of scan, and the scan angle displayed (Figure 8-33). The length of the scan and the scan angle are also displayed above the OCT image. cáÖìêÉ=UJPP=ea=`çêåÉ~=^å~äóëáë= In Anterior Chamber Analysis To measure the Center Corneal Thickness (CCT) via the Anterior Chamber Analysis screen,... -
Page 172: In Hd Images Analysis
8-50 Anterior Segment cáÖìêÉ=UJPQ=^åíÉêáçê=pÉÖãÉåí=^å~äóëáë=Ó=`çêåÉ~=qÜáÅâåÉëë In HD Images Analysis When you select an Anterior Segment 5 Line Raster scan from the Analysis screen scan list, the High Definition Images analysis for that scan is automatically displayed. cáÖìêÉ=UJPR=eáÖÜ=aÉÑáåáíáçå=fã~ÖÉë=^å~äóëáë=Ó=`çêåÉ~=qÜáÅâåÉëë 2660021169012 Rev. A 2017-12 CIRRUS HD-OCT User Manual... -
Page 173: Epithelial Thickness
8-51 Anterior Segment The High Definition Images analysis screen displays the iris viewport with the scan pattern superimposed. The length, line spacing, and angle of the scan are displayed above the large OCT scan. The thumbnails of the five lines are shown below the iris viewport. The large scan image on the right corresponds to the highlighted blue thumbnail and the highlighted blue scan line. -
Page 174: Central Corneal Thickness (Cct) Measurement
8-52 Anterior Segment The values S-I are calculated by subtracting the average value in the I sector at the specified distance from the center, from the average value in the S sector, at the corresponding distance. Likewise, The values SN-SI are calculated by subtracting the average value in the SI sector at the specified distance from the center, from the average value in the SN sector, at the corresponding distance. -
Page 175: Angle Measurements
8-53 Anterior Segment NOTE: Vertical distances on the tomogram reliably show tissue thickness and tissue refractive index. Horizontal distances cannot be measured quantitatively on these tomograms. When applied to Anterior Segment scans, the Ruler measures only vertical distances, with the scale factor set appropriately for measurements within the cornea. NOTE: The Ruler is calibrated for measuring corneal tissue only, based on the refractive index of the cornea. -
Page 176: In Anterior Chamber Analysis
8-54 Anterior Segment Abbreviation Measurement AOD500 Angle Opening Distance at 500 mm: Distance between C and D. AOD750 Angle Opening Distance of 750mm: Distance between E and F. TISA500 Trabecular Iris Space Area 500 (mm ): The area of the polygon defined by the sides forming a circuit through points A,C,D, and B. -
Page 177: In Wide Angle-To-Angle Analysis
8-55 Specialized and Integrative Visualization Tools cáÖìêÉ=UJPV=eçï=íç=~ééäó=íÜÉ=^ÇÇ=^åÖäÉ=qççä The Anterior Chamber Angle measurements provided by CIRRUS HD-OCT are not intended to be a substitute for gonioscopy, which is the current reference standard for evaluating the anterior chamber angle configuration. For example, during gonioscopy, end users can view the ACA through a mirror/prism under dynamic conditions, and can examine the angle over the full extent. - Page 178 8-56 Specialized and Integrative Visualization Tools 1 Scan information 3 Thumbnail images of scan lines 5 Display of selected scan line 2 Fundus image with scan lines 4 Image tools for displayed scan overlay line cáÖìêÉ=UJQM=eáÖÜ=aÉÑáåáíáçå=fã~ÖÉë=^å~äóëáë=Ñçê=ea=R=iáåÉ=o~ëíÉê=pÅ~å Tracking If the scan used a previous scan for tracking, the green previous scan information icon is shown and the display previous scan button is available.
-
Page 179: Change The Displayed Scan Line
8-57 Specialized and Integrative Visualization Tools Change the Displayed Scan Line When you select High Definition Images analysis for multi–line scans, the scan lines are displayed on the fundus image with the middle scan selected and displayed in the larger image window. -
Page 180: Single Eye Summary
8-58 Specialized and Integrative Visualization Tools Single Eye Summary The Single Eye Summary Analysis combines data from the Macula 512x128 or 200x200 Cube Scan and the Optic Disc 200x200. For inclusion, the data for both scans must have been taken that day. You can also manually select the second exam, which may be from the same or different date (see "Manual Selection"... -
Page 181: The Panomap
8-59 Specialized and Integrative Visualization Tools The Panomap The Panomap Analysis integrates data from the Macular Thickness Analysis, RNFL and ONH Analysis and the Ganglion Cell OU Analysis to provide a wide–field perspective for comprehensive posterior segment analysis. 1 Information about the macular 4 GCL + IPL Thickness grid with 6 Table includes RNFL and optic disc cube and optic disc cube used for... -
Page 182: 3D Analysis
8-60 Specialized and Integrative Visualization Tools • outlines of the cup and disc • Pixel shading of deviation from normal RNFL thickness The GC+IP layer thickness deviation map includes • the circle marking the fovea location • pixel shading of the deviation from normal GC+IP thickness You can display or hide the disc and cup boundaries and fovea indicator. -
Page 183: View Settings
8-61 Specialized and Integrative Visualization Tools cube. The red, green, and blue spheres can be dragged along the matching colored lines to define slice planes. The default setting for the mouse is to rotate the image. You can zoom in or out using the mouse scroll button. -
Page 184: Show Settings
8-62 Specialized and Integrative Visualization Tools NOTE: The Save As Global function in this dialog does not save the exam. You must use the Save Exam icon at the top of the screen to save the settings for the exam. Show Settings Click Show... -
Page 185: Clip Surfaces
8-63 Specialized and Integrative Visualization Tools Clip Surfaces cáÖìêÉ=UJQS=`äáé=pìêÑ~ÅÉë Clip Surfaces, an on/off toggle button, lets you select which plane of tissue to clip or cut away. The blue, red, and green spheres can be dragged along the matching colored lines to define the clipping plane. -
Page 186: Movie Recording
8-64 Specialized and Integrative Visualization Tools To Record: 1. Click the first box in the Save snapshot timeline. 2. Perform your first activity. Examples of activities: moving, rotating, slicing. 3. Click one of the boxes in the Save snapshot timeline to define the length of time for the activity. -
Page 187: Autorecord Keyframes
8-65 Specialized and Integrative Visualization Tools To play back a movie: 1. Click the Play button. 2. Browse to the location of the movie you want to play, select it, and click Open. The movie will start to play in your default movie viewer (Windows Media Player or QuickTime Player). -
Page 188: Width, Height, And A-Scan Adjustments
8-66 Specialized and Integrative Visualization Tools Width, Height, and A–Scan Adjustments You can manually adjust the red (Width), blue (Height), and green (A–Scan) sphere positions by clicking the up/down arrows, or by typing the desired position in the Width, Height, and A–Scan fields. These fields may provide finer control of the sphere positions. Mouse Rotates/Mouse Translates Two buttons allow the user to set the left mouse to either rotate or translate the image on the screen. -
Page 189: Transparent Surfaces
8-67 Specialized and Integrative Visualization Tools cáÖìêÉ=UJRM=sçäìãÉ=píê~áÖÜíÉåI=_ÉÑçêÉ=EäÉÑíF=~åÇ=^ÑíÉê=EêáÖÜíF Transparent Surfaces Checking the Transparent Surfaces checkbox allows you to view ILM, RNFL, or RPE as transparent surfaces. Use the sliders to adjust the transparency level. NOTE: When you use Transparent Surfaces, the image will have lower resolution. Reset Click Reset to return the image to its default settings. -
Page 190: Advanced Visualization Analysis
8-68 Specialized and Integrative Visualization Tools Advanced Visualization Analysis 1 Exam (date), OD and OS scan lists 3 Y slice through cube side 5 X slice through for selected exam, analysis list cube front 4 Z slice or slab through cube top 2 Fundus image with scan cube overlay cáÖìêÉ=UJRN=^Çî~åÅÉÇ=sáëì~äáò~íáçå=^å~äóëáë... -
Page 191: Retinal Layers Automatically Detected And Displayed
8-69 Specialized and Integrative Visualization Tools The viewports are interactive: Click and drag the triangles or click a scan viewport and use the mouse scroll wheel to “move through” the active plane of the viewport; you will see the resulting cross–sections update simultaneously in the other viewports. This functionality enables you to quickly search through the data cube and stop when you see an area of interest. -
Page 192: Slice And Slab Options
8-70 Specialized and Integrative Visualization Tools Slice and Slab Options The lower right viewport, Figure 8-52, has a drop–down menu to select Slice (default), Slab, ILM, RPE, or RPEfit. cáÖìêÉ=UJRO=^å~äóëáë=ëÅêÉÉå=ëÜçïáåÖ=~=pä~Ä When you select Slab, the other two scan viewports show two same–color dashed lines separated by a small distance. -
Page 193: Function Buttons In Advanced Visualization
8-71 Specialized and Integrative Visualization Tools Function Buttons in Advanced Visualization The buttons shown on the left appear from left to right in the Advanced Visualization analysis, above the scan images at right. If you mouse over them, their function appears in the form of a tooltip. - Page 194 8-72 Specialized and Integrative Visualization Tools • Center button: Click Center to return the current slices to their default central positions. • Tagged Images button: Click the Tagged Images button to view and adjust which images are tagged for custom printing. This button is active when one or more images have been tagged for printing by selecting Tag for print from the right–click menu.
-
Page 195: Cirrus Oct Angiography
Overview 9 CIRRUS OCT Angiography Overview ® CIRRUS OCT Angiography (AngioPlex ) provides non-invasive, high quality images of the retinal and choroidal vasculature. Careful review of CIRRUS OCT Angiography scans should be carried out before accepting scanned images, as described in "CIRRUS OCT Angiography Acceptance Criteria"... - Page 196 Overview For the CIRRUS OCT Angiography Analysis screen (Figure 9-1), the top-middle viewport shows the angiography OCT image while the top-right image shows the corresponding structure OCT enface image. cáÖìêÉ=VJN=`foorp=l`q=^åÖáçÖê~éÜó=SñS=ë~ãéäÉ=áã~ÖÉ=ïáíÜ=~ëëçÅá~íÉÇI=ëÉäÉÅí~ÄäÉ=áã~ÖÉ=îáÉïë For the Montage Angio Analysis screen (Figure 9-2), the middle viewport (2) shows the CIRRUS OCT Montage Angio image, while the middle-right viewport shows the individual panes of the Montage image and will change depending where you click the cursor in the middle viewport.
- Page 197 Overview cáÖìêÉ=VJO=`foorp=l`q=jçåí~ÖÉ=^åÖáç=ë~ãéäÉ=áã~ÖÉ=ïáíÜ=~ëëçÅá~íÉÇI=ëÉäÉÅí~ÄäÉ= áã~ÖÉ=îáÉïë cáÖìêÉ=VJP=`foorp=l`q=lke=^åÖáçÖê~éÜó=áã~ÖÉ=ïáíÜ=~ëëçÅá~íÉÇI=ëÉäÉÅí~ÄäÉ=áã~ÖÉ=îáÉïë CIRRUS HD-OCT User Manual 2660021169012 Rev. A 2017-12...
-
Page 198: Cirrus Oct Angiography Presets
Overview CIRRUS OCT Angiography Presets The CIRRUS HD-OCT Angiography and Montage Angio analysis screen includes 12 pre-defined angiography presets, which are the same. The CIRRUS HD-OCT ONH Angiography includes 4 predefined angiography presets. These slabs are discussed below. Larger images of each, and a further discussion of the algorithms used to define their boundaries, can be found in Table 9-4. - Page 199 Overview NOTE: The Avascular slab was constructed with the goal of bounding the parts of the retina that are expected to have no vasculature in normal anatomy. There are many situations for which there may appear to be bright patches or areas in this image that are not necessarily due to pathology, including: Errors in segmentation may cause there to be apparent vasculature.
- Page 200 Overview • Sub-RPE: The OCT Analysis uses a predefined Sub-RPE slab. The Sub-RPE slab uses a Pixel option that can calculate the pixel values or maximum pixel values. The Sub-RPE preset default Project type MAX project method is defined as follows: Top: RPE + 29 μm Bottom: RPE + 49 μm NOTE: This preset is not available for ONH Angiography.
-
Page 201: B-Scan Settings
Overview You can use custom presets to choose an inner boundary and an outer boundary, and then shift them to visualize the vasculature between any of the defined layers. B-Scan Settings Based on the selected slab (Current View), allows you to step through the scan by dragging the segmentation lines, offsetting the outer and/or inner segmentation boundaries, in μm. -
Page 202: Current View References
Overview only The AngioPlex Metrix fields appear when the default Superficial (SRL) Preset or Radial Peripapillary Capillaries (RPC) for ONH Angiography Analysis is selected (see "CIRRUS OCT Angiography Presets" on page 9-4. These AngioPlex Metrix fields provide information regarding vessel density and the Foveal Avascular Zone (FAZ) and are described fully in "Vessel Density and Capillary Perfusion"... - Page 203 Overview The left icon, will move the navigators to the center of the box, not taking into account the locations of the structures. The right icon will move your navigators to the center of the ONH. For more information about the Overlay features, see "ONH Overlay and Angio Metrix Bar"...
- Page 204 9-10 Overview "Vessel Density and Capillary Perfusion" on page 9-11 for information about Perfusion AngioPlex En Face ONH Angiography Analysis displays the AngioPlex En Face in Item 8 (Figure 9-3). Structure En Face ONH Angiography Analysis displays the AngioPlex En Face in Item 9 (Figure 9-3).
-
Page 205: Vessel Density And Capillary Perfusion
9-11 Overview Individual Scan Images of Montage Image Item 13 shows the individual scan images of the Montage image (Figure 9-2) and will change depending where you click the cursor on the Montage image. Vessel Density and Capillary Perfusion cáÖìêÉ=VJR=tÜÉå=íÜÉ=pìéÉêÑáÅá~ä=éêÉëÉí=áë=ëÉäÉÅíÉÇ=Ñêçã=íÜÉ=^åÖáçÖê~éÜó=^å~äóëáë=ëÅêÉÉåI=íÜÉ= ^åÖáçmäÉñ=jÉíêáñ=ïáää=~ééÉ~êK Select the Superficial preset (see Presets "CIRRUS OCT Angiography Presets"... -
Page 206: Vessel Density Vs. Capillary Perfusion
9-12 Overview Table 9-2 shows describes both Vessel Density and Perfusion Density and provides measurements for each. Name Description Units Vessel Density Vessel Density is defined as the total length of perfused vasculature per unit area in a region of (mm/mm measurement. - Page 207 9-13 Overview Metrice Description Units FAZ Area The area contained within the boundary of the FAZ. mm FAZ Perimeter The length of the boundary of the FAZ. FAZ Circularity How similar the boundary of the FAZ is to a circle. Unitless Values range from 0 to 1.
- Page 208 9-14 Overview cáÖìêÉ=VJTiçï=c^w=`áêÅìä~êáíó=EMKRUF Editing a FAZ You can manually draw the outline of the FAZ if the one provided by the application is not acceptable. The Edit function of the FAZ controls will cause a drawing tool to replace the standard mouse pointer and allow you to draw your own FAZ outline if desired.
- Page 209 9-15 Overview To Edit the Foveal Avascular Zone: 1. Select FAZ from the AngioPlex Metrix. If the automatic FAZ algorithm has identified a FAZ it will be outlined as shown below, on the left. If the automatic FAZ algorithm has not been able to identify the FAZ, the message shown below, on the right will appear.
-
Page 210: Angioplex Metrix Measurements
9-16 Overview 4. Release the mouse button to complete the area. AngioPlex Metrix Measurements Measurements are provided in both tabular form and as Vascular Density maps via the AngioPlex Metrix toolbox. Density values for selected regions are shown both in the AngioPlex Metrix table (see Item 3 above), and when selected in the ETDRS grid with values shown in the individual sectors Table 9-4 and Table 9-5, on the following pages, illustrate each of the graphic options... -
Page 211: Overlay Options
9-17 Overview Overlay Options Table 9-4 Overlay options available for visualizing vessels and perfusion, as well as FAZ shape and size CIRRUS HD-OCT User Manual 2660021169012 Rev. A 2017-12... -
Page 212: Etdrs Options
9-18 Overview ETDRS Options ETDRS Grid with Vessel Density Values ETDRS Grid ETDRS Grid with Perfusion Density Values ETDRS Grid Table 9-5 ETDRS Overlays can show values for either vessel density or perfusion 2660021169012 Rev. A 2017-12 CIRRUS HD-OCT User Manual... -
Page 213: Angiography And Onh Angiography Change Analysis
9-19 Overview Angiography and ONH Angiography Change Analysis The Angiography Change Analysis screen (Figure 9-8) allows you to compare two Angiography scans from a patient’s history to visualize changes in retinal vasculature, capillary density and perfusion, FAZ size, and geometry. cáÖìêÉ=VJU=`foorp=l`q=^åÖáçÖê~éÜó=`Ü~åÖÉ=^å~äóëáë=ëÅêÉÉå... -
Page 214: Previous Scan
9-20 Overview The ONH Angiography Change Analysis screen (Figure 9-9) allows you to compare two scans from a patient’s history to visualize any changes. To open the Overlay area (shown and described on page xxx), select the toggle icon (Item 3) in the upper-right hand area of the screen. -
Page 215: Options Bar
9-21 Overview Options Bar There are a number of options that can be specified for the various Angiography Change Analysis screens. These can be found on the Options bar (enlarged from Figure 9-8, and shown below), and are discussed in the paragraphs that follow. Preset Selector Use the Preset Selector drop-down list to select a preset of interest. -
Page 216: Onh Overlay And Angio Metrix Bar
9-22 Overview ONH Overlay and Angio Metrix Bar Fundus Image: Overlays both the AngioPlex image and the Structure image with the Fundus Image. Remove Projections: Filters out any projections. Projection artifacts can potentially give false information about blood vessels. Slice Navigators: Overlays the blue (fast B-scans) and magenta (slow B-scans) on the images. -
Page 217: Onh Rnfl Thickness
9-23 Overview Outer Region Item 6 in the ONH Angiography Change Analysis screen is used for Outer Region information. ONH RNFL Thickness Item 7 in the ONH Angiography Change Analysis screen is for the RNFL Thickness. OCT Angiography Change - Manual Selection Should you decide that the current scan does not show the best characteristics for a OCT Angiography comparison, you can manually choose a different scan using the manual selection process:... -
Page 218: Angioplex Preset Algorithms
9-24 Overview AngioPlex Preset Algorithms Slab Name Layer Boundaries Example En Face B-scan with Layers Thickness Map Inner Boundary: ILM Outer Boundary: RPE Retina Depth Encoded Combination of the above three Combination of the three layers, with the following above coding: SRL = Red DRL = Green Avascular = Blue Whole Retina Slab... - Page 219 9-25 Overview SRL: Inner Boundary: Z Superficial Retinal Layer Outer boundary: +70%(T OPL–ILM DRL Slab: Inner boundary: Z Deeper Retinal Layer Outer boundary: – 110μm RPEfit Avascular Slab Inner Boundary: Z Outer Boundary: – 70μm IS/OS RPEfit Choriocapillaris Slab Inner Boundary: + 29 μm CCIB RPEfit...
- Page 220 9-26 Overview Choroid Slab Inner Boundary: + 64 μm ChIB RPEfit Outer Boundary: + 115 μm ChOB RPEfit ORCC Inner Boundary: - 110 μm RPEfit Outer Boundary: + 115 μm ChOB RPEfit RPE-RPE Fit Inner Boundary: Outer Boundary: RPEfit Sub-RPE Inner Boundary: Outer Boundary: + 49 μm...
-
Page 221: Onh Angiography Change Analysis Image Registration
9-27 Overview ONH Angiography Change Analysis Image Registration Both Automatic Registration and Manual Registration are available for ONH Angiography in CIRRUS. The process parallels the registration process found in "Macular Registration" on page 8-13. Refer to the section for more details. CIRRUS HD-OCT User Manual 2660021169012 Rev. - Page 222 9-28 Overview 2660021169012 Rev. A 2017-12 CIRRUS HD-OCT User Manual...
-
Page 223: 10 Reports And Printing
10-1 Standard Print Options 10 Reports and Printing CIRRUS HD-OCT software provides tools for report generation, which can then be either printed or saved in number of file formats. The allowable options for saving and/or printing reports always reflect the analysis from which the report has been generated. -
Page 224: The Report Preview Screen
10-2 The Report Preview Screen The Report Preview Screen Reports are accessed when you select the Print Preview option, described in the previous section. The analysis for which you had the screen open, will appear as shown in Figure 10-2 (although the images themselves will vary depending on the analysis type and data recorded). - Page 225 10-3 The Report Preview Screen cáÖìêÉ=NMJP==qÜÉ=ÇêçéJÇçïå=äáëí=áå=íÜÉ=p~îÉ=áÅçå=çå=íÜÉ=oÉéçêí=oÉîáÉï=ëÅêÉÉåI=éêçîáÇÉë=ãìäíáéäÉ= ÑáäÉíóéÉ=çéíáçåë=Ñçê=ë~îáåÖK The original analysis exam date and time always appears at the top of the report. When an analysis is altered and saved, the original analysis date/time still appears at the top of the page, while a new date/time for the alteration is printed in the Comments box at the bottom of the page.
-
Page 226: Analysis Related Report Options
10-4 Analysis Related Report Options NOTE: Do not be misled by the default message “Save to Tiff” which appears when you mouse over the Save button at this location. This is an artifact of the default selection, but in no way represents the only available file format. After you have clicked on the Save icon, click the lower bar (Save as Types) in the popup window that appears, and select the format of interest from the drop-down list (see Figure... -
Page 227: The Macula Multi-Slice Option
10-5 Analysis Related Report Options cáÖìêÉ=NMJQ==jq^=mêáåí=léíáçåë= The Macula Thickness Option, is the default option. You can reset any tab by selecting Reset to Default in the lower right corner of the screen. The Macula Multi–Slice Option The Macula Multi–Slice Option, the second checkbox within the first tab of the Printout Configuration screen will set up a report that, when saved and/or printed, yields a series of pages, each of which show a set of selected Macula slices. -
Page 228: Macula Radial Report Option
10-6 Analysis Related Report Options You may choose the number of scans to print per region or indicate the spacing between the scans. If you do not wish to print any scans for a particular region, enter “0” in the appropriate Number of Scans per Section field. - Page 229 10-7 Analysis Related Report Options cáÖìêÉ=NMJS==qÜÉ=q~ÖÖÉÇ=fã~ÖÉë=Çá~äçÖ The maximum number of images that may be tagged for print is 18 (or 6 pages). When you tag an OCT image or a Fundus image that includes an overlay, CIRRUS automatically presents the image you select plus a companion Fundus image for orientation or a text description of the overlay, respectively.
-
Page 230: Onh And Rnfl Thickness Report Options
10-8 Analysis Related Report Options • Save Images: Saves the currently selected images in BMP or JPG format in the location you select in the Save As dialog that appears. Each image in the pair is saved individually; thus, two images are saved for each selected row. The system automatically appends an image number to the end of the name you enter. -
Page 231: Normative Data Details Report
10-9 Analysis Related Report Options cáÖìêÉ=NMJU==qÜÉ=lke=~åÇ=okci=qÜáÅâåÉëë Normative Data Details Report If you click the blue icon button you can select Print Preview or Export to DICOM. A P RINT screen displays the Normative Data Details Report, as shown in Figure 10-9. -
Page 232: High Definition Images Report (Raster Scan Options)
10-10 Analysis Related Report Options cáÖìêÉ=NMJV==kçêã~íáîÉ=a~í~=aÉí~áäë=oÉéçêí= High Definition Images Report (Raster Scan Options) The stock report for High Definition Images analysis for raster scans includes a Fundus image showing the placement of the line scans, thumbnails of the scan lines and a single larger image of the selected scan line for HD 1 Line 20x, HD 5 Line, and 5 Line Raster, scans. -
Page 233: Guided Progression Report Options
10-11 Analysis Related Report Options 1. Select Tools > Print Configuration > Raster Print Options as shown in Figure 10-10. cáÖìêÉ=NMJNM==o~ëíÉê=mêáåí=léíáçåë 2. Click Print Selected Line (Single Page) to print just the selected line, or Print All Lines (Multiple Pages) to print all lines. This configuration will persist each time the report is generated. - Page 234 10-12 Analysis Related Report Options 4. Select Print All Pages to print the selected Page 1 option and the Parameters Summary Table report. Summary The Summary report is the default single page or first page of a two–page GPA report. It displays all the information shown on the Guided Progression Analysis screen.
- Page 235 10-13 Analysis Related Report Options measurements. A lavender “Possible Increase” summary box could indicate high measurement variability. Apply GPA Results in Context of the Patient GPA reports statistically significant change for one eye, which may or may not be clinically significant.
- Page 236 10-14 Analysis Related Report Options Layer Thickness Measurements ” – M.R. Horne, T. Callan, M. Durbin, T. Abunto; Poster 4624, ARVO 2008). The difference between a current exam and the Baseline is assumed to have a normal distribution with a standard deviation determined from clinical measurements on subjects over a short period of time.
-
Page 237: Normative Data Details Reports
10-15 Analysis Related Report Options statistically significant if the range of rates covered by the 95% confidence limits exclude zero. It may be more useful to note that if the 95% confidence bands include a rate consistent with normal aging, the observed change may be due to normal aging process rather than glaucomatous loss. - Page 238 10-16 Analysis Related Report Options You may generate a Normative Data Details Report from the following analyses: • Macula Thickness Analysis • Ganglion Cell Analysis • Single Eye Summary • ONH and RNFL OU Analysis • RNFL Thickness Analysis NOTE: ONH and RNFL OU Analysis and RNFL Thickness Analysis reports will print two pages of the Normative Data Details Report as these reports are OU reports (two eyes).
-
Page 239: 11 Data Management
Most often, unless you are part of a large organization and have many Zeiss instruments, your instrument (and hence, your Review Stations – PC’s or Laptops running only licensed Review Software) will be configured in “Native mode.”... -
Page 240: Data Integrity Of Imported Records
11-2 Importing and Exporting Data more information. Users who wish to obtain additional medical information about an anonymous patient must contact the originating clinic. Data Integrity of Imported Records For all imported patient records, it is possible to import new scan data and update patient data, including obscured patient records. - Page 241 11-3 Importing and Exporting Data NOTE: If the target system on the network requires a password for access, you must have already logged in to the target system via Windows before attempting to export there. 4. Click OK to save and close the dialog. The destination you selected will appear in the Path field back in the Export Options dialog.
- Page 242 11-4 Importing and Exporting Data NOTE: You cannot edit or merge patient information for patients imported with omitted patient identifiers. 8. When you have made your selections, click Export. Export progress is shown in an expanded area at the bottom of the Export Options dialog. cáÖìêÉ=NNJO==bñéçêí=mêçÖêÉëë...
-
Page 243: Forum/Dicom Mode
11-5 Importing and Exporting Data You may export repeatedly to the same export folder (on a network drive or the same removable media), in which case CIRRUS adds only those exams that were not already exported and does not overwrite any data previously exported. You may interrupt an export operation and then start it again later, and only the exams not already present in the export database are exported. - Page 244 NOTE: If you are adding the FORUM Data Management system to your practice and plan to migrate existing data to the FORUM Archive, consult with Zeiss regarding options for creating and migrating files in OP/OPT format. Creating these files from prior data can significantly extend the time for data migration.
-
Page 245: Data Queries And Search Options
11-7 Data Queries and Search Options Data Queries and Search Options DICOM Workflow for Modality Worklist allows queries of archived patients. To display a list of archived patients scheduled for exams: 1. Select Records > Search Worklist Patients. The Modality Worklist dialog appears (Figure 11-5). - Page 246 11-8 Data Queries and Search Options the left. The Requisition Procedure ID number also appears here. 2. Click Search to see the list of patients within the search parameters. Patients retrieved are loaded into the Patient List in the Modality Worklist window. 3.
-
Page 247: Xml Export
11-9 XML Export XML Export The XML option allows the numerical export of values that appear on certain analysis screens. Batch XML Export The numeric values of Macular Thickness Analysis and ONH and RNFL OU Analysis are exported in batch. To initiate the batch XML export, in ID patient mode, select Records > Export Exams... -
Page 248: Values Exported: Macular Thickness Analysis
11-10 XML Export Values Exported: Macular Thickness Analysis The values labeled on the Macular Thickness Analysis screen, Figure 11-8, are exported to a XML file. The labels of these values in the XML file are listed in the table below. 1 2 3 cáÖìêÉ=NNJU==s~äìÉë=bñéçêíÉÇ=Ñêçã=j~Åìä~ê=qÜáÅâåÉëë=^å~äóëáë... -
Page 249: Values Exported: Onh And Rnfl Ou Analysis
11-11 XML Export NOTE: Fields 20, 21, 24, and 25 are exported exactly as they are shown on the screen. As an example, field 20, Z_INNERRIGHT, refers to the inner right hand sector as seen on the screen. Thus for the right eye (OD), it is the Inner Nasal sector. For the left eye (OS), it is the Inner Temporal Sector. -
Page 250: Export Values: Macular Change Analysis
11-12 XML Export will appear on the left in the report for the right eye (OD) and on the right for the left eye (OS). Export Values: Macular Change Analysis The XML export from the Macular Change Analysis screen is performed by clicking the XML Export button (shown on the left). -
Page 251: Values Exported: Guided Progression Analysis
11-13 XML Export Values Exported: Guided Progression Analysis The XML export from Guided Progression Analysis is performed from analysis screen by clicking the XML Export button. The values, labeled in the Guided Progression Analysis screen, Figure 11-11, are exported to a XML file. The labels of these values in the XML file are listed in the table below. -
Page 252: Values Exported: Ganglion Cell Ou Analysis
11-14 XML Export Values Exported: Ganglion Cell OU Analysis The values, labeled in the Ganglion Cell OU Analysis screen, Figure 11-12, are exported to a XML file. The labels of these values in the XML file are listed in the table below. cáÖìêÉ=NNJNO==s~äìÉë=bñéçêíÉÇ=Ñêçã=d~åÖäáçå=`Éää=lr=^å~äóëáë... -
Page 253: Values Exported: Advanced Rpe Analysis
11-15 XML Export Values Exported: Advanced RPE Analysis The values, labeled in the Advanced RPE Analysis screen, Figure 11-13, are exported to a XML file. The labels of these values in the XML file are listed in the table below. cáÖìêÉ=NNJNP==s~äìÉë=bñéçêíÉÇ=Ñêçã=^Çî~åÅÉÇ=omb=^å~äóëáë... -
Page 254: Advanced Export
11-16 Advanced Export Advanced Export Click on the Advanced Export button on the ONH and RNFL OU Analysis screen, to export and store ILM-RNFL thickness maps as .DAT files and .txt files of Neuro-retinal Rim Thickness and RNFL Thickness profiles to a user-selectable directory Dat Files of ILM–RNFL Thickness Maps NOTE: DAT files are plain text files that can be read from an Excel or Matlab application. -
Page 255: Log Files
CIRRUS overwrites the existing files. The default folder for the audit log files is C:\ProgramData\Carl Zeiss Meditec\CIRRUS HD-OCT\Logs. NOTE: It is highly recommended that you archive audit log files are regularly. - Page 256 11-18 Log Files 2660021169012 Rev. A 2017-12 CIRRUS HD-OCT User Manual...
-
Page 257: 12 Routine Maintenance
NOTE: Except for the top fan filter, the CIRRUS HD-OCT has no user–replaceable parts. The user must not attempt hardware repairs without consulting Zeiss service personnel. To do so voids the instrument warranty. However, we may provide software updates that users can install. -
Page 258: Handling Error Messages
In normal instrument start–up, the User Login dialog appears. If the system fails the system check, or if some other error prevents the system’s normal function, document the circumstances and any associated error messages, and report it to Zeiss customer service. In the U.S., call 800–341–6968. Outside the U.S., contact your local Zeiss distributor. -
Page 259: Forehead And Chinrests
12-3 Routine Cleaning Forehead and Chinrests The instrument parts that routinely contact the patient—the forehead and chinrests— should be cleaned between each examination with an alcohol prep wipe. These parts are not removable. External Surfaces of the Instrument To remove dust and oily smudges from the external surfaces of the instrument, periodically clean plastic covers and housings with an alcohol prep wipe, and dry with a soft, non–... - Page 260 12-4 Routine Cleaning Press on snap connector Removable top and pull the cover cover back to open Top fan filter cáÖìêÉ=NOJN==qçé=c~å=cáäíÉê=fääìëíê~íáçå Clean and/or replace, as necessary. Brush off excess dust and dirt. Clean with a mild liquid soap and water. Allow to thoroughly dry before placing it back in the instrument. Replace cover after replacing the filter.
-
Page 261: User Replacement Accessories
• Occluding Sleeve for Fixation Device • Red Fixation Lamp NOTE: Item part numbers and descriptions are subject to change. To order: In the U.S., call 800–341–6968. Outside the U.S., contact your local Zeiss distributor. CIRRUS HD-OCT User Manual 2660021169012 Rev. A 2017-12... -
Page 262: Performance Verification Check
Verification Test Tool can affect test results. If you drop the tool, it is recommended that you do not use it for testing. Immediately contact Zeiss customer service. In the U.S., call 800– 341–6968. Outside the U.S., contact your local Zeiss distributor. -
Page 263: Run The Check
12-7 Performance Verification Check Run the Check To run the check, follow these steps: 1. In the ID Patient Screen, select the patient named Performance Verification and then click Acquire. NOTE: You cannot edit or delete the Performance Verification patient record. The Acquire screen appears, showing a default Macular Cube 512x128 scan. - Page 264 12-8 Performance Verification Check 5. Click Save and then either Finish or ID Patient to exit data acquisition. You will return to the ID Patient screen. 6. Select the Performance Verification patient again and click Analyze. 7. In the Analysis screen, select the scan you just saved. 8.
- Page 265 12-9 Performance Verification Check 11.Double–click anywhere on the fundus image to make it appear full screen. Drag triangles to center scan lines Central circle contains cross–hair =alignment target cáÖìêÉ=NOJR==cìåÇìë=sáÉïéçêí=cìää=pÅêÉÉå=táíÜ=MB=qê~åëé~êÉåÅó=Elé~èìÉF Note the cross–hair pattern in the center of the target. The alignment target is in the center of the cross–hair.
- Page 266 12-10 Performance Verification Check 12.With Transparency set at 0% (opaque), use the triangles to drag the horizontal and vertical scan line indicators until they intersect in the very center. This way, they should cross in the center of the circle, which is the alignment target. cáÖìêÉ=NOJS==_äìÉ=~åÇ=j~ÖÉåí~=iáåÉë=`ÉåíÉêÉÇ=çå=^äáÖåãÉåí=q~êÖÉí...
- Page 267 12-11 Performance Verification Check Pass Condition • Pass: After changing the Transparency to 100%, if both scan line indicators pass partially or wholly through the center, the system passes the check. This means the co–alignment of the fundus image and the OCT scan image is within the acceptable range.
- Page 268 • If your observation is confirmed initially, you should remove and re–install the test tool to ensure it is seated properly and then run the check again. • If the system still fails the test, contact Zeiss customer service. In the U.S., call 800– 341–6968. Outside the U.S., contact your local Zeiss distributor.
-
Page 269: 13 Specifications
13-1 HD-OCT Imaging 13 Specifications HD-OCT Imaging Model 500 Model 5000 Methodology Spectral domain OCT Optical source Superluminescent diode (SLD), 840 nm Optical power Nominal 600+/–60 μW at cornea Safety shutoff: maximum 825 μW at cornea Maximum Scan speed 68k A-scans/sec HD-OCT Imaging for Posterior Segment Scans Model 500 Model 5000... -
Page 270: Fundus Imaging
13-2 Fundus Imaging Fundus Imaging Model 500 Model 5000 Methodology Live OCT Line scanning Fundus technology ophthalmoscope Live fundus image During alignment During alignment and during OCT scan Optical source Superluminescent diode (SLD), Superluminescent diode (SLD), 840 nm 750 nm Optical power Nominal: 600+/–60 μW at the <... -
Page 271: Electrical, Physical And Environmental
Not to be used in direct sunlight (e.g., near a window). Maintenance Zeiss recommends regular preventative maintenance. NOTE: Only trained CZMI personnel may perform calibration. Measurement Units All units on the CIRRUS HD-OCT are measured in the SI format. Unless otherwise noted, measurements are made in micrometers (μm). - Page 272 13-4 Electrical, Physical and Environmental 2660021169012 Rev. A 2017-12 CIRRUS HD-OCT User Manual...
-
Page 273: 14 Legal Notices
You own the physical media, CIRRUS HD-OCT, on which the Software is originally or subsequently recorded or fixed, but You understand and agree that Zeiss retains title and ownership to the Software recorded on the original disk copies and all subsequent copies of the Software. -
Page 274: Acknowledgment
Use of the Software with an operating system other than that for which it was designed will not be supported by Zeiss. Zeiss does not claim that the software provided is free from defects and shall have no obligation to supply software upgrades (i.e., new versions, or new, or in–line releases). -
Page 275: A Normative Data Results
Appendix Appendix A: Normative Data Results Overview This chapter may be used in conjunction with the referenced analyses to provide normative references for OCT results. RNFL and Macula Normative Databases: Diversified The CIRRUS HD-OCT RNFL and Macula Normative database contains normative data for retinal nerve fiber layer (RNFL) and macular thickness from healthy subjects ages 19 to 84. -
Page 276: Inclusion And Exclusion Criteria
Appendix Inclusion and Exclusion Criteria Inclusion and exclusion criteria for enrollment in the study were as follows: Inclusion Criteria • Males or females 18 years of age or older. • Able and willing to make the required study visits. • Able and willing to give consent and follow study instructions. •... -
Page 277: Data Collection
Appendix • Normal visual field, indicated by a Glaucoma Hemifield Test within normal limits, and MD and PSD > 5% probability level. Data Collection 284 subjects were qualified as normal subjects and enrolled in this study. 284 subjects were qualified for the RNFL database while 282 subjects were qualified for the Macula normative database (poor scan quality disqualified the macula scans from two subjects). -
Page 278: Data Analysis
Appendix Note that CIRRUS RNFL and Macula normative databases are adjusted only by age, not by ethnicity or any other parameter. The normative limits provided for comparisons of individual data to the normative database do not take into account differences that may be present due to ethnicity, axial length, refraction, optic disc area, or signal strength. -
Page 279: Age Coefficient - Rnfl Thickness
Appendix Age Coefficient – RNFL Thickness Analysis of subject demographics determined that expected thickness was dependent upon age. Thus age correction is incorporated into the calculated results. Subject ethnicity was self–reported by the subjects in the population comprising the normative database but was not used as a variable in constructing the RNFL and macula normative databases. -
Page 280: Description Of Macular Scan Parameters Used In Cirrus Hd-Oct
Appendix cáÖìêÉ=^JP==fåÑÉêáçê=nì~Çê~åí=^îÉê~ÖÉ=okci=qÜáÅâåÉëë=sÉêëìë=^ÖÉ Description of Macular Scan Parameters Used in CIRRUS HD-OCT CIRRUS Macular Scan parameters were derived from the Early Treatment Diabetic Retinopathy Study (ETDRS) Grid below: Central Subfield Retinal Thickness: Average thickness of the retina in a disk–shaped region of 1 mm diameter centered on fovea (Region 1). - Page 281 Appendix Inner Subfield Retinal Thickness: Average thickness of the retina in each inner quadrant of an annulus centered on the fovea with inner 1 mm diameter and outer 3 mm diameter. • Inner Superior Subfield – Region 2 • Inner Inferior Subfield – Region 4 •...
-
Page 282: Age Coefficient - Macula Thickness
Appendix Age Coefficient – Macula Thickness Figure A-4 displays a scatter plot for the Central Subfield retinal thickness average versus age along with the fitted regression line. Figure A-5 displays a scatter plot for the average macular thickness for all subfields along with the fitted regression line. Figure displays a scatter plot for the average macular volume for all subfields along with the fitted regression line. -
Page 283: Conclusion
Appendix cáÖìêÉ=^JS==^îÉê~ÖÉ=j~Åìä~=sçäìãÉ=sÉêëìë=^ÖÉ=Ó=^ää=oÉÖáçåë Conclusion The CIRRUS HD-OCT RNFL and macular thickness normative databases were created using data from subjects that were deemed representative of a normal population. The CIRRUS HD-OCT normative database for RNFL thickness established reference values for the Optic Disc Cube 200x200 scan. -
Page 284: Methods
A-10 Appendix Methods Data Collection In summary, 282 subjects were qualified as normal subjects, enrolled in the NDB study, and included for the RNFL database. Data from the same scans was analyzed and evaluated to determine the normal range of ONH parameters. The normative database does not have subjects with refractive errors outside the –12.00 D to +8.00 D range. -
Page 285: Results
A-11 Appendix Results The descriptive statistics for each optic nerve head parameter are reported in Table A-1 below. Table A-1 Normal Values for CIRRUS ONH measurements in the Sample Population Rim Area Disc Area Average Vertical Volume Minimum 0.720 1.003 0.071 0.058 0.000... -
Page 286: 2Age
A-12 Appendix 2Age The CIRRUS RNFL normative database was developed utilizing 282 subjects aged 19 to 84. Disc Area and Cup Volume showed no effect of Age. The Rim Area decreases slowly with age (slope = –0.002 mm / year, R = 0.033, p = 0.002), while CDR (average and vertical) increased slowly with age (slope = +0.002 per year, R = 0.032, p = 0.002 for average... -
Page 287: Presentation Of Normative Limits
A-13 Appendix Presentation of Normative Limits Figure A-7 shows the ONH and RNFL OU Analysis with normative limits applied to the ONH parameters of Rim Area, Cup to Disc Ratio, Vertical Cup to Disc Ratio, and Cup Volume, as well as to the neuroretinal rim (NR) profile. Because each eye may have a different disc area, the normal limits shown behind the NR profile depend on which eye is selected for comparison. -
Page 288: Report
A-14 Appendix Report The elements shown in the analysis screen in Figure A-7 are presented in a report as well, as shown below. cáÖìêÉ=^JT==lke=~åÇ=okci=lr=^å~äóëáë=oÉéçêí 2660021169012 Rev. A 2017-12 CIRRUS HD-OCT User Manual... -
Page 289: Rnfl And Onh Normative Databases
A-15 Appendix RNFL and ONH Normative Databases The ONH and RNFL OU Analysis supports the clinician in identifying areas of the RNFL that may be of clinical concern by comparing the measured RNFL thickness to age–matched data in the CIRRUS RNFL Normative Databases. Normative data that is age–matched to the patient appears when you perform the "ONH and RNFL OU Analysis"... -
Page 290: Distribution Of Normals
A-16 Appendix Distribution of Normals The gray color, shown in the legend to the left, represents “Not applicable”. Values will be shown in gray when normative data is not applicable because the database has insufficient data to match with the disc area. The Distribution of Normals color scheme is used for both the RNFL and the Optic Nerve Head analysis parameters. - Page 291 A-17 Appendix cáÖìêÉ=^JU==jÉ~ëìêÉãÉåí=s~êá~Äáäáíó=qççäíáé For more information on measurement variability, please see Appendix "CIRRUS HD-OCT Repeatability in Measuring Central Corneal Thickness" on page B-19. If you click the blue icon button you can select Print Preview or Export to DICOM. A Print Preview screen displays the Normative Data Details Report, as shown in Figure A-9 below.
- Page 292 A-18 Appendix cáÖìêÉ=^JV==kçêã~íáîÉ=a~í~=aÉí~áäë=oÉéçêí= 2660021169012 Rev. A 2017-12 CIRRUS HD-OCT User Manual...
-
Page 293: Interactivity
A-19 Appendix Interactivity For both the RNFL Thickness and Neuro–retinal Rim Thickness TSNIT graphs, as shown in Figure A-10, the user can toggle between data for both eyes together, or separately for right eye or left eye. This is done by clicking the gray button in the upper left corner of the Neuro–retinal Rim Thickness graph and RNFL Thickness graph, which will be labeled “OU”, “OD”, or “OS”... -
Page 294: Methods
A-20 Appendix This section summarizes the data collection methodology (also described in the previous section) and further describes the analysis and characteristics of the normative limits for Ganglion Cell Analysis parameters. cáÖìêÉ=^JNN==qóéáÅ~ä=d~åÖäáçå=`Éää=^å~äóëáë=ëÜçïáåÖ=`çãé~êáëçå=íç=kçêã~ä=iáãáíë Methods Data Collection Data collection details are described in “RNFL and Macula Normative Databases: Diversified”... -
Page 295: Data Analysis
A-21 Appendix In practice, clinicians and operators should quantitatively and qualitatively review scans before comparing them to normal ranges. Data Analysis Data was analyzed using the proprietary ganglion cell analysis segmentation algorithm to obtain seven main summary parameters, all expressed in micrometers: Average GCL + IPL thickness, six sectoral thickness values, where the sectors are derived from 60º... -
Page 296: Age
A-22 Appendix were small. Based on R values, age explains only 12% of the variability in some parameters, while signal strength explains no more than 4%. Refractive error and axial length explain less than 2% of variability. For these reasons, only age was used when applying normative limits to Ganglion Cell Analysis parameters. -
Page 297: Axial Length And Refractive Error
A-23 Appendix Axial Length and Refractive Error Figure A-14 below shows a plot of Ganglion Cell Analysis Average Thickness versus axial length of the study eye. It can be seen that GCL + IPL thickness decreases slightly as a function of axial length. This contributes less than 2% of the total variability of the Ganglion Cell Analysis parameters. -
Page 298: Conclusion
4The Asian Normative Database is an optional feature that may not be available in all markets, and when available in a market, may not be activated on all instruments. If you do not have this feature and want to purchase it, contact Carl Zeiss Meditec. In the U.S.A., call 1–877–486–7473;... -
Page 299: Inclusion And Exclusion Criteria
A-25 Appendix Enrolled subjects were representative of healthy individuals with no history of eye disease and were carefully screened and evaluated for eligibility. After undergoing a general ophthalmic examination, qualifying and consented subjects underwent retinal scanning with the CIRRUS HD-OCT instrument. Medical and ophthalmic histories were taken prior to enrolling the subjects in the study. -
Page 300: Data Collection
A-26 Appendix • Evidence of diabetic retinopathy, diabetic macular edema, or other vitreo–retinal disease. Systemic: • History of diabetes, leukemia, AIDS, uncontrolled systemic hypertension, dementia or multiple sclerosis. • A life threatening or debilitating disease. • Current or recent (within the past 14 days) use of an agent with photosensitizing properties by any route (e.g., Visudyne®, ciprofloxacin, Bactrim®, doxycycline, etc.). -
Page 301: The Asian Dataset
A-27 Appendix In practice, clinicians and operators should quantitatively and qualitatively review scans before comparing them to the CIRRUS RNFL or Macula Normative Databases. The normative limits for scans that have poor scan quality should be used with caution. The Asian Dataset The CIRRUS Asian RNFL and Macula Normative Databases were developed utilizing 315 subjects (aged 19–79). -
Page 302: Description Of Rnfl Parameters
A-28 Appendix Description of RNFL Parameters The RNFL Parameters that are compared to normal limits include: • Average RNFL Thickness around a measurement circle with 3.46 mm diameter. • Average RNFL Thickness in 4 quadrants distributed evenly around the measurement circle (Superior, Temporal, Inferior, and Nasal). -
Page 303: Age Coefficient - Macula Thickness
A-29 Appendix Age Coefficient – Macula Thickness The same macular parameters were calculated for the Asian Normative Database as were calculated for the Diversified Normative Database. The full description of the macular scan parameters can be found in "RNFL and Macula Normative Databases: Diversified"... -
Page 304: Normal Values For Ganglion Cell Analyses
A-30 Appendix Normal Values for Ganglion Cell Analyses Post–hoc analysis was performed on the Macular Cube 200x200 and Macular Cube 512x128 cube scans, originally acquired for macular retinal thickness normative data, to determine the typical distribution for Ganglion Cell Analysis parameters and the GCL + IPL thickness map. -
Page 305: Normal Values For Asian Onh Measurements
A-31 Appendix Table A-5 CIRRUS Ganglion Cell Analysis Summary Parameters for Normal Asian Study Eyes (μm) Parameters Mean Minimum Maximum Average Thickness 83.2 67.8 99.5 Minimum Thickness 80.9 63.8 95.2 Temporal–Superior Thickness 82.2 65.0 99.0 Superior Thickness 84.6 62.0 102.0 Nasal–Superior Thickness 85.8 70.0... -
Page 306: Factors That Affect Onh Normative Ranges
A-32 Appendix Table A-7 Disc Size Classification from the Sample Population Disc Size Smallest 1/3 of Discs Medium 1/3 of Discs Largest 1/3 of Discs Classification Disc Area < 1.7 mm 1.7 mm > 2.0 mm to 2.0 mm Factors that Affect ONH Normative Ranges The normal ranges described above do not take into account differences that may be present due to age, ethnicity, axial length, refraction, optic disc area, or signal strength. -
Page 307: Calculation Of Normal Limits
A-33 Appendix The Cup to Disc Ratio (Average and Vertical) as well as the Cup Volume, showed differences among ethnicity groups (mean difference for both ACDR and VCDR was 0.06, p = 0.012, mean difference in Cup Volume was 0.04 mm , p = 0.03). - Page 308 A-34 Appendix 2660021169012 Rev. A 2017-12 CIRRUS HD-OCT User Manual...
-
Page 309: Study 1: Retinal Segmentation And Analysis
Study 1: Retinal Segmentation and Analysis Introduction Zeiss partnered with respected members of the academic and clinical community to study the accuracy and precision of the CIRRUS retinal segmentation algorithm, and to evaluate the agreement between CIRRUS HD-OCT and Stratus OCT, which is the standard of care for diagnosing and managing retinal diseases. -
Page 310: Results And Discussion
Appendix Group 5 – Macular edema for which treatment was planned, Group 6 – No retinal pathology. Any subjects with a primary diagnosis that placed them within Groups 1 through 4, for whom treatment of macular edema was scheduled, were categorized into Group 5. Two (2) 200x200 scans and two (2) 512x128 scans of the study and fellow eyes were acquired using the CIRRUS HD-OCT instrument during a single visit. - Page 311 Appendix Table B-1: Accuracy of Segmentations for RPE layer by Pathology Category 200x200 512x218 Category n/N (%) 95% CI n/N (%) 95% CI 60/70 (85.7%) (77.5%, 91.3%) 62/72 (86.1%) (78.1%, 98.5%) Diabetic Retinopathy 40/42 (95.2%) (86.6%, 98.4%) 41/42 (97.6%) (90.0%, 99.5%) VRI Disorder 27/28 (96.4%) (85.5%, 99.2%)
- Page 312 Appendix Table B-3: Comparison of CIRRUS HD-OCT Central Subfield Mean Thickness to Stratus OCT for the Six Categories 2 - Diabetic Retinopathy 1 - AMD Central Subfield measured on Stratus (um) Central Subfield measured on Stratus (um) 4 - Other Retinal Pathologies 3 - VRI Disorders Central Subfield measured on Stratus (um) Central Subfield measured on Stratus (um)
- Page 313 Appendix images, the identification of layers is different, so the CIRRUS HD-OCT is expected to provide a thicker measurement than the Stratus OCT. cáÖìêÉ=_JN==píê~íìë=l`q=_JëÅ~å=ëÜçïáåÖ=äçÅ~íáçåë=çÑ=omb=~åÇ=fij=ä~óÉêë cáÖìêÉ=_JO==`foorp=eaJl`q=_JëÅ~å=ëÜçïáåÖ=äçÅ~íáçåë=çÑ=omb=~åÇ=fij=ä~óÉêë Because of this difference in segmentation strategy, there is a mean difference in the retinal thickness found by each instrument. Furthermore, because the integrity of the layers sought varies with pathology, the mean difference between instruments varies with pathology, as can be seen in Table...
-
Page 314: Repeatability
Appendix Table B-4: Difference between CIRRUS HD-OCT and Stratus OCT for the Central Subfield Mean Thickness for each of the Six Categories. Mean (SD) Difference CIRRUS – Stratus (μm) CIRRUS Stratus Difference 1 – AMD 271.3 (60.6) 217.7 (54.2) 53.6 (35.0) 2 –... - Page 315 Appendix Table B-5: Repeatability Standard Deviation in micrometers for Central Subfield Measurements using CIRRUS 3.0 for the 200x200 Scan and for the 512x128 Scan. CSMT Repeatability Standard Deviation (μm) 200x200 512x128 17.5 11.6 16.8 13.7 14.4 Other 10.1 13.5 27.2 No disease a.
-
Page 316: Conclusion
Appendix Table B-7: Rate of failure of the Fovea Finding Algorithm by Disease Category Percent of scans with fovea failures Fovea not found Fovea not correct Other No disease Conclusion CIRRUS HD-OCT retinal thickness measurements are accurate and repeatable. Better than 85% of all scans are correctly segmented, even in the presence of pathology. -
Page 317: Study 2: Repeatability And Reproducibility Of Illumination Area Measurements Under The Retinal Pigment Epithelium
Appendix Study 2: Repeatability and Reproducibility of Illumination Area Measurements Under the Retinal Pigment Epithelium The objective of this study was to determine the repeatability and reproducibility of the CIRRUS HD-OCT measurement of illumination areas under the retinal pigment epithelium (RPE). - Page 318 B-10 Appendix The coefficient of variation (CV) is defined as the ratio of the standard deviation to the mean. The coefficient of variation is useful because the standard deviation of data must always be understood in the context of the mean of the data. For the 200x200 scans, the CV for the sub–RPE illumination was 12.5%.
- Page 319 B-11 Appendix For the closest distance to the fovea measurements using the automated algorithm, the repeatability limit of the 200x200 scan was more repeatable compared to the 512x128 scan (0.2070 and 0.3492 mm respectively). Likewise, the reproducibility limit of the 200x200 scan was smaller compared to that of the 512x128 scans (0.2133 and 0.3520 mm respectively) as shown in Table...
-
Page 320: Study 3: Repeatability And Reproducibility Of Macular Retinal Pigment Epithelium Elevation Measurements
B-12 Appendix Study 3: Repeatability and Reproducibility of Macular Retinal Pigment Epithelium Elevation Measurements The objective of this study was to determine the repeatability and reproducibility of the CIRRUS HD-OCT measurements of macular retinal pigment epithelium (RPE) elevation. A total of 50 eyes of 44 subjects were qualified for inclusion into the data analysis. There were 26 qualified eyes for Phase 1 and 24 qualified eyes for Phase 2. - Page 321 B-13 Appendix Table B-12: Repeatability and Reproducibility of Area of RPE Elevations Repeatability Reproducibility Repeatability Repeatability Reproducibility SD Reproducibility SD (mm Limit Limit 200x200 Scan 3mm Circle 0.1295 0.3626 0.1568 0.4389 10.1% 5mm Circle 0.1012 0.2834 0.1455 0.4073 4.9% 512x128 Scan 3mm Circle 0.0837 0.2343...
- Page 322 B-14 Appendix Table B-13: Repeatability and Reproducibility of Volume of RPE Elevations Repeatability Reproducibility Repeatability Repeatability Reproducibility SD Reproducibility SD (mm Limit Limit 200x200 Scan 3mm Circle 0.0117 0.0327 0.0122 0.0341 15.2% 5mm Circle 0.0098 0.0275 0.0106 0.0298 8.3% 512x128 Scan 3mm Circle 0.0074 0.0206...
-
Page 323: Study 4: Repeatability And Reproducibility Of Gca And Onh Parameters
B-15 Appendix Study 4: Repeatability and Reproducibility of GCA and ONH Parameters A study was conducted to determine the repeatability and reproducibility of the Ganglion Cell Analysis (GCA) and Optic Nerve Head (ONH) parameters. Sixty–three (63) subjects were enrolled in this study that was performed in two phases. Phase 1 was inter–operator testing, where four operators (A, B, C, and D) acquired measurements on one CIRRUS HD-OCT unit (C1). - Page 324 B-16 Appendix Table B-14: CIRRUS Repeatability and Reproducibility of GCA and ONH Parameters – Normal Subjects Repeatability Reproducibility Repeatability Reproducibility Repeatability Reproducibility SD Limit Limit μm) GCA Parameters ( Average GCL + IPL Thickness 0.5839 1.6348 0.7479 2.0942 0.7% Minimum GCL + IPL Thickness 2.8630 8.0165 2.8935...
- Page 325 B-17 Appendix A clinical study was conducted with 55 glaucomatous subjects to determine the intra–visit and inter–visit repeatability of CIRRUS HD-OCT optic nerve head parameters. The study was performed in two phases. Phase 1 of the study was designed to determine intra–visit variability, wherein each subject was imaged three times during a single visit on one CIRRUS HD-OCT by one operator.
- Page 326 B-18 Appendix Table B-16: Repeatability of GCA Parameters Measured – Glaucomatous Subjects Repeatability GCA Parameters (μm) Repeatability Repeatability Limit Overall Average GCL + IPL Thickness 0.6274 1.7567 1.0% Minimum GCL + IPL Thickness 1.5246 4.2689 2.6% Temporal–Superior GCL + IPL Thickness 1.2204 3.4171 1.8%...
-
Page 327: Study 5: Anterior Segment Accuracy, Repeatability And Reproducibility
B-19 Appendix Study 5: Anterior Segment Accuracy, Repeatability and Reproducibility Benchtop Scanning Accuracy, Repeatability and Reproducibility Accuracy, repeatability, and reproducibility of scanning in the CIRRUS HD-OCT have been measured in benchtop studies. Table B-17 below summarizes the results for axial dimensions in the basic image geometry. -
Page 328: Performance Of Cirrus Hd-Oct Rnfl Analysis
B-20 Appendix Table B-18: Repeatability and Reproducibility of Central Corneal Thickness (μm) CIRRUS HD-OCT Repeatability CIRRUS HD-OCT Reproducibility Mean Thickness Repeatability Repeatability Reproducibility Reproducibility Phase Phase Overall SD (μm) Limits (μm) SD (μm) Limits (μm) 4.08 11.42 4.23 11.84 544.25 532.25 538.25 a. - Page 329 B-21 Appendix Comparison to Stratus OCT A study of normal subjects and subjects with glaucoma (N = 130) found that although there were differences between Stratus and CIRRUS, the Pearson correlation coefficient for the average RNFL thickness was 0.953, indicating good correlation. However, they also found a systematic difference between CIRRUS and Stratus RNFL measurements.
-
Page 330: Study 6: Cirrus Oct Angiography
B-22 Appendix Study 6: CIRRUS OCT Angiography A series of case studies comparing CIRRUS OCT angiography cube scans of 3x3 mm and 6x6 mm with fluorescein angiography images was completed. The findings demonstrate that the OCT Angiography in combination with OCT intensity-based information (B-scans and en face images) can give non-invasive 3-dimensional information regarding retinal microvasculature in a variety of retinal diseases. -
Page 331: Study 1: Performance Of Pachymetry And Anterior Chamber Scan
Appendix Appendix C: CIRRUS HD-OCT Repeatability and Reproducibility of Anterior Scan Measurements Study 1: Performance of Pachymetry and Anterior Chamber scan measurements in normal corneas and in subjects with corneal pathology, and performance of Pachymetry in post-LASIK subjects, including repeatability, reproducibility, and comparison to Visante Purpose A non-significant risk clinical study was conducted to determine the repeatability and reproducibility of the CIRRUS HD-OCT in measuring Central Corneal Thickness (CCT), Angle... -
Page 332: Post-Lasik Group
Appendix Post-LASIK group Subjects who had undergone uncomplicated LASIK surgery for either myopia or hyperopia within 2 - 24 weeks prior to participating in the study. Exclusion Criteria The study exclusion criteria included subjects with a history of leukemia, AIDS, uncontrolled systemic hypertension, dementia or multiple sclerosis. - Page 333 Appendix Tables 4 and 5 show the mean difference in CCT, ATA, ACD and Pachymetry measurements between the CIRRUS HD-OCT Model 5000 and Visante OCT for the Normal Cornea and Corneal Pathology groups. Table 6 shows the Pachymetry measurements of the Post-LASIK group, comparing the results from the CIRRUS HD-OCT Model 5000 and Visante OCT.
- Page 334 Appendix Table C-2: Repeatability and Reproducibility of CIRRUS HD-OCT 5000 Corneal Pathology Group Scan Type Repeatability Reproducibility Parameter Mean Limit Limit Wide Angle to Angle 532.1 12.061 33.772 2.267 18.951 53.061 3.561 Angle to Angle 12.363 0.175 0.491 1.418 0.247 0.693 2.002 3.060...
- Page 335 Appendix Table C-3: Repeatability and Reproducibility of CIRRUS HD-OCT 5000 Post-LASIK Group Scan Type Repeatability Reproducibility Parameter Mean Limit Limit Pachymetry Center 465.1 1.784 4.994 0.383 2.068 5.791 0.445 Inner Nasal 514.8 6.912 19.355 1.343 6.912 19.355 1.343 Inner Superior 508.8 4.785 13.398...
- Page 336 Appendix Table C-4: Mean Difference between CIRRUS HD-OCT 5000 and Visante OCT for the Normal Cornea Group Scan Type CIRRUS Visante Difference 95% CI 95% LOA Parameter Mean (SD) Mean (SD) Mean (SD) Mean Difference p-value Mean Difference Anterior Chamber 551.5 (33.9) 537.8 (33.8) 13.7 (16.7)
- Page 337 Appendix Table C-5: Mean Difference between CIRRUS HD-OCT 5000 and Visante OCT for the Corneal Pathology Group Scan Type CIRRUS Visante Difference 95% CI 95% LOA Parameter Mean (SD) Mean (SD) Mean (SD) Mean Difference p-value Mean Difference Anterior Chamber 538.2 (53.4) 511.4 (55.0) 26.8 (26.9)
- Page 338 Appendix Table C-6: Mean Difference between CIRRUS HD-OCT 5000 and Visante OCT for the Post-LASIK Group Scan Type CIRRUS Visante Difference 95% CI 95% LOA Parameter Mean (SD) Mean (SD) Mean (SD) Mean Difference p-value Mean Difference Pachymetry Center 465.6 (44.3) 463.7 (44.8) 1.8 (6.1) -0.1, 3.8...
- Page 339 Appendix Study 2: Repeatability and reproducibility of Wide Angle to Angle and HD Angle scan measurements in subjects with glaucoma, including repeatability, reproducibility, and comparison to Visante Purpose A non-significant risk clinical study was conducted to determine the repeatability and reproducibility of the CIRRUS HD-OCT instrument's measurements of Anterior Chamber Angle (ACA), Trabecular Iris Space Area (TISA), Angle Opening Distance (AOD) and Scleral Spur Angle (SSA).
- Page 340 C-10 Appendix The data was taken on a total of 26 eyes for the Wide Angle to Angle scan and 27 eyes for the HD Angle scan measured by three operators on three CIRRUS 5000 devices and by a single operator on the Visante OCT. The first qualified CIRRUS scan from any of the three CIRRUS 5000 devices was used for comparison with the first qualified Visante scan.
- Page 341 C-11 Appendix Table C-7: Repeatability and Reproducibility of CIRRUS HD-OCT 5000 Scan Type Repeatability Reproducibility Parameter Mean Limit Limit Wide Angle to Angle TISA 500 Nasal 0.151 0.025 0.071 16.801 0.030 0.083 19.614 TISA 750 Nasal 0.263 0.028 0.080 10.827 0.037 0.103 14.053...
- Page 342 C-12 Appendix Table C-8: Mean Difference between CIRRUS HD-OCT 5000 and Visante OCT Scan Type CIRRUS Visante Difference 95% CI 95% LOA Parameter Mean (SD) Mean (SD) Mean (SD) Mean Difference p-value Mean Difference Wide Angle to Angle Nasal 26 36.054 (18.137) 38.831 (18.272) -2.777 (5.665) -5.065, -0.488 0.019 -14.107, 8.554 Temporal 26 35.255 (18.767) 38.573 (18.385) -3.318 (6.493) -5.940, -0.695 0.015...
- Page 343 Index Numerics Anterior Segment Cube 512x128 3-D Surface Maps Scan analysis 8-49 3D Visualization Anterior Segment Scans Animation Editor Fixation target 8-63 5-12 AutoRecord Keyframes HD Angle 8-65 Clip Selector Instrument Imaging Process 8-62 Movie recording Scan Review 8-64 7-11 Transparent Surfaces Archive 8-67...
- Page 344 Choroid Slab CIRRUS OCT Angiography Presets 6-26 Cleaning Edit Categories 12-2 External Surfaces of the Instrument Edit Layers button 12-3 8-10 Forehead and Chinrests Edit Segmentation dialog 12-3 8-10 Imaging Aperture Lens and External Lenses Edit Staff Records 12-3 LCD (Monitor) Screen Electromagnetic Compatibility (EMC) 12-3 1-10...
- Page 345 Overlay Options Privacy and Data Integrity Features 8-69 11-1 Quality indicator Inner limiting membrane (ILM) 8-69 Reviewing for Quality Institution Edit 6-31 Fundus Viewport Institution Logo, add to printouts 6-25 Instrument Status 3-10 Internet Connectivity Risks Ganglion Cell Internet protocol versions 4-11 Guided Progression Analysis 8-38...
- Page 346 Organization Obscured Patients 11-1 11-3 Measurement Units OCT Angiography 13-3 Medical staff records, not case-sensitive Current View References Menu Items and Descriptions Remove Projections Merge Two Patients Omit Patient Identifiers 11-1 11-3 MM-DD-YYYY format ONH and RNFL OU Analysis Modality for CIRRUS Deviation from Normal Map 11-7 8-29...
- Page 347 Patient experience time required Rapid Refresh View 5-11 6-27 Patient Health Information Rate of Change 8-33 Patient Privacy Rear Connectors Illustrated 11-1 12-2 Omitting patient identification Red status 11-1 11-3 3-10 Patient Record Refractive error 6-24 Registration Review button 10-3 8-15 Performance Verification Check Repeat Scan dialog...
- Page 348 Show/Hide Layers button Status components 8-71 3-10 Signal Quality Stock Print 10-15 Signal Strength Indicator Sub-RPE Preset 6-32 Single Eye Summary Symbols and Labels 8-58 Slab 8-70 Slice and Slab Options 8-70 Tag All button 10-7 Slope 8-33 Tag for print 10-6 Software and Storage Media Tagged Images...
- Page 349 Log file Power problems 12-1 TSNIT labels 8-61 TSNIT Progression Graph 8-36 8-39 TSNIT Thickness Graphs 8-30 Updating Windows 13-3 User Manual Online Organization Users Verification check 12-6 Verification Test Tool 12-6 Version information View Licenses View Today’s Patients Tab Whole Eye Slab Whole Retina Slab Wide Angle to Angle...
- Page 350 CIRRUS HD-OCT User Manual 2660021169012 Rev. A 2017-12...
- Page 351 CIRRUS HD-OCT User Manual 2660021169012 Rev. A 2017-12...
- Page 352 Carl Zeiss Meditec, Inc. Carl Zeiss Meditec AG 5160 Hacienda Drive Goeschwitzer Strasse 51–52 Dublin, CA 94568 07745 Jena Germany Toll Free: 1–800–341–6968 Phone: +49 36 41 22 03 33 Phone: 1–925–557–4100 2660021169012 Rev. A 2017-12 Fax: +49 36 41 22 01 12 Fax: 1–925–557–4101...
Need help?
Do you have a question about the CIRRUS HD-OCT 500 and is the answer not in the manual?
Questions and answers
Does this machine have a way to test for Dense Cataracts
The context does not mention that the Zeiss CIRRUS HD-OCT 500 has a specific feature to test for dense cataracts. It is used for SD-OCT imaging and macular evaluation, but no feature for testing dense cataracts is described.
This answer is automatically generated
How do you back up to an external hard drive? Need detailed answer please as I **** computer illerate. We have the Zeiss Cirrus HD 4000?
The manual does not explicitly describe the process of backing up data from the Zeiss Cirrus HD-OCT 500 to an external hard drive. However, it does mention archiving data to a network-attached storage device or keeping paper records as a backup. It also provides instructions for exporting audit log files, which may be useful for data backup. To export audit log files:
1. Log on as an administrator.
2. Click Tools > Export Audit Log File.
3. In the Browse For Folder window, select the destination folder on the external hard drive.
4. Click Save to export the log as a .zip file.
For a full data backup, it is recommended to consult Zeiss service personnel for proper procedures.
This answer is automatically generated
How do I measure the center thickness on OCTA on Zeiss 5000?
The Zeiss CIRRUS HD-OCT 500 measures central corneal thickness (CCT) using OCT imaging. The device provides pachymetry scans for this purpose. To measure CCT:
1. Use the Pachymetry Scan mode available on the CIRRUS HD-OCT 500.
2. Ensure proper alignment by centering the scan lines correctly.
3. Follow the on-screen instructions to capture the scan.
4. The device will generate a measurement, which may differ slightly from ultrasound pachymetry.
OCT devices generally measure thinner than ultrasound pachymetry, with a reported mean difference of approximately -9.06 μm.
This answer is automatically generated