Table of Contents
Advertisement
Quick Links
Getting started with software and firmware environments
1
Introduction
This document describes the software, firmware environment and development
recommendations required to build an application around the STM32F4DISCOVERY board.
It presents the firmware applications package provided within this board with details on its
architecture and contents. It provides guidelines to novice users on how to build and run a
sample application and allows them to create and build their own application.
This document is structured as follows:
■
System requirements to use this board and how to run the built-in demonstration are
provided in
■
Section 3
■
Section 5
interface.
■
Section
development toolchains:
– IAR Embedded Workbench® for ARM (EWARM) by IAR Systems
– Microcontroller Development Kit for ARM (MDK-ARM) by Keil™
– TrueSTUDIO® by Atollic
– TASKING VX-toolset for ARM Cortex by Altium
Although this user manual cannot cover all the topics relevant to software development
environments; it demonstrates the first basic steps necessary to get started with the
compilers/debuggers.
Reference documents
■
STM32F4DISCOVERY high-performance discovery board data brief
■
STM32F4DISCOVERY peripherals firmware examples (AN3983)
■
STM32F40x reference manual (RM0090)
■
STM32F405xx STM32F407xx datasheet
The above documents are available at www.st.com/stm32f4-discovery.
September 2011
Section 2: Getting
describes the firmware applications package.
presents development toolchain installation and overview of ST-LINK/V2
6,
Section
7,
Section
8, and
Doc ID 022172 Rev 1
for the STM32F4DISCOVERY Kit
started.
Section 9
introduce how to use the following software
UM1467
User manual
www.st.com
1/46
Advertisement
Table of Contents

Subscribe to Our Youtube Channel
Related Manuals for ST STM32F4DISCOVERY


Summary of Contents for ST STM32F4DISCOVERY
-
Page 1: Introduction
Introduction This document describes the software, firmware environment and development recommendations required to build an application around the STM32F4DISCOVERY board. It presents the firmware applications package provided within this board with details on its architecture and contents. It provides guidelines to novice users on how to build and run a sample application and allows them to create and build their own application. -
Page 2: Table Of Contents
Binary images for reprogramming firmware applications ..9 ST-LINK/V2 installation and development ..... . . 10 Using IAR Embedded Workbench®... - Page 3 Contents UM1467 7.3.1 Managing source files ........23 7.3.2 Configuring project options .
-
Page 4: Getting Started
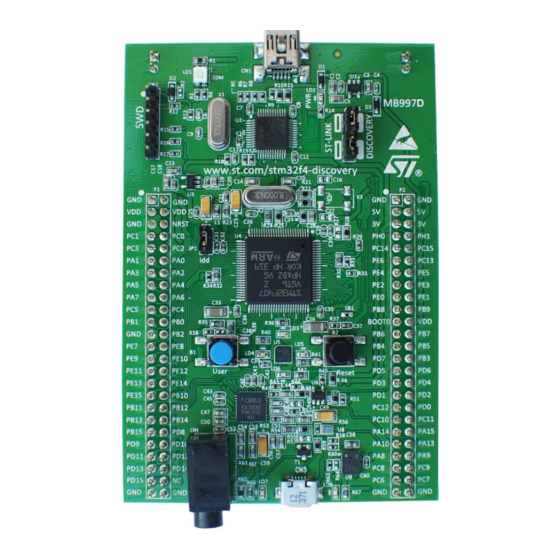
Before running your application, you should establish the connection with the STM32F4DISCOVERY board as following. Figure 1. Hardware environment To run and develop any firmware applications on your STM32F4DISCOVERY board, the minimum requirements are as follows: – Windows PC (2000, XP, Vista, 7) –... -
Page 5: Running The Built-In Demonstration
Check jumper position on the board, JP1 on, CN3 on (Discovery selected). – Connect the STM32F4DISCOVERY board to a PC with a 'USB type A to Mini-B' cable through USB connector CN1 to power the board. Red LED LD2 (PWR) then lights up. -
Page 6: Description Of The Firmware Package
Description of the firmware package Description of the firmware package The STM32F4DISCOVERY firmware applications are provided in one single package and supplied in one single zip file. The extraction of the zip file generates one folder, STM32F4-Discovery_FW_VX.Y.Z, which contains the following subfolders: Figure 2. -
Page 7: Stm32_Usb_Device_Library Subfolder
The stm32f4xx_ppp.c file contains all the firmware functions required to use the PPP peripheral. Project folder This folder contains the source files of the STM32F4DISCOVERY firmware applications. 3.2.1 Demonstration subfolder This subfolder contains the demonstration source files with preconfigured project for EWARM, MDK-ARM, TrueSTUDIO and TASKING toolchains. -
Page 8: Master_Workspace Subfolder
Section 5 STM32F4DISCOVERY peripheral firmware examples, AN3983, for further details. Utilities folder This folder contains the abstraction layer for the STM32F4DISCOVERY hardware. It provides the following drivers: – stm32f4_discovery.c: provides functions to manage the user push button and 4 LEDs (LD3.LD6) -
Page 9: Binary Images For Reprogramming Firmware Applications
● Using “in-system programming tool” – Connect the STM32F4DISCOVERY board to a PC with a 'USB type A to Mini-B' cable through USB connector CN1 to power the board. – Make sure that the embedded ST-LINK/V2 is configured for in-system programming (both CN3 jumpers ON). -
Page 10: St-Link/V2 Installation And Development
The toolchain is installed by default in the C:\Keil directory on the PC’s local hard disk; the installer creates a start menu µVision4 shortcut. When connecting the ST-LINK/V2 tool, the PC detects new hardware and asks to install the ST-LINK_V2_USB driver. The “Found New Hardware wizard” appears and guides you through the steps needed to install the driver from the recommended location. -
Page 11: Using Iar Embedded Workbench® For Arm
Using IAR Embedded Workbench® for ARM UM1467 Using IAR Embedded Workbench® for ARM Building an existing EWARM project The following is the procedure for building an existing EWARM project. Open the IAR Embedded Workbench® for ARM (EWARM). Figure 3 shows the basic names of the windows referred to in this document. Figure 3. -
Page 12: Debugging And Running Your Ewarm Project
UM1467 Using IAR Embedded Workbench® for ARM If your project is successfully compiled, the following window in Figure 4 is displayed. Figure 4. EWARM project successfully compiled Debugging and running your EWARM project In the IAR Embedded Workbench IDE, from the Project menu, select Download and Debug or, alternatively, click the Download and Debug button the in toolbar, to program the Flash memory and begin debugging. - Page 13 Using IAR Embedded Workbench® for ARM UM1467 Figure 6. IAR Embedded Workbench debugger screen To run your application, from the Debug menu, select Go. Alternatively, click the Go button in the toolbar to run your application. Figure 7. Go button 13/46 Doc ID 022172 Rev 1...
-
Page 14: Creating Your First Application Using The Ewarm Toolchain
UM1467 Using IAR Embedded Workbench® for ARM Creating your first application using the EWARM toolchain 6.3.1 Managing source files Follow these steps to manage source files. In the Project menu, select Create New Project and click OK to save your settings. Figure 8. - Page 15 Using IAR Embedded Workbench® for ARM UM1467 The IAR Embedded Workbench enables C color syntax highlighting when you save your file using the dialog File > Save As… under a filename with the *.c extension. In Figure 10: main.c example file, the file is saved as main.c.
-
Page 16: Configuring Project Options
Options dialog box as in Figure Figure 13. Configuring project options In the Options dialog box, select the General Options category, open the Target tab and select Device - ST -STM32F4xx. Figure 14. General options > Target tab Doc ID 022172 Rev 1 16/46... - Page 17 Using IAR Embedded Workbench® for ARM UM1467 Select the Linker category, open the Config tab, in the Linker configuration file pane select Override default and click Edit to display the Linker configuration file editor. Figure 15. Linker > Config tab In the Linker configuration file editor dialog box, open the Vector Table tab and set the .intvec.start variable to 0x08000000.
- Page 18 Figure 18. C/C++ Compiler > Preprocessor tab To set up the ST-Link embedded debug tool interface, select the Debugger category, open the Setup tab and from the drop-down Driver menu, select ST-Link as shown in Figure Figure 19. Debugger > Setup tab...
- Page 19 Using IAR Embedded Workbench® for ARM UM1467 10. Select the ST-Link category, open the ST-Link tab and select SWD as the connection protocol as shown in Figure Figure 21. ST-Link communication protocol 11. Click OK to save the project settings.
-
Page 20: Using Mdk-Arm Microcontroller Development Kit By Keil
UM1467 Using MDK-ARM Microcontroller Development Kit by Keil™ Using MDK-ARM Microcontroller Development Kit by Keil™ Building an existing MDK-ARM project Follow these steps to build an existing MDK-ARM project. Open the MDK-ARM µVision4 IDE, debugger, and simulation environment. Figure 22: MDK-ARM µVision4 IDE environment shows the basic names of the windows referred to in this section. -
Page 21: Debugging And Running Your Mdk-Arm Project
Using MDK-ARM Microcontroller Development Kit by Keil™ UM1467 If your project is successfully compiled, the following Build Output window (Figure 23: Build Output - MDK-ARM µVision4 project successfully compiled) is displayed. Figure 23. Build Output - MDK-ARM µVision4 project successfully compiled Debugging and running your MDK-ARM project In the MDK-ARM µVision4 IDE, click the magnifying glass to program the Flash memory and begin debugging as shown below in... - Page 22 UM1467 Using MDK-ARM Microcontroller Development Kit by Keil™ The debugger in the MDK-ARM IDE can be used to debug source code at C and assembly levels, set breakpoints, monitor individual variables and watch events during the code execution as shown below in Figure Figure 25.
-
Page 23: Creating Your First Application Using The Mdk-Arm Toolchain
Device selection dialog box. Select the device used for testing. In this example, we will use the STMicroelectronics device mounted on the STM32F4DISCOVERY board. In this case, double-click on STMicroelectronics, select the STM32F407VGT6 device and click OK to save your settings. - Page 24 UM1467 Using MDK-ARM Microcontroller Development Kit by Keil™ To create a new source file, in the File menu, select New to open an empty editor window where you can enter your source code. The MDK-ARM toolchain enables C color syntax highlighting when you save your file using the dialog File >...
-
Page 25: Configuring Project Options
Figure Figure 32. Target Options dialog box - Target tab Open the Debug tab, click Use and select the ST-Link Debugger. Then, click Settings and select the SWD protocol. Click OK to save the ST-Link setup settings. Select Run to main(). - Page 26 Figure 33. Target Options dialog box - Debug tab Open the Utilities tab, select Use Target Driver for Flash Programming and select the ST-Link Debugger from the drop-down menu. Verify that the Update Target before Debugging option is selected. Click OK to save your settings.
- Page 27 UM1467 Figure 35. MDK-ARM µVision4 project successfully built 10. Before running your application, establish the connection with the STM32F4DISCOVERY board as described in Section 2: Getting started. 11. To program the Flash memory and begin debugging, follow the instructions given in Section 6.2: Debugging and running your EWARM project on page...
-
Page 28: Using Atollic Truestudio
Figure 37. Atollic TrueSTUDIO®/STM32 Lite welcome screen The TrueSTUDIO Discovery workspace contains a demo project for the STM32F4DISCOVERY kit. To load this project, in the File menu, select Import... to display the Import dialog box. Doc ID 022172 Rev 1... - Page 29 Using Atollic TrueSTUDIO® UM1467 In the Import window, open General, select Existing Projects into Workspace and click Next. Figure 38. Atollic TrueSTUDIO®/STM32 Lite import source select dialog box Click Select root directory, browse to the TrueSTUDIO workspace folder and select the STM32F4-Discovery project.
- Page 30 UM1467 Using Atollic TrueSTUDIO® Figure 39. Atollic TrueSTUDIO®/STM32 Lite import projects dialog box In the Projects pane, select the STM32F4-Discovery and click Finish. In the Project Explorer, select the STM32F4-Discovery project. Open the Project menu, and click Build Project. If your project is successfully compiled, the following window is displayed. Figure 40.
-
Page 31: Debugging And Running Your Truestudio Project
Using Atollic TrueSTUDIO® UM1467 Debugging and running your TrueSTUDIO project In the Project Explorer, select the STM32F4-Discovery project and press F11 to display the Debug Configuration dialog box. Figure 41. TrueSTUDIO Debug Configuration dialog box In the Main tab, configure the project as shown in Figure 41 and click OK to save your settings and to program the Flash memory and begin debugging. -
Page 32: Creating Your First Application Using Truestudio Toolchain
(startup file, firmware library, etc.) are added to the workspace and sample files are generated in the project folder to simplify development. The debug settings are automatically configured by selecting STM32F4DISCOVERY as the evaluation board. - Page 33 Using Atollic TrueSTUDIO® UM1467 Figure 43. TrueSTUDIO workspace launcher dialog box When the Atollic TrueSTUDIO® displays its Welcome window, click Start using TrueSTUDIO to open the main window. In the File menu, select New and click C Project. Name the new project, in the Project type pane select STM32 C Project and click Next.
- Page 34 ● Connection: Serial Wire Debug (SWD). Verify that the JTAG Probe is ST-LINK and click Finish to confirm your settings. Figure 46. TrueSTUDIO® Misc Settings dialog box Your project is successfully created. Atollic TrueSTUDIO® generates target specific sample files (main.c, stm32f4xx_it.c...) in the Project folder to simplify development.
- Page 35 Your project is successfully compiled. Figure 47. TrueSTUDIO® project successfully built Before running your application, establish the connection with the STM32F4DISCOVERY board as described in Section 2: Getting started. To program the Flash memory and begin debugging, follow the instructions given in Section 8.2:...
-
Page 36: Using Tasking
Workspace location. Figure 48. TASKING workspace launcher dialog box Browse to select the STM32F4DISCOVERY Demonstration TASKING workspace and click OK to save your settings and to display the Welcome screen. To start using TASKING, click Go to the workbench. - Page 37 UM1467 The TASKING Discovery workspace contains a demo project for the STM32F4DISCOVERY kit. To load this project, in the File menu, select Import... to display the Import dialog box. In the Import window, open General, select Existing Projects into Workspace and click Next.
- Page 38 UM1467 Using TASKING Click Select root directory, browse to the TASKING workspace folder and select the STM32F4-Discovery project. Figure 51. TASKING import projects dialog box In the Projects window, select the STM32F4-Discovery and click Finish. In the Project Explorer, select the STM32F4-Discovery project. Open the Project menu, and click Build Project.
- Page 39 Using TASKING UM1467 If your project is successfully compiled, the following window is displayed. Figure 52. TASKING project successfully compiled 39/46 Doc ID 022172 Rev 1...
-
Page 40: Debugging And Running Your Tasking Project
UM1467 Using TASKING Debugging and running your TASKING project Figure 53 shows the first step for debugging and running your TASKING project. From the project toolbar menu select Debug > Debug STM32F4-Discovery_Demo. Figure 53. TASKING debug window The debugger in TASKING can be used to debug source code at C and assembly levels, set breakpoints, monitor individual variables and watch events during the code execution. -
Page 41: Creating Your First Application Using Tasking Toolchain
Using TASKING UM1467 Creating your first application using TASKING toolchain The debug session is launched as follows: Open TASKING VX-Toolset for ARM Cortex. The program launches and asks for the Workspace location. Browse to select an existing workspace, or enter a new workspace location and click OK to confirm. - Page 42 Choosing STMicroelectronics STM32F4 Manta Discovery Kit as the evaluation board, will add automatically the needed linker file and will configure the project as follows: ● Microcontroller: STM32F407VGT6 ● Debug probe: ST-LINK ● Connection: Serial Wire Debugging (SWD). Figure 57. Debug configuration Doc ID 022172 Rev 1 42/46...
- Page 43 Using TASKING UM1467 To add source file to your project right click on the project from the C/C++ project window and select Import. The Import dialog box is displayed, select General and the desired file as shown in Figure 58: TASKING Import dialog box Figure 58.
- Page 44 To build your project click on Project > Build Project from the toolbar menu. Your Project is successfully compiled. Figure 60. Tasking project successfully built 10. Before running your application, establish the connection with the STM32F4DISCOVERY board as described in Section 2: Getting started. Doc ID 022172 Rev 1...
-
Page 45: Revision History
Revision history UM1467 Revision history Table 1. Document revision history Date Revision Changes 23-Sep-2011 Initial release. 45/46 Doc ID 022172 Rev 1... - Page 46 No license, express or implied, by estoppel or otherwise, to any intellectual property rights is granted under this document. If any part of this document refers to any third party products or services it shall not be deemed a license grant by ST for the use of such third party products or services, or any intellectual property contained therein or considered as a warranty covering the use in any manner whatsoever of such third party products or services or any intellectual property contained therein.
Need help?
Do you have a question about the STM32F4DISCOVERY and is the answer not in the manual?
Questions and answers