Table of Contents
Advertisement
Quick Links
OneTouch
Visit us at www.TestEquipmentDepot.com
Released 04/01/2017
©2017 NETSCOUT SYSTEMS, Inc. All Rights Reserved.
All product names are trademarks of their respective companies.
Network Assistant
99 Washington Street
Melrose, MA 02176
Phone 781-665-1400
Toll Free 1-800-517-8431
AT 10G
™
User Manual
Advertisement
Table of Contents

Related Manuals for Netscout OneTouch AT 10G


Summary of Contents for Netscout OneTouch AT 10G
- Page 1 AT 10G ™ Network Assistant User Manual 99 Washington Street Melrose, MA 02176 Phone 781-665-1400 Toll Free 1-800-517-8431 Visit us at www.TestEquipmentDepot.com Released 04/01/2017 ©2017 NETSCOUT SYSTEMS, Inc. All Rights Reserved. All product names are trademarks of their respective companies.
- Page 2 GPL license ("GPL Compatible License"). In accordance with the terms of the GNU GPL, NETSCOUT will make available a complete, machine- readable copy of the source code components of this product covered by the GPL or applicable GPL Compatible License, if any, upon receipt of a written request.
-
Page 3: Table Of Contents
Contents Chapter 1: Get Acquainted Overview of Features .............13 Safety Information ............15 Contact NETSCOUT ............17 Additional Resources .............17 AC Adapter and Battery ..........17 Charge the Battery ..........18 Switch the Power On ..........18 Set the Language ............18 Check the Battery Status .........18 Extend Battery Operating Time ......19... - Page 4 More About AutoTest ........... 60 Next Steps ..............61 View Other Test Results .......... 61 Run Path Analysis, Browse to, or Telnet/SSH to a Test’s Target Server ......... 61 Configure the OneTouch AT 10G Analyzer to Use SNMP ............62...
- Page 5 Store Your Test Setup in a Profile ......62 See IPv6 Results ............62 Generate a Report ...........62 Set Up Remote Control of the Analyzer ....62 Chapter 4: Network Infrastructure Tests OneTouch AT 10G Instrument ........63 Cable Test ..............66 Copper Cable Test ...........66 Fiber Cable Diagnostics ...........69 Link Test ..............69...
- Page 6 Purpose ..............101 Configuration ............101 To Configure a OneTouch AT Analyzer as a Peer 105 To Configure a OneTouch AT 10G Analyzer as the Source ............107 To Configure a LinkRunner 2000 as a Reflector . 108 Run the Test ............110 How it Works ............
- Page 7 Contents Chapter 6: Profiles Asterisk (*) After the Profile Name ......140 Open the Profiles Screen ..........140 Save a Profile ..............140 Load a Profile ...............141 Rename or Delete a Profile .........141 Export and Import Profiles ..........141 View a Profile File ............143 Editing Profiles .............143 Chapter 7: Wired Analysis...
- Page 8 OneTouch AT 10G User Manual Upload AutoTest Results: ........176 Periodic AutoTest ..........176 Cloud Remote: ............177 Unit Name: ............177 Testing Tools ..............178 Capture ..............178 Performance Peer ..........178 Browser ..............178 Telnet/SSH ............. 179 Flash Port ............... 180 FiberInspector ............
- Page 9 Contents Filters Perform a Logical AND Operation ....202 Packet Capture Speed and Dropped Frames ..202 SD Card ..............203 Connecting for Packet Capture ........203 Configuring and Running Packet Capture ....203 Start Packet Capture ............205 Stop Packet Capture ............206 AutoTest Capture ............207 To Enable or Disable AutoTest Capture ....207 To Save an AutoTest Capture .......207 Managing Capture Files ..........208...
- Page 10 OneTouch AT 10G User Manual Claiming Your Unit ..........226 Setting up Periodic AutoTest ....... 227 Naming your OneTouch AT 10G ......230 Remote Access from the Cloud ........230 Preparing Your Unit for Remote Access ....230 Chapter 13: Specifications Environmental and Regulatory Specifications ..
- Page 11 Top End View - Connectors ............26 Top End View - LEDs ............... 27 Battery Compartment..............28 Kensington Security Slot ..............28 The OneTouch AT 10G Home Screen..........29 Keyboards for Text Entry..............35 Keyboard for URL Entry..............36 Keyboard for IPv4 Address Entry ............ 37 Keyboard for IPv6 Address Entry ............
- Page 12 OneTouch AT 10G User Manual TCP Test Results................90 Web (HTTP) Test Results ..............94 FTP Test Results ................99 1G Wired Performance Test Setup Tab......... 103 1G Wired Performance Test (RFC 2544) Performance Peer Screen............... 107 1G Wired Performance Test (RFC 2544) Results...
- Page 13 Figures Capture Filters - Logical AND Operation ........202 Single-Ended Packet Capture............203 The Wired CAPTURE Screen ............204 Wired Capture Results ..............206 The Three File Manager Screens ........... 210 SAVE AS Screen ................211 Manage Profiles Screen ..............212 File Manager - Export File Tree.............
- Page 14 OneTouch AT 10G User Manual...
-
Page 15: Chapter 1: Get Acquainted
Test up to 10G in the network data center Use NETSCOUT cloud endpoints to test network performance The OneTouch AT 10G analyzer answers questions such as: Can I connect to the network? Are the ports on my 10G switch working? Are basic services such as DHCP and DNS operational? ... - Page 16 OneTouch AT 10G User Manual The analyzer features: User-configurable tests User-configurable Profiles Complete L1/L2 measurements across copper/RJ45 Ethernet media Network services measurements USB Type A port Wired Performance tests using a Peer or Reflector Built-in 10/100M management port and optional Wi-Fi ...
-
Page 17: Safety Information
Chapter 1: Get Acquainted Safety Information Safety Information Table 1 shows the international electrical symbols used on the analyzer or in this manual. Table 1. Symbols Warning or Caution: Risk of damage or destruction to equipment or software. See explanations in the manuals. Warning: Risk of fire, electric shock, or personal injury. - Page 18 Do not short the battery terminals together. For Products with rechargeable batteries, use only AC adapters approved by NETSCOUT for use with the Product to supply power to the Product and charge the battery. Warning: Class 1 and Class 2 Laser Products To Prevent eye damage and personal injury: ...
-
Page 19: Contact Netscout
Use the correct cables and connectors when connecting the Product to a network. Do not block or restrict the Product’s air intake or exhaust ports. Contact NETSCOUT For more contact information, go to our website. http://enterprise.netscout.com customercare@netscout.com Toll free: +1-844-833-3713 International: 978-320-2150... -
Page 20: Charge The Battery
OneTouch AT 10G User Manual Charge the Battery Before you use the battery for the first time, charge the battery for about 2 hours with the analyzer turned off. A fully-charged battery operates for approximately 4 hours of typical use. The battery typically takes approximately 4 hours to recharge from 10% to 90% when the analyzer is turned off. -
Page 21: Extend Battery Operating Time
Chapter 1: Get Acquainted AC Adapter and Battery or too low to permit charging, the AC Power Indicator turns yellow. To see more information about the battery status, tap the Tools icon , then scroll down and tap the Battery Status button. Extend Battery Operating Time The display backlight consumes power. -
Page 22: Install And Use The Strap
GVO013.EPS Figure 1. Install and Use the Hang Strap OneTouch Platform The OneTouch platform is a handheld computer and display platform that accepts modules like the OneTouch AT 10G module. The modules attach to the system as shown. -
Page 23: Remove And Install A Module
Chapter 1: Get Acquainted Connectors, Keys, and LEDs Remove and Install a Module Switch off the analyzer’s power before removing the module. GVO004.EPS Figure 2. Remove and Install a Module Connectors, Keys, and LEDs This section describes the external characteristics of the OneTouch AT 10G hardware platform. -
Page 24: Features Of The Main Unit
OneTouch AT 10G User Manual GVO005.EPS Figure 3. Features of the Main Unit LCD display with touch-screen - To change the brightness, tap ToolsDisplay. See also: “Touchscreen” on page - Press this key to go to the Home screen. See “The HOME ... -
Page 25: Left Side View
Chapter 1: Get Acquainted Connectors, Keys, and LEDs Power Key - The Power Key illuminates when you switch the power on. Press it again to switch the power off. See also: “AC Adapter and Battery” on page ... -
Page 26: Right Side View
OneTouch AT 10G User Manual Power Connector - Connect the supplied AC adapter to a power source and to the OneTouch analyzer. See “AC Adapter and Battery” on page AC Power Indicator - This LED is red while the battery is ... -
Page 27: Insert The Sd Card
Chapter 1: Get Acquainted Connectors, Keys, and LEDs SD Card Slot - This is for inserting an SD card. You can manage files on an SD card. See Chapter 10: "Managing Files," beginning on page 209. GVO015.EPS Figure 6. Insert the SD Card You do not need to software-eject the SD card before removing it. -
Page 28: Top End View - Connectors
Figure 7. Top End View - Connectors Fiber Port (SFP / SFP+ receptacle) Wired Ethernet Port (RJ-45 connector) The OneTouch AT 10G analyzer has two ports used for network testing: 10/100/1000M RJ-45 Ethernet connector (for copper connection) 1000M and 10G standard SFP+ socket (for fiber ... -
Page 29: Top End View - Led
Chapter 1: Get Acquainted Connectors, Keys, and LEDs The management port and each network test ports have two LEDs: “Link” and “Activity.” GVO008.EPS Figure 8. Top End View - LEDs ACT - Activity LEDs Link - Link LEDs ... -
Page 30: Battery Compartment
OneTouch AT 10G User Manual GVO012.EPS Figure 9. Battery Compartment Battery Compartment - The battery pack can be replaced. See “Remove and Install the Battery” on page 222. GVO016.EPS Figure 10. Kensington Security Slot Kensington Security Slot - You can attach a Kensington security ... -
Page 31: The Home Screen
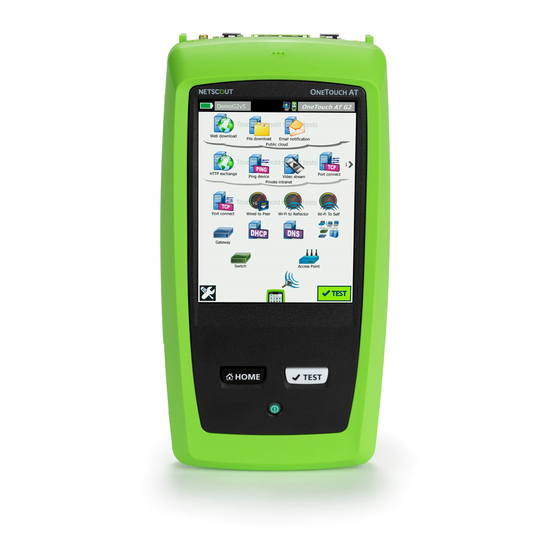
Reports and Screenshot Public Network Test Tiers Private Network Default Gateway Local Network DHCP Server DNS Server Discovery Nearest Switch TOOLS button AutoTest Button OneTouch AT 10G Instrument Icon Cable Test IP Address Figure 11. The OneTouch AT 10G Home Screen... -
Page 32: Shortcut Bar
Remote Connection Indicator: This icon appears when a remote connection to the OneTouch analyzer is established. OneTouch AT 10G Button: Tap the OneTouch AT 10G button to open a menu that lets you capture a screen (take a screen shot), create a report, or save an AutoTest capture file. -
Page 33: Test Tiers
Chapter 1: Get Acquainted The HOME Screen Test Tiers You can use the three test tiers to organize your tests any way you like. Public Network Tier: This tier is generally used for tests of ... - Page 34 OneTouch AT 10G User Manual Network Services Tier Default Gateway: This shows the default gateway for the wired connection. Tap the icon for details of this router. If a problem is detected, a red X appears on the icon. See page 74.
-
Page 35: Touchscreen
Chapter 1: Get Acquainted Touchscreen Instrument Tier TOOLS button: Tap this button to enter the TOOLS menu. See Chapter 8: "Tools," beginning on page 171. Cable: Tap the text to view cable and link test results. See “Cable Test”... -
Page 36: Entering Text
OneTouch AT 10G User Manual Tap: To select an item on the screen, tap the item lightly. Flick: To scroll a screen, touch the screen then move your fingertip in the direction you want the screen to move. -
Page 37: Entering Passwords And Other Hidden Text
Chapter 1: Get Acquainted Touchscreen To enter accented characters, tap the çñßà key (at the lower- left corner of the keyboard), then tap the letters on the keyboard. To enter non-accented characters, tap çñßà again. Standard characters Accented characters Figure 12. -
Page 38: Url Keyboard
OneTouch AT 10G User Manual Enter the characters When you have entered the characters and tapped the DONE button, the characters can no longer be viewed as plain text. The characters appear as a series of dots. URL Keyboard When entering a URL, the keyboard includes buttons for adding “www.”... -
Page 39: Ipv4 Address Entry Keyboard
Chapter 1: Get Acquainted Touchscreen IPv4 Address Entry Keyboard When entering an IPv4 address, the keyboard includes buttons for entering common number combinations, and disallows entry of alphabetic characters. See Figure 14. Figure 14. Keyboard for IPv4 Address Entry IPv6 Address Entry Keyboard When entering an IPv6 address, the keyboard is customized with buttons for common number combinations, the colon separator, and hexadecimal digits. -
Page 40: Set Preferences
OneTouch AT 10G User Manual zeros can be omitted. Groups of consecutive zeros can be replaced by a double colon (::). Figure 15. Keyboard for IPv6 Address Entry Set Preferences Typically, you will set the following preferences once, and you will not need to set them again. -
Page 41: Number Format
Chapter 1: Get Acquainted Set Preferences Tap the setting you want to change: To set the date, tap Date. Tap <left arrow> or <right arrow> to select a month and year for the calendar, then select the correct date on the calendar. Tap DONE to save your settings. To set the time, tap Time. - Page 42 OneTouch AT 10G User Manual These settings only apply when the analyzer is operating on battery power. On the HOME screen, tap TOOLS Scroll down to the Maintenance Tools section, and tap Timeout Period. Tap Backlight or Power Down. Select a time. To always keep the backlight or analyzer on, tap...
-
Page 43: Chapter 2: Setup Wizard
Chapter 2: Setup Wizard Warning Before you use the analyzer, read the safety information that starts on page 15. This chapter helps you quickly begin using the OneTouch analyzer. Setup Wizard The Setup Wizard, which appears when you initially power on the OneTouch AT analyzer, guides you through these tasks: Registering the product, which gives you access to valuable ... -
Page 44: To Start The Setup Wizard At A Later Time
OneTouch AT 10G User Manual You can exit the Setup Wizard at any time by selecting the EXIT button To Start the Setup Wizard at a Later Time You can run the Setup Wizard again, at any time, to create additional Profiles. -
Page 45: Management Port Button In Tools Menu
Chapter 2: Setup Wizard Ensure that the management port received an IP address Exit the Setup Wizard. Tap the TOOLS icon on the HOME screen. Scroll down to the Maintenance Tools section, and tap the Management Port button. Figure 16. Management Port Button in TOOLS Menu Ensure that the management port has an IP address, as shown below. -
Page 46: Selecting A Registration Account
Selecting a Registration Account When registering the analyzer, you can link the analyzer to an existing NETSCOUT account or to a new account that you create. Follow the analyzer’s on-screen instructions. Your registered OneTouch AT is shown in the Registered Products section of your account on www.enterprise.netscout.com. -
Page 47: Setting Up The Cloud Service
Chapter 2: Setup Wizard Configuring the Analyzer’s Settings and Tests Setting up the Cloud Service Next, the Cloud Service Setup screen is displayed, and the analyzer guides you through setting up the Cloud Service. Follow the on-screen prompts. For more information, see the following sections: ... - Page 48 OneTouch AT 10G User Manual DNS server response time limit The last sections of the Setup Wizard let you set up network connectivity, infrastructure/network services, network performance, and application and protocol performance tests. These are referred to as User Tests, and they are shown as icons on the Test Tiers (see page 31) on the HOME screen.
- Page 49 Chapter 2: Setup Wizard Configuring the Analyzer’s Settings and Tests Select Wired from the list. Infrastructure Analysis/Network Services This portion of the Setup Wizard allows you to configure your network’s SNMP community strings to allow in-depth network analysis. For additional information about Network Analysis configuration, see “Analysis”...
-
Page 50: Setup Wizard Completion
OneTouch AT 10G User Manual Application and Protocol Performance This section of the Setup Wizard lets you add User Tests to the Profile. The list of User Tests is shown on page 46. User Tests can verify performance of common applications and protocols running on your network. -
Page 51: Chapter 3: Basic Operation
Chapter 3: Basic Operation Warning Before you use the analyzer, read the safety information that starts on page 15. This chapter provides instructions for: Adding a User Test to the HOME screen (detailed instructions) Connecting to a network Running AutoTest and viewing the results ... -
Page 52: The Home Screen
OneTouch AT 10G User Manual The Connect (TCP) test performs a TCP port open to the selected target to test for application port reachability using a TCP SYN/ ACK handshake. To add a Connect (TCP) user test, touch and hold any white space on a test tier of the Home screen. -
Page 53: Add Test Screen
Chapter 3: Basic Operation Adding User Tests The ADD TEST screen is displayed. Figure 19. ADD TEST Screen Tap Connect (TCP). The test’s screen opens with the SETUP tab selected. The SETUP tab is selected Server button Figure 20. Connect (TCP) Test Setup Screen... -
Page 54: Url Keyboard
keyboard help you to enter information quickly and easily. Tap the www. button. Type enterprise.netscout using the keyboard keys. Tap the .com button. Tap the DONE button. The Name button allows you to assign a custom name to a test. -
Page 55: Connect To A Network
139. Connect to a Network You can connect the OneTouch AT 10G analyzer to a network via the RJ-45 or SFP+ fiber ports. If Ethernet connections are available at both the fiber and copper network ports, the analyzer uses the fiber port. -
Page 56: Establish A Fiber Connection
OneTouch AT 10G User Manual Set appropriate parameters for your network. See your network administrator for details. See also: “Wired” on page 172. Establish a Fiber Connection Install or Remove the SFP+ Fiber Adapter To install an SFP+ Fiber adapter, remove the protective cap from the adapter and slide the adapter into the fiber port. -
Page 57: Icons Indicate Test Status
Chapter 3: Basic Operation Run AutoTest You can capture traffic to and from the analyzer during AutoTest. See “AutoTest Capture” on page 207. Icons Indicate Test Status When AutoTest begins, the AutoTest button changes to a stop button . Tap the stop button if you want to stop AutoTest before it completes. -
Page 58: View The Test Results
OneTouch AT 10G User Manual View the Test Results On the HOME screen, each test’s icon indicates whether the test passed or failed Shortcut Bar Tap a test’s icon to view detailed test results. Figure 22. HOME Screen After Running AutoTest... -
Page 59: View Detailed Test Results
Chapter 3: Basic Operation View the Test Results View Detailed Test Results Tap the Connect (TCP) test’s icon. The enterprise.netscout Connect (TCP) test screen is displayed with the RESULTS tab selected. RESULTS tab is selected Figure 23. Connect (TCP) Test Results Tab Measurement results for this example - Connect (TCP) - as well as all other user tests are described in Chapter 5: "User Tests,"... -
Page 60: Organize User Tests On The Test Tiers
OneTouch AT 10G User Manual Organize User Tests on the Test Tiers User tests are performed starting with the left side of the bottom tier, progressing from left to right on each tier, ending with the right-most test on the top tier. -
Page 61: See Off-Screen Tests
Chapter 3: Basic Operation Organize User Tests on the Test Tiers See Off-Screen Tests On the HOME screen, a chevron at the end of a tier indicates that one or more tests are off-screen. Tap the chevron to The number of scroll to the tests that are off-screen tests currently off-screen. -
Page 62: Move, Copy, Or Delete A User Test
More About AutoTest AutoTest is the automatic test feature of the OneTouch AT 10G analyzer. AutoTest provides a comprehensive test of network infrastructure, followed by customizable user tests that you define. -
Page 63: Next Steps
Chapter 3: Basic Operation Next Steps The wired links are dropped. Infrastructure test results, user test results, and wired discovery results are cleared. The wired link is re-established. Wired IP addresses are requested. All network infrastructure tests and user tests are re-run. ... -
Page 64: Configure The Onetouch At 10G Analyzer To Use Snmp
See “SNMP” on page 146. Store Your Test Setup in a Profile You can save OneTouch AT 10G analyzer test configurations in Profiles. See “Profiles” on page 139. See IPv6 Results To see IPv6 test results, enable IPv6 operation and run AutoTest again. -
Page 65: Onetouch At 10G Instrument
Wired Analysis, page 82 OneTouch AT 10G Instrument Description Tap the OneTouch AT 10G instrument icon (located at the bottom of the HOME screen) to show details of the wired network connections, including addresses, transmit and receive statistics, errors, and SFP information. - Page 66 OneTouch AT 10G User Manual Configuration Connect the OneTouch AT 10G analyzer to a wired network and tap the AutoTest button How it Works The analyzer collects and displays connection parameters such as IP addresses, and monitors and reports on transmitted and received frames.
-
Page 67: Wired Onetouch At 10G Results
Chapter 4: Network Infrastructure Tests OneTouch AT 10G Instrument Tap the OneTouch AT 10G instrument icon to view test results and statistics gathered from the wired connections. Figure 25. Wired OneTouch AT 10G Results Address - The details of the analyzer’s wired test port are shown. -
Page 68: Cable Test
Cable Test Description This test verifies the integrity of a copper Ethernet cable connected to the OneTouch AT 10G analyzer. Additionally, optical power measurement is available when a fiber cable is used with a DDM-capable SFP. When you tap the AutoTest button , the analyzer attempts to establish link. -
Page 69: Unterminated Cable
Chapter 4: Network Infrastructure Tests Cable Test Length (cable length is reportedonly when the pair is not terminated) Note: The length measurement is accurate to plus-or- minus 10 meters. Results Run AutoTest, then tap the cable icon on the home screen to view test results. -
Page 70: Unterminated Cable With Shorts And Opens
OneTouch AT 10G User Manual The results screen shows which wires are open or shorted and the distance from the OneTouch HOME analyzer to the cable Screen fault. icon CABLE Results Screen Figure 27. Unterminated Cable with Shorts and Opens This shows an unterminated cable with shorts and opens connected to the RJ-45 network under test connector. -
Page 71: Fiber Cable Diagnostics
The analyzer collects and reports link statistics when you run AutoTest. Configuration The OneTouch AT 10G analyzer automatically configures itself to work with the port where it is connected. How it Works The link test runs when you tap the AutoTest button the touchscreen or the AutoTest key on the front panel. -
Page 72: Nearest Switch Test
OneTouch AT 10G User Manual Results Link results are shown on the LINK tab of the CABLE/LINK screen. Advertised Speed indicates the speed(s) offered by the port where the analyzer is connected. Actual Speed is the speed that was negotiated when the analyzer connected to the network. - Page 73 Chapter 4: Network Infrastructure Tests Nearest Switch Test Discovery Protocol (EDP), Foundry Discovery Protocol (FDP), and via SNMP. LLDP, CDP, EDP or FDP is used to identify the nearest switch, the connected port, the switch’s address, and other information when available. The analyzer uses SNMP to acquire system group information and packet statistics for the port where the analyzer is connected.
-
Page 74: Nearest Switch - Port Tab
OneTouch AT 10G User Manual Run AutoTest, then tap the Nearest Switch icon to show the results. There are two tabs: PORT and STATISTICS. Figure 30. Nearest Switch - PORT Tab... -
Page 75: Nearest Switch - Statistics Tab
Chapter 4: Network Infrastructure Tests Nearest Switch Test Figure 31. Nearest Switch - STATISTICS Tab The analyzer uses SNMP to acquire system group information and packet statistics for the port where the analyzer is connected. Statistics monitoring begins when AutoTest completes. AutoTest is complete when the last user test finishes. -
Page 76: Gateway Test
OneTouch AT 10G User Manual Gateway Test Description Tap the gateway icon to identify the IP and MAC addresses of the current IPv4 and IPv6 router. Routing protocols and router ping connectivity are also reported. If SNMP is enabled, parameters such as name, location, description, contact and up time as well as router errors and discards are displayed. - Page 77 Chapter 4: Network Infrastructure Tests Gateway Test Results If the gateway responds, the test passes and a green check mark is shown next to the Gateway icon on the HOME screen. If the gateway does not respond, a red x is shown.
-
Page 78: Gateway Wired Tab
OneTouch AT 10G User Manual Tap the Gateway icon to show gateway information, including wired gateway statistics. Figure 32. Gateway WIRED Tab Wired gateway statistics are updated every 15 seconds. -
Page 79: Dhcp Server Test
Chapter 4: Network Infrastructure Tests DHCP Server Test DHCP Server Test Description The DHCP (Dynamic Host Configuration Protocol) server test provides a breakdown of the process of acquiring a DHCP IP address on both the wired connections. The identity of the DHCP server, offer and acceptance timing, and lease information are provided. -
Page 80: Dhcp Test Results
OneTouch AT 10G User Manual Results Figure 33. DHCP Test Results Server IP is the IP address of the DHCP server. The Server Name field is populated with the name that the analyzer obtains during device discovery. The field is blank until AutoTest has completed and the analyzer has found a name for the server. -
Page 81: Dns Server Test
Chapter 4: Network Infrastructure Tests DNS Server Test The DHCP process has four parts: discover, offer, request, and acknowledge. Offer Time is from the start of the DHCP discover process until an offered IP address is returned by the DHCP server. The offered address is shown in the Accept field when it has been accepted by the analyzer. - Page 82 OneTouch AT 10G User Manual Configuration You can configure the URL that will be looked up by the DNS server, and the time limit. You can enter or change the name to be looked up using the Name to Lookup button on the SETUP screen.
-
Page 83: Dns Test Results
Chapter 4: Network Infrastructure Tests DNS Server Test Results If the analyzer can perform a DNS lookup for the configured URL via the wired connection, the test will pass. Figure 34. DNS Test Results DNS Lookup is the time it took to receive the address after the ... -
Page 84: Wired Analysis
OneTouch AT 10G User Manual Resolved IP addresses Primary and secondary DNS servers Wired Analysis Tap the Wired Analysis icon to see and analyze discovered wired hosts, access devices, and servers. See Chapter 7: "Wired Analysis," beginning on page 145 details. -
Page 85: Chapter 5: User Tests
To edit a user test, tap its icon on the HOME screen. Two tabs are shown: SETUP and RESULTS. Tap the SETUP tab. You can save user tests, along with other OneTouch AT 10G analyzer settings, in a Profile. See “Profiles” on page 139. -
Page 86: Ping (Icmp) Test
Name - The Name button allows you to assign a custom name to the test. The test’s name appears under the test’s icon on the HOME screen and in OneTouch AT 10G Reports. For your convenience, the analyzer automatically names the test based on the URL or IP address. -
Page 87: How It Works
Chapter 5: User Tests Ping (ICMP) Test until the test is stopped. Press the AutoTest key to stop the test. When not in Continuous mode, the analyzer will send pings over all enabled interfaces. Wired IPv4 and wired IPv6 pings run simultaneously. -
Page 88: Ping Test Results
OneTouch AT 10G User Manual The test will fail if any packet loss occurs, or if the selected time limit is exceeded. Figure 35. Ping Test Results DNS Lookup is the amount of time it took to resolve the optional URL into an IP address. - Page 89 Chapter 5: User Tests Ping (ICMP) Test Sent is the number of ICMP echo request packets that have been sent. Received is the number of ICMP echo reply packets that have been received. Lost is the number of ICMP echo request packets that were sent but not received within the selected time limit.
-
Page 90: Connect (Tcp) Test
OneTouch AT 10G User Manual Connect (TCP) Test Purpose The Connect (TCP) test performs a TCP port open to the selected target to test for application port availability. The test verifies basic application port connectivity using a 3-way handshake (SYN, SYN/ACK, ACK). -
Page 91: How It Works
Chapter 5: User Tests Connect (TCP) Test When in Continuous mode, the test’s results are shown on the RESULTS tab. The test is not graded as having passed or failed until the test is stopped. Press the AutoTest key to stop ... -
Page 92: Results
OneTouch AT 10G User Manual Results If the SYN/ACK is not received from the target on all enabled interfaces (wired, IPv4, IPv6) within the time limit, the test will fail. Figure 36. TCP Test Results DNS Lookup is the amount of time it took to resolve the optional URL into an IP address. - Page 93 Chapter 5: User Tests Connect (TCP) Test SYN Sent shows the number of SYNs sent by the analyzer. ACK Received shows the number SYN/ACKs received by the analyzer. ACK Lost shows the number of SYNs for which a SYN/ACK was not received within the selected time limit.
-
Page 94: Web (Http) Test
OneTouch AT 10G User Manual Web (HTTP) Test Purpose The Web (HTTP) test performs a comprehensive end user response time (EURT) measurement when downloading the specified web page. The target can be an IPv4 address, IPv6 address or URL. The transfer size allows limiting the amount of data downloaded ranging from the HTML header only to the entire page. -
Page 95: How It Works
Chapter 5: User Tests Web (HTTP) Test server, tap the Proxy button, tap On, and set the server’s address and port. Otherwise, continue to the next step. Return Code - Functions as pass/fail test criteria with focus on the return code value of a specified server or URL. Select a return code from the list of available return codes. -
Page 96: Results
OneTouch AT 10G User Manual Results The test passes if the amount of data specified using the Transfer Size control is downloaded within the time specified using the Time Limit control. Figure 37. Web (HTTP) Test Results... - Page 97 Chapter 5: User Tests Web (HTTP) Test DNS Lookup is the amount of time it took to resolve the URL to an IP address. If you enter an IP address, DNS lookup is not required, so dashes will be displayed to indicate that this part of the test was not executed.
- Page 98 OneTouch AT 10G User Manual At the bottom-left corner of the screen, an icon indicates the test’s status: A progress spinner indicates the test is in progress. A green check mark indicates the test passed. A red x indicates the test failed.
-
Page 99: File (Ftp) Test
Chapter 5: User Tests File (FTP) Test File (FTP) Test Purpose The File (FTP) test performs a file upload or download, allowing verification of WAN, server and network performance. The target can be an IPv4 address, IPv6 address or URL. Optional proxy support is provided for more sophisticated enterprises. -
Page 100: How It Works
OneTouch AT 10G User Manual Direction - Use the Direction control to specify a Get (download data from a server) or Put (upload data to a server) operation. User and Password: Enter these credentials to access the target server you specified. If left blank, the FTP server will assume you wish to establish an anonymous connection. -
Page 101: Results
Chapter 5: User Tests File (FTP) Test Results If the Total Time is less than the selected Time Limit the test passes. If the Time Limit is exceeded during test, the current phase of the test is marked with a red X and the test is aborted. Figure 38. - Page 102 OneTouch AT 10G User Manual Data Start time is measured from when the port was opened until the first file data was received. Data Transfer is the amount of time it took to receive the data from the target server.
-
Page 103: Wired Performance Test (Rfc 2544)
Traffic is exchanged and measured between the source and the endpoint. The source is the OneTouch AT 10G analyzer on which the test is configured and controlled. The endpoint is the remote device that exchanges traffic with... - Page 104 OneTouch AT 10G User Manual There are two types of endpoints for this test: Peer - A peer is another OneTouch AT 10G analyzer or a OneTouch AT analyzer. When using a peer endpoint, separate upstream and downstream measurements are shown for throughput, frames sent, frames received, and frames lost.
-
Page 105: G Wired Performance Test Setup Tab
Chapter 5: User Tests 1G Wired Performance Test (RFC 2544) SETUP Parameters The following configuration settings are available in the SETUP tab of the 1G Wired Performance (RFC 2544) test: Figure 39. 1G Wired Performance Test Setup Tab Type - specifies that the endpoint device will behave as a performance peer or reflector. - Page 106 OneTouch AT 10G User Manual Target Rate - the requested rate of upstream traffic (from the source analyzer to the peer). Valid rates are from 100 Kbps to 1 Gbps. If the actual rate is less than 99% of the requested rate, the test will fail.
-
Page 107: To Configure A Onetouch At Analyzer As A Peer
Note that you must select the same port in the source OneTouch AT 10G Wired Performance Test configuration. Enable AutoStart - If set to On, the Peer will start automatically every time the OneTouch is turned on. - Page 108 OneTouch AT 10G User Manual - IP address of the currently connected source is shown. - Test state: Ready, Running, Finishing, Linking, Stopped. Instrument - Shows the management port IP address. SFP Information - Shows vendor and model info for the SFP/SFP+ connected to the analyzer.
-
Page 109: To Configure A Onetouch At 10G Analyzer As The Source
Performance Peer Screen To Configure a OneTouch AT 10G Analyzer as the Source Follow these steps to configure the source OneTouch AT 10G for the 1G Wired Performance (RFC 2544) test. Connect AC power to the analyzer. This ensures that the unit will not run out of battery power, and will not automatically power-down if a Timeout Period is set. -
Page 110: To Configure A Linkrunner 2000 As A Reflector
OneTouch AT 10G User Manual Select the configuration values in the SETUP tab of the test. In particular, set the Type value to Peer. See "SETUP Parameters" page 103 for definitions of configuration parameters. Run the test individually or as part of a test profile. See "Run the Test"... - Page 111 Select Configure. The default reflector settings are displayed below. These settings are required for the Wired Performance test. MAC + NETSCOUT - This filter setting allows the LinkRunner to only reflect frames when the destination MAC address field matches the LinkRunner's own MAC address and NETSCOUT payload.
-
Page 112: Run The Test
On the next higher port (configured port + 2) a UDP connection is established for exchanging latency measurement frames. When using a peer endpoint (a OneTouch AT 10G or OneTouch AT analyzer), separate upstream and downstream measurements are provided for rate, frames sent, frames received, and lost frames. -
Page 113: G Wired Performance Test (Rfc 2544) Results Using A Single Frame Size
Chapter 5: User Tests 1G Wired Performance Test (RFC 2544) When you select a frame size other than “RFC 2544 sweep” in the test configuration, the results screen looks like the image below. Figure 41. 1G Wired Performance Test (RFC 2544) Results Using a Single Frame Size... - Page 114 OneTouch AT 10G User Manual When you select Sweep in the frame size configuration, an RFC 2544 sweep test is performed. By default, results are shown in tabular view. Scroll down to see all of the results. Figure 42. 1G Wired Performance Test (RFC 2544) Results...
-
Page 115: Wired Performance Test Results Rfc 2544 Sweep, Graphical View
Chapter 5: User Tests 1G Wired Performance Test (RFC 2544) You can also view the RFC 2544 sweep test results in graphical format. Tap the Graph button at the bottom of the screen. Figure 43. Wired Performance Test Results RFC 2544 sweep, Graphical View... - Page 116 OneTouch AT 10G User Manual Target Rate (bps) is the requested bit rate from the SETUP tab. Throughput (bps) is the measured bit rate based on frames sent and the actual number of frames received. This rate includes inter-frame gap and preamble time.
- Page 117 Chapter 5: User Tests 1G Wired Performance Test (RFC 2544) value and the smallest value) of variation in twenty successive latency measurements. Total Time is the total amount of time it took to complete the test. At the bottom-left corner of the source’s screen, an icon indicates the test’s status: A progress spinner indicates the test is in progress.
-
Page 118: Wired Performance Test (Y.1564)
The 10G Wired Performance (Y.1564) test allows you to: If you set up a test suite on the OneTouch AT 10G, you can perform a simple throughput test with default QoS parameters to measure Throughput, Frame Loss, Latency and Jitter. -
Page 119: Configuration
Therefore, configuration includes setting up both the source and end-point analyzers. For this test: The source is the OneTouch AT 10G analyzer on which the test is configured and controlled. The endpoint is an OptiView XG that is appropriately ... -
Page 120: G Wired Performance Test Setup Tab
OneTouch AT 10G User Manual SETUP Parameters This section describes the SETUP tab of the 10G Wired Performance (Y.1564) test. Figure 44. 10G Wired Performance Test Setup Tab OptiView XG - Specifies the IP address of the OptiView XG that is used in the test. - Page 121 Test Suite - Specifies the name of the test suite on the OptiView XG that will be used. If the OneTouch AT 10G can connect to the OptiView XG, when you tap this button, the list of Test Suites saved on the OptiView XG will appear.
-
Page 122: To Configure And Run The 10G Wired Performance (Y.1564) Test
OneTouch AT 10G User Manual Duration - Configures the desired duration of the test. Interval - Determines how often the display of the OneTouch At 10G is updated. Data points are also collected every Interval on the OptiView XG to create a trend. - Page 123 Timeout Period is set. On the OneTouch AT 10G, press and hold one of the test tiers to open the ADD TEST screen. Tap the 10G Wired Performance (Y.1564) test.
-
Page 124: Run The Test
Run the Test To run the test, ensure that you have started the endpoint, then start the 10G Wired Performance (Y.1564) test (on the source OneTouch AT 10G) by tapping AutoTest or TEST AGAIN on the test RESULTS tab. How it Works The 10G Performance (Y.1564) test works like this:... -
Page 125: Results
Chapter 5: User Tests 10G Wired Performance Test (Y.1564) A remote UI channel is opened between the OneTouch AT 10G and the OptiView XG, and the OneTouch hands over control of the test to the OptiView XG. The OptiView XG then behaves as a source, running a standard performance test, with the OneTouch acting as a peer. - Page 126 OneTouch AT 10G User Manual No test results are reported during this phase of the test. Figure 45. 10G Performance (Y.1564) test - initial configuration test phase After the initial configuration test runs and passes, the full performance test runs. At the end of every test interval, the...
- Page 127 Chapter 5: User Tests 10G Wired Performance Test (Y.1564) intervals, and for services being tested, is updated on the RESULTS tab. Figure 46. 10G Performance (Y.1564) test - full performance test phase The following test results start accumulating once the full performance test phase begins.
- Page 128 OneTouch AT 10G User Manual Requested Rate, expressed as both Utilized Line Rate (ULR) and Information Rate (IR), shows the values configured in the SETUP tab. Throughput (IR) is the actual achieved throughput expressed as Information Rate (IR). Frames Lost is the number of frames sent less the number of frames received.
-
Page 129: Multicast (Igmp) Test
The Multicast (IGMP) test verifies the ability to subscribe to an IGMP multicast group and verifies the flow of multicast data to the OneTouch AT 10G analyzer. Multicasts are used for online streaming of data from devices such as security video cameras, industrial sensors, and ticker tape data. -
Page 130: How It Works
OneTouch AT 10G User Manual How it Works The analyzer joins the specified multicast group and listens for traffic. If a source address is specified, it will only listen for traffic from that IP address. The test runs in turn on each configured network connection. - Page 131 Chapter 5: User Tests Multicast (IGMP) Test Data Start is the amount of time it took to receive the first data byte after the analyzer sent the IGMP join message. Data Transfer is the amount of time it took to receive the data from the target server.
-
Page 132: Video (Rtsp) Test
OneTouch AT 10G User Manual Video (RTSP) Test Purpose The Video (RTSP) test verifies the ability to access video content from on-demand streaming media servers. The test uses the RTSP protocol to establish and play the designated video file from the specified RTSP Server. -
Page 133: How It Works
Chapter 5: User Tests Video (RTSP) Test How it Works The analyzer requests a session with the RTSP server. The file specified on the File button is streamed to the analyzer. The amount of data streamed is checked against the specified Transfer Size and Time Limit to determine whether the test passed or failed. - Page 134 OneTouch AT 10G User Manual DNS Lookup is the amount of time it took to resolve the optional URL into an IP address. TCP Connect is the amount of time it took to open the port on the server. Data Start is the amount of time from when the port was opened until the first video data was received.
- Page 135 Chapter 5: User Tests Video (RTSP) Test launch a browser against the target server, or Telnet/SSH to the server.
-
Page 136: Email (Smtp) Test
OneTouch AT 10G User Manual Email (SMTP) Test Purpose The Email (SMTP) test provides digital notification of wired connectivity using SMTP mail service. This test is useful for sending a text message to the user's phone for complete Internet connectivity feedback, or allowing a test supervisor to maintain a repository of all analyzer testing being performed in the field. -
Page 137: How It Works
Chapter 5: User Tests Email (SMTP) Test How it Works The analyzer adds the nearest switch information to the body of the email if it is sent via the wired interface. The analyzer looks up the SMTP server name, contacts the server, sets up SSL or TLS communications if necessary, authenticates if necessary, and uses the SMTP protocol to send the email. -
Page 138: Results
OneTouch AT 10G User Manual Results Results provide a complete breakdown of the total time it took to send the email. Figure 49. Email (SMTP) Test Results DNS Lookup is the amount of time it took to resolve the optional URL into an IP address. - Page 139 Chapter 5: User Tests Email (SMTP) Test Data Transfer is the time it took to send the email header and payload to the target server. Total Time is the sum of DNS lookup, TCP connect, data start, and data transfer time. It is the total amount of time it took to send the email from the analyzer.
-
Page 140: Email Sent From Ipv4 Wired Connection
OneTouch AT 10G User Manual From: OneTouch <OneTouch@company.com> To: Recipient [recipient@company.com] Subject: Wired Test Results Date: Fri, 1 Jun 2012 08:38:15 -0800 IP: 10.250.0.232 Name: Switch_Name.eng (010.250.000.002) Model: cisco 12-34567-890 Port: GigabitEthernet0/33 Address: 10.250.000.006 Vlan: 500 (if applicable) Figure 50. Email Sent From IPv4 Wired Connection... -
Page 141: Chapter 6: Profiles
Chapter 6: Profiles OneTouch AT 10G analyzer profiles are named configurations that can be used in a variety of ways to streamline analyzer operation. The use of profiles allows an organization to create standard test procedures that encapsulate expected network operation from any locale or segment. -
Page 142: Asterisk (*) After The Profile Name
If you cycle power, the OneTouch AT 10G analyzer will retain the changes and the asterisk will still be displayed. However, if you load a different profile before saving the current profile, the changes to the current profile will be lost. -
Page 143: Load A Profile
(WebDAV)” on page 217. To export a profile to a different OneTouch AT 10G analyzer using a USB flash drive: Connect a USB flash drive to the analyzer. (You must do this before tapping the MANAGE button in step 3 so the USB flash drive will appear on the list.) - Page 144 OneTouch AT 10G User Manual Tap the EXPORT button. Tap usbstorage. Tap OK. Remove the USB flash drive from the source analyzer. Connect the USB flash drive to the destination analyzer. 10 On the destination analyzer, tap the Profile name, which is in the shortcut bar at the top of the screen.
-
Page 145: View A Profile File
.profile extension that can be displayed in a web browser or a text editor. Editing Profiles You can edit and save Profiles using the OneTouch AT 10G analyzer. Profiles are not intended to be edited with a text editor. If they are edited outside the analyzer they cannot be used... - Page 146 OneTouch AT 10G User Manual...
-
Page 147: Chapter 7: Wired Analysis
Chapter 7: Wired Analysis Wired Analysis Description The OneTouch AT 10G analyzer discovers... Devices in the broadcast domain Wi-Fi devices that are connected to APs in the broadcast domain The server specified in the DNS test The servers specified in user tests ... -
Page 148: Configuration
OneTouch AT 10G User Manual Scan the device for open ports. Run path analysis to the device. Launch a web browser using the device as the target. Open a Telnet/SSH session with the device. Configuration To configure wired analysis: On the HOME screen, tap TOOLS Tap the Analysis button. -
Page 149: Slow Discovery
Chapter 7: Wired Analysis On the ANALYSIS setup screen, tap the SNMP v1/v2 button and enter community string(s). When entering multiple community strings, separate them with a comma and a space. For example: public, private. You can view the characters as you enter them. See “Entering Passwords and Other Hidden Text”... -
Page 150: Results
OneTouch AT 10G User Manual Results The number of discovered devices is shown under the Wired Analysis icon on the HOME screen. Tap the icon to display the WIRED ANALYSIS summary screen. Figure 52. WIRED ANALYSIS Screen... - Page 151 Each device is displayed on a button. An icon at the left side of the button indicates the device type. Wired host Switch Router Server Printer NETSCOUT tool VoIP call manager or VoIP TFTP server VoIP phone Virtual switch Virtual machine Hypervisor Wireless LAN controller Wireless access point...
- Page 152 OneTouch AT 10G User Manual Note Wi-Fi infrastructure devices are discovered via their wired network connections. Wi-Fi devices in the broadcast domain are discovered through Link Layer and Network Layer discovery techniques. The information displayed on device buttons changes based on the sort key.
-
Page 153: To Show Wired Device Details
Chapter 7: Wired Analysis To Show Wired Device Details Tap a device to show its details. Tap the device again to return to a summary view of devices. Tap a different device to show its details. Only one device’s ... -
Page 154: Wired Device Details
OneTouch AT 10G User Manual The following section describes the device button after it has been tapped to display details. Figure 54. Wired Device Details This shows the device’s best name in bold characters. It shows ... - Page 155 Chapter 7: Wired Analysis Shows all the other IP addresses that are associated with the device, if any. Scroll down the screen to view any additional addresses, if available. Wired Device Sorts Wired devices can be sorted based on the following sort keys. Name - Sorts alphabetically according to the device’s best ...
- Page 156 OneTouch AT 10G User Manual - Wireless LAN controller - NETSCOUT tool - Printer - Switch - Router - Client Domain - An alphabetic sort based on the Windows NetBIOS domain name Top Unicast - A numerical sort based on the number of ...
-
Page 157: Wired Analysis Tools
Chapter 7: Wired Analysis To find the Wired Analysis results for a user test’s target server, you may need to search for it in the Wired Analysis results by its IP address, as follows. Ensure that AutoTest has been run. Tap the user test’s icon on the HOME screen. -
Page 158: Port Scan
OneTouch AT 10G User Manual Tap the TEST AGAIN button to run the test immediately, or press the HOME key on the front panel and run AutoTest to run all configured tests. Port Scan The Port Scan feature scans the target device for many commonly- used open ports. -
Page 159: Path Analysis
Chapter 7: Wired Analysis Path Analysis Path Analysis traces the connection points, including intermediate routers and switches, between the OneTouch AT 10G analyzer and a target device. You can use path analysis to identify issues such as overloaded interfaces, overloaded device resources, and interface errors. -
Page 160: Wired Analysis Tools Menu
Figure 56. Wired Analysis Tools Menu Tap the Path Analysis button. The OneTouch AT 10G analyzer runs layer 2 and layer 3 path analysis to the target device and displays the results. Each device along the path is shown on a button. -
Page 161: Path Analysis Results
Chapter 7: Wired Analysis Each device is queried up to three times to elicit a response. If the queried device does not respond, dashes (--) are shown at the right side of the button. If an error is encountered a yellow warning triangle is ... - Page 162 OneTouch AT 10G User Manual The following information is shown at the bottom of the screen. , indicating the test is in progress, A progress spinner , indicating the test passed, a green check mark or a red X , indicating the test failed ...
-
Page 163: Path Analysis - Detailed Results
Chapter 7: Wired Analysis Tap a device’s button to see detailed information. Details such as utilization and errors are shown for SNMP-enabled devices. Figure 58. Path Analysis - Detailed Results Tap the START button to clear the results and run path analysis again. -
Page 164: Multiport Statistics
OneTouch AT 10G User Manual MultiPort Statistics The OneTouch AT 10G analyzer’s MultiPort Statistics feature shows device health information including utilization, discards, and errors on each port. Link Level Discovery Protocol (LLDP), Cisco Discovery Protocol (CDP), Extreme Discovery Protocol (EDP), Foundry Discovery Protocol (FDP), and SNMP are used to gather information from the nearest switch. -
Page 165: Multiport Statistics Button On Wired Analysis Tools Menu
Chapter 7: Wired Analysis pears in the tools menu, as shown below. Figure 59. MultiPort Statistics Button on Wired Analysis Tools Menu Tap the MultiPort Stats button to display the device’s port statistics. MultiPort Statistics via the HOME Screen On the HOME screen, tap the nearest switch icon or the gateway icon Tap the TOOLS button... -
Page 166: Multiport Statistics Button On Path Analysis Tools Menu
OneTouch AT 10G User Manual MultiPort Statistics via Path Analysis Path analysis is described beginning on page 157. From the path analysis results screen, tap a device’s button to expand it and view its details. Tap the TOOLS button , which is at the bottom of the screen. -
Page 167: Multiport Statistics Summary Screen
Chapter 7: Wired Analysis MultiPort Statistics Summary Screen When you tap the MultiPort Stats button, the analyzer gathers information from the device and displays it on a summary screen. Figure 61. MultiPort Statistics Summary Screen Only ports that are up (linked) are displayed. The list is updated realtime. - Page 168 OneTouch AT 10G User Manual Duplex mode Problems (problem severity) Utilization In/Out Utilization In Utilization Out VLAN number Device Count (number of connected devices) Use the Sort Order button to sort the results in ascending descending order.
-
Page 169: Multiport Statistics Details Screen
Chapter 7: Wired Analysis MultiPort Statistics Port Details Screen Tap a port’s button to expand it and view its details. Triangle indicates Problem an error summary or warning Number of attached devices Total Current since value MultiPort statistics began Maximum value Ports observed... -
Page 170: Web Browser
OneTouch AT 10G User Manual enabled, a TOOLS button will be shown at the bottom left of the screen. Choosing the TOOLS button will present you with a listing of available tools. Figure 63. MultiPort - Device on Port Details Screen... -
Page 171: Telnet/Ssh
Chapter 7: Wired Analysis Telnet/SSH When you tap the Telnet/SSH button, a Telnet/SSH session is started with the selected device as the target. See “Telnet/SSH” page 179. - Page 172 OneTouch AT 10G User Manual...
-
Page 173: Chapter 8: Tools
Chapter 8: Tools Tap the TOOLS icon on the HOME screen to access the TOOLS screen. Figure 64. Tools Screen... -
Page 174: Test Settings
OneTouch AT 10G User Manual Test Settings The following test settings can be configured via the TOOLS screen. Refer to the following pages. “Wired” on page 172 “SNMP” on page 146 “Slow Discovery” on page 147. Also included in this section: “View or Change the analyzer’s MAC Addresses”... - Page 175 Chapter 8: Tools Alternate ID may take the form anonymous@MyCompany.com or /MyCompany/anonymous. Certificate - TLS EAP types require a certificate for authentication. Certificates must be loaded in the /internal/Certificates directory on the OneTouch analyzer. To import a user authentication certificate: Insert an SD card or USB drive with the required certificate into the correct port on your OneTouch.
- Page 176 MAC address and add it to the access list. The MAC is shown at the bottom of the ADDRESS screen. To connect to the OneTouch AT 10G analyzer for remote viewing or remote file access you will need to know the IP address of the management port.
- Page 177 Chapter 8: Tools Scroll down to Maintenance Tools section and tap the Management Port button. Wi-Fi Adapter Management Port MAC Address To view the Wi-Fi Adapter Management Port MAC address: On the HOME Screen, tap TOOLS Scroll down to Maintenance Tools section and tap the Management Port button.
-
Page 178: Analysis
OneTouch AT 10G User Manual Tap the Wired button. Tap the Wait for Rx Frame button. Select On or Off. Analysis See “SNMP” on page 146, and “Slow Discovery” on page 147. Link-Live Cloud Tools The Link-Live Cloud tools are for interacting with the Link-Live Cloud Service. -
Page 179: Cloud Remote
Chapter 8: Tools Live so that you can view the results over time. The OneTouch AT unit must be claimed before any Periodic AutoTesting can occur, and Periodic AutoTesting must be configured to allow the OneTouch AT’s test results to be sent to the Link-Live Cloud. To enable Periodic AutoTest: Select TOOLS from the HOME screen. -
Page 180: Testing Tools
201. Performance Peer This tool is used when running Wired Performance tests that require two devices - the source OneTouch AT 10G and either a peer or reflector. This tool is used when designating this device to be the peer. -
Page 181: Telnet/Ssh
Chapter 8: Tools Testing Tools Use the Proxy button to specify a server through which the connection will be established. Tap the LAUNCH button to launch the browser. Swipe your finger across the display to pan across a web page. Tap a text entry area to display the touchscreen keyboard. -
Page 182: Flash Port
OneTouch AT 10G User Manual Tap the LAUNCH button to start the session. The analyzer starts a telnet or SSH session. Use the on-screen keyboard to type your commands. To end the session, tap the back button Flash Port Flash port is a tool for finding the port on a switch where a copper or fiber cable is connected. -
Page 183: Fiberinspector Image Of An Endface
Chapter 8: Tools Testing Tools In the Testing Tools section, scroll down and tap FiberInspector/WebCam. The image from the camera appears on the analyzer’s screen. Tap to Exit Shows whether camera is connected Save still image Figure 65. FiberInspector Image of an Endface To adjust the focus, turn the knob on the probe clockwise or counterclockwise. -
Page 184: Using The Scales
OneTouch AT 10G User Manual Using the Scales To show the scales, tap , then tap SCALE ON. Drag the image of the core to the center of the screen. To change the size of the measurement ring for the fiber core, tap NEXT SCALE. - Page 185 Chapter 8: Tools Testing Tools Middle, green rings: 120 m and 130 m Inner, yellow rings: 25 m and 62.5 m (to change the size, tap NEXT SCALE) To adjust the brightness or contrast of the image, tap , then move the bars on the controls.
-
Page 186: Webcam And Remote View
OneTouch AT 10G User Manual WebCam and Remote View A network technician can connect a WebCam to the analyzer and share its live image with a colleague. A technician can share his live view of network components in a wiring closet while conversing with a remote colleague. -
Page 187: Link Validation
Chapter 8: Tools Testing Tools Figure 67. Link Validation Screen Status indicates that the OneTouch is linked. Actual Speed is the speed that was negotiated when the analyzer connected to the network. Actual Duplex is the duplex that was negotiated when link was established. -
Page 188: File Tools
AutoTest, and Wired Analysis. All available details are included when you save a report only in XML. When you initially power on a OneTouch AT 10G analyzer, only two selectable report options are available, the Tools Settings and AutoTest. You must first run AutoTest to include AutoTest data in the saved report. -
Page 189: Available Report Options
Chapter 8: Tools File Tools Note The OneTouch AT 10G analyzer must be connected to the wired network to display the Wired Analysis option in the SAVE report option list. Figure 68. Available Report Options Saving a Report To save a OneTouch AT 10G analyzer report: On the HOME screen, tap TOOLS Scroll down to the File Tools section, and tap Reports. - Page 190 OneTouch AT 10G User Manual Tap the SAVE button. — Figure 69. Save Report Screen Possible Report Options Tap the File: button to change the file name if desired, and then tap the Done button. Tap the Format: button to change the report output if desired.
-
Page 191: Report Content Options For Autotest
Chapter 8: Tools File Tools For AutoTest and Wired Analysis, you can determine which summaries and details you want the report to include. Figure 70. Report Content Options for AutoTest Tap the back button to go back to the Save Report screen. -
Page 192: Report Content Options For Wired Analysis
OneTouch AT 10G User Manual Tap the Wired Analysis button to select wired analysis content for your report. Figure 71. Report Content Options for Wired Analysis To obtain Path Analysis data in your report, run Path Analysis using the Wired analysis screens. Then, tap the Wired Analysis button on the Save Report screen, select the Path Analysis check box, and save. -
Page 193: Screens
Screens Save a Screen Image You can take a screen shot of the analyzer’s display as follows: Tap the text that says OneTouch AT 10G at the top-right corner of the screen. Tap here Tap Save Screen. The SCREEN FILENAME screen appears. -
Page 194: Maintenance Tools
Management Port The OneTouch AT 10G management port can be set to wired or Wi-Fi. The wired setting refers to the RJ-45 Ethernet port located on the left side of the analyzer. The Wi-Fi setting refers to the use of an optional Wi-Fi adapter that is connected to the analyzer’s... -
Page 195: Management Port Screen Linked Wired
Chapter 8: Tools Maintenance Tools On the HOME screen, tap TOOLS Scroll down to the Maintenance Tools section and tap Management Port. The management port screen is displayed. Figure 72. Management Port Screen Linked Wired On the Active Port button, tap Wi-Fi. Tap the Wi-Fi button. - Page 196 OneTouch AT 10G User Manual come available. These additional selections will vary depend- ing on the selected authentication type. 11 Tap each new selection that became available as a result of changing the authentication type and provide the requested information.
- Page 197 Chapter 8: Tools Maintenance Tools On the User/Password button tap On. This action will display the User and Password buttons on the screen. Tap the User button and enter a user name. Tap the Password button and enter a password. Choose an Active Port: Wired or Wi-Fi.
-
Page 198: Battery Status
OneTouch AT 10G User Manual Accessing the analyzer’s user file system via web browser or Verifying and changing switch provisioning using the built-in telnet and SSH tools Accessing technical information on the web using the built-in web browser Battery Status This screen shows the battery’s status. -
Page 199: Timeout Period
Update Software To update software, download the new software image file from www.enterprise.netscout.com. You can install the new software image file from a USB flash drive or an SD card. Note... -
Page 200: Options
The new file will be installed and the analyzer will restart. The process will take several minutes. Options If you did not purchase your OneTouch AT 10G analyzer with all options enabled, you can purchase and activate options at a later time. -
Page 201: Factory Defaults
Chapter 8: Tools Maintenance Tools Tap OK to export the log files to the SD card. Factory Defaults Use this feature to restore factory settings and erase all user data. You can select from two options: Quick or Full. Both options restore factory settings and erase user data with particular differences. - Page 202 OneTouch AT 10G User Manual Scroll down to the Maintenance Tools section and tap Factory Defaults. Tap the Quick or Full button.
-
Page 203: Chapter 9: Packet Capture
Ensure that users are adhering to administration policies Verify network security The OneTouch AT 10G analyzer can silently monitor and record network traffic. This is called Standalone Capture. The analyzer can also record all traffic to and from itself during AutoTest. This is called AutoTest Capture. -
Page 204: Filters Perform A Logical And Operation
OneTouch AT 10G User Manual You can create a wired packet capture filter to capture only packets that are going to and from a particular server or client. Filters Perform a Logical AND Operation When you set more than one filter, a logical AND operation is performed using the filters that you select. -
Page 205: Sd Card
SD cards may result in slower write performance and increased possibility of dropped packets. Connecting for Packet Capture The OneTouch AT 10G is capable of single-ended packet capture, where the analyzer captures the traffic it detects at its test port. When performing single-ended packet capture, the analyzer is typically connected to a span port, mirror port, or tap. -
Page 206: The Wired Capture Screen
OneTouch AT 10G User Manual The CAPTURE screen is displayed. Figure 76. The Wired CAPTURE Screen Tap Filter and set filter values. The following settings are available: MAC - When you enter the MAC address of a host, only packets that contain the host’s MAC address as the source or destina-... -
Page 207: Start Packet Capture
Chapter 9: Packet Capture Device or Network Start Packet Capture capture only HTTP traffic, specify port 80. NOT - Tap On to invert your filter selections. If you have select- ed multiple filters, the NOT function will give the inverse of the aggregated filter results. -
Page 208: Stop Packet Capture
OneTouch AT 10G User Manual You can use the keyboard to change the capture file name if desired. The .cap extension cannot be changed. Tap the DONE button. File capture begins. As a wired packet capture progresses, unicasts, broadcasts, multicasts, error frames, total captured frame count, and the number of dropped packets are shown for connected test port. -
Page 209: Autotest Capture
SD card data. AutoTest Capture The OneTouch AT 10G analyzer can capture traffic to and from the analyzer during AutoTest. The capture file can be examined to obtain detailed troubleshooting information. When AutoTest Capture is enabled, each time you run AutoTest the analyzer captures wired traffic to and from the analyzer. -
Page 210: Managing Capture Files
OneTouch AT 10G User Manual The CAPTURE FILENAME screen is displayed. By default, the capture file name format is pcap–<date><time>.pcap You can use the keyboard to change the capture file name if desired. The .pcap extension cannot be changed. -
Page 211: Chapter 10: Managing Files
Chapter 10: Managing Files The following types of files can be managed: Profiles Reports Screens Certificates Packet captures Profiles, Reports, and Screens can be managed using the built-in file manager. File management operations include loading, viewing, importing, exporting, renaming, or deleting files. -
Page 212: The Three File Manager Screens
OneTouch AT 10G User Manual Tap Profiles, Reports, or Screens, depending on the type of file you want to manage. The corresponding file manager screen appears. The figure below shows each of the four types of file manager screens. Figure 78. The Three File Manager Screens The following section describes buttons that are available on one or more of the file manager screens. -
Page 213: Save As Screen
Chapter 10: Managing Files Using the Built-in File Manager When you tap the SAVE button, the SAVE AS screen is displayed. Figure 79. SAVE AS Screen You can tap the DONE button to save the file with the suggested file name, or you can use the keyboard to change the name. VIEW The VIEW button is available in the REPORTS file manager and the SCREENS file manager. -
Page 214: Manage Profiles Screen
OneTouch AT 10G User Manual MANAGE Profiles, reports, and screens each have their own directory in analyzer’s internal memory. Tap the MANAGE button to manage files in the Profiles, Reports, or Screens directory. Then tap the file that you want to manage. -
Page 215: File Manager - Export File Tree
Chapter 10: Managing Files Using the Built-in File Manager EXPORT EXPORT lets you save a copy of the file to internal memory, an SD card, or a USB flash drive. Tap the EXPORT button to show the navigable file tree. Tap to go Tap to open up one level... -
Page 216: Remote User Interface And File Access
OneTouch AT 10G User Manual Note that the file will not appear in the file manager’s file list if it does not have the correct extension. Profiles must have the .profile extension, reports must have the .pdf extension, and ... -
Page 217: Browser Remote Access Login Credentials
Chapter 10: Managing Files Remote User Interface and File Access If required, enter the analyzer’s remote access user name and password. See “Configure Login Credentials for Remote Access” on page 194. Figure 82. Browser Remote Access Login Credentials... -
Page 218: Remote File Access
OneTouch AT 10G User Manual Navigate the user interface with your pointing device (mouse, touch screen, etc.) to select items. Figure 83. Remote Access OneTouch Home Screen Remote File Access You can remotely access files on the analyzer using an FTP, Link- Live, or a network drive mapped with WebDAV. - Page 219 Once connected, your FTP client will be able to browse the analyzer’s files. Remote File Access Using a Mapped Network Drive (WebDAV) The OneTouch AT 10G supports integration of its user file system into Windows Explorer as a network drive. The following instructions explain how to map to the analyzer's user file system from a Windows computer.
-
Page 220: Other Remote Access Information
Figure 85. Management Port Status dialog - Remote Control Disconnect A remote user’s IP address is shown on the same dialog box as the Disconnect button. Notes about Remote Controlling the OneTouch AT 10G Use the Up/Down arrows or the PgUp and PgDn keys to scroll ... -
Page 221: Sd Card
Chapter 10: Managing Files SD Card SD Card To manage files using an SD card, insert it into the analyzer. See “SD card slot” on page 25. The analyzer supports FAT and FAT32 file systems on external media. USB Flash Drive To manage files using a USB flash drive, connect it to the analyzer. - Page 222 OneTouch AT 10G User Manual...
-
Page 223: Chapter 11: Maintenance
The battery is the only user serviceable component. Do not open the case except to replace the battery. Use only replacement parts that are approved by NETSCOUT. Use only service centers that are approved by NETSCOUT. Clean the Analyzer... -
Page 224: Store The Analyzer
Turn off the analyzer. Disconnect the AC adapter. Replace the battery as shown in Figure 86. Use only NETSCOUT battery model 1T-BATTERY. Note If you remove the battery and do not connect the AC adapter, the clock keeps the current date and... -
Page 225: Remove And Install The Battery
Chapter 11: Maintenance Remove and Install the Battery GVO003.EPS Figure 86. Remove and Install the Battery... - Page 226 OneTouch AT 10G User Manual...
-
Page 227: Chapter 12: Link-Live Cloud Service
Chapter 12: Link-Live Cloud Service Overview The OneTouch AT 10G allows you to send test results to your Link-Live.com Cloud Service account, where those results can be viewed, organized, and managed from a web-enabled device. In addition to viewing and analyzing results, you may remotely... -
Page 228: Setting Up And Accessing The Cloud Service
OneTouch AT 10G User Manual File (FTP) 1G Wired Performance (RFC 2544) Video (RTSP) Email (SMTP) Setting Up and Accessing the Cloud Service The following steps will help you set up and get started using your Link-Live Cloud Service. -
Page 229: Setting Up Periodic Autotest
Chapter 12: Link-Live Cloud Service Setting Up and Accessing the Cloud Service In Link-Live.com, navigate to the Units page from the left sidebar. Click the Claim Unit button at the lower right of the page. Select your device (OneTouch), and follow the prompts on the Link-Live website. -
Page 230: Periodic Autotest Status Screen
OneTouch AT 10G User Manual to the Link-Live Cloud over a selected time duration. Comment - This entry will appear beneath the Periodic Auto- Test results in Link-Live Cloud Service. Use this feature to anno- tate your Periodic AutoTest session. - Page 231 Remaining Duration: The amount of time left in a specified Periodic AutoTest duration. Refers to the Duration time assigned on the OneTouch AT 10G in Tools > Link-Live Cloud Tools > Periodic AutoTest. Next Run: The amount of time until the next AutoTest run begins.
-
Page 232: Naming Your Onetouch At 10G
User Manual Naming your OneTouch AT 10G By default, the analyzer’s name is its serial number. We recommend that you rename your OneTouch AT 10G to a familiar or descriptive name. Note When you claim a OneTouch AT 10G unit to Link-Live Cloud Service, the name entered on Link-Live is reassigned to the OneTouch. - Page 233 Chapter 12: Link-Live Cloud Service Remote Access from the Cloud In the Cloud Tools section, touch the Cloud Remote button to open the CLOUD REMOTE screen. Enable remote access to the OneTouch by switching the toggle to On. A Cloud Remote icon will be shown on the unit at the top of the screen.
- Page 234 OneTouch AT 10G User Manual...
-
Page 235: Chapter 13: Specifications
Chapter 13: Specifications Environmental and Regulatory Specifications Operating temperature 32°F to 122°F (0°C to 50°C) Storage temperature -40°F to 160°F (-40°C to 71°C) Operating relative humidity 5% to 45% at 32°F to 122°F (0°C to 50°C) (% RH without condensation) 5% to 75% at 32°F to 104°F (0°C to 40°C)... -
Page 236: Cables
One SFP / SFP+ Fiber (Ethernet) that supports ports 1000Base-X (SFP) and 10GBase-SR/LR (SFP+) Not for connection The OneTouch AT 10G analyzer is NOT designed for to telephone net- connection to a telephone network. works The OneTouch AT 10G analyzer is NOT designed for connection to an ISDN line. -
Page 237: Sfp+ Adapters
Chapter 13: Specifications SFP+ Adapters The OneTouch AT 10G analyzer supports 1000Base-X (SFP) and 10GBase-SR/ LR (SFP+) Power AC adapter Input: 100-240 Vac, 50-60 Hz, 1.0 A Output: +15 Vdc, 2.0 A Battery type Lithium ion battery pack, 7.2 V Battery life Approximately 3-4 hours. -
Page 238: Memory
FAT and FAT32 file systems are supported. USB 2.0 port The OneTouch AT 10G analyzer has a USB 2.0 type A port, for use with USB mass storage devices, such as USB flash drives. FAT and FAT32 file systems are supported. -
Page 239: Korea Statements
Chapter 13: Specifications digital device pursuant to Part 15, Subpart J of the FCC rules, which are designed to provide reasonable protection against such interference when operated in a commercial environment. Operation of the equipment in a residential area is likely to cause interference, in which case the user, at his own expense, will be required to take whatever measures may be required to correct the interference. - Page 240 OneTouch AT 10G User Manual...
- Page 241 Index Symbols –B– backlight timeout, –1– battery, charge level, 10G Wired Performance Test (Y.1564), charging, charging temperature note, 1G Wired Performance Test (RFC compartment, 2544), extend battery life, extend operating time, –6– remove and replace, status, 802.1X, storage, beep, –A– best name, AC adapter, brightness,...
- Page 242 OneTouch AT 10G User Manual connect to a network, features, connection features, adding, copper, fiber, fiber, fiber cable, multimode, connectors, FiberInspector, control via management port, file management, file transfer test, controls, find switch port (flash port), copy a test, flash drive, flash port, –D–...
- Page 243 Index keyboards, network connectors, keys, network infrastructure tests, network ports, –L– network standards supported, number format, language, setting, –O– ACT and Link, link, OneTouch AT button, power/charge, OneTouch instrument icon, LEDs, options Link LED, adding features, link tab, OptiView XG, Link-Live Cloud Service, orange triangle, LinkRunner,...
- Page 244 OneTouch AT 10G User Manual rename, SMTP test, save, SNMP configuration, screen, software update, shortcut to, software version, sound, –R– specifications, speed and duplex, receive statistics, SSH client, reflector, static IP address, regulatory information, storing the analyzer, Remote Access strap, installing,...
- Page 245 Index test suite, web test, test tiers, webcam, text, entering, weight of the product, TFS, Wired Analysis, tiers, test, wired analysis, time and date, date and time, wired analysis tools, timeout periods, wired device details, tone, audio, wired IP address, tools, Wired Performance Test, tools, wired analysis,...
- Page 246 OneTouch AT 10G User Manual...
- Page 247 — Notes —...
- Page 248 OneTouch AT 10G User Manual — Notes — 99 Washington Street Melrose, MA 02176 Phone 781-665-1400 Toll Free 1-800-517-8431 Visit us at www.TestEquipmentDepot.com...
Need help?
Do you have a question about the OneTouch AT 10G and is the answer not in the manual?
Questions and answers